Demand Uncertainty, Cost Behavior, and the Asian Financial Crisis: Evidence from Korea


Department of Business Administration, Sookmyung Women’s University, Cheongpa-ro 47-gil 100, Yongsan-gu, Seoul 04310, Korea
Sustainability 2019, 11(8), 2238; https://doi.org/10.3390/su11082238
Submission received: 6 March 2019
/
Revised: 9 April 2019
/
Accepted: 11 April 2019
/
Published: 14 April 2019
(This article belongs to the Section Economic and Business Aspects of Sustainability)
Abstract
:The mix of fixed and variable costs in response to environmental changes is important for the sustainability of a firm. This study examines how demand uncertainty affects managers’ cost structure decisions. Using data on Korean firms from 1982 to 2015, my study provides evidence that cost rigidity increases in demand uncertainty. This finding implies that managers under higher uncertainty will increase the committed capacity to reduce congestion costs, resulting in a more rigid (less elastic) cost structure with higher fixed and lower variable costs in the short term. I also investigate the effect of the 1997 Asian financial crisis on cost rigidity. I predict that the massive structural changes entailed by the crisis, such as the deteriorated access to external funds, increase in the tendency of loss aversion, and expansion of outsourcing and temporary job positions, will reduce the magnitude of cost rigidity following greater demand uncertainty. Consistent with the prediction, the positive relation between demand uncertainty and cost rigidity becomes weaker in the period following the crisis, compared to the pre-crisis period.
1. Introduction
This study examines the effect of demand uncertainty on cost behavior using Korean firms’ data. Cost behavior is the change in a firm’s cost as the change in the firm’s activities. Understanding cost behavior is an essential element of cost and management accounting (Anderson et al. 2003) [1]. Demand uncertainty indicates manager’s ex ante uncertainty for demand, prior to observing actual demand. Demand uncertainty happens when a firm cannot estimate the exact consumer demand for its products. An inadequate response to the demand uncertainty can damage firm’s sustainability. Thus, cost structure decisions in response to environmental changes are important for the sustainability of a firm. Costs are classified into fixed and variable costs, depending on how the cost reflects changes in the production volume. When the proportion of fixed costs is high, a change in quantity induces a lower change in costs, which is referred to as higher cost rigidity, whereas relatively less fixed costs entail a less rigid short-run cost structure. This relative proportion of fixed and variable costs is set through a decision process that incorporates various aspects, with uncertainty as one of the main factors. An extensive line of literature has examined cost behavior, with the examples of Anderson et al. (2003) [1], Noreen and Soderstrom (1994, 1997) [2,3], Weiss (2010) [4], Chen et al. (2012) [5], Dierynck et al. (2012) [6], and Kama and Weiss (2013) [7], but not many studies have questioned the role of uncertainty in cost behavior.
The general opinion of the relation between uncertainty and the mix of fixed and variable costs is that firms with greater uncertainty will maintain relatively lower fixed and higher variable costs to remain sustainable. This is based on the reasoning that firms that face high uncertainty will prefer a less rigid (more elastic) cost structure, where the change in cost will be greater for a given change in the quantity of production, to secure flexibility for volatile business environments. Kallapur and Eldenburg (2005) [8] and Holzhacker et al. (2015) [9] provide results that support this argument. However, Banker et al. (2014b) [10] refutes the conventional perspective, by empirically and theoretically demonstrating that managers under higher uncertainty will increase the input in fixed costs to reduce congestion costs, resulting in a more rigid (less elastic) cost structure in the short term.
This study examines this ongoing debate by examining the influence of demand uncertainty on cost behavior for firms in Korea. With the decline of high economic growth, many firms in Korea have responded to this change by focusing the goals of corporate strategies on profitability, rather than expansion. This situation provides a setting with the opportunity to observe whether uncertainty will induce a rigid or an elastic cost structure, in the midst of changes in both the external market and firms’ internal strategies. Using nonfinancial firms listed on the Korea Exchange (KRX) from 1982 to 2015, I find that demand uncertainty is positively related to cost rigidity, contradicting the conventional belief of a negative association between the two.
Moreover, Korean firm data also provide a distinct opportunity to explore how the 1997 Asian financial crisis impacted the relation between demand uncertainty and cost behavior. The massive structural changes in the Korean market entailed by the financial crisis are likely to have influenced managers’ decisions regarding a firm’s mix of fixed and variable costs. Maintaining and increasing fixed costs requires financing funds, which were easily procurable in the pre-crisis period. However, with the restrictions on firms’ financing after the financial crisis, firms have faced more extensive requirements to procure funds, which have become a strong constraint in the decision to commit capacity. In addition, after the financial crisis, many Korean firms realigned their strategies from expansion to profitability, and thus have exhibited a stronger tendency towards loss aversion. The increase in loss aversion also discourages managers from committing capacity when facing higher demand uncertainty. In the post-crisis period, the increase in outsourcing and temporary job positions shifted considerable proportions of fixed costs to variable costs, restraining managers’ incentive to increase the fixed input in response to higher demand uncertainty. Thus, I predict that the deteriorated access to external funds, increase in the tendency of loss aversion, and expansion of outsourcing and temporary job positions in the post-crisis period reduced the magnitude of cost rigidity following greater demand uncertainty. To test this prediction, my paper splits the sample into subsamples of the pre-crisis period and that of the post-crisis period, and compared the coefficients of interest variables. I find that the positive association between demand uncertainty and cost rigidity has become weaker in the period following the Asian financial crisis, compared with the pre-crisis period, consistent with my prediction.
I conduct an additional analysis to confirm the robustness of my results. I use the number of employees as an alternative measure for selling, general and administrative (SG&A) costs in my model specification, and the test results show that my findings continue to hold with this alternative measure.
As in Banker et al. (2014b) [10], the results of this study contradict those of Holzhacker et al. (2015) [9], in which this inconsistency is attributed to the equity incentives of the manager. Greater cost rigidity can maximize profits in the realization of high demand, but when the demand realization is low, it can also incur extensive losses. Since the hospital managers in Holzhacker et al. (2015) [9] are compensated for financial performance measures rather than equity incentives, they are motivated to avoid extreme losses, and thus would prefer an elastic cost structure with lower fixed and higher variable cost when the uncertainty of demand increases. However, managers of the publicly traded corporation that receive stock options, would choose a cost structure with higher fixed and lower variable costs, because the reduction of congestion costs would maximize profits in the realization of high demand. According to Holzhacker et al. (2015) [9], this difference in the compensation structure would lead to the difference in the results.
The setting of my study is appropriate to examine this conjecture, because equity based compensation only began to be provided after 1997. Tests on the second hypothesis show that the positive association between demand uncertainty and cost rigidity becomes weaker in the period after 1997, since which managers have received stock options, compared with the period prior to 1997, when firms did not compensate managers with stock options. This result provides evidence contradicting the argument raised in Holzhacker et al. (2015) [9], suggesting that equity based compensation does not explain the differences in the results. Thus, my findings imply that the context in which managers make decisions on the cost structure needs to be explored for a better understanding of the relation between demand uncertainty and cost behavior.
This study contributes to the literature from the following aspects. First, by examining the Korean market, which is characterized by drastic changes in economic growth and corporate strategies, my study expands the research on the role of uncertainty in cost behavior. I provide evidence that contrary to common intuition, firms that face higher demand uncertainty construct a more rigid cost structure with the purpose of reducing congestion costs even in the dynamic business environment. Second, although extensive research has been conducted on the Asian financial crisis of 1997 (for example, Johnson et al. 2000 [11]; Lemmon and Lins 2003 [12]; Mitton and Todd 2002 [13]; Fan and Wong 2002 [14]), there has been little research that explores the relation between demand uncertainty and cost behavior in this particular period. This paper adds to a stream of the literature by documenting evidence that the drastic changes before and after the 1997 Asian financial crisis impact the association between demand uncertainty and cost rigidity. Finally, while prior studies on uncertainty for Korean firms have largely examined how firms adapt their corporate policies in response to uncertainty, (for example, Choi and Lee 2001 [15]; Kim 2005 [16]; Lee 2005 [17]), little empirical work sheds light on the effect of uncertainty on managers’ cost structure decisions. This study is the first to examine the link between demand uncertainty and cost behavior for Korean firms.
2. Hypothesis Development
2.1. Demand Uncertainty and Cost Rigidity
Managers determine the level of fixed and variable costs based on various internal and external factors that the firm is subject to, and the general consensus is that managers of firms with greater demand uncertainty opt for fixed costs at a lower level, and maintain more variable costs [18]. This is because firms with higher uncertainty in demand are likely to have a more elastic (less rigid) cost structure, to maintain more flexibility and effectively address volatile environments for sustainability. Consistent with this perspective, Kallapur and Eldenburg (2005) [8] provide empirical evidence from Washington state hospitals that managers increase the ratio of variable costs to total costs, i.e., decrease cost rigidity, in response to higher profit uncertainty. Using data from hospitals in California, Holzhacker et al. (2015) [9] also find that firms in the face of higher demand uncertainty increase cost elasticity through outsourcing, leasing equipment, and increasing contract labor.
Despite the pervasiveness of this traditional perspective, Banker et al. (2014b) [10] provide evidence that supports the contrary. By distinguishing downside risk and demand uncertainty, they argue that the traditional view is based on an inaccurate interpretation of demand uncertainty. They show that the conventional view “may be warranted as a response to an increase in downside risk”, rather than an increase in demand uncertainty. They explain that higher downside risk “not only increases the variance of demand, but also reduces the mean of demand”. In contrast, demand uncertainty is specified to affect only the variance of demand, not the mean. In other words, higher demand uncertainty increases both abnormally high and low realizations of demand, whereas in higher downside risk, only unfavorable demand realizations become more likely. Thus, firms that face higher downside risk are likely to choose a mix of lower fixed and higher variable costs, because the expected congestion costs decrease at low demand realizations. However, in the case of demand uncertainty, the expected congestion cost at high demand realizations is severe. Therefore, increased demand uncertainty induces firms to maintain higher committed capacity, which results in a “more rigid cost structure”, with higher fixed and lower variable costs. Using data from Compustat and the NBER-CES Industry Database, Banker et al. (2014b) [10] provide evidence that higher demand uncertainty is associated with a more rigid short-run cost structure.
One of the reasons for the mixed empirical results on the association between uncertainty and cost behavior is the difference in the characteristics of the data examined in each study. Kallapur and Eldenburg (2005) [8] and Holzhacker et al. (2015) [9] use data from nonprofit and private for-profit hospitals, whereas the results for Banker et al. (2014b) [10] are based on the setting of publicly traded firms. This study analyzes how demand uncertainty impacts the cost structure in firms listed on the Korea Exchange (KRX). Korean firms have experienced periods of both high and low economic growth. For example, Korean annual Gross Domestic Product (GDP) growth rate averaged more than 9% from 1982 until 1996, reaching a record high of 13.20% in 1983, and a record low of 6.2% in 1992. Since the 1997 Asian financial crisis, Korea has shown clear signs of slowing down, reporting an average annual growth rate of less than 5%. In addition, with the Asian financial crisis, managers began to focus on shareholder value and corporate monitoring systems, and these induced a significant shift in corporate strategies from expansion to profitability. This feature of Korean firms provides an ideal context to test the influence of demand uncertainty on cost behavior in various economic situations and firm strategies.
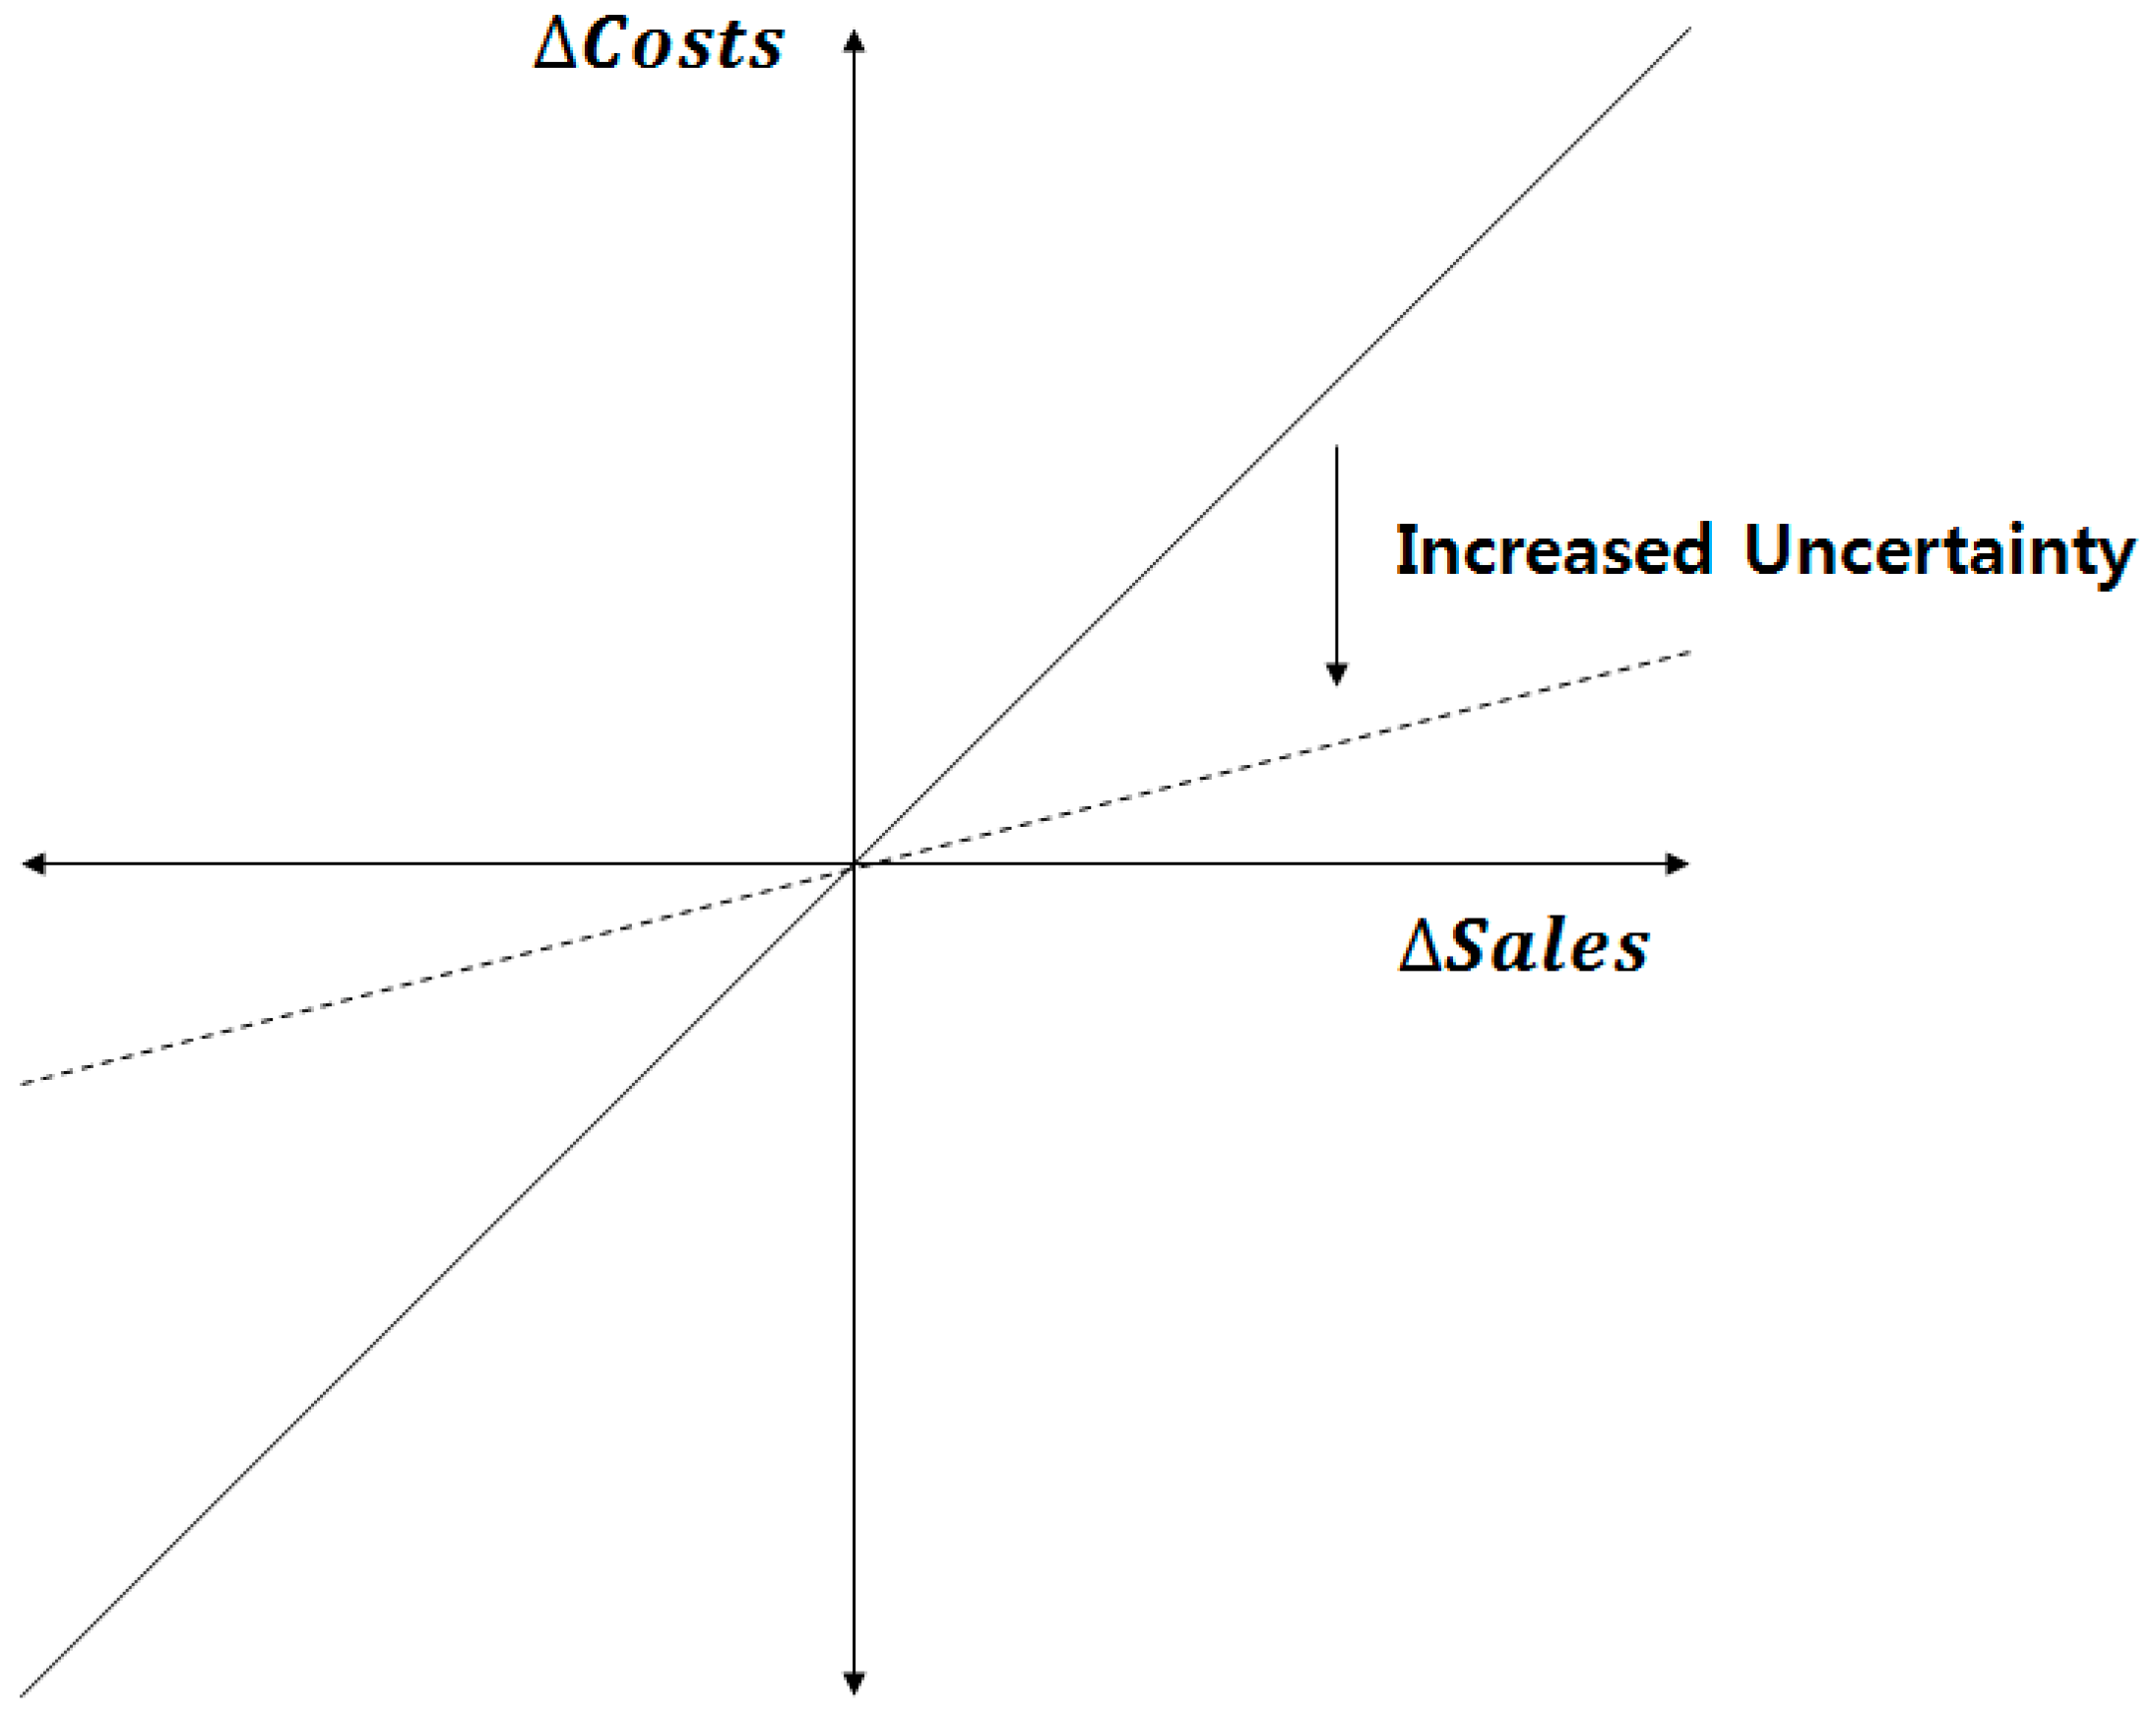
Because my paper uses a publicly traded setting similar to Banker et al. (2014b) [10], I predict that the relation between demand uncertainty and cost rigidity will be as depicted in Figure 1. Hence, the first hypothesis is as follows:
Hypothesis 1 (H1).
The degree of cost rigidity is positively associated with demand uncertainty.
2.2. The Impact of the Asian Financial Crisis on the Association between Demand Uncertainty and Cost Rigidity
The second objective of this study is to explore the impact of the 1997 Asian financial crisis on the relation between demand uncertainty and cost rigidity. Following the financial crisis, Korean firms faced a set of changes, such as difficulties in external financing, increase in the tendency of loss aversion, and expansion of outsourcing and temporary labor. I expect these changes to have mitigated the positive association between demand uncertainty and cost rigidity for the following reasons. Figure 2 depicts the summary of structural changes in the Korean market during the Asian financial crisis.
First, Korean firms typically have strong ties to banks, and thus they prioritized expansion through a great reliance on bank financing [19]. Financial institutions would extend financing to firms, without a thorough assessment of repayment capabilities or project feasibility. In addition, continuous monitoring of firms after the financing was not in place at the time [20]. Further, although firms with a higher debt ratio were likely to become insolvent, financial institutions would provide an amount of external financing to such firms, and also the governmental sector supported such insolvent firms under considerations of the impact of bankruptcy on the overall economy [20]. In such conditions where external financing was highly accessible, firms prior to the Asian financial crisis were able to allocate a large proportion of capital to investments [21]. Firms that face higher demand uncertainty tend to increase their capacity commitments for decreasing congestion costs [10]. Since Korean firms prior to the Asian financial crisis were able to use external financing with low costs and requirements, the expenses of maintaining and expanding fixed activity resources were relatively low. Therefore, firms in the face of higher demand uncertainty were incentivized to commit capacity to proactively reduce congestion costs with the purpose of maximizing their profits. However, the conditions of capital procurement changed drastically in the post-crisis period. With the reform of business structures in the financial industry and the revision of various related regulations, the assessment processes for external financing and monitoring systems after the financing were significantly strengthened, and government intervention in the capital procurement, which had been justified in the pre-crisis period, was substantially limited [20]. These factors induced a higher barrier to external financing for firms. Moreover, most of the external financing in the period following the financial crisis was usually used to reduce debt ratios, rather than to increase investments [21]. These changes in the capital procurement conditions may be higher hurdles for managers to increase the committed capacity when facing higher demand uncertainty.
Second, after the financial crisis, the loss aversion tendency of firms changed significantly as well. During the pre-crisis period, when annual economic growth was high in Korea, firms preferred to expand the level of sales, rather than increase profitability, and weighed gains more heavily than losses. In contrast, with the financial crisis, regulations that enhanced the transparency of accounting information, improved the capital structure of firms, and increased the accountability of controlling shareholders and management were made by the Korean government. Thus, for sustainability, firms began to pursue management strategies that focused more on profitability than on expansion, and were more likely to avoid losses. Although a high level of committed capacity induces more profits in the realization of high demand, they also increase the possibility and magnitude of losses. Therefore, the increase in the loss aversion after the financial crisis discourages managers when facing higher demand uncertainty from increasing fixed input, resulting in a lower degree of cost rigidity.
Third and finally, following the Asian financial crisis, the Korean government required firms to improve corporate capital structures in a short period of time, including the reduction of the debt ratio, and firms were forced to use all means available [22]. Through this government-led restructuring, firms frequently had to outsource various functions of the firm, and the form of outsourcing changed from the externalization of unit tasks, to the transfer of comprehensive work processes [23]. In addition, with the purpose of increasing labor flexibility, many permanent workers were replaced by temporary workers [24]. Such managerial actions variabilized firms’ cost structure and decreased the proportion of fixed costs that firms would have otherwise maintained at high levels with the purpose of reducing congestions costs in response to increases in demand uncertainty.
The substantial change in the capital procurement conditions, the increase of loss aversion, and the expansion of outsourcing and temporary job positions, which were all directly and indirectly caused by the Asian financial crisis, lead me to expect that managers facing higher demand uncertainty would be discouraged from committing capacity. Therefore, I posit the second hypothesis as follows:
Hypothesis 2 (H2).
The positive association between demand uncertainty and cost rigidity becomes weaker in the period following the Asian financial crisis, in comparison to the pre-crisis period.
3. Methods
3.1. Sample
I use data for nonfinancial firms listed on the Korea Exchange (KRX) from 1982 to 2015. I focus on SG&A costs and the number of employees. The reason why I focus on the SG&A costs among other cost items is that SG&A costs not only consist of both fixed and variable costs, but also account for a greater share of operating costs than any other costs. I extract the data from DataGuide. DataGuide is provided by FnGuide Inc., and is one of the largest database program in Korea. I drop observations if the sales revenue or SG&A costs for the current year and the previous year are missing, equal to zero, or negative. My study also discards observations if SG&A costs exceed sales revenue for the current or previous year. To construct the firm level demand uncertainty measures, I require firms to have at least 10 valid observations during the sample period. Finally, in order to alleviate the effect of outliers, I trim observations that fall within the top and bottom 1% of observations with extreme values for the regression variables. I have a final sample that consists of 14,357 firm-year observations in regression for the SG&A costs.
To address my second research question, I construct two subsamples: A pre-financial crisis sample, and a post-financial crisis sample. The pre-financial crisis sample covers the period of 1982 to 1996, while the post-financial crisis sample covers the period of 1999 and 2015. I exclude sample periods of 1997 and 1998 to alleviate concerns over potential problems arising from the existence of extreme outliers during the financial crisis.
3.2. Empirical Model
Building on prior work on the SG&A cost asymmetry phenomenon, I test whether the degree of cost rigidity is positively associated with demand uncertainty. Specifically, I estimate the following model:
where for firm i and year t, SG&A denotes selling, general, and administrative costs, and Sales are sales revenue, respectively. The SG&A costs and sales revenue are deflated by the consumer price index (CPI). Demand uncertainty indicates a manager’s ex ante uncertainty for the future demand, prior to observing actual demand. However, the manager’s ex ante uncertainty for demand cannot be directly measured. So, following the literature, I use the standard deviation of log-changes in sales as an alternative measure of demand uncertainty. So, Demand_Uncertainty for firm i is calculated as the standard deviation of log-change in sales revenue for firm i during the sample period. Control is a set of control variables.
Equation (1) is the conventional cost behavior model, where costs react to change in sales revenue. With log transformation, βi,t measures the percent change in SG&A costs for a 1% change in sales revenue. Accordingly, βi,t characterizes cost rigidity. The greater the βi,t, the smaller the cost rigidity with higher variable and lower fixed cost. Conversely, smaller βi,t indicates greater cost rigidity.
H1 predicts that the degree of cost rigidity is positively associated with demand uncertainty. I test this prediction by examining whether the coefficient of Demand_Uncertainty in Equation (2) is negative (i.e., H1: β2 < 0). That is, if β2 is negative, this means that the greater the uncertainty, the less costs change in response to change in sales (i.e., greater cost rigidity).
H2 predicts that the relation between demand uncertainty and cost rigidity becomes weaker in the pre-crisis period, compared with the post-crisis period. Thus, I partition the sample into subsamples of the pre-crisis period, and of the post-crisis period; and then examine whether β2 is less pronounced in the post-crisis period subsample than that of the pre-crisis period. To support H2, β2 should be negative and have a smaller absolute value in the subsample of the post-crisis period than that of the pre-crisis period.
I also introduce controls that could affect the cost adjustment decision. As suggested in Anderson, Banker, and Janakiraman (2003) and others, managers may consider the economic climate as the future prospects, and reflect this in adjusting resources. I thus include GDP growth (GDP_Growth) as a control variable. I also add industry indicators to both Equations (1) and (2).
4. Empirical Results
4.1. Descriptive Statistics
Panel A of Table 1 provides descriptive information of the full sample. The mean value of sales revenue and the SG&A costs are $11.03 million (median = $1.90 million) and $1.35 million (median = $0.19 million), respectively. The ratio of SG&A costs to sales revenue is 14.35% (median = 9.76%) on average. The average demand uncertainty is 0.17 (median = 0.16), and the mean GDP growth rate is 5.87 (median = 5.90).
Panel B of Table 1 compares the descriptive statistics of the pre-crisis period and the post-crisis period. On average, firms generate more sales in the post-crisis period ($13.69 million) than in the pre-crisis period ($8.07 million). They also spend more SG&A costs in the post-crisis period ($1.90 million) than in the pre-crisis period ($0.63 million) on average. The mean of the SG&A costs to sales ratio is higher in the post-crisis period (15.76%) than in the pre-crisis period (12.34%). On average, firms face greater uncertainty in the post-crisis period (0.17) than in the pre-crisis period (0.13). The average GDP growth rate plummets from an average of 9.35% before to 4.45% following the crisis.
4.2. Results of Testing Hypotheses
Table 2 provides the results of examining the relation between demand uncertainty and cost rigidity. First, I estimate the average cost rigidity without demand uncertainty in which Demand_Uncertainty is set to 0 in Equation (2). The bottom of Column (1), (3), and (5) shows the linear combination of β1 and ∑γkControlk,i,t, which specifies the average degree of cost rigidity. In all specification, it ranges from 0.385 to 0.719, consistent with the prior literature [10] reporting that costs respond to change in sales, but are smaller in amounts ranging from 0 to 1.
Column (2) shows the results of testing the H1, predicting that the degree of cost rigidity increases with demand uncertainty. The coefficient on Demand_Uncertainty (i.e., β2) is significantly negative at the 1% level (coefficient = −1.024, t-value = −4.92). Given that a negative coefficient on Demand_Uncertainty reduces the slope of βi,t in Equation (2), the result provides evidence consistent with my prediction that the degree of cost rigidity increases with demand uncertainty.
As a sensitivity analysis, I redefine Demand_Uncertainty as the standard deviation of log-change in sales revenue of firm i over the previous five years, rather than all valid observations of firm i. As shown in Column (4), the coefficient on Demand_Uncertainty (i.e., β2) is −0.529 (t-value = −6.51), suggesting that this alternative measure yields the same qualitative results for β2.
Because the sample data used in this study is likely to be correlated across years within each firm, to address this problem, Column (1) to (4) provides the coefficient estimates based on standard errors clustered by firm [25]. I further test my hypothesis using the Fama and MacBeth (1973) [26] two-step procedure, yielding similar results as reported in Column (6) (β2 = −1.026, t-value = −5.76).
In sum, Table 2 provides evidence that the increase in demand uncertainty induces managers to have a more rigid cost structure with higher fixed and lower variable costs, supporting my hypothesis.
Table 3 reports the results for my tests of H2. H2 predicts that the positive relation between demand uncertainty and cost rigidity becomes less pronounced in the post-crisis period, compared with that in the pre-crisis period. I divide the sample based on the Asian financial crisis period, and compare the estimates of β2 for each subsample. To support my prediction, the coefficient, β2, should be negative and smaller in absolute value in the subsample of the post-crisis period than that of the pre-crisis period. I find evidence that the positive relation between demand uncertainty and cost rigidity is weaker in the post-crisis period. That is, as shown in column (2) and (4), β2 is negatively significant at the 1% level in both subsamples, but the absolute value is greater in the pre-crisis period subsample, consistent with my prediction. These results suggest that managers facing higher demand uncertainty are discouraged from increasing the committed capacity in the post-crisis period, compared with in the pre-crisis period. As presented in the bottom of Column (1) and (4) in Table 3, the value of the linear combination of β1 and ∑γk Controlk,i,,t ranges from 0.393 to 0.649, also consistent with my expectation that the average change of SG&A costs in response to a 1% change in sales is between 0 and 1.
4.3. Additional Tests
In the main analysis, my paper focuses on the SG&A costs. The SG&A costs reflect managerial decisions on discretionary expenses, and have been extensively examined in the cost behavior research. Meanwhile, the employment adjustment has also received much attention [6,27,28]. Therefore, I test H1 and 2 using the model where the cost is set to the number of employees (Employeei.t). The results are presented in Table 4. Column (1) and (2) show the results for the full sample test, and Column (3) through to (6) present the results for the subsample tests based on the pre- and post-crisis period.
First, in Column (2), β2 is significantly negative at the 1% level (coefficient = −0.397, t-value = −2.74), providing consistent support for H1. Next, Column (4) and (6) show that β2 is significantly negative both in the pre- and post-crisis period sample, but the absolute value is greater in the pre-crisis period, consistent with H2. Taken together, Table 4 shows that my results are robust for alternative measure of costs.
5. Discussion and Conclusions
Research on how demand uncertainty impacts the cost structure is an emerging topic in the cost behavior literature. This study builds upon this line of literature, and examines the relation between demand uncertainty and the mix of fixed and variable costs using the dataset of the listed firms in the Korean stock market, which have been subject to dynamic changes in the business environment. The evidence supports my prediction that the increase in demand uncertainty induces firms to have a more rigid short run cost structure, with higher fixed and lower variable costs. In addition, my study also examines how the 1997 Asian financial crisis influenced the association between demand uncertainty and cost rigidity. The results show that although the positive association between demand uncertainty and cost rigidity remains unchanged, the association becomes weaker in the subsample of the post-crisis period compared with that of the pre-crisis period, which may be attributed to the increased difficulty of external financing, the prevalence of loss aversion, and the expansion of outsourcing and temporary job positions. The test results are unchanged when using the number of employees, instead of the SG&A costs, in my empirical model specification.
Holzhacker et al. (2015) [9] found from the data of hospitals that the increase in demand uncertainty is associated with a less rigid (more elastic) cost structure, which is in contrast to the results of this study. They conjecture that equity incentives are the factor underlying this difference. Although committing capacity in response to higher demand uncertainty can maximize profits in the realization of high demand by reducing the costs of congestion, low demand realizations can also lead to massive losses. Therefore, managers who are compensated based on financial performance, but who do not hold any equity incentives, such as the hospital managers in Holzhacker et al. (2015) [9], would prefer to avoid the extreme losses that can occur in low demand realizations. Thus, when demand uncertainty increases, they are more likely to opt for a less rigid (more elastic) cost structure. The second test ofmy study provides evidence that counters the conjecture of Holzhacker et al. (2015) [9]. Stock options were first provided to managers of Korean firms in 1997, and the sample period of this study spans across the years surrounding this change in compensation. In the period prior to 1997, when equity compensation was not provided to managers, demand uncertainty is positively associated with cost rigidity. However, in the period following 1997, in which firms began to compensate managers with stock options, the positive relation between demand uncertainty and cost rigidity weakens. This result contradicts what would be expected by the argument of Holzhacker et al. (2015) [9], implying that the difference in the compensation scheme does not drive the differences in the results. Therefore, the findings of my study suggest that the influence of uncertainty on the managerial decision on the cost structure of the firm differs by context. Future research in this line of literature could systematically examine such contexts in which managers make cost structure choices in response to demand uncertainty. In addition, the findings of this study might generate further investigation on which activity resources play a major role in cost structure decisions by managers facing demand uncertainty.
Author Contributions
D.-H.K. contributed to the conceptual design and formal analysis of the study, drafted the article and gave final approval.
Funding
This research received no external funding.
Acknowledgments
I thank the editors and the anonymous referees for their support and work. I am also immensely grateful to Jinha Park, Woong Ryu, Tae-Sik Ahn for their comments that greatly improved the manuscript.
Conflicts of Interest
The authors declare no conflict of interest.
References
- Anderson, M.C.; Banker, R.D.; Janakiraman, S.N. Are selling, general, and administrative costs “sticky”? J. Account. Res. 2003, 41, 47–63. [Google Scholar] [CrossRef]
- Noreen, E.; Soderstrom, N. Are overhead costs strictly proportional to activity?: Evidence from hospital departments. J. Account. Econ. 1994, 17, 255–278. [Google Scholar] [CrossRef]
- Noreen, E.; Soderstrom, N. The accuracy of proportional cost models: Evidence from hospital service departments. Rev. Account. Stud. 1997, 2, 89–114. [Google Scholar] [CrossRef]
- Weiss, D. Cost behavior and analysts’ earnings forecasts. Account. Rev. 2010, 85, 1441–1471. [Google Scholar] [CrossRef]
- Chen, C.X.; Lu, H.; Sougiannis, T. The agency problem, corporate governance, and the asymmetrical behavior of selling, general, and administrative costs. Contemp. Account. Res. 2012, 29, 252–282. [Google Scholar] [CrossRef]
- Dierynck, B.; Landsman, W.R.; Renders, A. Do managerial incentives drive cost behavior? Evidence about the role of the zero earnings benchmark for labor cost behavior in private Belgian firms. Account. Rev. 2012, 87, 1219–1246. [Google Scholar] [CrossRef]
- Kama, I.; Weiss, D. Do earnings targets and managerial incentives affect sticky costs? J. Account. Res. 2013, 51, 201–224. [Google Scholar] [CrossRef]
- Kallapur, S.; Eldenburg, L. Uncertainty, real options, and cost behavior: Evidence from Washington State Hospitals. J. Account. Res. 2005, 43, 735–752. [Google Scholar] [CrossRef]
- Holzhacker, M.; Krishnan, R.; Mahlendorf, M.D. Unraveling the black box of cost behavior: An empirical investigation of risk drivers, managerial resource procurement, and cost elasticity. Account. Rev. 2015, 90, 2305–2335. [Google Scholar] [CrossRef]
- Banker, R.D.; Byzalov, D.; Plehn-Dujowich, J.M. Demand uncertainty and cost behavior. Account. Rev. 2014, 89, 839–865. [Google Scholar] [CrossRef]
- Johnson, S.; Boone, P.; Breach, A.; Friedman, E. Corporate governance in the Asian financial crisis. J. Financ. Econ. 2000, 58, 141–186. [Google Scholar] [CrossRef] [Green Version]
- Lemmon, M.L.; Lins, K.V. Ownership structure, corporate governance, and firm value: Evidence from the East Asian financial crisis. J. Financ. 2003, 58, 1445–1468. [Google Scholar] [CrossRef]
- Mitton, T. A cross-firm analysis of the impact of corporate governance on the East Asian financial crisis. J. Financ. Econ. 2002, 64, 215–241. [Google Scholar] [CrossRef] [Green Version]
- Fan, J.P.; Wong, T.J. Corporate ownership structure and the informativeness of accounting earnings in East Asia. J. Account. Econ. 2002, 33, 401–425. [Google Scholar] [CrossRef] [Green Version]
- Choi, D.S.; Lee, J.W. The impact of uncertainty on growth opportunity and investment. Asian Rev. Financ. Res. 2001, 14, 23–57. [Google Scholar]
- Kim, B.K. The effects of uncertainty on investments. Korea Prod. Rev. 2005, 19, 147–172. [Google Scholar]
- Lee, H.Y. The impacts of uncertainty on investment: Empirical evidence from manufacturing firms in Korea. Korea Dev. Rev. 2005, 27, 91–121. [Google Scholar]
- Balakrishnan, R.; Sivaramakrishnan, K.; Sprinkle, G. Managerial Accounting; John Wiley & Sons: Hoboken, NJ, USA, 2008. [Google Scholar]
- Baek, J.S.; Kang, J.K.; Park, K.S. Corporate governance and firm value: Evidence from the Korean financial crisis. J. Financ. Econ. 2004, 71, 265–313. [Google Scholar] [CrossRef]
- Hahm, J.H. The post-crisis transformation of Korea’s financial system. Korean Econ. Rev. 2007, 55, 401–445. [Google Scholar]
- Park, S.S.; Lee, D.H. Recent changes in the announcement effect of seasoned equity offering in Korea. In Proceedings of the Korean Securities Association, Seoul, Korea, 4 December 2010. [Google Scholar]
- Kim, J.H.; Ko, Y.S. An empirical study on the earnings management and debt-equity ratio reduction after the crisis of foreign currency. Korea Account. J. 2006, 15, 119–144. [Google Scholar]
- Ha, G.; Yoon, S.; Choi, S. Critical factors for outsourcing partner selection of manufacturing firms: An AHP based analysis. Korea Bus. Educ. Res. 2011, 26, 489–515. [Google Scholar]
- Cho, J.; Keum, J. Dualism in job stability of the Korean labour market: The impact of the 1997 financial crisis. Pac. Econ. Rev. 2009, 14, 155–175. [Google Scholar] [CrossRef]
- Petersen, M.A. Estimating standard errors in finance panel data sets: Comparing approaches. Rev. Financ. Stud. 2009, 22, 435–480. [Google Scholar] [CrossRef]
- Fama, E.F.; MacBeth, J.D. Risk, return, and equilibrium: Empirical tests. J. Political Econ. 1973, 81, 607–636. [Google Scholar] [CrossRef]
- Calleja, K.; Steliaros, M.; Thomas, D.C. A note on cost stickiness: Some international comparisons. Manag. Account. Res. 2006, 17, 127–140. [Google Scholar] [CrossRef]
- Banker, R.D.; Byzalov, D.; Chen, L.T. Employment protection legislation, adjustment costs and cross-country differences in cost behavior. J. Account. Econ. 2013, 55, 111–127. [Google Scholar] [CrossRef]
Figure 1.
Demand uncertainty and cost rigidity.

Figure 2.
Structural changes in the Korean market entailed by the Asian financial crisis.


Table 1.
Descriptive statistics.
| Panel A | ||||||
| Variables | N | Mean | Std | Median | p25 | p75 |
| Sales Revenue ($ mil.) | 14,357 | 11.03 | 42.09 | 1.90 | 0.82 | 5.56 |
| SG&A Costs ($ mil.) | 14,357 | 1.35 | 7.70 | 0.19 | 0.08 | 0.61 |
| SG&A/Sales (%) | 14,357 | 14.35 | 14.04 | 9.76 | 6.06 | 16.43 |
| Demand_Uncertainty | 14,357 | 0.17 | 0.06 | 0.16 | 0.12 | 0.21 |
| GDP_Growth (%) | 14,357 | 5.87 | 3.58 | 5.90 | 3.30 | 8.90 |
| Panel B | ||||||
| Pre-Crisis Period | Post-Crisis Period | |||||
| Variables | N | Mean | Median | N | Mean | Median |
| Sales Revenue ($ mil.) | 3677 | 8.07 | 1.76 | 8383 | 13.69 | 2.21 |
| SG&A Costs ($ mil.) | 3677 | 0.63 | 0.20 | 8383 | 1.90 | 0.24 |
| SG&A/Sales (%) | 3677 | 12.34 | 9.48 | 8383 | 15.76 | 10.10 |
| Demand_Uncertainty | 3677 | 0.13 | 0.12 | 8383 | 0.17 | 0.15 |
| GDP_Growth (%) | 3677 | 9.35 | 9.60 | 8383 | 4.45 | 3.90 |
Notes: Demand_Uncertainty is calculated as the standard deviation of log-change in sales revenue for firm i during the sample period.
Table 2.
Demand uncertainty and cost behavior: Full sample.
| Full Sample | ||||||
|---|---|---|---|---|---|---|
| Dependent Var: log(SG&Ai,t/SG&Ai,t−1) | (1) | (2) | (3) | (4) | (5) | (6) |
| Clustering | Clustering | Clustering | Clustering | Fama and MacBeth | Fama and MacBeth | |
| Constant | 0.005 (0.32) | 0.006 (0.44) | −0.016 (−1.30) | −0.012 (−0.97) | 0.057 *** (2.82) | 0.057 *** (2.82) |
| β1: log(Salesi,t/Salesi,t−1) | 0.579 *** (23.05) | 0.751 *** (17.73) | 0.596 *** (13.10) | 0.683 *** (17.01) | 0.494 *** (3.95) | 0.663 *** (5.45) |
| β2: Demand_Uncertainty * log(Salesi,t/Salesi,t−1) | −1.024 *** (−4.92) | −0.529 *** (−6.51) | −1.026 *** (−5.76) | |||
| ∑γk Controls | ||||||
| GDP_Growth * log(Salesi,t/Salesi,t−1) | 0.005 * (1.96) | 0.005 * (1.83) | −0.001 (−0.37) | −0.001 (−0.29) | ||
| Industry dummies * log(Salesi,t/Salesi,t−1) | included | included | included | included | included | included |
| ∑γj Controls | ||||||
| GDP_Growth | 0.006 *** (13.70) | 0.006 *** | 0.007 *** | 0.006 *** | ||
| (13.26) | (11.44) | (10.70) | ||||
| Industry dummies | included | included | included | included | included | included |
| Observations | 14,357 | 14,357 | 10,647 | 10,647 | 14,357 | 14,357 |
| Adjusted R2 | 0.23 | 0.24 | 0.22 | 0.24 | 0.27 | 0.28 |
| Linear combination of β1 and ∑γk Control | 0.470 *** (26.30) | 0.677 *** (15.37) | 0.385 *** (14.57) | 0.528 *** (15.22) | 0.525 *** (7.48) | 0.719 *** (10.03) |
Notes: Demand_Uncertainty is calculated as the standard deviation of log-change in sales revenue for firm i during the sample period. The coefficient estimates of Column (1) through to (4) are based on robust standard errors clustered by firm, and Column (5) and Column (6) are estimated with the Fama-MacBeth procedure. The robust t-statistics are in parentheses. *, **, *** denote significance at the 10%, 5%, and 1% level, respectively (two-tailed test).
Table 3.
Demand uncertainty and cost behavior: Pre- and post-financial crisis.
| Pre-Crisis | Post-Crisis | |||
|---|---|---|---|---|
| Dependent Var: log(SG&Ai,t/SG&Ai,t−1) | (1) | (2) | (3) | (4) |
| Constant | 0.029 * (1.71) | 0.034 ** (2.02) | 0.027 (1.47) | 0.028 (1.51) |
| β1: log(Salesi,t/Salesi,t−1) | 0.707 *** (8.23) | 0.988 *** (9.39) | 0.493 *** (12.25) | 0.674 *** (13.77) |
| β2: Demand_Uncertainty * log(Salesi,t/Salesi,t−1) | −1.637 *** (−4.86) | −0.894 *** (−5.03) | ||
| ∑γk Control | ||||
| γ1: GDP_Growth * log(Salesi,t/Salesi,t−1) | 0.003 (0.35) | 0.005 (0.61) | 0.012 ** (2.17) | 0.011 ** (1.97) |
| γ2: Industry dummies * log(Salesi,t/Salesi,t−1) | included | included | included | included |
| ∑γj Control | ||||
| GDP_Growth | 0.001 (1.38) | 0.001 (0.80) | 0.002 ** (2.43) | 0.002 ** (2.25) |
| Industry dummies | included | included | included | included |
| Observations | 3677 | 3677 | 8383 | 8383 |
| Adjusted R2 | 0.24 | 0.25 | 0.19 | 0.20 |
| Linear combination of β1 and ∑γkControl | 0.393 *** (14.68) | 0.649 *** (11.72) | 0.427 *** (24.26) | 0.624 *** (15.60) |
| Sig. of difference: Column (2) and (4) | Coef. | z | P > |z| | |
| [Pre_mean]β2 - [Post_mean]β2 = 0 | −0.743** | −2.19 | 0.028 | |
Notes: Demand_Uncertainty is calculated as the standard deviation of log-change in sales revenue for firm i during the sample period. All specifications are estimated with robust standard errors clustered by firm. The robust t-statistics are in parentheses. *, **, *** denote significance at the 10%, 5%, and 1% level, respectively (two-tailed test).
Table 4.
Demand uncertainty and cost behavior: Number of employees.
| Full Sample | Pre-Crisis | Post-Crisis | ||||
|---|---|---|---|---|---|---|
| Dependent Var: log(SG&Ai,t/SG&Ai,t−1) | (1) | (2) | (3) | (4) | (5) | (6) |
| Constant | −0.039 *** (−8.31) | −0.039 *** (−8.21) | −0.089 *** (−7.36) | −0.086 *** (−7.13) | −0.010 (−0.73) | −0.009 (−0.72) |
| β1: log(Salesi,t/Salesi,t−1) | 0.213 *** (2.92) | 0.276 *** (3.58) | 0.388 *** (4.35) | 0.538 *** (4.73) | 0.116 ** (2.17) | 0.184 *** (2.67) |
| β2: Demand_Uncertainty * log(Salesi,t/Salesi,t−1) | −0.397 *** (−2.74) | −1.230 *** (−2.77) | −0.295 * (−1.81) | |||
| ∑γk Control | ||||||
| γ1: GDP_Growth * log(Salesi,t/Salesi,t−1) | 0.002 (0.65) | 0.001 (0.42) | 0.032 *** (3.15) | 0.033 *** (3.24) | 0.006 (1.35) | 0.005 (1.23) |
| γ2: Industry dummies * log(Salesi,t/Salesi,t−1) | included | included | included | included | included | included |
| ∑γj Control | ||||||
| GDP_Growth | 0.002 *** (6.58) | 0.002 *** (6.28) | 0.002 * (1.66) | 0.002 (1.45) | −0.003 *** (−4.44) | −0.003 *** (−4.64) |
| Industry dummies | included | included | included | included | included | included |
| Observations | 12,363 | 12,363 | 2267 | 2267 | 7666 | 7666 |
| Adjusted R2 | 0.13 | 0.13 | 0.17 | 0.18 | 0.10 | 0.11 |
| Linear combination of β1 and ∑γkControl | 0.238 *** (16.46) | 0.325 *** (9.68) | 0.351 *** (15.50) | 0.553 *** (7.15) | 0.173 *** (10.68) | 0.244 *** (6.11) |
| Sig. of difference: Column (4) and (6) | Coef. | z | P > |z| | |||
| [Pre_mean]β2 - [Post_mean]β2 = 0 | −0.935 ** | −2.09 | 0.037 | |||
Notes: Demand_Uncertainty is calculated as the standard deviation of log-change in sales revenue for firm i during the sample period. All specifications are estimated with robust standard errors clustered by firm. The robust t-statistics are in parentheses. *, **, *** denote significance at the 10%, 5%, and 1% level, respectively (two-tailed test).
© 2019 by the author. Licensee MDPI, Basel, Switzerland. This article is an open access article distributed under the terms and conditions of the Creative Commons Attribution (CC BY) license (http://creativecommons.org/licenses/by/4.0/).
Share and Cite
MDPI and ACS Style
Kwon, D.-H. Demand Uncertainty, Cost Behavior, and the Asian Financial Crisis: Evidence from Korea. Sustainability 2019, 11, 2238. https://doi.org/10.3390/su11082238
AMA Style
Kwon D-H. Demand Uncertainty, Cost Behavior, and the Asian Financial Crisis: Evidence from Korea. Sustainability. 2019; 11(8):2238. https://doi.org/10.3390/su11082238
Chicago/Turabian StyleKwon, Dae-Hyun. 2019. "Demand Uncertainty, Cost Behavior, and the Asian Financial Crisis: Evidence from Korea" Sustainability 11, no. 8: 2238. https://doi.org/10.3390/su11082238
Note that from the first issue of 2016, this journal uses article numbers instead of page numbers. See further details here.