Vulnerability Analysis of Intercity Multimode Transportation Networks; A Case Study of the Yangtze River Delta


School of Naval Architecture, Ocean and Civil Engineering, Shanghai Jiao Tong University, Shanghai 200240, China
*
Author to whom correspondence should be addressed.
Sustainability 2019, 11(8), 2237; https://doi.org/10.3390/su11082237
Submission received: 28 March 2019
/
Revised: 8 April 2019
/
Accepted: 11 April 2019
/
Published: 13 April 2019
(This article belongs to the Special Issue Accessibility and Transportation Equity)
Abstract
:The disruption of an intercity transportation network will seriously influence the economic activities and communication between cities. At the regional or national transportation network level, in most cases, there is no link redundancy because of the high construction cost of the extra transportation infrastructure, so the impacts caused by the disruption of regional intercity transportation networks should be paid more attention. This paper proposes an accessibility-based method to analyze the vulnerability of multimode transportation networks. The measurement captures the influence of the disruption of network components in terms of the travel cost, socio-economic impacts, and level of transportation service of cities, and besides the network vulnerability analysis, it can also be used in the analysis of city relationships and development status of cities, providing a reference direction of the sustainable development for the city cluster. Finally, with the rapid application of high-speed trains in China, a preliminary study of the public transportation network of the Yangtze River Delta (YRD) region is conducted to illustrate the applicability of the evaluating method. The results show that the proposed measurement can be used to analyze the transportation network from the perspective of socio-economic impacts and level of transportation service, providing a reference for network planners and managers.
1. Introduction
Transportation is closely linked to our daily life, of which the transportation network is an essential component. The networks, including physical and virtual networks, such as road networks, power networks, and social networks, can be regarded as lifelines which are vital to people’s living [1]. History reveals that the disruption of these lifelines may result in serious damage to peoples’ daily life and social functioning [2]. The disruption of traffic networks sometimes also results in severe consequences. For example, in June 2017, seven roads of Xiushui county of Jiangxi province in China were disrupted by a heavy rainstorm, which caused economic losses of 785 million yuan [3]. In January 2018, heavy snows disrupted four trains from Shanghai to Beijing [4]. When facing disruptions, travelers have to make detours or postpone or even cancel their trips, which lead to increased travel cost. Many events, such as terrorist attacks, traffic accidents, natural hazards, and road construction, can lead to transportation disruption.
A number of studies discuss the impacts of disruptions of transportation networks via network vulnerability analysis. Berdica defined ‘‘vulnerability’’ as ‘‘a susceptibility to incidents that could result in considerable reductions in road network serviceability” [5]. Taylor et al. distinguished the definitions of vulnerability, risk, and reliability, and held the view that vulnerability is related to the disruption consequences and is irrespective of the probability of disruption occurrence [6]. In their study, they supplied an example on the overland transportation network of Australia to illustrate the proposed method. In that example, the Eyre Highway and transcontinental rail line between Perth and Adelaide were disrupted by flood, but the transportation network remained connected. Obviously, the occurrence probability of this disruption situation is extremely small. However, the consequence of this disruption is extremely severe, causing a detour of 5000 km. The other interpretation about the vulnerability addresses probability and consequences [7,8]. Note that the probability of the disruption occurrence may obscure some other potential problems [9]. In this study, we apply the former interpretation, i.e., vulnerability does not contain the probability of disruption occurrence, and focus on analyzing the components whose disruption would seriously damage the network [6,9].
Berdica reviewed the problem of network vulnerability and proposed directions of the future research [5]. However, the researcher did not provide a specific method of quantifying the consequences caused by the disruption. The measures to quantify the disruption impacts can be partitioned into two classes; traffic-related measures and topology-related measures. Traffic-related measures mainly describe the characteristics of transportation system operation, such as travel cost and travel time. Jenelius derived some indices from the generalized travel costs before and after the disruption to measure the importance of links and nodes of the networks, respectively, from the perspective of “equal opportunities” and “social efficiency” [7,10]. The other kind of measures, topology-related measures, such as degree, betweenness, and connectivity, mainly reveal the characteristics of network structure. Demšar et al. applied the topology-based method to analyze the road transportation network of Helsinki Metropolitan Area, Finland, and the results suggested that betweenness is an effective indicator in vulnerability analysis [11]. To measure the impacts of disruptions, the accessibility-based method is also widely used. Chen et al. used accessibility to measure the consequence of one or more link failures under the long-term equilibrium situation, in which travel behavioral responses are considered [12]. Taylor et al. applied the generalized travel cost, Hansen integral accessibility index, and Accessibility/Remoteness index to the vulnerability analysis of the transportation network of Australia [6]. Besides the accessibility-based methods, some other methods, such as game-theory-based methods and mathematical-model-based methods, are also applied in the problem. Bell et al. used game theory to analyze network vulnerability under disruption scenarios [13]. Xu et al. proposed a bilevel optimization model to calculate the upper and lower bounds of the traffic throughput caused by disruptions without enumerating all the possible disruption scenarios [14].
On the other hand, research on the impacts of disruptions on railway networks received less attention than the research on the road disruption. In the analysis of the railway network, topology-based methods are commonly used [15,16]. For example, Derrible and Kennedy analyzed thirty-three railway systems with a robustness indicator to analyze the system stability under disruption [17]. Because the topological indicators alone cannot reflect the variation of transportation system performance after disruption, Rodríguez-Núñeza and García-Palomares further analyzed the vulnerability of the rail transit network with the average travel time [18]. Besides the travel time, passenger volume is also an important element to be considered, and the accessibility index can = integrate the two characteristics well. Jiang et al. proposed an improved accessibility index which addressed land use characteristics to define the potential opportunities of interaction among the stations [19]. They used this index to measure rail station accessibility under disruption. It is noted that the accessibility-based methods are widely used in road, railway, waterway, and airline networks [20,21,22], but studies evaluating multimode transportation networks and the comparison between different travel modes are not sufficient.
In this paper, considering travel modes and the socio-economic characteristics of cities, an accessibility-based measurement is derived to analyze the vulnerability of the multimode intercity transportation networks.
The travel modes of the intercity transportation network are mainly railway transport, highway transport, and airline transport. Furthermore, with the improvement of living standards and the advances in technology, high-speed railways, with the obvious advantages of the strong transport capacity, fast speed, safety, and comfort, has led a revolution in global transportation. The application of high-speed rail has greatly reduced travel time among cities and promoted more travel behaviors. In China, the first high-speed railway was put into operation in 2008 and the high-speed rail operation mileage reached 25,000 kilometers by the end of 2017 [23]. High-speed rail plays an increasingly important role in the transportation networks of China.
In view of the development of high-speed railway in the Yangtze River Delta (YRD) of China, a case study of the vulnerability analysis of the intercity public transportation network of YRD that contains two travel modes, i.e., railway transport (ordinary trains and high speed trains) and highway transport (intercity bus), is also conducted and analyzed to verify the applicability of the proposed method. The results of the case study imply that the proposed measurement can be used to analyze the vulnerability of transportation networks. The measurement contains the socio-economic characteristics of each city, and can reveal the socio-economic activities of the study area. The results can provide a reference for network planners and managers.
The remainder of this paper is organized as follows. Section 2 states the evaluation method for multimode transportation networks. In Section 3, a case study of the application of the proposed method on the transportation network of YRD is analyzed and presented. Finally, conclusions are drawn in Section 4.
2. Methodology
The concept of accessibility is fundamental in transportation analysis and urban transportation planning [12,24]. The measure of accessibility can be totally different in different contexts of application [12,25]. One of the most classic indices is the Hansen integral accessibility index [6], only taking the attractions of other locations into account and ignoring the attraction of the location itself. Lu and Peng [26] improved the Hansen accessibility measure by considering the attractions of all the locations of the study area. Later, Chen et al. [27] further improved the Hansen accessibility-based method proposed by Lu and Peng [26] to evaluate transportation network vulnerability after the flooding disasters by taking different travel modes into account. In their approach, the travel modes are focused on road transportation, such as private cars and high-occupancy vehicles, and the weight of a travel mode between a given zone pair, such as , is determined by the current volume proportion of this travel mode between the zones and .
The Hansen accessibility index can be applied to analyses concerning cities, especially concerning cities that are separated from each other across the network [6]. The required data of the evaluation method proposed by Chen et al. [27] is the volume of each travel mode between two nodes. However, when the method is applied to intercity transportation networks, the data is difficult to acquire. In addition, the number of available travel alternatives between two nodes also influences the difficulty degree of traveling between the two nodes from the perspective of the level of transportation service of the node pairs. In this case, we improve the approaches proposed by Chen et al. [27] to make the method better suited for vulnerability analysis of intercity networks, in which the influence caused by the reduction of available travel alternatives and the variation of travel alternative preference are considered. The notations are shown in Table 1:
The measurement of the Hansen accessibility-based method in this paper can be expressed as:
where the travel mode choice distribution, , is determined by the multinomial logit model, so that the variation of travel mode preference after the disruption can be reflected. The utility of each travel mode contains the random utility and deterministic utility. In the logit model, the random utility of each travel mode is assumed to be independently and identically Gumbel distributed, so the probability, , of choosing each travel mode can be calculated by Equation (2), i.e.,
Under this situation, the level of transportation service starting from the node to the node is represented by the expected travel utility, i.e., the travelers’ satisfaction function, of the logit-based method:
The accessibility index of the city can be calculated by Equation (1). The attraction index and generation index reflect the socio-economic impacts on the vulnerability of intercity transportation networks. As the purposes of intercity trips mainly contain working, studying, and touring, indices such as employment, school enrollment of a city, and level of economic development of a city, including gross domestic product (GDP) and total retail sales of consumer goods, can be used as the attraction index of a city. On the other hand, the population of a city, reflecting the potential opportunities of people traveling to other cities, can be used to describe the generation index of this city. The higher the attraction weight and the generation weight of a city are, the more important the city is from the perspective of city interaction. It is noted that Equation (1) does not consider the impacts of inner-city trips. However, the analyzing environment of this study is the intercity network, and the focus of this study is the interaction/communication between cities after disruption. For this reason, this method is feasible under this circumstance. The travel cost decay parameter, , is used to adjust the travel cost ratio, which is computed from a gravity model based on the traffic flow. The value of demonstrates a direct proportion to the value of the accessibility loss [27], and is empirically set as 0.446632 [28]. The parameter is a decimal between 0 and 1, which reflects the weight of level of transportation service in the measurement. When , the measurement would not contain the disruption impacts on the level of transportation service of the node/city pairs caused by the reduction of available travel alternatives, and it is appropriate for emergency situations, such as nature disasters and terrorist attacks, under which the variety of the available travel alternatives is not important.
The alternative travel modes on the intercity network are various, mainly including private cars, intercity buses, air lines, and railways. In Equation (2), the deterministic utility of the traveler about each travel alternative is related to safety (), cost (), flexibility (), and travel time () of the travel alternatives, which can be expressed as the function of the indices of safety, cost, travel time, and flexibility, i.e., . With the stated/revealed preference survey or the historical data of study area about the travel behavior, the parameters of the function about travelers’ deterministic utility can be estimated, then the travel mode distribution can be calculated by Equation (2).
Compared with the approaches proposed by Chen et al. [27], the required data of this method is easy to obtain and has a wide range of alternative data sources. In addition, the proposed measurement incorporated the variation of expected travel utility of travelers, with which the impacts on the transportation service level of a node/city caused by the disruption can be reflected. Moreover, the accessibility-based method can incorporate the socio-economic impacts, traffic volume, and generalized travel cost, , into the measurement. With this feature, the proposed measurement can reflect various characteristics of the study area and be applied to various analyses.
It can be easily concluded from Equation (1) that in the original network, i.e., nondisruption scenario, the accessibility index of one node, reflecting the potential and level of economic development, is only related to the attraction index and the generation index of the nodes over the network if this node can initially be connected to other nodes. When the network is disrupted, the travel cost will increase, so that the traffic flow of each travel mode will change, and the level of transportation service will decline. So the value of the element of Equation (1) for each node pair , i.e., , will decrease, causing a reduction of the accessibility calculated by Equation (1). In this way, the reduction of the accessibility-based measurement can reflect the difficulty of interaction between the attraction node and all the other nodes caused by the disruption, which reflects the disruption impacts on the interaction between the nodes/cities. Thus, the vulnerability of the network after disruptions can be reflected by the total accessibility decrease.
In addition, the attraction weight and the generation weight in Equation (1) are both the proportion of some relevant attraction or generation indices, which ensures that the total accessibility of the network before the disruption is 1. This feature makes it easier to analyze the vulnerability of the intercity network under different disruption scenarios.
The indices for the network vulnerability analysis are referenced and derived from the approaches proposed by Lu and Peng [26], i.e.,
Network accessibility index:
Reduction of the network accessibility (network vulnerability index):
Reduction of the accessibility of node :
Reduction rate of the accessibility of the node (vulnerability index of each node):
Average reduction rate of the accessibility for the node under different disruption scenarios:
The network vulnerability index under different disruption scenarios can be calculated and compared by Equations (4) and (5). In this way, the most vulnerable disruption scenario can be obtained by finding the scenario under which the network accessibility reduction is the biggest. Equations (6), (7), and (8) reflect the accessibility reduction of each node under different disruption scenarios, and can be used to analyze the susceptible or vulnerable node/city under different disruption scenarios.
In the network vulnerability analysis, different generation methods of the disruption scenario vary with the purpose of the analysis. For example, the network analysis under some random disruption scenarios can be used to measure the impacts caused by random disruptions, such as extreme weather. Similarly, the analysis under some specific scenarios can be used to assess the networks under targeted attacks, such as terrorist attacks.
3. Case Study for the Yangtze River Delta and Results
In this section, a simple case study is conducted to explain the application of the proposed method.
The study area is the Yangtze River Delta (YRD), a densely-populated and economically developed area of China. The intercity travel modes within the YRD mainly include bus alternatives, car alternatives, and railway alternatives, including ordinary trains and EMU trains whose speeds exceed 200 km/h.
As shown in Figure 1a, the real road network and the real railway network are dense, and the multimode transportation network is well developed in YRD. As an illustrative application of the proposed method to analyze the vulnerability of the YRD multimode network, the travel modes we focus on in this case study are the public transport service of the YRD, including the intercity bus and railway, i.e., the set of travel modes is , ().
The intercity buses mainly travel on the arterial roads of the network, so we eliminate part of minor road links from the original network, generating the strategic network shown in Figure 1b [29]. The strategic network [29] contains 30 nodes, 110 road links, and 16 railway lines, and the 13 cities that this study focuses on are displayed as the gray nodes in the Figure 1b, including Shanghai, seven cities of Jiangsu province, i.e., Nanjing, Yangzhou, Taizhou, Nantong, Changzhou, Wuxi, and Suzhou, and five cities of Zhejiang province, i.e., Hangzhou, Huzhou, Jiaxing, Shaoxing, and Ningbo.
Moreover, the method is also applicable to vulnerability analysis for the real transportation network by the use of reasonable simplification of the network and fast computing method.
3.1. Data Collection and Processing
3.1.1. Basic Data of YRD Multimode Strategic Network
In this study, the attraction nodes and the generation nodes include 13 cities (1, 2, 5, 9, 12, 14, 17, 18, 23, 24, 25, 29, and 30) shown in Figure 1b. As for the highway transport, i.e., intercity buses, because the trips between cities are mainly conducted on the freeways, we assume that the travel time is independent of the link flow, and the travel time and distances of bus alternatives between the object nodes are acquired from Baidu Map. The ticket fares and the service frequency of intercity buses between the object nodes are acquired from a common Chinese booking website, Ctrip. For the railway transport, including ordinary trains and EMU trains, the travel time, ticket fares, and service frequency between the object nodes are acquired from the Railway Ministry’s official ticket website of China, i.e., 12306.cn.
The socio-economic indices of the object nodes, i.e., GDP, population, resident number, employed population, and industrial structure, are acquired from the China City Statistical Yearbook (CCSY) of 2017 [30].
3.1.2. Data Processing
In this case study, for each object node (city), such as node , the intercity bus passenger traffic volume, , and the railway traffic volume, , are also recorded in the CCSY of 2017 [30]. Because we do not have the survey data about the travel behavior over the YRD, the distribution of the public traffic volume over the YRD should be estimated first. The estimation method is based on the Furness model proposed by Zhu et, al [31], in which the socio-economic status of each city is considered. In this estimation method, the distribution probability matrix is firstly calculated by the improved gravity model by Equation (9) [31]:
where is the impedance function, which is the reciprocal of the weighted average travel time of the travel mode from to . , , , and are the accessibility, i.e., travel time of the city for the travel mode , GDP of city in 2017, resident population of the city , and size (area) of city respectively. , , , and are parameters of the base city. The value of these parameters all can be obtained from the CCSY of 2017 [30], official ticket website of China, i.e., 12306.cn, and Chinese booking website, Ctrip. In this case study, the parameter setting refers to the research conducted by Zhu et al. [31], i.e., , and . The base city over the YRD is Shanghai.
Label the traffic volume supported by the intercity bus and the railway from node to node as and , respectively. , , , and satisfy and , where is the set of cities out of the YRD. Because the statistical data about trips that terminated outside the YRD is in shortage, and most of the trips generated over the YRD are inside the YRD, we ignore the traffic volume going outside the YRD, giving a preliminary analysis of the vulnerability of YRD public transportation network, which can provide a preliminary suggestion and planning direction for the planners. In this way, with the distribution probability matrix, the original traffic distribution of each travel mode can be calculated by Equation (10).
Then, the Furness model is adopted to forecast the traffic volume distribution over the YRD. Update the traffic volume by the Equations (11) and (12),
until Equation (13) is satisfied.
In this way, the value of traffic volume between each node pair by different travel alternative , i.e., , can be estimated.
It is noted that the travel data are aggregated, all the travelers can be assumed as the same type, and the determination of each traveler choosing the travel alternative is independent. Then, the travel alternative determination of the traffic volume can be regarded as times Bernoulli trials. Equation (14) defines the deterministic utility of travelers choosing travel alternative to travel from to . We assume that the deterministic utility of each travel alternative is related to three indices, including service frequency (), ticket fares (), and travel time () [32]. According to Hansen [32,33], the index of service frequency is set to be the logarithmic form, because the returns in service attractiveness by increasing the service frequency are diminishing.
where the and is the weighted average ticket fares and weighted average travel time of the travel alternative .
With the estimated , Equation (14) can be estimated by using maximum likelihood estimation. The probabilities of choosing each travel alternative can be calculated with Equation (2).
The other parameters of this case study are listed in Table 2.
In this part, six disruption scenarios are generated to evaluate the vulnerability of YRD network, including four node failure scenarios, i.e., failures of node 9 (S1), node 14 (S2), node 24 (S3), and node 1 (S4), and two rail station failure scenarios, i.e., failures of rail station in node 9 (S5), and failures of rail station in node 1 (S6).
3.2. Results and Discussion
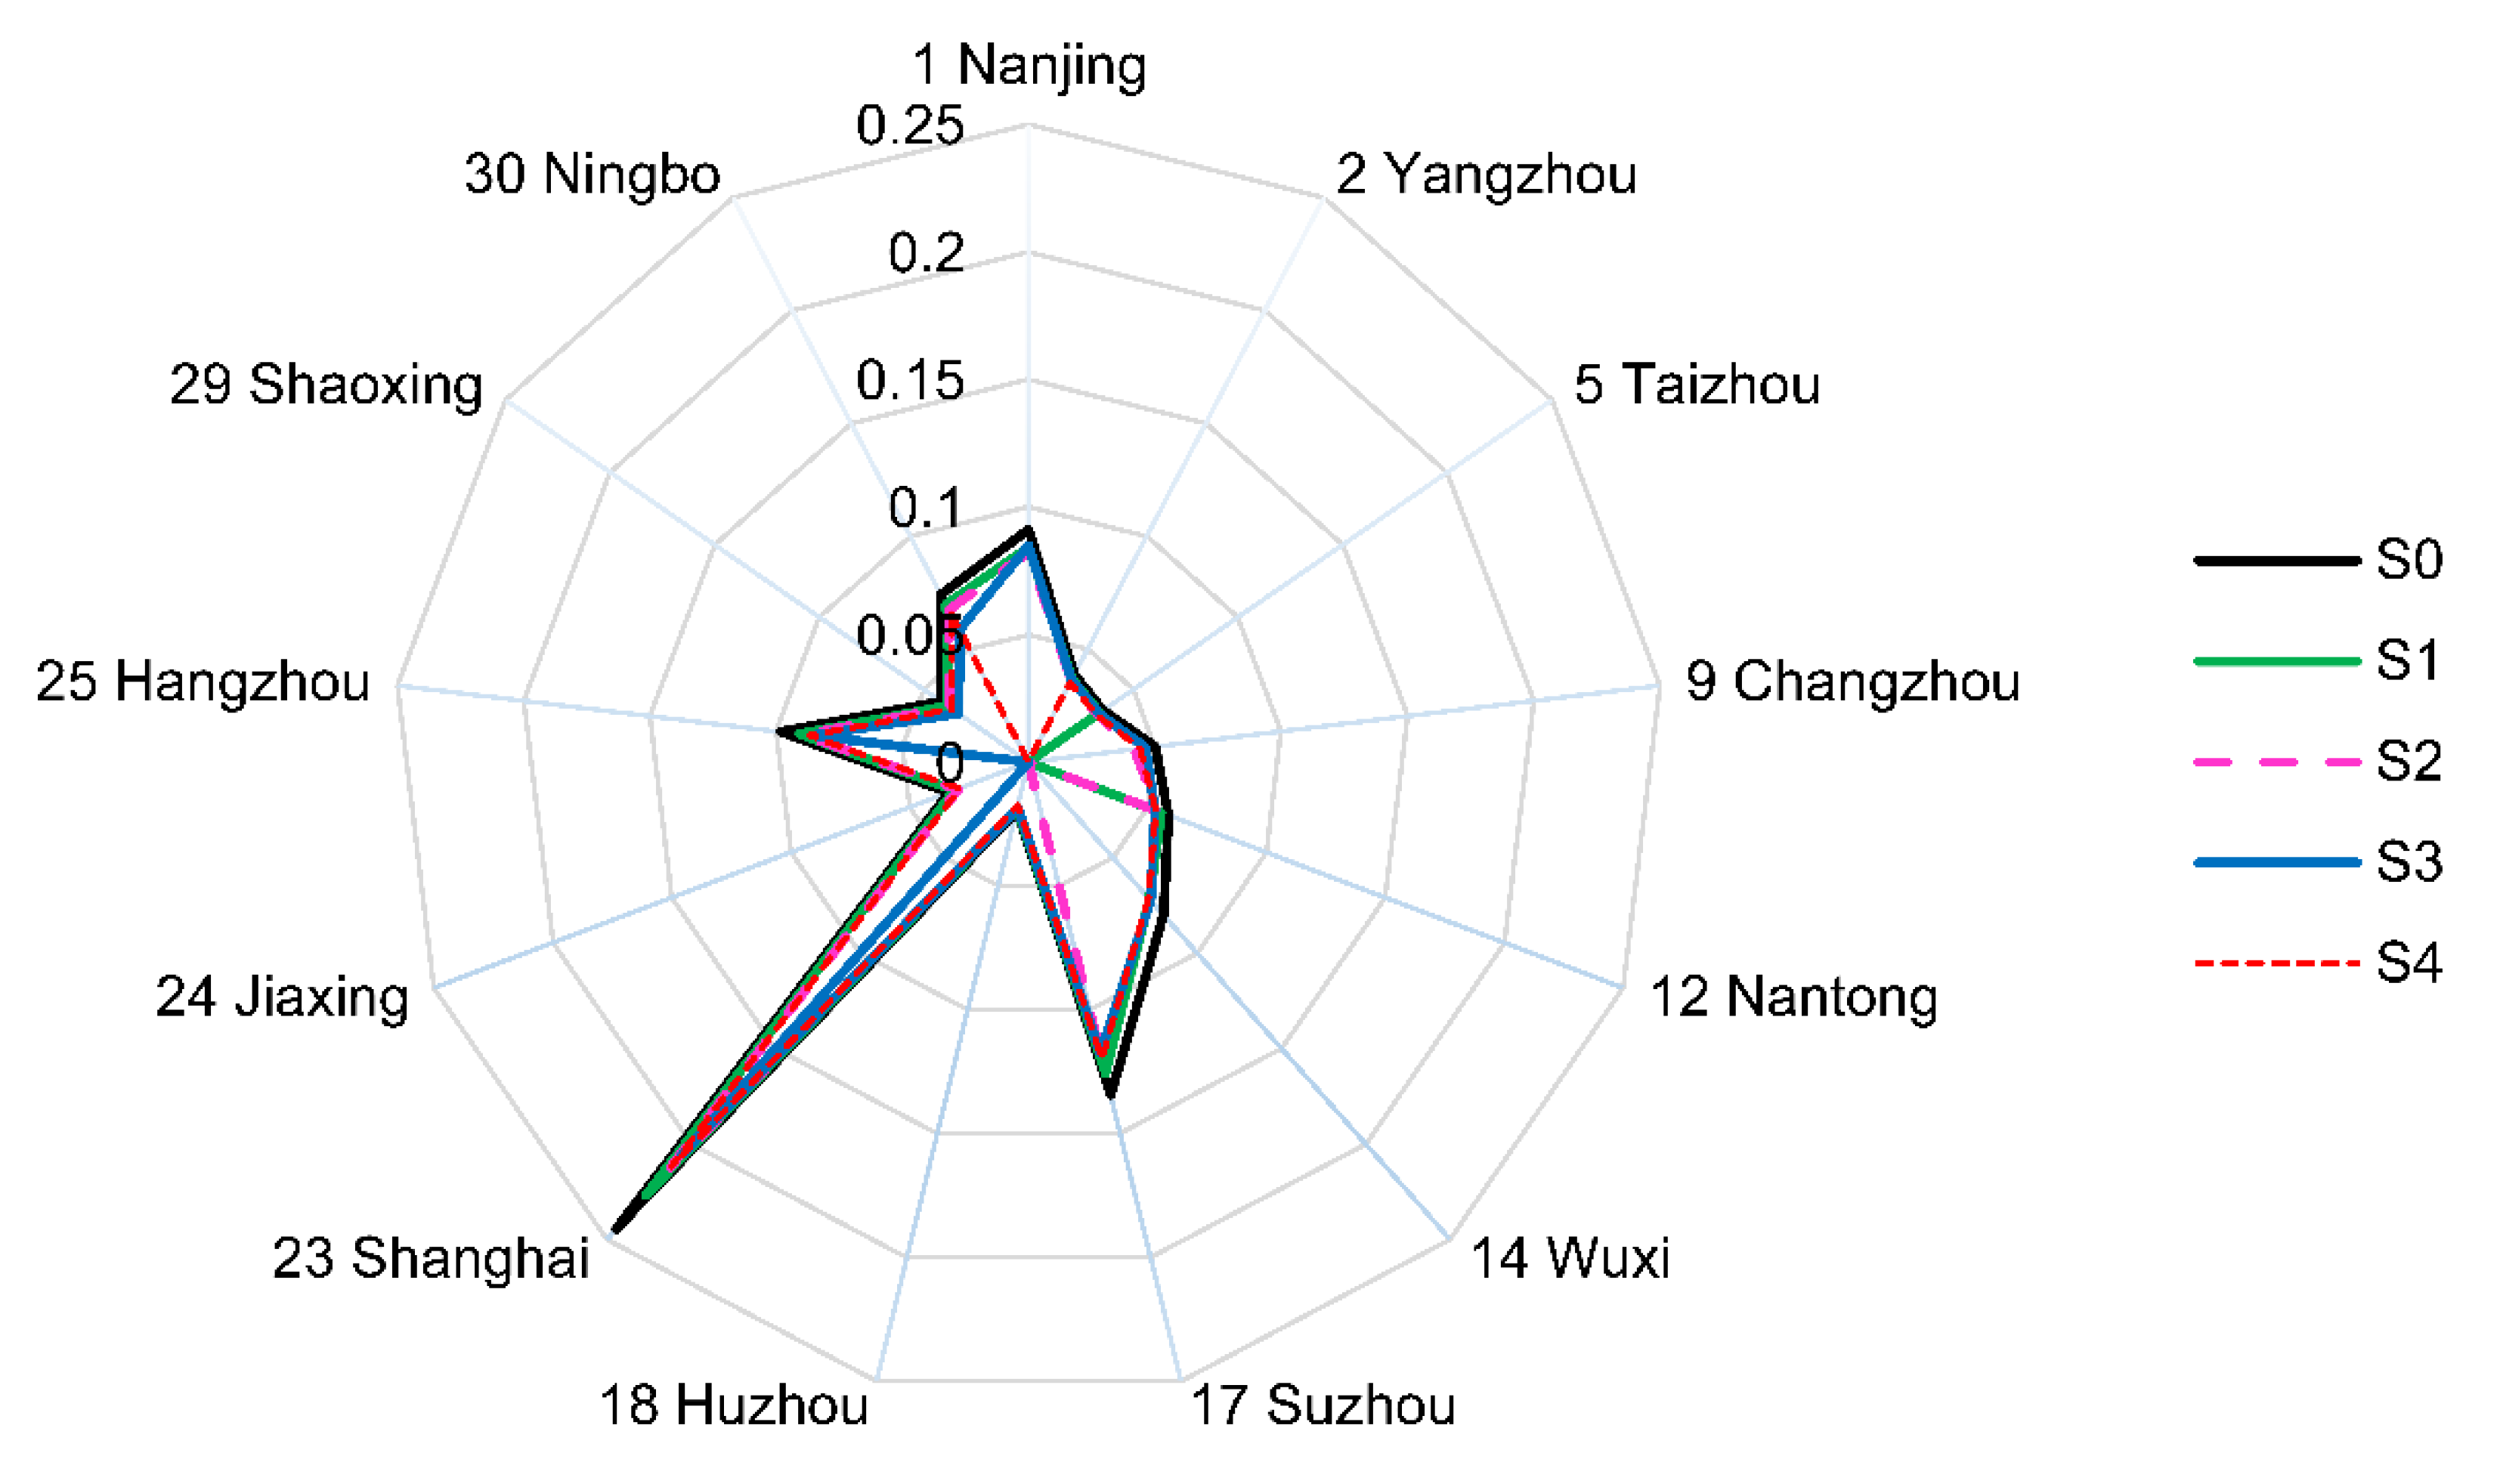
In the case study, the attraction index is the GDP of cities, reflecting the level of economic development of each city. The accessibility of each node/city under different node failure scenarios and the nondisruption scenario (S0) is shown in Figure 2. It implies that for each city, the city accessibility is different under different node failure scenarios, and the difference for each city between the accessibility under the disruption scenario and their initial accessibility reflects the disruption impacts on the economic activities of each city. Moreover, it is evident that the values of accessibility of nodes 23 (Shanghai), 17 (Suzhou), 25 (Hangzhou), and 1 (Nanjing) are always high, implying the important status of these four cities on the productive economic activities of the YRD. Note that among the four cities, the accessibilities of node 23, (Shanghai) under different scenarios are always the highest. It also implies that Shanghai is the most important terminal city and economic hub over the YRD, which can attract and generate plenty of communication and economic ties. This conclusion is in accordance with the economic level and administrative division of each city.
The vulnerability indices under each disruption scenario are shown in Figure 3. It is noted that the available transportation alternatives under the scenario with rail station failure are more various than the available alternatives under the node disruption scenarios, which can influence the travel cost of trips that go through the disrupted rail stations. For this reason, the network vulnerability indices, , under the rail station failure scenarios (S5, S6) are smaller than that under the node failure scenarios (S1–S4), as shown in Figure 3a. In this case study, the descending order of the network vulnerability index, , is 1961.71 (S4), 1801.78 (S2), 1549.59 (S3), 1159.41 (S1), 419.49 (S6), and 179.32 (S5), which means the scenario S4 is the most severe disruption scenario among the six scenarios; i.e., the impacts caused by the disruption of node 1 (S4) are more serious than the impacts caused by the disruption of node 9 (S1), 14 (S2), or 24 (S3). In other words, node 1 (Nanjing) is more vulnerable than nodes 9, 14, and 24, and the disruption of node 1 can result in a severe negative impact on the communications and interactions of cities of the YRD. Excluding the accessibility reduction of the disrupted node caused by the failure of node or rail station itself, i.e., , where is the node ID of the disrupted node/rail station, the descending order of the total accessibility reduction of all the other cities under each disruption scenario, , is 1158.17 (S3), 1050.07 (S4), 1002.36 (S2), 658.24 (S1), 400.09 (S6), and 167.51 (S5). The results indicate that the impact on the accessibility reduction of all the other cities/nodes under the disruption scenario S3 with node failure of node 24 (Jiaxing) is more serious than the impacts under the other scenarios. It suggests that Jiaxing plays an important role in the economic activities, especially in some service industries like tourism, between developed cities, such as Hangzhou, Shaoxing, Ningbo, Shanghai, Suzhou, and Nanjing, because of its good location. The reason can be summarized that the transportation service served at node 24 (Jiaxing) connects these developed cities, and the failure of node 24 will result in a big increase of travel cost, causing a decrease in city accessibility.
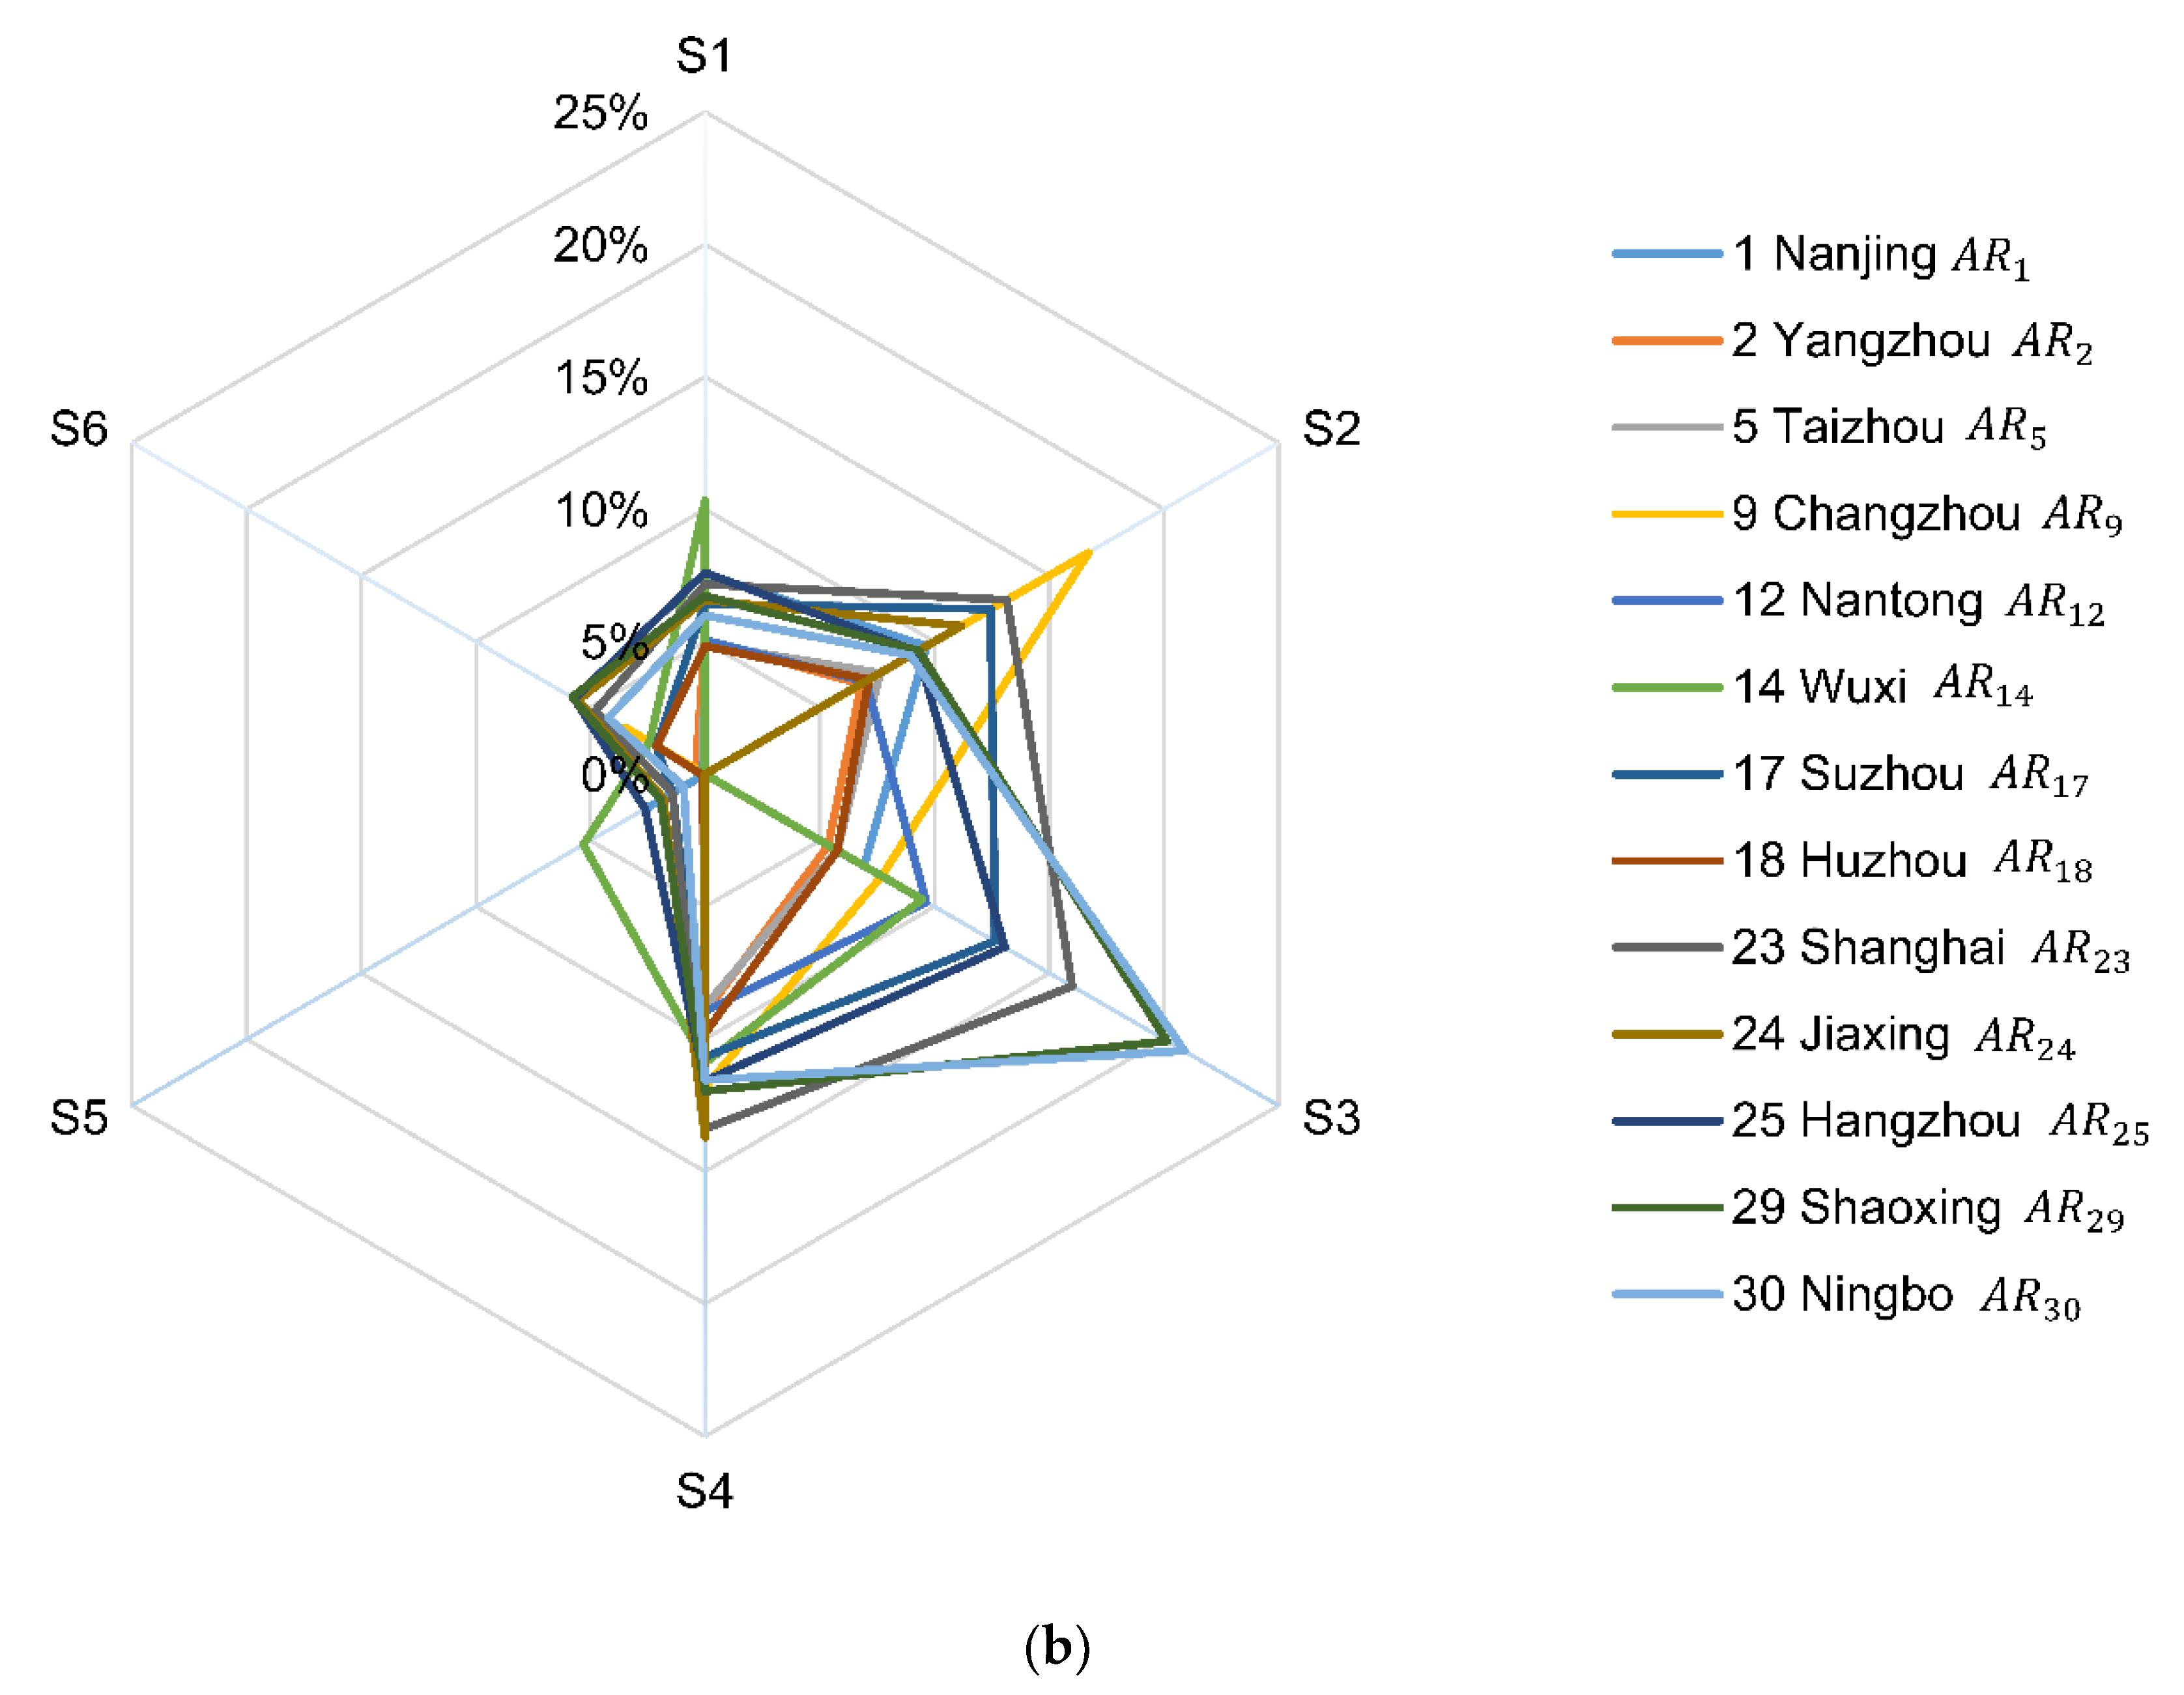
The accessibility reduction rates of each city, , under different disruption scenarios are shown in Figure 3b. Under S1 (node failure of node 9), is the biggest, while is the biggest under S2 (node failure of node 14), so we can conclude that node 9 and node 14 are susceptible to each other. This is because the transportation services of node 9 and node 14 have some overlap caused by their geographically proximity. The same conclusion can also be drawn from the accessibility reduction rate under S5 (rail station failure of node 9), where the accessibility reduction rate of the node 14 is the biggest. By using indicators such as the output value of different industries as the attraction index, the competition and cooperation relationship of some industries between the two cities can also be analyzed. As for the accessibility reduction rate of each city, , under S3 (node failure of node 24), and are apparently bigger than the others, indicating that node 29 and 30 are susceptible to the disruption of node 24. The reason is that most trips within the YRD whose origin node or destination node is 29 or 30 pass through node 24. In other words, the failure of node 24 would greatly increase the difficulty of the internal interaction of the YRD whose terminal is node 29 or node 30. Connecting the above analysis of node 24 (Jiaxing) from Figure 3a, we can conclude that the development of the surrounding cities of Jiaxing, which are the most developed cities of YRD, such as Hangzhou, Shaoxing, Ningbo, Suzhou, and Shanghai, will promote the development of Jiaxing. S4 and S6 illustrate the impacts caused by node failure or rail station failure of node 1 (Nanjing). Different from the other scenarios, under which the failure results in decreased accessibility of particular nodes, as shown in Figure 3b, under S4, the reduction rates caused by the node failure of node 1 are all greater than 8.5%, implying that the failure of node 1 has a certain impact on almost all the nodes/cities of the YRD network. Therefore, we can conclude that Nanjing is one of the transportation hubs in the YRD, the disruption of which would result in severe consequences.
Figure 4 illustrates the average reduction rate of the accessibility for city under different disruption scenarios, . To some extent, the value of also reflects the ability of city to resist the disruption. In Figure 4, the average reduction rate of accessibility of nodes 2, 5, 18, and 12 are small. This demonstrates that these nodes are the least affected by the given disruption scenarios of this case study. One of the reasons causing this phenomenon is that the railway transport of nodes 2, 5, 18, and 12 is underdeveloped, especially for the nodes 2, 5, and 12, so the disruption of this case study only has slight impacts on the deterioration of the level of transportation in these cities. Nowadays, high-speed railway plays a more and more important role in the development of cities. The introduction of high-speed railway can enrich the available travel alternatives, increase the opportunities of communication with the other cities/nodes, and reduce the travel cost of the trips. If these nodes capture the opportunity of introducing high-speed railway, the level of transportation service will increase, followed by the promotion of the importance and criticality of these nodes over the YRD network, which would also facilitate the interaction and economic activities related these cities/nodes. On the other hand, under the scenario that node is disrupted, the accessibility reduction rate of node , i.e., is large, especially when the node is totally disrupted, under which node is an isolated node, and the accessibility reduction rate is 100%. Thus, the average reduction rate of accessibility for the four disrupted nodes, i.e., , , , and , are much larger than the of other nodes, as shown in Figure 4. Except the of the four disrupted nodes, i.e., 9, 14, 24, and 1, the average accessibility reduction rates of node 23 and node 29, i.e., and , are the highest. It suggests that these two nodes are the most affected by the given disruption scenarios, so it is reasonable to suppose that the consequences of node failure of node 23 and 29 can be also severe. In future analysis, further discussion and analysis about the status and development of nodes 23 (Shanghai) and 29 (Shaoxing) over the YRD should be conducted.
With the computation and analysis of and , attention can be paid to some particular nodes/cities whose or is high, i.e., the nodes susceptible to disruptions. The higher the value of and , the more vulnerable and susceptible the node is, which may need some measure to promote the invulnerability of this node. This conclusion can supply a reference for network planners to take measures to evaluate and improve network robustness.
4. Conclusions
This paper proposes a Hansen-accessibility-based method to evaluate the strategic multimode transportation networks, in which the socio-economic characteristics and level of transportation service of each node are considered. A case study of vulnerability analysis of the YRD strategic public transportation network is presented to justify the applicability and efficiency of the proposed method. The results of the case study suggest that Shanghai, Suzhou, Hangzhou, and Nanjing are the core cities of the YRD, which play important roles in productive economic activities. Comparing the vulnerability index of each node under different disruption scenarios, we conclude that node 1 (Nanjing) is more vulnerable than nodes 9, 14, and 24 in the network, and is probably one of the transportation hubs in the YRD. Node 24 (Jiaxing) possesses a good location of the YRD, connecting a series of developed cities, and the development of these surrounding developed cities would also influence the development of Jiaxing. Furthermore, with the rapid application and development of high-speed trains in China, nodes 2, 5, and 12 may have a good development space over the YRD.
This paper has four main highlights. The first is that this method considers different travel alternatives and determines the share of each travel alternative by a logit-based model. In the intercity transportation network analysis, the data required for the method is easier to obtain than the method proposed by Chen et al. [27]. In addition, the introduction of a multinomial logit mode to the measurement allows it to reflect the variation of choice preference of the travel mode and the traffic volume of different travel modes under different disruption scenarios. Most of all, the change in level of transportation service, represented by the change of travelers’ satisfaction, under different disruption scenarios is also incorporated in the method. The second is that this method introduces socio-economic indices of GDP, population, and employment of each city into the evaluation, and considers both the attraction impacts of the destination nodes and the generation impacts of the origin nodes. The method integrates the travel cost, transportation service level, socio-economic impacts, and potential interaction between the cities into the measurement in the form of a Hansen accessibility index. It is worth mentioning that the value of the measurement can imply various characteristics of nodes, which depends on the meaning of the socio-economic indices used in the measurement. Therefore, the measurement can also be applied to various evaluations and analyses, such as the development status, the development potential, and city relationships, which can provide guidance for the sustainable development of the city cluster. The third is also rooted in the advantage of the improved Hansen accessibility-based methods [26,27], i.e., the normalized value of the accessibility, making the vulnerability indices easy to compare. Specifically, the method can reveal an overall impact of the disruptions on the networks quantitatively by comparing the overall network accessibility with the original network accessibility. Furthermore, with the accessibility change rate of each component, the most vulnerable component of the networks under each scenario can also be identified, which may provide a reference for network planners and managers to improve the network robustness. The fourth highlight of this paper is the application of the public transportation network of YRD, which supplies the inspiration of the further research on the vulnerability analysis on more complex (and real) networks.
However, some limitations of the proposed method still exist. The first limitation is that the proposed method in this paper does not take multimode trips into consideration. In reality, there are usually more than one travel mode during a trip, especially during intercity trips. Multimodal transport has a good development space, whether in passenger transportation or freight transportation, so the method that considers multimodal transportation alternatives will be more practical and applicable. The second limitation is that extra time before and after trips is not contained in the measurement. The convenience and difficulties that travelers experience in getting to the stations from their places of departure are not considered, which may result in the overestimation or underestimation of the travel cost for some travel alternatives when the departing city is large and contains many rail stations and bus stations. The third limitation is that the method of this paper provides an effective measurement to evaluate the vulnerability of the network, and does not provide an efficient method to recognize the most critical disruption scenario of the network. As for the large-scale network, however, it is impossible to enumerate all the possible disruption scenarios, so an efficient methodology to recognize the critical disruption scenario without enumerating all the scenarios is significant for both transportation network planners and managers. In addition, as the travel preferences of travelers in the different regions are different because of the differences in culture and lifestyle, it is still a huge project to conduct a trip survey over the study area, the cost of which would be large. Therefore, the applicability of the proposed method is limited.
Besides the improvement of the limitations of the proposed method in this paper, future research can also be conducted to address the network analysis with more complicated situations with consideration of the future development of transportation. For example, with the development of high-speed railways in China, the use of high-speed trains (CRH Express) will grow [34], thus vulnerability analysis of multimode transportation networks incorporating both passenger transport and freight transport may also be desirable.
Author Contributions
Conceptualization, Y.M. and A.N.; Data curation, Y.M.; Formal analysis, Y.M.; Investigation, Y.M.; Methodology, Y.M. and A.N.; Project administration, Y.M. and A.N.; Resources, Y.M. and A.N.; Software, Y.M.; Supervision, A.N.; Validation, Y.M.; Visualization, Y.M.; Writing—original draft, Y.M.; Writing—review & editing, Y.M. and A.N.
Funding
This research received no external funding.
Conflicts of Interest
The authors declare no conflict of interest.
References
- Platt, R.H. Lifelines: An Emergency Management Priority for the United States in the 1990s. Disasters 1991, 15, 172–176. [Google Scholar] [CrossRef]
- Miller, H.J. Transportation and Communication Lifeline Disruption. In The Geographical Dimensions of Terrorism; Cutter, S.L., Richardson, D.B., Wilbanks, T., Eds.; Routledge: Evanston, IL, USA, 2003; pp. 145–152. [Google Scholar]
- CNR News. Heavy Rain on June 23 Caused 785 Million Yuan in Economic Losses Due to Road Disruptions in 7 Towns and Villages in Xiushui County. Available online: http://china.cnr.cn/yaowen/20170627/t20170627_523820318.shtml (accessed on 27 June 2017).
- The Chinanews Online Service. Widespread Snowfall Has Shut Down High-Speed Trains in Beijing and Shanghai. Available online: http://www.chinanews.com/sh/2018/01-04/8416171.shtml (accessed on 4 January 2018).
- Berdica, K. An introduction to road vulnerability: What has been done, is done, and should be done. Transp. Policy 2002, 9, 117–127. [Google Scholar] [CrossRef]
- Taylor, M.A.; Sekhar, S.V.; D’Este, G.M. Application of Accessibility Based Methods for Vulnerability Analysis of Strategic Road Networks. Netw. Spat. Econ. 2006, 6, 267–291. [Google Scholar] [CrossRef]
- Jenelius, E.; Mattsson, L.-G. Developing a Methodology for Road Network Vulnerability Analysis. Nectar Cluster 2006, 1, 1–9. [Google Scholar]
- Erath, A.; Birdsall, J.; Axhausen, K.W.; Hajdin, R. Vulnerability Assessment Methodology for Swiss Road Network. Transp. Res. Rec. J. Transp. Res. Board 2009, 2137, 118–126. [Google Scholar] [CrossRef]
- Wang, Z.; Chan, A.P.; Yuan, J.; Xia, B.; Skitmore, M.; Li, Q. Recent Advances in Modeling the Vulnerability of Transportation Networks. J. Infrastruct. Syst. 2014, 21, 06014002. [Google Scholar] [CrossRef]
- Jenelius, E.; Petersen, T.; Mattsson, L.-G. Importance and Exposure in Road Network Vulnerability Analysis. Transp. Res. Part A Policy Pract. 2006, 40, 537–560. [Google Scholar] [CrossRef]
- Demšar, U.; Špatenková, O.; Virrantaus, K. Identifying Critical Locations in a Spatial Network with Graph Theory. Trans. GIS 2008, 12, 61–82. [Google Scholar] [CrossRef]
- Chen, A.; Yang, C.; Kongsomsaksakul, S.; Lee, M. Network-Based Accessibility Measures for Vulnerability Analysis of Degradable Transportation Networks. Netw. Spat. Econ. 2007, 7, 241–256. [Google Scholar] [CrossRef]
- Bell, M.G.H.; Kanturska, U.; Schmöcker, J.D.; Fonzone, A. Attacker–Defender Models and Road Network Vulnerability. Philos. Trans. R. Soc. A Math. Phys. Eng. Sci. 2008, 366, 1893–1906. [Google Scholar] [CrossRef]
- Xu, X.; Chen, A.; Yang, C. An Optimization Approach for Deriving Upper and Lower Bounds of Transportation Network Vulnerability under Simultaneous Disruptions of Multiple Links. Transp. Res. Part C Emerg. Technol. 2017. [Google Scholar] [CrossRef]
- Lam, T.N.; Schuler, H.J. Connectivity index for systemwide transit route and schedule performance. Transp. Res. Rec. J. Transp. Res. Board 1982, 854, 17–23. [Google Scholar]
- Derrible, S.; Kennedy, C. Network analysis of world subway systems using updated graph theory. Transp. Res. Rec. J. Transp. Res. Board 2009, 2112, 17–25. [Google Scholar] [CrossRef]
- Derrible, S.; Kennedy, C. The complexity and robustness of metro networks. Phys. A Stat. Mech. Its Appl. 2010, 389, 3678–3691. [Google Scholar] [CrossRef]
- Rodríguez-Núñez, E.; García-Palomares, J.C. Measuring the vulnerability of public transport networks. J. Transp. Geogr. 2014, 35, 50–63. [Google Scholar] [CrossRef] [Green Version]
- Jiang, R.; Lu, Q.C.; Peng, Z.R. A station-based rail transit network vulnerability measure considering land use dependency. J. Transp. Geogr. 2018, 66, 10–18. [Google Scholar] [CrossRef]
- Cao, X.S.; Xue, D.S.; Yan, X.P. A study on the urban accessibility of national trunk highway system in China. Acta Geogr. Sin. 2005, 60, 903–910. [Google Scholar]
- Gutierrez, J.; Gonzalez, R.; Gomez, G. The European highspeed train network: Predicted effects on accessibility patterns. J. Transp. Geogr. 1996, 4, 227–238. [Google Scholar]
- Hesse, C.; Evangelinos, C.; Bohne, S. Accessibility measures and flight schedules: An application to the european air transport. Eur. Trans. 2013, 6, 1–23. [Google Scholar]
- The Xinhua News Agency. Tribute 2017: China’s High-Speed Rail Carved 25,000 km of New Mileage. Available online: http://www.xinhuanet.com/2017-12/28/c_1122180305.htm (accessed on 28 December 2018).
- Miller, H.J. Measuring Space-Time Accessibility Benefits Within Transportation Networks: Basic Theory and Computational Procedures. Geogr. Anal. 1999, 31, 1–26. [Google Scholar] [CrossRef]
- Bhat, C.; Handy, S.; Kockelman, K.; Mahmassani, H.; Gopal, A.; Srour, I.; Weston, L. Development of an Urban Accessibility Index: Formulations, Aggregation, and Application; Working Paper Report FHWA/TX-02/4938-4; Center for Transportation Research University of Texas at Austin: Austin, TX, USA, 2002. [Google Scholar]
- Lu, Q.-C.; Peng, Z.-R. Vulnerability Analysis of Transportation Network under Scenarios of Sea Level Rise. Transp. Res. Rec. J. Transp. Res. Board 2011, 2263, 174–181. [Google Scholar] [CrossRef]
- Chen, X.-Z.; Lu, Q.-C.; Peng, Z.-R.; Ash, J.E. Analysis of Transportation Network Vulnerability under Flooding Disasters. Transp. Res. Rec. J. Transp. Res. Board 2015, 37–44. [Google Scholar] [CrossRef]
- Sohn, J. Evaluating the significance of highway network links under the flood damage: An accessibility approach. Transp. Res. Part A Policy Pract. 2006, 40, 491–506. [Google Scholar] [CrossRef]
- Mi, Y.; Xie, C. Pareto-Optimal Locations of Charging Stations for Electric Vehicles: Minimization of Detour Cost and Maximization of Emerging Demand. In Proceedings of the 96th Annual Meeting of the Transportation Research Board, Washington, DC, USA, 8–12 January 2017. [Google Scholar]
- Chen, X.L. China City Statistical Yearbook of 2017; China Statistics Press: Beijing, China, 2018; pp. 97–194. [Google Scholar]
- Zhu, H.G.; Zhang, Y.Y.; Ma, Z.L.; Hu, D.W. Trip Distribution Forecasting Method of Intercity-Travel. Chang’an Daxue Xuebao (Ziran Kexue Ban)/J. Chang’an Univ. (Nat. Sci. Ed) 2017, 37, 104–112. [Google Scholar]
- Adler, N.; Pels, E.; Nash, C. High-speed rail and air transport competition: Game engineering as tool for cost-benefit analysis. Transp. Res. Part B Methodol. 2010, 44, 812–833. [Google Scholar] [CrossRef]
- Hansen, M. Airline competition in a hub-dominated environment: An application of non-cooperative game theory. Transp. Res. Part B 1990, 24, 27–43. [Google Scholar] [CrossRef]
- CCTV News. High-Speed Rail Express Services Are Available in More Than 500 Cities across China. Available online: http://news.cctv.com/2017/11/16/ARTIyDw7dm0Tz4m4JdiUE7Qz171116.shtml (accessed on 16 November 2017).
Figure 1.
The real and strategic transportation networks of the Yangtze River Delta (YRD) region: (a) Study area of the case study (YRD); (b) Public transportation network of YRD.
Figure 1.
The real and strategic transportation networks of the Yangtze River Delta (YRD) region: (a) Study area of the case study (YRD); (b) Public transportation network of YRD.


Figure 2.
Accessibility of cities under each node failure scenario.

Figure 3.
Vulnerability index under each disruption scenario: (a) Accessibility reduction of each city; (b) Accessibility reduction rate of each city under different scenarios (except for the accessibility reduction rate of the disrupted node itself, i.e., ARd).
Figure 3.
Vulnerability index under each disruption scenario: (a) Accessibility reduction of each city; (b) Accessibility reduction rate of each city under different scenarios (except for the accessibility reduction rate of the disrupted node itself, i.e., ARd).


Figure 4.
Average reduction rate of the accessibility for city i under different disruption scenarios.
Figure 4.
Average reduction rate of the accessibility for city i under different disruption scenarios.


Table 1.
Notation of the methodology.
| Variables | Implication |
| Accessibility of the city . | |
| Accessibility of the city on the nondisruption networks. | |
| Accessibility of the city on the disrupted network. | |
| Network vulnerability index after the network is disrupted. | |
| Vulnerability index of the city after the network is disrupted. | |
| Deterministic utility of travelers choosing the travel alternative/mode to travel from the city to the city | |
| Original travel cost/time that travelers choosing the travel alternative/mode to travel from the city to the city . | |
| Travel cost/time that travelers choosing the travel alternative/mode to travel from the city to the city when the transportation network is disrupted. | |
| Level of transportation service of the node pair on the original transportation network, which is represented as the expected travel utility from the node to the node . | |
| Level of transportation service of the node pair when the transportation network is disrupted. | |
| Parameters | Implication |
| Attraction weight of city , which is the ratio of the attraction index of city to the total attraction index of the study area. The attraction index can be various, such as the GDP of the city, the total jobs of the city, and so on. | |
| Generation weight of the departure city , which equals to the ratio of the generation index of city to the total generation index of the study area except for the index of the attractive city . The number of residents of a city can well reflect the generation weight of this city. | |
| Probability for travelers to choose the mode from the city to the city . | |
| Travel cost decay parameter, which is greater than zero. | |
| Weight of the service level, | |
| Sets | Implication |
| Set of travel mode. | |
| Set of nodes/cities of the intercity network/the study area. | |
| Disruption scenario set. |
Table 2.
Other parameters of the case study.
| Parameter | Value |
|---|---|
| Average travel time of the travel alternative from the node to node | |
| 1 | |
© 2019 by the authors. Licensee MDPI, Basel, Switzerland. This article is an open access article distributed under the terms and conditions of the Creative Commons Attribution (CC BY) license (http://creativecommons.org/licenses/by/4.0/).
Share and Cite
MDPI and ACS Style
Miao, Y.; Ni, A. Vulnerability Analysis of Intercity Multimode Transportation Networks; A Case Study of the Yangtze River Delta. Sustainability 2019, 11, 2237. https://doi.org/10.3390/su11082237
AMA Style
Miao Y, Ni A. Vulnerability Analysis of Intercity Multimode Transportation Networks; A Case Study of the Yangtze River Delta. Sustainability. 2019; 11(8):2237. https://doi.org/10.3390/su11082237
Chicago/Turabian StyleMiao, Yu, and Anning Ni. 2019. "Vulnerability Analysis of Intercity Multimode Transportation Networks; A Case Study of the Yangtze River Delta" Sustainability 11, no. 8: 2237. https://doi.org/10.3390/su11082237
Note that from the first issue of 2016, this journal uses article numbers instead of page numbers. See further details here.