Business Sustainability Performance Evaluation for Taiwanese Banks—A Hybrid Multiple-Criteria Decision-Making Approach


1
Graduate Institute of International Business, National Taipei University, New Taipei City 237, Taiwan
2
Department of Banking and Finance, Chinese Culture University, Taipei City 111, Taiwan
*
Author to whom correspondence should be addressed.
Sustainability 2019, 11(8), 2236; https://doi.org/10.3390/su11082236
Submission received: 23 March 2019
/
Revised: 9 April 2019
/
Accepted: 11 April 2019
/
Published: 13 April 2019
(This article belongs to the Special Issue Enterprise Resource Planning (ERP) and Sustainability)
Abstract
:The Taiwanese government has encouraged bank privatization and the establishment of financial holding companies to improve banking sustainability and consolidate banks, insurance companies, and securities firms. It is important for bank decision makers to set policies that lead to sustainable development. However, the literature remains unclear about the types of banks that achieve greater business sustainability. This paper aims to (1) identify the criteria that affect banks’ business sustainability and (2) determine the most sustainable types of banks. This study uses a hybrid multiple-criteria decision-making approach on eighteen financial criteria for twenty-five Taiwanese listed banks with data from 2012 to 2016. The results show that non-performing loan ratio is the most critical factor. In addition, financial holding companies outperformed non-financial holding companies. Financial holding companies with insurance companies as their largest subsidiaries performed best. Private banks exceeded state-owned banks in sustainability. The results lead to two implications. First, banks should value risk over profitability and diversify financial products. Second, the government should continue to privatize banks. These findings suggest that bank managers implement an enterprise resource planning (ERP) system with a master plan, framework, and guidelines to help them track bank performance indicators to ensure sustainability.
1. Introduction
Banks play a vital role in channeling funds from savers to borrowers to stimulate economic growth. Bank failures have devastating effects on the economy because they prevent businesses, investors, and consumers from accessing funds necessary for financial growth. Given the critical roles of banks in an economy, bank managers must make decisions with sustainability in mind so that enterprises and investors can continue to receive bank loans for business operations and investment opportunities [1]. The banking crises in 1997 originating in Southeast Asia compelled international organizations such as the International Monetary Fund (IMF) and the Basel Committee on Banking Supervision (BCBS) to set global standards for banking sustainability. BCBS established regulations such as Basel I (1998), Basel II (2004), and Basel III (2009) to address significant risks faced by banks: capital risk, market risk, and operational risk. For example, after the global crisis in 2008 and the collapse of Lehman Brothers, BCBS announced Basel III, which requires banks to raise their liquidity ratios and minimum capital (calculated by dividing Tier 1 capital (mainly common shares and retained earnings of a bank) by total assets less intangible assets) to safeguard banks against excessive debt.
In response to the international call for banking sustainability, the Taiwanese government executed three financial system reforms during the period from 1989 to 2008, with bank privatization and the establishment of financial holding companies being the most notable changes [2]. Despite these efforts, Taiwanese banks continued to face challenges of business sustainability stemming from increased local and global competition. For example, Taiwanese banks were inferior to those of Singapore, Hong Kong, and Korea in return on assets or return on equities in the 2000s. The lower operating efficiency of Taiwanese banks implied that they were less capable of attracting international investors, thus receiving less funding than their counterparts in Asia [2].
Healy and Palepu [3] emphasized that financial reports and the disclosure of financial information are essential in conveying the results of firm management and performance to external investors. Although the Taiwan Stock Exchange Corporation (TWSE), a supervisory authority for the Taiwan listed companies, encourages firms to create values that protect the well-being of communities (e.g., donation), they do not set standards or regulations for companies to comply. For this reason, TWSE urges the listed companies to establish measurable goals for sustainability and examine them regularly [4]. Another supervisory agency of Taiwanese banks, Fiscal Supervisory Commission (FSC), also uses a set of objective, standardized, and quantitative indicators, such as non-performing loan (NPL) and loan-to-deposit ratio, to track the banking sector, linking bank operation performance and its sustainability [5]. These indicators enable banks to avoid financial troubles such as bank run or insolvencies, which may harm a large number of individual and institutional entities [6,7]. Based on Liang’s [8] approach, this study examines the Taiwanese listed banks using a set of financial indicators, which mirrors banks’ business sustainability.
Business sustainability is defined as “meeting needs of the firm’s direct and indirect stakeholders, such as shareholders, employees, clients, pressure groups, communities, without compromising its ability to meet future stakeholder needs as well” [9,10]. Funk [11] and Huang et al. [10] explained that when applied to a business setting, “sustainability” means a sustainable organization designed to lead to a desirable future state for stakeholders—such as investors, customers, and government agencies—without compromising its ability to meet the needs of future stakeholders in the long term. For example, a desirable future state for investors includes sustained revenue growth over the long term. Companies that actively manage and respond to a wide range of sustainability indicators have greater abilities to create values for stakeholders over the long term.
In this study, we first collected 29 financial indicators listed by BASEL III, TWSE, and FSC. Then, we reduced the number of indicators to 18 based on the opinions of domain experts who are bank executives. Taiwanese banks have faced issues of business sustainability since 1990. Before 1990, Taiwanese banks were few in number and were owned and operated with tight control by the government. Banks’ primary goal was not to earn profits but to meet the government objectives of stabilizing the economy by following stringent regulations on interest rates and the foreign exchange system. After 1990, bank liberalization spread around the world, and the Taiwan government started to amend its policy to lift the control over interest and exchange rates. The government initiated bank privatization in 1991 by amending the Banking Law. As a result, sixteen new privately owned banks were added to twenty-four existing banks. In 2001, the number of private banks grew to forty-eight, representing an increase of 200%. The government implemented such banking reform with an aim to increase the international competitiveness and sustainability of the banking sector. However, the issue of sustainability remained, because too many banks competed in the same market to sell homogeneous financial products and services. Hence, the banks jeopardized their survival, because profit margin diminished and quality of loans deteriorated. Specifically, the return of equity of private banks decreased from 11.5% in 1991 to 5.5% in 2001, and NPL increased from 1.0% to 7.7% during the same period [5].
Taiwan entered the World Trade Organization in 2001 and faced fierce global competition with large-scale international banks. To address sustainability challenges, the Taiwan government passed the Financial Holding Company Act in 2001 to consolidate several types of financial institutions. Specifically, the government allowed the establishment of a financial holding company (FHC) to have a controlling interest in a bank, insurance company, and/or securities firm. This law gave rise to fifteen FHCs to offer a wide range of financial products and services under the same company. Such financial reform divided the financial institutions into two groups: FHC and non-FHC. As a result, the number of non-FHC banks fell from a peak of fifty-three in 2000 to thirty-eight in 2008. However, the difficulty of sustainability continued after 2001 due to poor bank management. The Taiwan government implemented its second and third reforms in 2002 and 2004, respectively. The second reform alleviated bad debts and improved banks’ operating efficiency. The third reform promoted mergers among state-owned banks and/or financial holding companies—but unsuccessfully. In 2005 and 2006, some private banks encountered a severe bad-debt crisis due to over-issuance of credit cards to unqualified young users. In 2008, the global financial turmoil devastated the world economy and critically affected banking sustainability in Taiwan.
Although the government carried out reforms to improve the sustainability of financial institutions, the results were unclear. In particular, the literature varied as to which types of banks achieved greater sustainability. Kao et al. [12] argued that increasing the size and scope of financial products does not necessarily improve the performance of banks. Lai et al. [13] found that non-FHC banks have higher loan ratios, which means smaller banks are more capable of generating profits. Cheng et al. [14] claimed that non-FHC banks are more capable of increasing cost efficiency than FHC banks because of their awareness of firm expenditure and desire to diversify financial products. Similarly, Chiou [15] asserted that an independent bank faces an adverse impact after becoming a subsidiary of a FHC because of the increased complexity in the decision-making process and resource management.
In contrast, some researchers found that FHC banks outperform non-FHC banks. Huang and Kuo [16] found that FHC banks have higher loan spreads than non-FHC banks. Other studies indicate that FHC banks are more efficient than independent banks because FHC banks use larger capital and better reputations to achieve higher profitability [17,18]. Similarly, state-owned banks in Taiwan are more likely than privately owned banks to be cost efficient because state-owned banks have higher power to implement policies to reduce expenditures [18]. Chao et al. [19] provided conflicting opinions. They found that state-owned banks perform better in loan and investment activities because they can attract more customers by offering lower charges. On the contrary, private banks were found to be more efficient in fee-based income activities, such as wire transfer and mutual fund investment, probably because they provide better services.
This study aims to evaluate the business sustainability performance of Taiwanese listed banks and compare the differences among types of banks. This analysis applies an effective method to conduct an overall performance assessment on banks, which is key to direct banks’ sustainable developments.
The results of the study could help Taiwanese bank managers track sustainability performance indicators through the use of an enterprise resource planning (ERP) system. ERP is a computer system that integrates applications programs in deposits, loans, collection, accounting, and other function in financial institutions [20]. All departments within a financial institution can have access to the same relevant information in a timely matter. Chofreh et al. [21] suggested that an ERP system contains three parts: roadmap, framework, and guidelines. Each component must be carefully designed to achieve integration [22,23,24].
Prior studies focus mostly on bank profitability and efficiencies [25]. The extant literature provides inadequate information for bank managers in formulating internal policies associated with sustainability. This study aims to identify Taiwanese banks’ sustainability performance. Moreover, the extant research has used mostly data envelopment analysis (DEA) and Stochastic frontier analysis (SFA) to analyze bank performance. These models are purely statistical and do not involve domain experts in selecting variables. Neither DEA nor SFA can recognize the interrelationships among criteria, nor assign weights to each criterion in a system with multiple inputs and outputs. We applied a multi-criteria decision-making (MCDM) approach on twenty-five Taiwanese banks. This method involved multiple, and often conflicting, criteria of a complex problem or system [26]. The MCDM approach is used to evaluate alternatives by breaking problems into smaller components. After weighing the criteria and making judgments about smaller components, we reassemble pieces to present the overall picture to allow decision makers to evaluate the alternatives by their ranking [27,28,29].
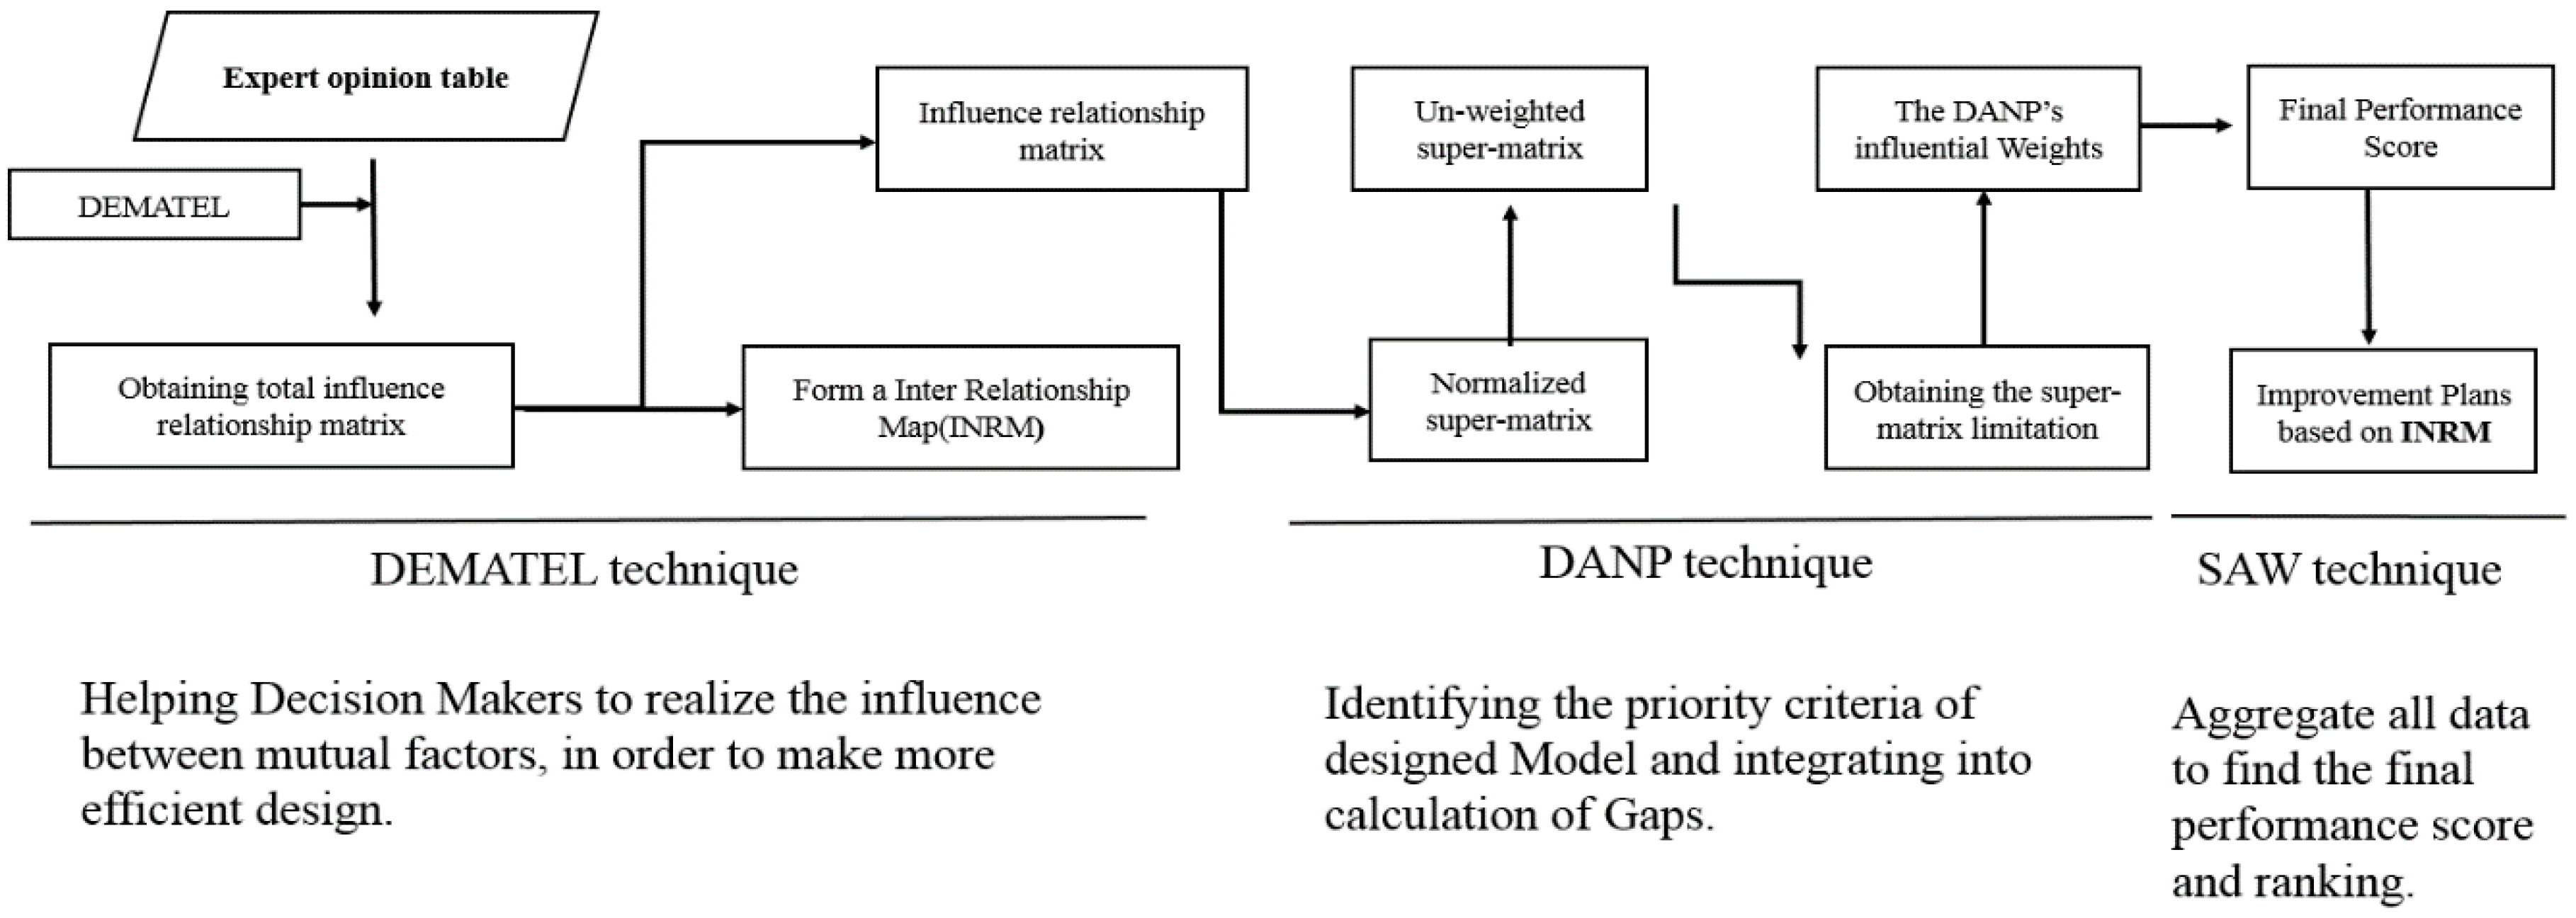
In contrast, the MCDM structure exhibits the order of importance in the system for decision makers to comprehend the priority of alternatives in a multiple-criteria environment. To overcome deficiencies of prior research models, this study builds a hybrid MCDM model incorporating the Decision-Making Trial and Evaluation Laboratory (DEMATEL) technique, DEMATEL-based Analytic Network Process (DANP) method, and Simple Additive Weighting (SAW) technique. First, we used the DEMATEL technique to discover the influential network among the sustainability performance dimensions and criteria. Then, we applied the DANP method to identify the common weights of the dimensions and criteria that are interdependent in the real world. Finally, we used the SAW technique to calculate the weighted average and then the overall score and ranking of each alternative for decision makers [30,31].
This study contributes to the sustainability literature in three ways. First, we use the opinions of domain experts with profound knowledge of banking to decide the final list of financial ratios as criteria in the measurement of banking sustainability. Second, we use a hybrid MCDM model that mimics the judgments and reasoning of decision makers in the real world [32]. This model identifies the interrelationships, weights, and rankings of multiple sustainability performance criteria. Third, we focus on the emerging market rather than the common mature market. We obtain the sustainability performances of all listed Taiwanese banks. We compare FHC and non-FHC banks and state-owned and private banks. The results of our study show that FHC banks outperform non-FHC banks, and private banks exceed state-owned banks, in sustainability performance. In addition, FHC banks with insurance companies as their largest subsidiaries have the best performance among all FHCs. Understanding the decision-making process leading to sustainability is crucial for bank leaders to improve evaluations. The results of this study can assist bank managers in making optimal decisions to achieve sustainability through an ERP system. For example, the outcome of this paper recommends that managers should value risk management over profitability and avoid over-lending.
2. Literature Review
This section describes the major research topics including the linkage between sustainability and financial performance (Section 2.1), the methodology used in this study (Section 2.2), and ERP system (Section 2.3). The contents of this section lead to the design of MCDM methodology which measures bank sustainability performance.
2.1. Linkage between Sustainability and Financial Performance in the Banking Industry
The promulgation of sustainability is critical in the financial sector. A safe and sound banking system aids a nation in its economic development by channeling money from fund providers to users [33,34]. Kartadjumena and Rodgers [35] found that when corporate executives become more conscious of sustainability, they strive to improve company financial performance (CFP). For this reason, FSC, the regulatory authority for financial institutions, supervise banks so that banks adhere to their fundamental values of helping individuals and businesses to access the needed funds in fulfillment of their personal and business goals, thus stimulating the wealth and prosperity of the community as a whole [5]. The importance of keeping banks as financial intermediaries in operations over an extended period while minimizing damages to depositors and investors resulting from adverse events cannot be ignored [36]. Therefore, it is critical for banks to strengthen their sustainability through specific performance indicators [8].
Many researchers have used financial ratios to predict business entities’ performance in the future [37,38,39,40] because ratios are precise and widely available. Similarly, Presley et al. [41] claimed that sustainability performance could be measured by financial factors that achieve banks’ financial goals. Increased competition and stakeholder pressure due to globalization compel banks to exert more effort to achieve sustainability, which is interrelated with sustainable finance [42]. For example, banks in China invest in corporate sustainability to increase their financial success and reinvest partial returns to other sustainability activities, including corporate social responsibility programs [43].
Albertina [44] conducted a meta-analytical study based on 52 studies over a 35-year period and revealed that a positive relationship exists between corporate environmental performance (CEP) and corporate financial performance (CFP). Similarly, Dixon-Fowler et al. [45] who examined the CEP–CFP relationship including environmental performance, firm size, and self-reporting policy reached the same conclusion. Friede et al. [46] discovered a substantially higher portion of positive outcomes of the environment and social performance on corporate financial performance in emerging markets (65.4%) compared to developed markets (38.0%). Additional empirical evidence also showed that listed companies that focus on sustainability are likely to demonstrate superior financial performance [47].
Financial regulatory authorities and supervisory agencies around the world use financial indicators to measure bank performance because financial indicators are standardized, which allows comparison across banks. The Basel Committee on Banking Supervision set internationally agreed measures, Basel III, to improve risk management of banks by requiring a minimum amount of capital. To follow international standards, TWSE requires every Taiwanese listed company to fully disclose its financial information according to the TWSE official guidelines. TWSE reports the financial condition of every listed company in five major categories: financial structure, liquidity, operation efficiency, profitability, and cash flow. TWSE believes that listed companies who are transparent about their business and financial information have greater abilities to protect investors and winning their trust. Such disclosure would elevate a firm’s financial performance [48]. Similarly, FSC monitors all Taiwanese banks’ performance through a set of indicators such as NPL and loan-to-deposit ratio. These ratios shed light on the level of banks’ sustainable development in the protection of consumers and investors [5]. Furthermore, Liang et al. [8] provided empirical evidence that banks listed on Dow Jones Sustainability Index (DJSI) have higher cost efficiency than non-DJSI banks, suggesting that the concept and practices of sustainability improve banks’ financial performance.
2.2. MCDM Methods Used in this Bank Sustainability Evaluation Model
Prior literature used mostly statistical methods to evaluate corporate sustainability in the banking sector [49,50,51]. These statistical methods include data envelopment analysis (DEA), stochastic frontier analysis (SFA), stochastic meta-frontier approach (SMF), technology gap ratio (TGR), and meta-frontier cost efficiency (MCE). They were useful in comparing banks that practice CSR and banks that do not, in terms of cost efficiency.
The conventional statistical models and financial ratios held unrealistic assumptions that all variables that are mostly financial in the model are independent and equally important. The MCDM model used in this study attempts to address this problem in two ways. First, we consulted domain experts who have many years of experiences in the banking sector to screen financial ratios. Second, we identified the dependence among variables and gave weight to each one. Only a few studies adopted the MCDM approach to examine and evaluate corporate governance in the banking sector [10]. Scarce literature has been devoted to refining an existing model in order to identify the critical determinants that affect banking’s abilities to sustain their developments and the types of banks that appear to be more sustainable. Our study makes a unique contribution to the literature by making such an attempt.
The MCDM structure in this study exhibits the order of importance in the system for decision makers to comprehend the priority of alternatives in a multiple-criteria environment. To overcome deficiencies of prior research models, this study builds a hybrid MCDM model incorporating the Decision-Making Trial and Evaluation Laboratory (DEMATEL) technique, DEMATEL-based Analytic Network Process (DANP) method, and Simple Additive Weighting (SAW) technique. First, we used the DEMATEL technique to discover the influential network among the sustainability performance dimensions and criteria. Then, we applied the DANP method to identify the weights of the dimensions and criteria in the real world. Finally, we used the SAW technique to calculate the weighted average and then the overall score and ranking of each alternative for decision makers [29,30,31].
2.3. ERP System Implementation
Enterprise resource planning (ERP) is a computer system or a software package that integrates applications programs in deposits, loans, collection, accounting, and the other functions in an organization [21]. All departments within a financial holding company or an independent bank can access the same relevant information promptly [22]. For example, the deposit department knows about new deposits as soon as customers complete the deposit process at the front desk. Bank sales department knows the exact status of a business client. Collection department is aware of a loan default immediately when a particular loan becomes past due. In addition, the bank’s accounting system is updated when all relevant transactions occur.
The ERP system is an essential step that aid bank practitioners in tracking bank performance based on the results of this study [52]. Chofreh et al. [24] suggested that a master plan be developed to implement an ERP system. A master plan contains three parts: roadmap, framework, and guidelines. Although each component has its role in the ERP system, the three components are interconnected to achieve coherence.
Road-mapping is a method that is used to develop policies in the firm [53]. In the context of the banking sector, bank senior managers should decide the computer system and applications to support a long-term monitoring system to ensure bank sustainability based on the critical factors identified in this study [20].
The framework of an ERP system describes the processes of implementation. According to Zhang et al. [54], the framework of an ERP system includes an organization environment, people characteristics, technical development, and ERP vendor support. Organization environment entails bank top management and employees to support such a project company-wide and an appointment of project managers to implement the ERP system [20,22]. People characteristics involve training of bank employees who should participate in the development and implementation of the ERP system. Technical developments require the selection of suitable hardware and software. ERP vendor support will be successful if the vendor has adequate knowledge of banking businesses.
Finally, the guidelines of an ERP system refer to the policies and rules set by the management to ensure the smooth operation of the ERP system [20,23]. Specifically, bank top managers should establish a set of policies and rules to specify employees who have data access to monitor bank sustainability indicators, such as NPL and loan-to-deposit ratio, the frequency of reviewing these indicators, and managers who are held accountable for the improvement of sustainability. Park [20] claimed the depth of post-ERP business process reengineering (BPR) accounts for the sustainable implementation of ERP. Therefore, the evaluation of bank guidelines should be executed by the top managers regularly to ensure the policies are aligned with the changes in business processes within a bank. Alternatively, a bank could re-structure its business processes to be compatible with the ERP system.
3. Materials and Methods
3.1. DEMATEL/DANP/SAW Techniques
Based on prior research, a firm’s financial performance can be used to measure its level of sustainability [8,55]. However, financial ratios must be carefully selected with relevance to the financial sector. Therefore, we use the MCDM approach because it includes a qualitative feature, which is an expert opinion. The senior professional banks’ opinions provide the most significant factors in determining banks’ sustainable development. These factors are expected to precisely reflect banks’ abilities to sustain themselves in the long run without bias. Thus, the MCDM methods in this study are designed to identify a preferred alternative or rank alternatives in a subjective order [27]. This uses a hybrid MCDM approach that encompasses DEMATEL, DANP, and SAW. Each method is described below:
The Decision-Making Trial and Evaluation Laboratory (DEMATEL) method first proposed by Fontela and Gabus [56] was developed by the Battelle Memorial Institute Geneva for two purposes. First, it can explain complex societal problems. Second, as part of the hybrid MCDM models, it can evaluate qualitative and factor-linked aspects of societal problems [56,57,58]. The DEMATEL method has been successfully applied to areas such as marketing strategies, control systems, and competencies training of global managers; and group decision-making [59,60]. This study uses the DEMATEL technique to build a pairwise influential network relation map (INRM) to detect the interrelationships among evaluation dimensions and criteria. In addition, the DEMATEL technique can identify the level of influence of each criterion over others. The values of these influence levels can be used as the basis of determining weights of criteria to derive relative importance.
Among MCDM methods, the analytic hierarchy process (AHP) and the analytic network process (ANP) are widely used to solve complex evaluation problems. Saaty [61] first published a detailed study on AHP and later [62,63] published a study on the development of a new method: ANP. AHP structures a decision problem into a hierarchy with a goal, decision criteria, and alternatives. AHP assumes that criteria in a hierarchy are independent. In contrast, ANP considers a system in which elements and alternatives are connected as a network, with some elements having dependence from or on others. ANP measures the weight of each component of the network and then ranks the alternatives in a decision-making process. This study integrates the DEMATEL technique with ANP, also known as DANP (DEMATEL-based ANP), to calculate the DANP influential weights, or “global weights.” We use DANP in our research to determine the influential (global) weights of the selected criteria. Then, the results of the DANP methods can be rearranged to form another evaluation model using the SAW method, which solves the problem of mutual dependence of components [36]. The SAW method proposed by Zionts and Wallenius [64] is a simple and frequently used MCDM technique to solve the selection problem in the presence of conflicting criteria. The weighted average of each alternative is first calculated, and then a ranking of all alternatives can be arranged. The alternative with the highest overall score is the best option and is most likely to be taken by decision makers [38].
3.2. The Hybrid MCDM Model
To evaluate bank performance, we use a combination of DEMATEL, DANP, and SAW techniques. Figure 1 depicts the hybrid MCDM model integrating three sub-approaches: DEMATEL, DANP, and SAW. The study conducts its analysis in three steps. First, DEMATEL is used to detect cause–effect influence relationships among the criteria. In the second step, the banking experts’ provide their opinions, which were used to determine the influential weight of the DANP method. In prior literature, bank performance evaluation models, such as DEA, did not provide a common set of weights to indicate the preference structure of decision-makers [65]. This study uses the DANP technique that combines DEMATEL and ANP to obtain the influential weights, which is also known as “global weights”. This method takes interdependence of the variables into consideration, thus solving the problems of mutual dependence, feedback among criteria, and identify weights of criteria [65].
Finally, we use the SAW technique to select alternatives. Figure 1 depicts the hybrid MCDM model used in this study.
Furthermore, the DEMATEL in the hybrid MCDM model can be broken down into four steps described below.
Step 1: Prepare a list of financial ratios from the Financial Supervisory Commission and Central Bank of Taiwan for domain experts to verify. We included eighteen criteria in the questionnaire forms for Taiwanese banks’ top executives, who provided the pairwise comparisons between any two criteria expressed by an integer number from 0 to 4. The scores indicate absolutely no influence (0), low influence (1), medium influence (2), high influence (3), and extremely high influence (4).
Based on the expert’s opinions, we constructed the initial direct influence–relation matrix R = [rij], where rij denotes the influence of criteria i on another criteria j as perceived by experts. Then, the average values were used to form the initial average influence–relation matrix A, indicating the degree of influence of one criterion on another and of one criterion from others. Therefore, an 18 column by 18 row average matrix A can be built by Equation (1), where n equals the number of total criteria (1 ≤ i ≤ n and 1 ≤ j ≤ n):
Step 2: Normalize the average matrix A to obtain the direct-influence relation matrix D. The matrix D = [dij]n×n can be derived from using Equations (2) and (3), where μ is a constant used for normalizing A:
Step 3: Construct the total influence–relation matrix T. The indirect effects of the model diminish with an increase in the power of D. The total influence–relation matrix T is defined by Equations (4) and (5):
Step 4: Analyze the sum of each column and row in T to generate the cause–effect influence relations among the criteria. The sum of each row and column in T can be denoted by ( = , for i ∈ 1, …, n) and ( = , for i ∈ 1, n). Moreover, the difference − (for i = 1, …, n) can be used to divide the criteria into two groups, namely, the cause and effect groups. If − > 0, then the ith criterion belongs to the cause group; otherwise, it belongs to the effect group. Similarly, the cause–effect influence relations among the dimensions are determined by − .
Step 5 and 6 using the DANP technique are explained below.
The T defined in Equation (5) can be denoted as TC, with the assumption that there are k dimensions and n criteria in T. Then, by using the notations from the index matrices (K, L are fixed sets of dimensions), the sub-matrices in TC can be indicated by Equation (6), and the sub-matrix indicates the dimensions kith (i.e., Di with p sub-criteria) and the Ljth (i.e., Dj with q sub-criteria), where 1 ≤ p, q ≤ n. The sub-matrix can be further defined in Equation (7). The normalization of is conducted CC by . Thus, the normalized TC can be defined as in Equation (8):
Step 5: Transpose to be the unweighted supermatrix W in the DANP model (i.e., W = ). In addition, matrix TD is in Equations (9) and (10):
Step 6: Obtain the weighted (DEMATEL-adjusted) super-matrix .
The raw influential weight of each criterion (i = 1, 2, …, n) can then be obtained as limz→∞ (WN)z until stable; that is, the raw influential weights of the criteria are wC = (wC1, …, wCi, …, wCn).
Simple Additive Weight method (SAW): With the integrated sustainability performance model as expressed in Labels (9) and (10), the performance score of each alternative on each criterion can be further evaluated by the SAW technique. We applied the SAW technique with the influential weights from DANP to derive the final ranking index for each alternative, as expressed in Equation (11):
Although this hybrid MCDM model may surpass the conventional statistical tools in several ways, mainly the opinions of domain experts and weighting of criteria, it is not without limitations. First, it is difficult to find domain experts who are willing to share their experiences with us because the bankers tend to be conservative and value confidentiality. Second, we interviewed banks’ senior executives only. Banks’ external auditors could be consulted in the future to provide alternative views about bank sustainability.
3.3. Sample and Sources of Data
The variable selection is based on the international standards of BASEL III, and the measures used by the two Taiwan supervisory agencies, TWSE, and FSC. BASEL III focuses on the credit risk of banks by imposing minimum capital requirements. TWSE requires the listed companies to disclose financial information for investors. TWSE evaluates the listed companies by financial ratios that are separated into five categories: financial structure (debt and equity), liquidity (e.g., current ratio), operation efficiency (e.g., receivables turnover), profitability (return on assets, return on equity, earnings per share), and cash flow. FSC that supervises financial institutions monitors banks’ loans and deposits to ensure a sound banking system.
We first selected 20 financial indicators as reported by TWSE, such as current ratio and debt-to-equity ratio, seven ratios provided by FSC, such as loan-to-deposit ratio, cost of funds, profit per employee, average net income per employee, etc., and two ratios from BASEL III, namely, capital adequacy ratio and common equity to asset ratio.
After we selected the financial indicators, we conducted personal interviews with seven domain experts (executives from six financial holding companies) who are knowledgeable about banks’ sustainable development. In addition, they have many years of practical experiences working at banks, so they are familiar with real-world situations and are capable of choosing the most representative financial ratios for our study. We asked them to examine the financial indicators and give us their opinions as to which ones are most relevant to bank sustainability. Finally, we retained eighteen criteria in five dimensions: operating performance, earnings and profitability, financing structure, growth, and asset quality and liquidity. Table 1 presents the definition of all criteria.
This study includes data of twenty-five listed Taiwanese financial institutions from their monthly financial statements during the period from 2012 to 2016. According to the Financial Supervisory Commission, there were thirty-seven Taiwanese banks in 2017. After deducting eleven non-listed banks and one non-commercial bank, we were left with twenty-five banks.
We designated the twenty-five banks into two broad categories and seven sub-categories by two stages. In the first stage, we divided the banks into two broad categories: financial holding company (FHC) and non-financial holding company (non-FHC). In the second stage, we further separated the groups. The FHC banks were divided into four sub-categories: (1) state-owned FHC banks, (2) FHC with banks as the largest subsidiaries, (3) FHC with insurance companies as the largest subsidiaries, and (4) FHC with securities firms as the largest subsidiaries. The non-FHC banks were divided into three sub-categories: (1) non-FHC state-owned banks, (2) non-FHC private banks, and (3) non-FHC corporate-affiliated banks. Table 2 shows the categories and sub-categories of the twenty-five Taiwanese listed banks.
4. Results and Discussion
This study uses the hybrid-MCDM approach consisting of the DEMATEL, DANP, and SAW techniques to identify the sustainability performance of twenty-five Taiwanese listed banks. This paper presents first the relationships between the sustainability performance criteria using the DEMATEL technique, then the weights of these criteria utilizing the DANP method, and finally the overall ranking of banks derived by the SAW technique.
4.1. Result of DEMATEL Technique
This study used the 18 × 18 initial average direct-influence matrix A, including eighteen criteria, which can be derived from the monthly financial statements of the twenty-five listed banks. We then followed DEMATEL technique step 2 to obtain the normalized matrix shown in Table 3 by applying Equations (2) and (3). Then, we can derive the total direct/indirect influence–relation matrix of the criteria following the DEMATEL’s step 3 based on the normalized matrix in Table 3. The total influence–relation matrix derived from Equations (4) and (5) is shown in Table 4.
As shown in Table 5, we calculate the row and column sum of each criteria. The criteria with positive values of D − R have great influence on other criteria. The criteria with negative values of D − R are greatly influenced by other criteria. A significantly positive value of D − R indicates that this criterion affects other criteria much more than other criteria affect it.
We then calculate the sums of each D + R and D − R for the five dimensions, as shown in Table 6.
Figure 2 depicts the INRM that illustrates the influential network–relationship of the five dimensions.
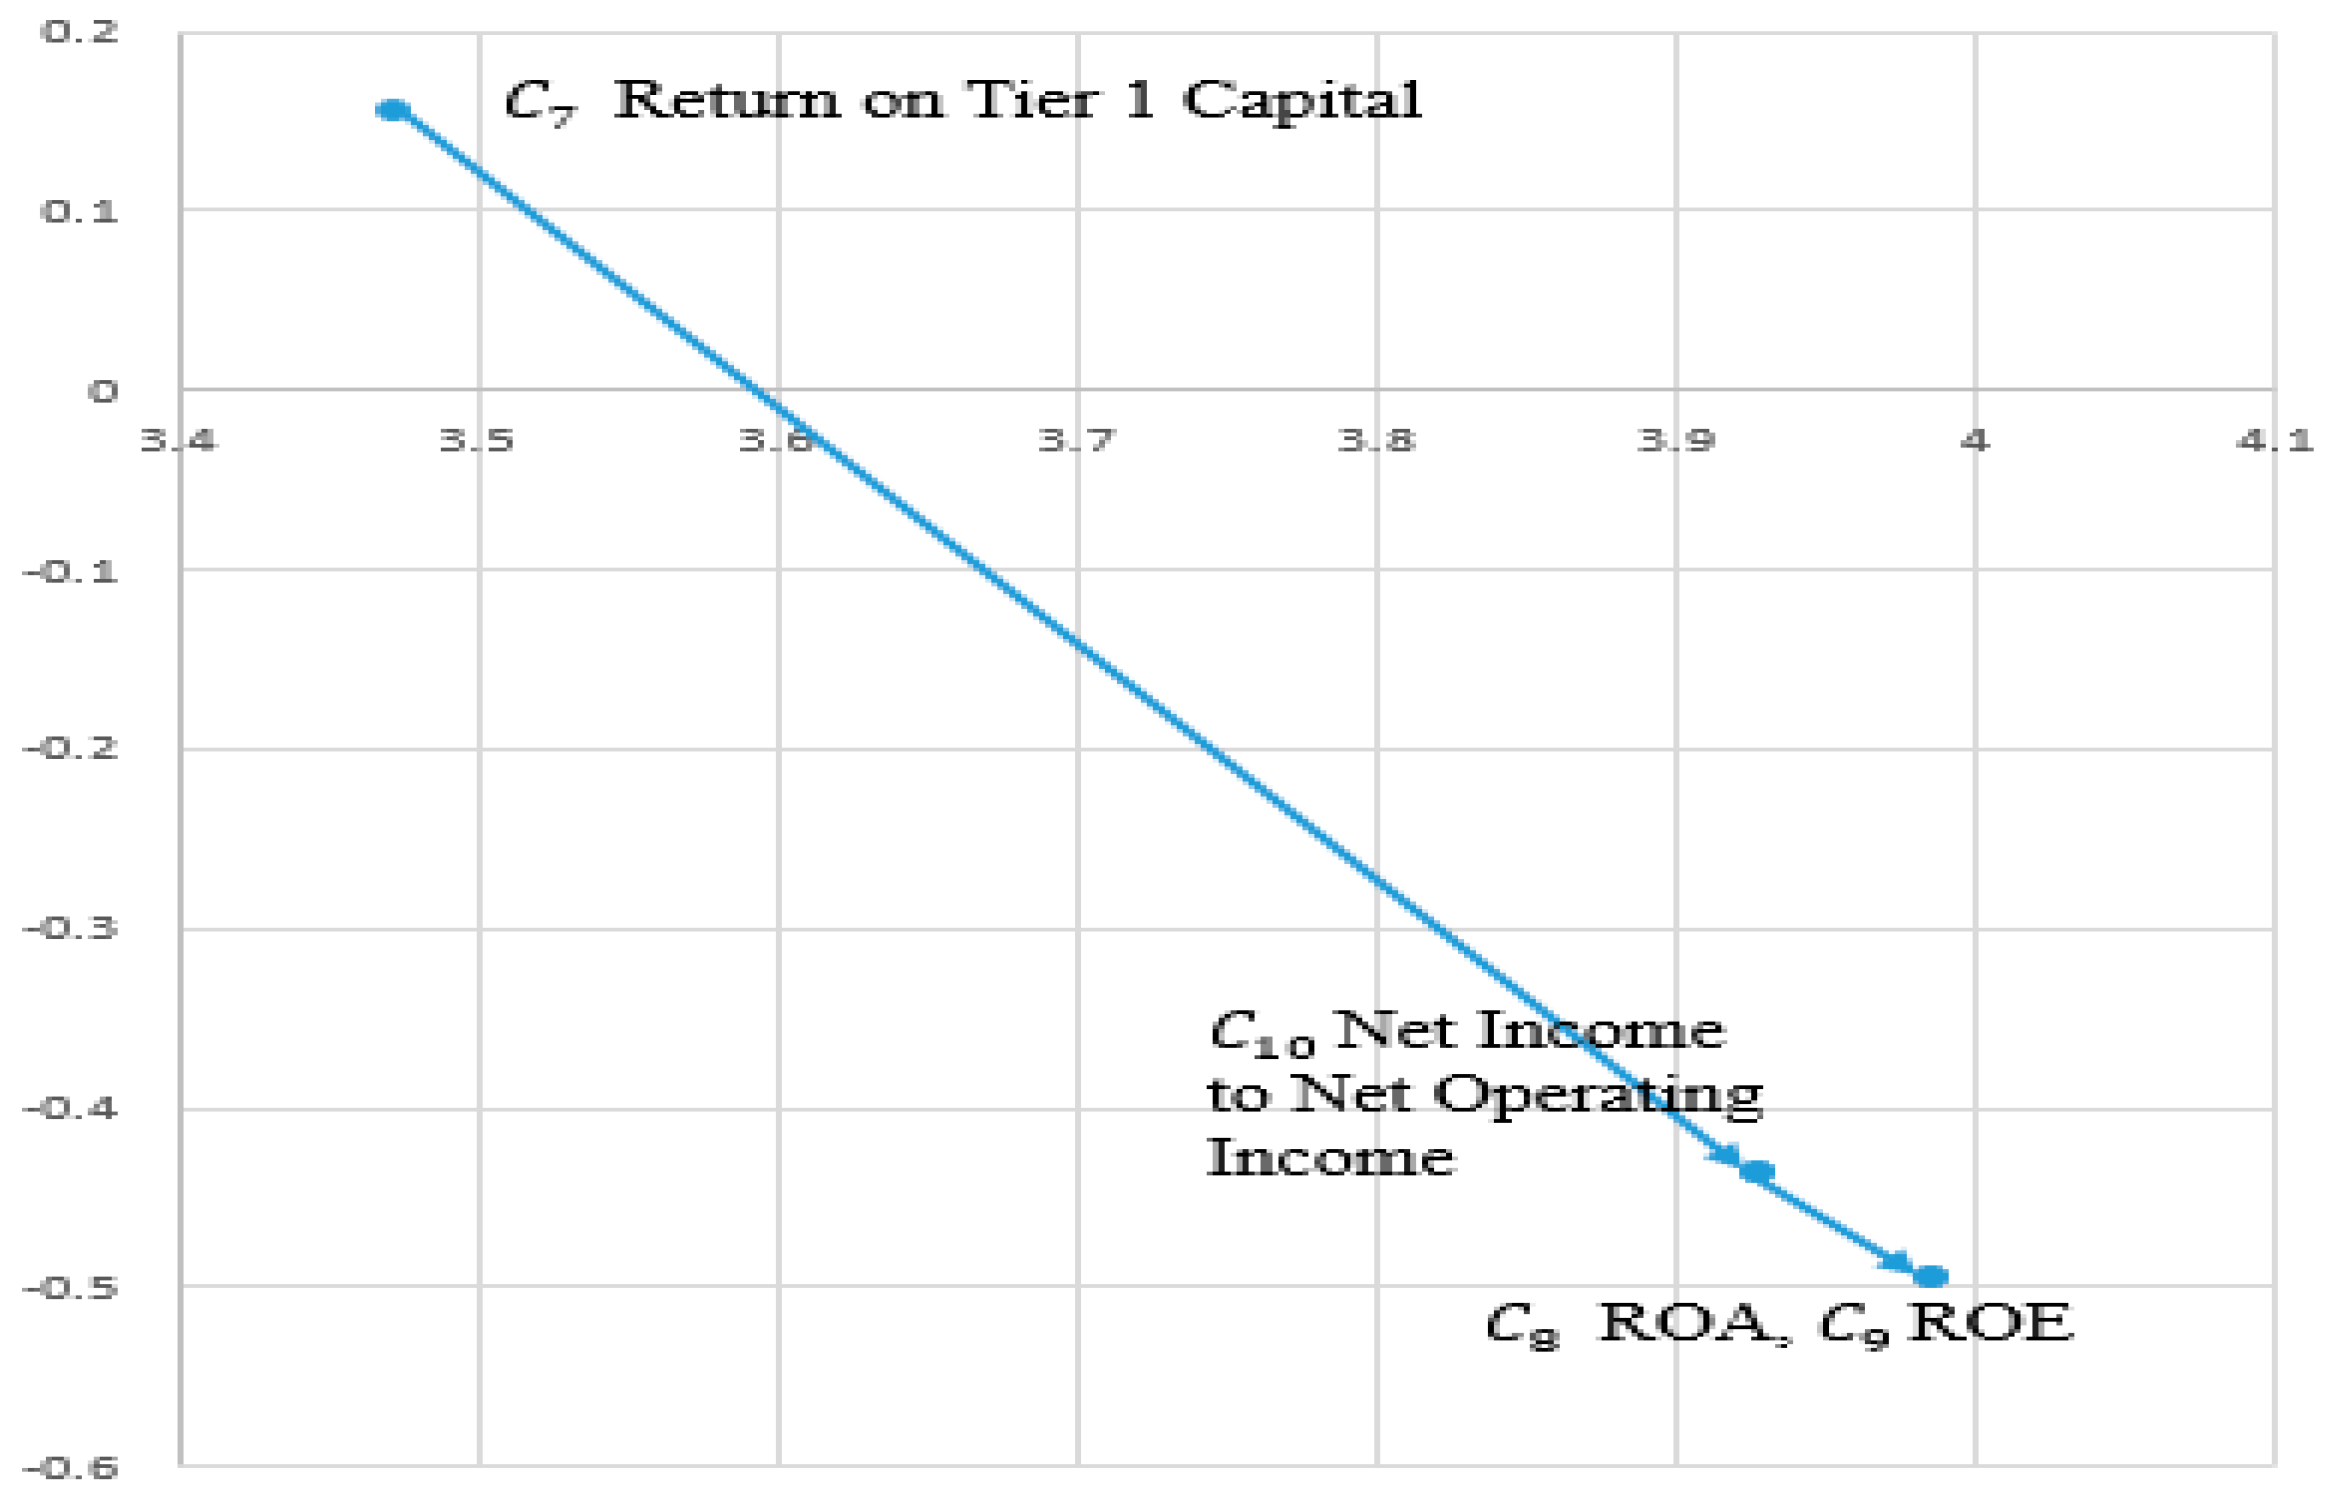
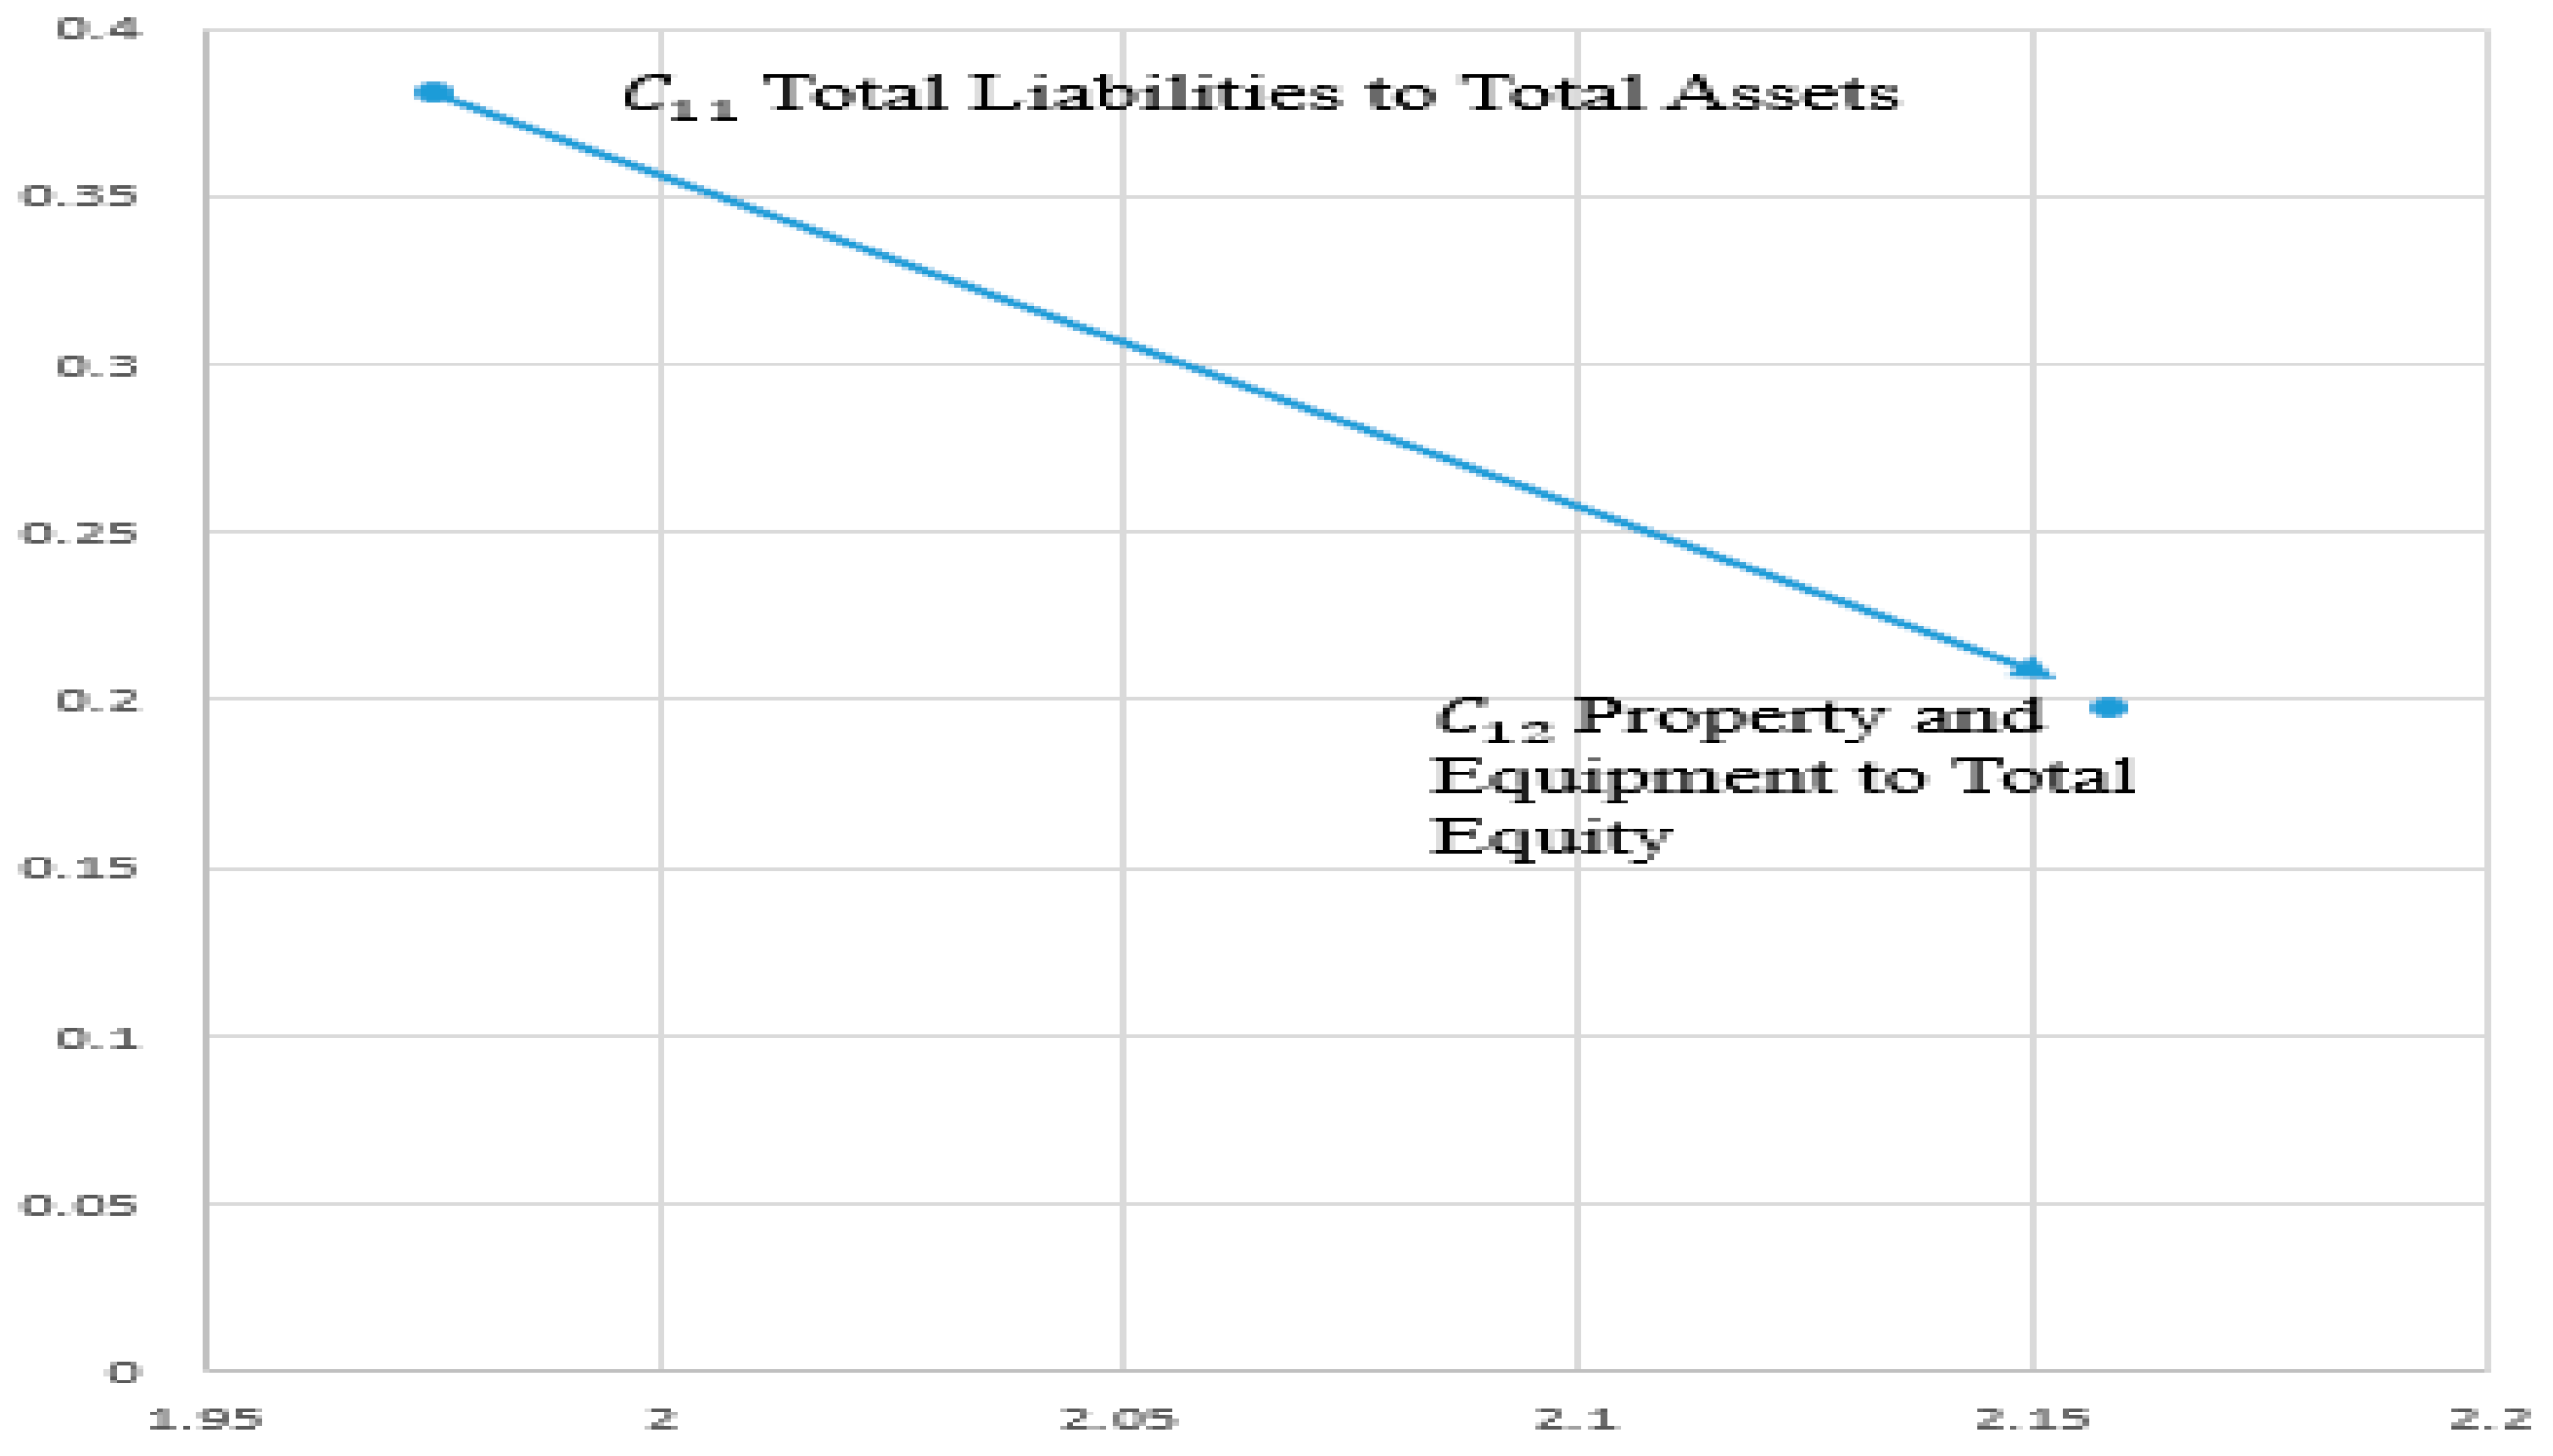
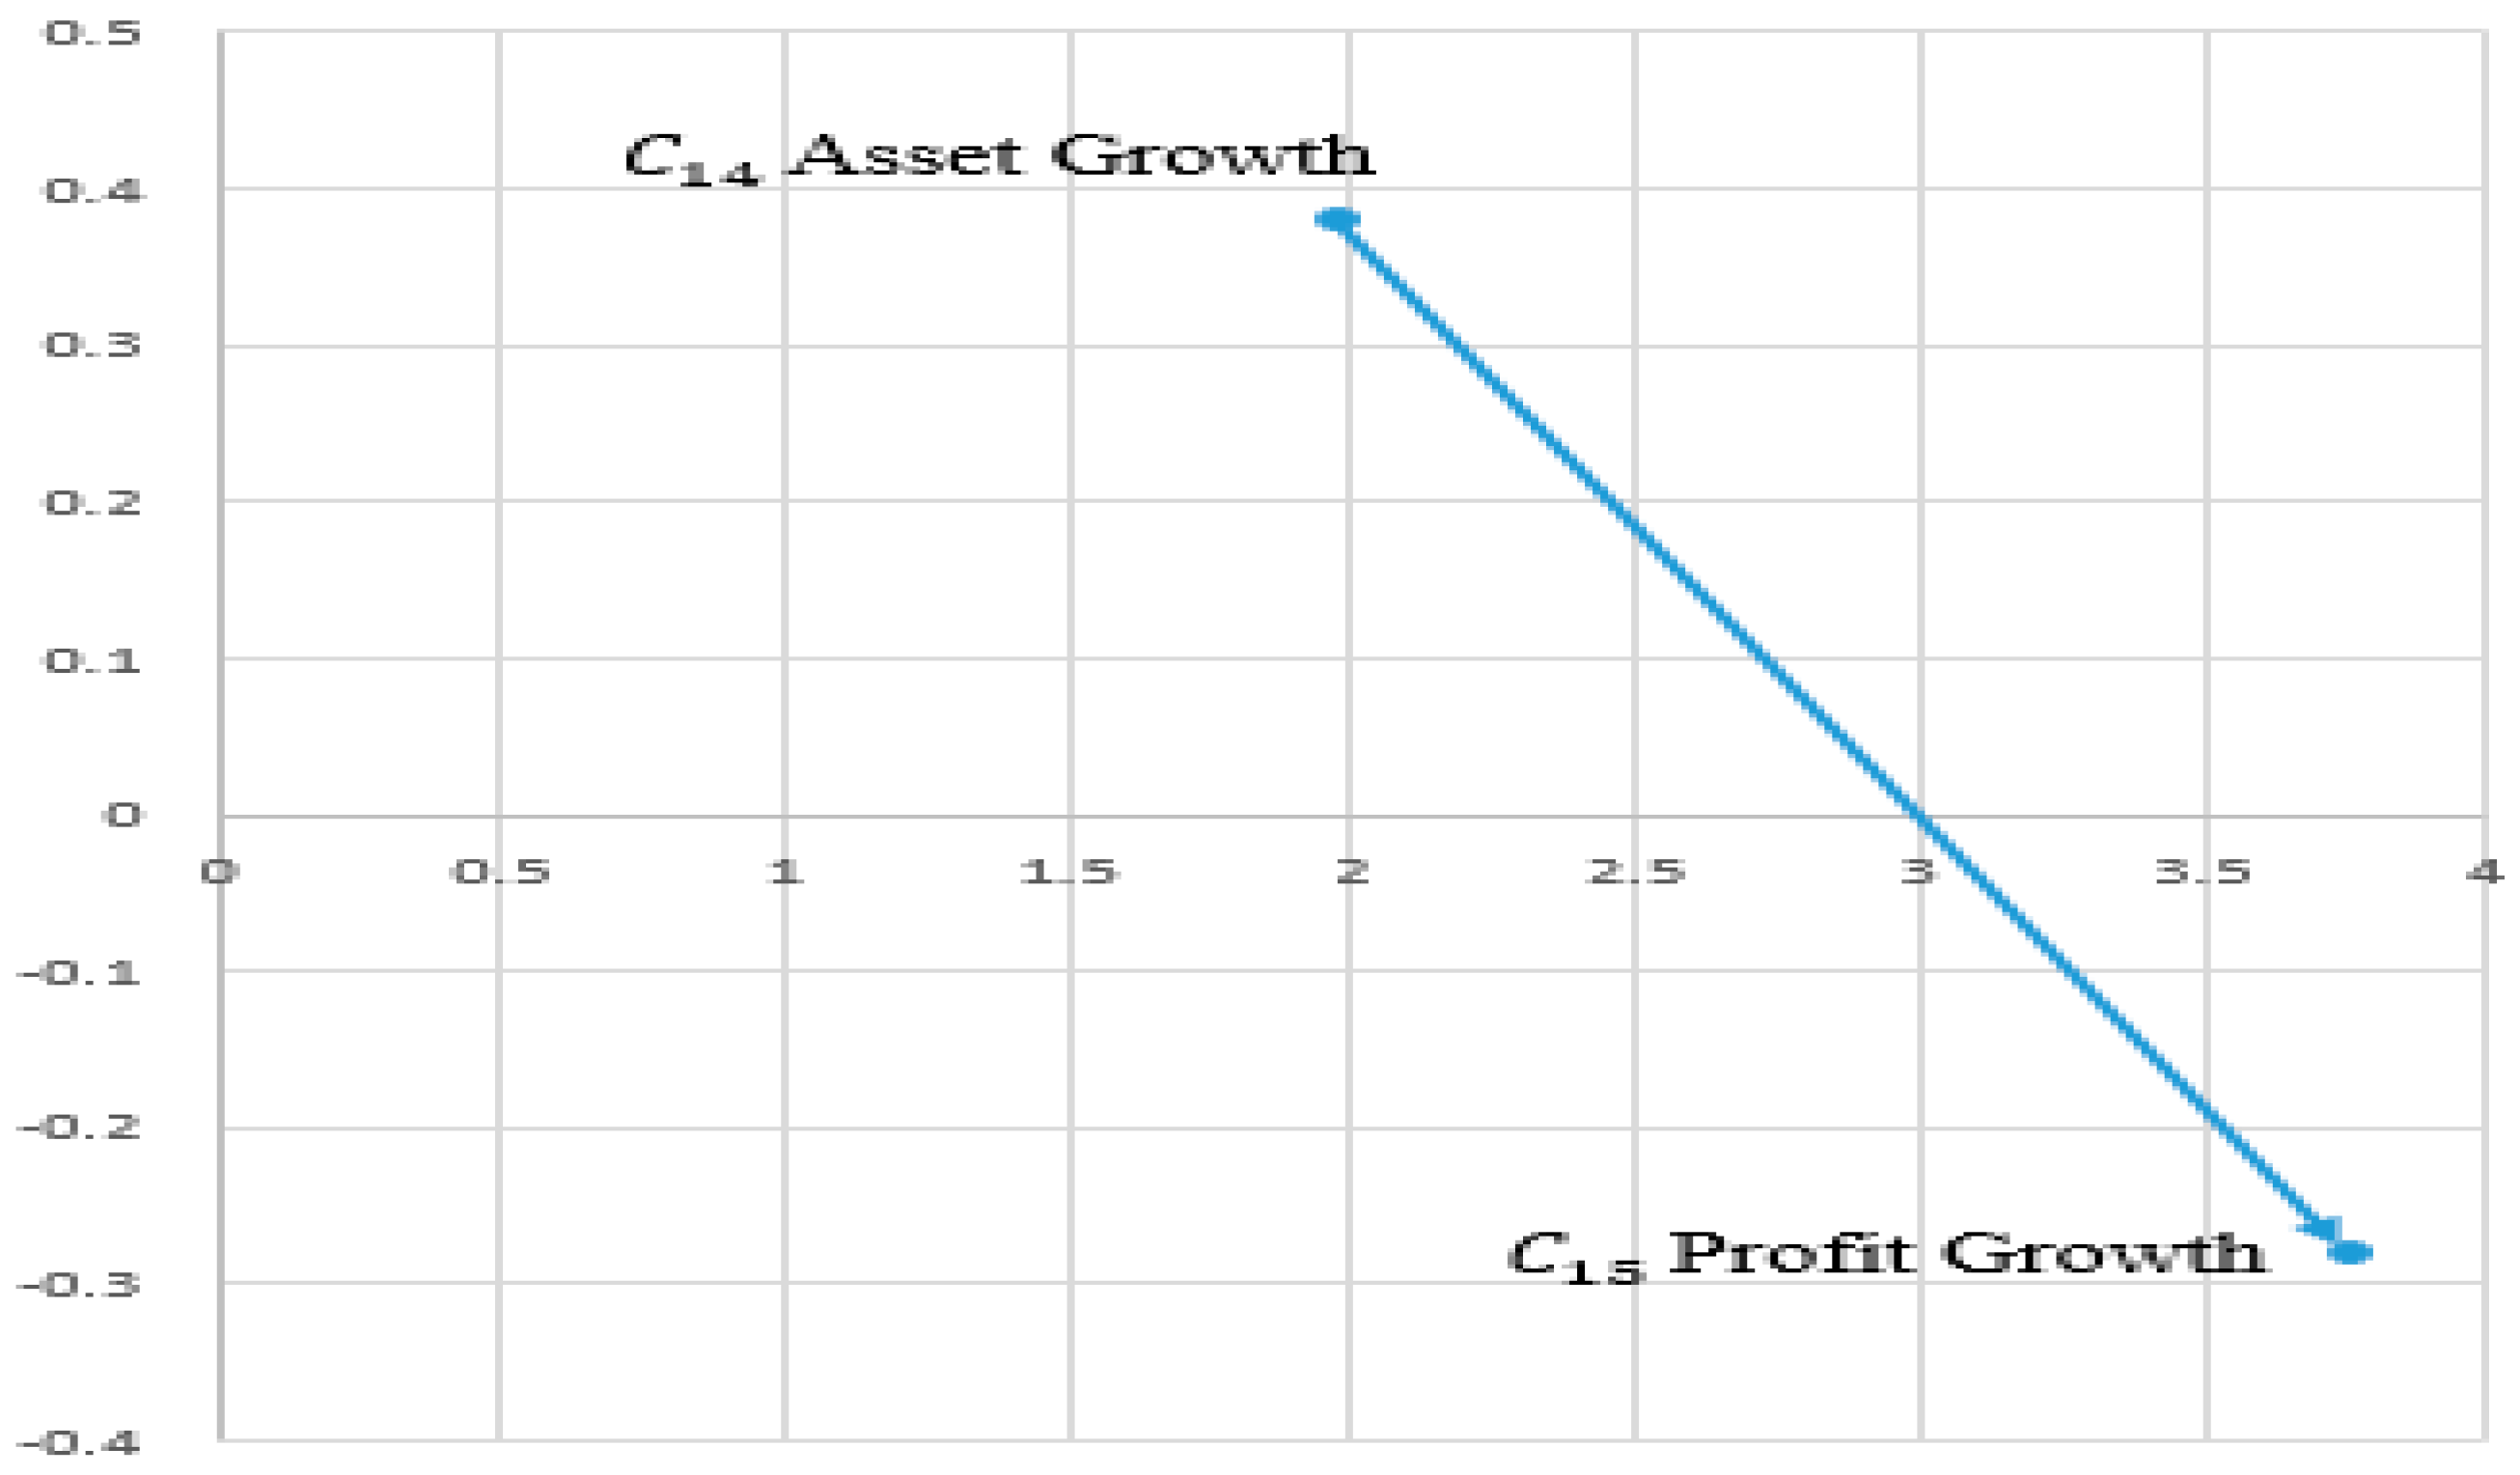
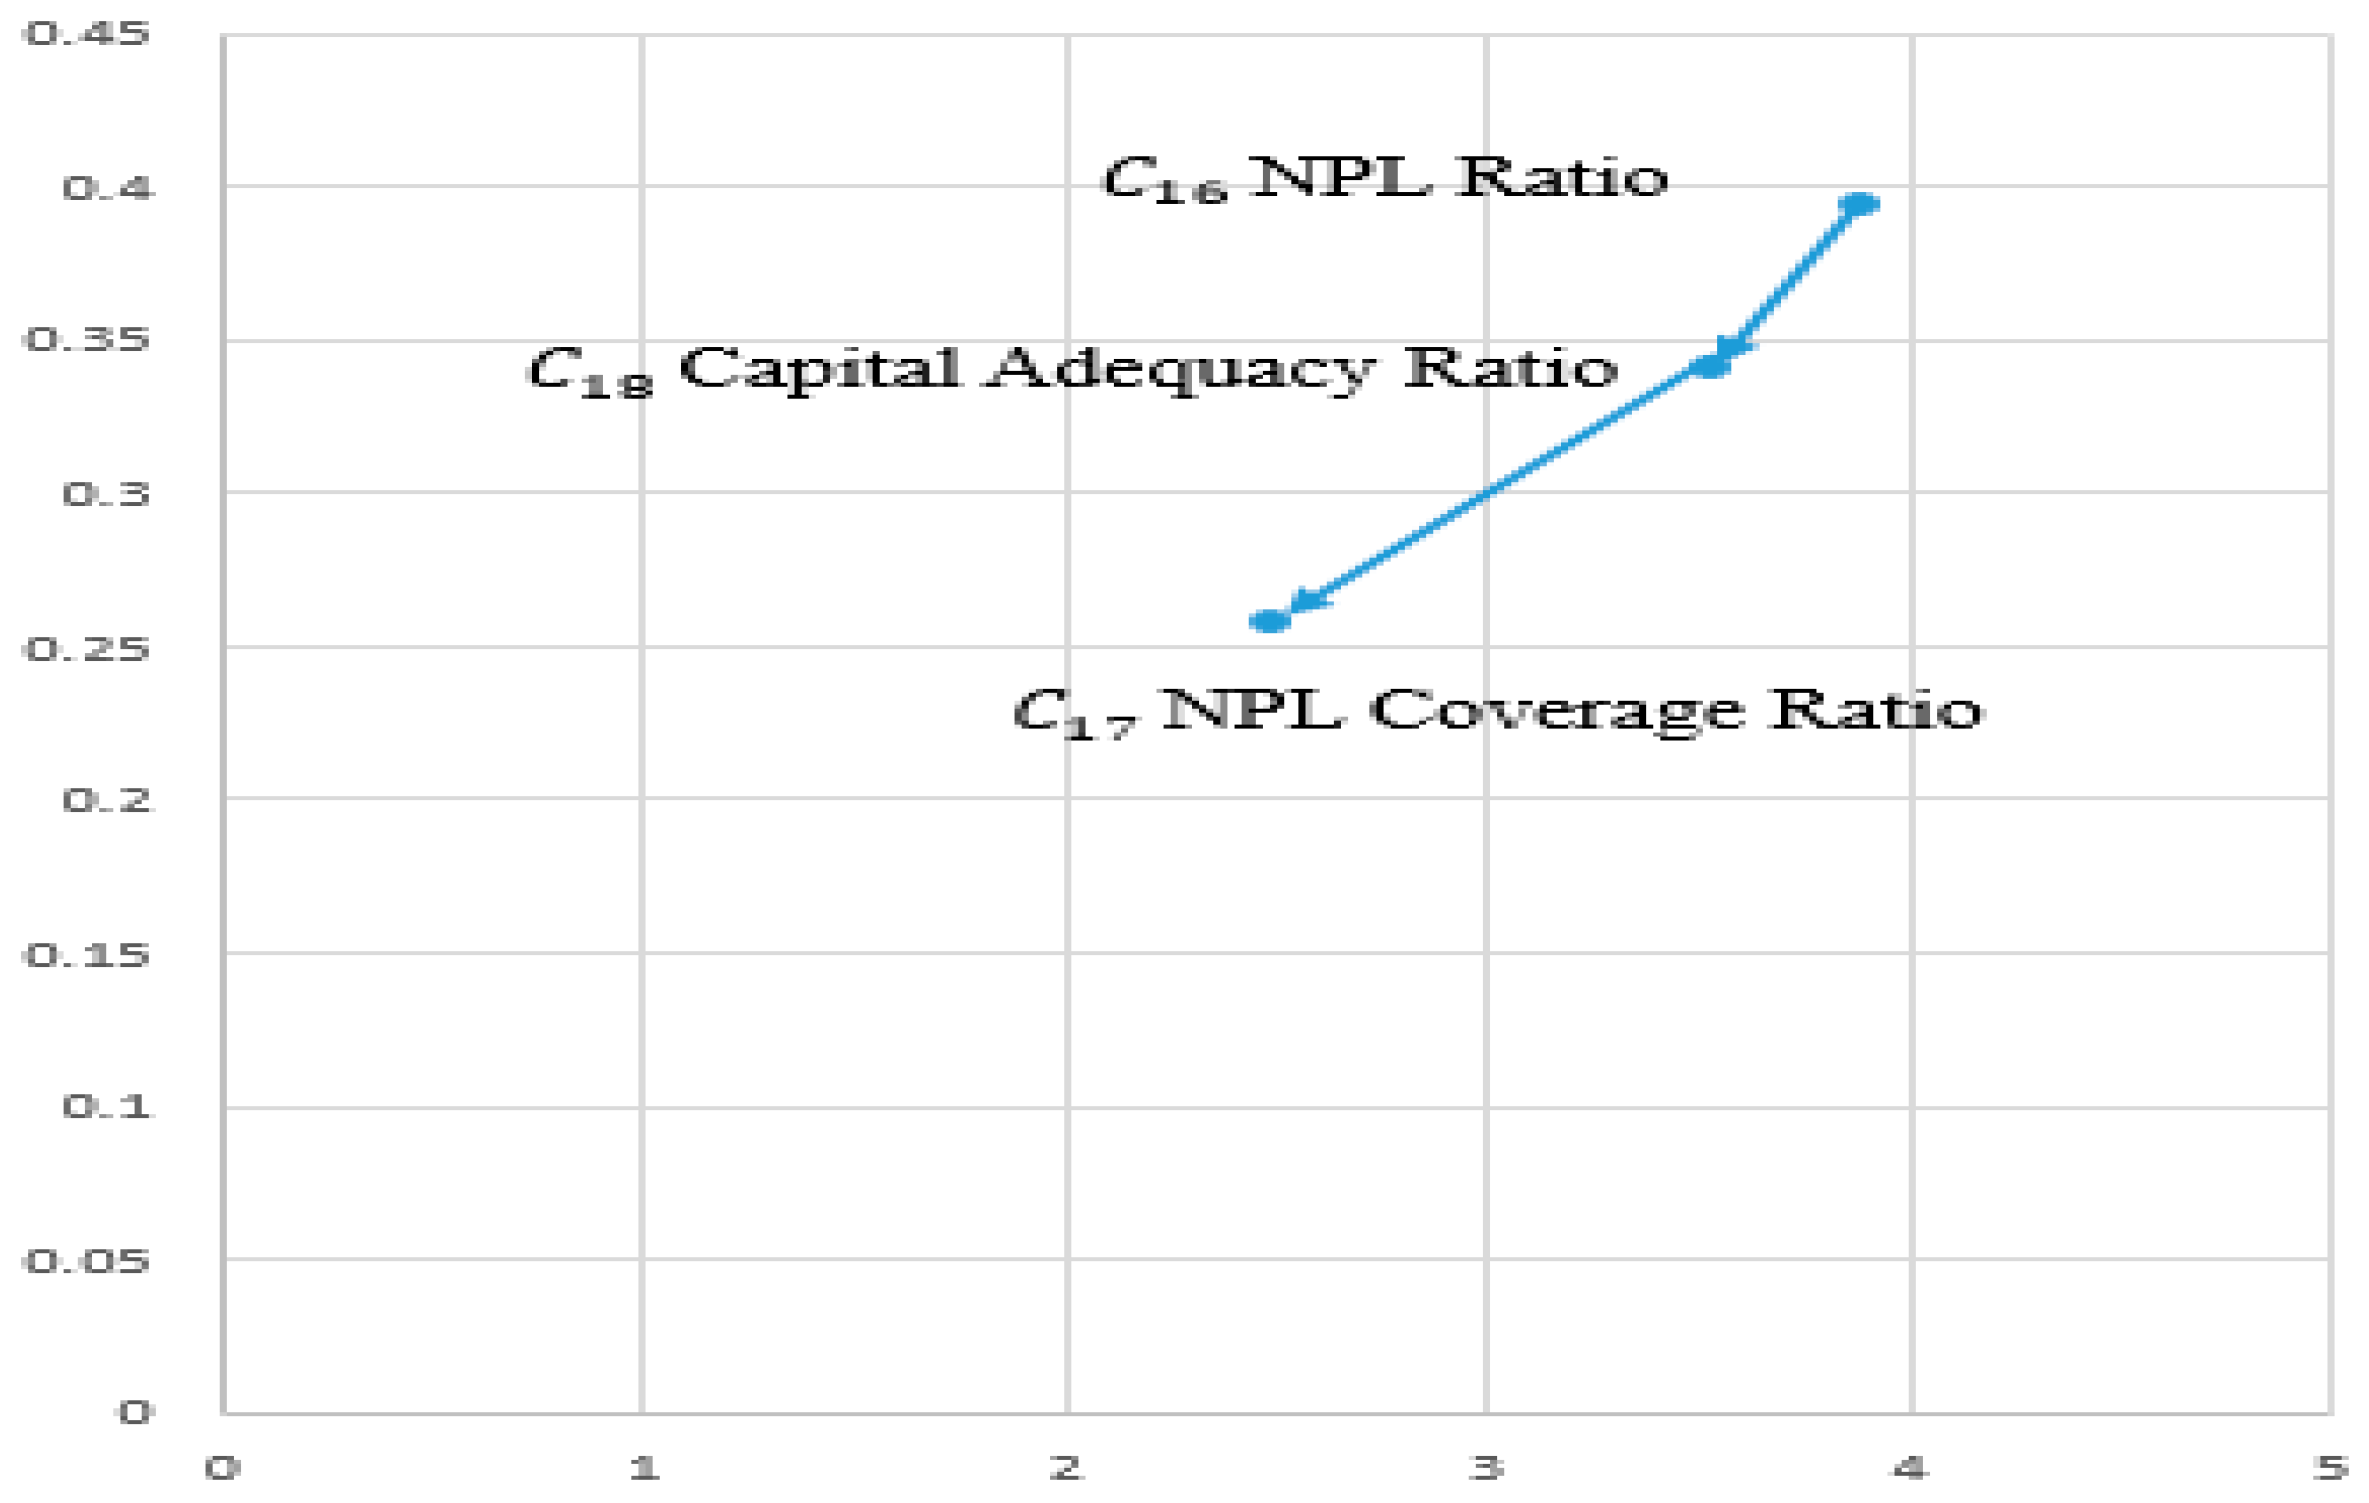
As shown in Table 6 and Figure 2, the analysis of each dimension/criterion reveals that three dimensions—Growth, Operating Performance, and Financial Structure—have greater influence on other dimensions. On the contrary, Earning and Profitability and Asset Quality and Liquidity are more affected by other dimensions. From Figure 3, we can identify two cause–effect relationships: Return on Tier 1 Capital (C7) affects Ratio of Net Income to Net Operating Income (C10), which affects ROA (C8) and ROE (C9). Figure 4 shows that Debt Ratio (C12) affects Ratio of Non-Interest Investments financed by Equity (C13). Figure 5 indicates that Asset Growth (C14) affects Operating Profit Growth Rate (C15). Figure 6 exhibits that NPL Ratio (C16) affects Capital Adequacy Ratio (C18), which affects NPL Coverage Ratio (C17).
4.2. Result of DANP
The utilization of DANP (a combination of DEMATEL and ANP techniques) gives the influential weights for all criteria through three steps.
Step 1. Form an unweighted supermatrix by normalizing the DEMATEL total influence–relation matrix. The unweighted supermatrix is shown in Table 7.
Step 2. Derive the weighted supermatrix. We use Table 7 to construct the weighted supermatrix, as shown in Table 8.
We calculate the limit-weighted supermatrix limz→∞ (W)z to the zth power until the supermatrix has converged and become a stable supermatrix. The globe priority vector is the globe weight wg, which is called the DANP weight (global weight). The sum of each DANP weight should be 100%. Local weight shows the relative weight within a dimension. The sum of criteria local weights in a dimension should be 100%. The final DANP weights are shown as Table 9.
4.3. Result of SAW Technique
The previous studies used SAW to aggregate the final score of the alternatives. We applied this technique to twenty-five Taiwanese banks. The entire data is used to transform the values of the twenty-five banks into performance scores ranging from 0 (worst) to 1 (best) for each criterion. We use a percentile transformation method. For example, if a bank’s loan to deposit ratio is ranked on the top, the performance score for this bank on this particular criterion is 1. The score and ranking of each bank using the SAW technique are listed in Table 10.
In the FHC category, the banks that received the top scores were Cathy United Bank (rank 3 out of 25), Mega Bank (4), and Chinatrust Commercial Bank (5), respectively. The FHCs that received the lowest scores were Jih Sun International Bank (19), Taiwan Cooperative Bank (21), and Bank of Taiwan (23). In the non-FHC category, the banks that received the top scores were King’s Town Bank (1), the Shanghai Commercial & Savings Bank (2), and EnTie Commercial Bank (11). The non-FHCs that received the lowest scores were Taipei Star Bank (22), Taiwan Business Bank (24), and Bank of Kaohsiung (25). The top-performing banks scored above 0.45. Medium-performing banks scored between 0.31 and 0.45. The worst-performing banks below 0.31. The sustainability performance scores of FHC banks and non-FHC banks during the five-year period are listed in Table 11. As shown, the FHC banks have higher scores than non-FHC banks for four years (2012, 2014, 2015, 2016).
Table 12 lists the sustainability performance scores of the private and state-owned banks. The scores of private banks far exceed those of state-owned banks for all five years from 2012 to 2016.
Moreover, we compare banks by their sub-categories. The top categories of banks in sustainability performance are non-FHC corporate-affiliated banks (rank 1), FHCs with insurance companies as the largest subsidiaries (2), and non-FHC private banks (3). Specifically, we see that Cathay United Bank, Fubon Bank, and other financial holding companies with insurance companies as their largest subsidiaries outperform others. The state-owned banks in both FHC and non-FHC categories showed poor performance. Similarly, an FHC with a securities firm as the largest subsidiary falls far below the average score. Table 13 provides the average sustainability performance scores for each type of bank from 2012 to 2016.
4.4. Discussion
This study presents management implications for decision makers of Taiwanese banks to capture key factors of sustainability performance. As shown in Table 11, the results of a hybrid MCDM approach indicate the order of sustainability performance as follows: non-FHC corporate-affiliated banks, FHCs with insurance companies as their largest subsidiaries, FHCs with banks as their largest subsidiaries, non-FHC private banks, FHC state-owned banks, and non-FHC state-owned banks. Bank managers must scrutinize profit and risk simultaneously in order to measure sustainability and gain a better understanding of bank activities. The Taiwanese financial holding companies usually own and operate in banks, insurance companies, and securities firms. The FHCs with insurance companies as their main subsidiaries have the best sustainability performance from the perspective of profit and risk. Investors who are interested in investing in the banking sector should examine not merely the bank subsidiary, but the overall FHC operating results, including insurance company subsidiaries. These FHCs could be placed on the top of the investment list.
The INRM reveals that growth and operating performance have a greater influence on other dimensions of criteria. In the category of operating performance, cost of funds (interest expense divided by average total deposits) and return of loans (interest revenue to average total loans) have the highest influence. Moreover, it is evident to see that NPL ratio in the category of asset quality and liquidity has a high influence on sustainability performance. These results suggest that bank managers must be aware of the high influence of the cost of funds, return of loans, and NPL ratio. In addition, return on Tier 1 capital influences ROA and ROE, debt ratio influences non-interest assets financed by equity, asset growth influences growth profit, and NPL ratio affects capital adequacy ratio. Understanding these cause–effect relationships helps bank managers identify and formulate policies to deal with the sources of problems. For example, if bank managers want to address the problem of a low ratio of net income to net operating income, they may first examine return on Tier 1 capital instead of other factors.
From the DANP result, the criteria are listed in the order of weight (importance), starting with highest: non-performing loan, followed by profit growth rate, debt ratio, capital adequacy ratio, and asset growth. Non-performing loan represents banks’ credit risk when loan customers fail to pay banks the predetermined amount. As shown in INRM, profit growth stems from asset growth. The main assets of banks are loans and securities investments. Non-performing loan ratio and profit growth suggest that, when banks grant loans and make investments in the security markets, they must continually monitor NPL rates. Bank managers should pay more attention to risk than profits to keep their banks sustainable in the long term.
Although it is crucial for banks to grow their interest-bearing assets, such as loans and security investments (stocks and bonds), bank managers should invest more in risk monitoring to keep themselves sustainable. For example, they could design necessary measures to screen out potentially bad loan customers and monitor loan performance to minimize NPL ratio.
Moreover, the findings of this study suggest that focusing purely on asset growth is not optimal. Although asset growth can result in more profits, banks must examine their asset and liability growth. High liability is associated with high costs of funds, leading to lower profits. Bank managers shall use the lower cost of funds when growing their assets and at the same time search for high-value assets. In addition, bank experts may use retained earnings to invest instead of relying on loans excessively.
Although a greater number of loans creates a higher amount of profits, non-performing loans can harm banks’ sustainability. In general, FHC outperformed non-FHC banks from 2012 to 2016. This outcome indicates that financial holding companies may reduce risk through diversification of bank products and service. In addition, when one subsidiary of the financial holding company performs poorly, the other subsidiaries (such as banks and insurance companies) may help increase profits and lower overall risks. This outcome implies that banks can reduce risks by enlarging their business scopes and diversifying financial products and services. The results of this study suggest that it is desirable for small banks to be merged with a larger financial institution to increase their sustainability performance. Moreover, the outcome of this study highlights that private banks outperformed state-owned banks from 2012 to 2016, suggesting that private banks are more sensitive to lower-quality loans and increases of high-quality assets, thus taking the necessary approaches to deal with this problem. Therefore, the Taiwanese government should continue to encourage bank privatization in order to enhance sustainability.
The top-performing bank in sustainability performance is King’s Town Bank. It was founded in 1980 and is financially supported by King Group with construction companies and hotels. Most of the bank’s customers are associated with the parent company; therefore, the customers have lower credit risks. This type of business model is a new banking system, in which banks exist to support a parent company’s customers in providing credits to their businesses. This model is sustainable so long as the parent company continues to work with good customers. These findings indicate the importance of customer referrals. Banks should have more customer referrals in order to both increase their growth and minimize their risks.
Contrary to the conventional wisdom that ROA and return on equity (ROE) are the primary ratios to judge banks’ success, this study finds that reduction of NPL ratio—not the pursuit of profits—is the key to banks’ sustainability. Therefore, bank policymakers should choose to grow more slowly and seek higher-quality assets to stay in business longer. Bank managers should be trained to be highly sensitive to the risk of loans or investments by monitoring the criteria, such as NPL loan or capital adequacy ratio. Banks should take actions or set policies to prevent NPL loans by examining customers more carefully before granting loans and constantly observing customers’ abilities to repay debt.
In short, the results of this study give implications to both bank managers and government authorities. Bank managers can enhance their sustainability by controlling risks and diversifying financial products/services. Government agencies may encourage bank mergers and privatization to keep banks sustainable and help stabilize the economy.
The limitation of the ranking models is that banks with different asset sizes and business scopes may not be compared and ranked on the same scale. Moreover, the screening process of the variables depends on the knowledge of the experts about the bank’s circumstances.
5. Conclusions, Limitations and Future Research
5.1. Conclusions
Taiwanese banks have faced severe competition and challenge for globalization over the last several decades. We utilize a performance evaluation model to help bank managers understand the critical factors that affect bank sustainability. This study applies a hybrid MCDM model incorporating DEMATEL, DANP, and SAW techniques to assess the sustainability performance of all Taiwanese listed banks.
First, we focus on operating performance analysis, which reflects bank business operation. Initially, a list of objective financial ratios and indicators were chosen as criteria from five dimensions: operating performance, earnings and profitability, financial structure (debt and equity), growth, and asset quality and liquidity. Then, bank experts provided opinions on the relevance and importance of criteria. Hence, a final list of criteria was decided for this study.
The data collected from the monthly financial statements of twenty-five Taiwanese listed bank during the period from 2012 to 2016 was analyzed using a three-step procedure. First, the DEMATEL technique in the MCDM model demonstrates to decision makers the critical bank sustainability factors through the influential network of INRM. The two most influential dimensions of bank sustainability performance are financial structure and operating performance, which affect three other dimensions: earnings and profitability, growth, and asset quality and liquidity.
Second, the DANP technique in the hybrid MCDM model does not treat every criterion independently and equally. It indicates the influential weight for each criterion in order to identify the most important factors affecting sustainability performance. The top five criteria with the highest weight are NPL ratio, profit growth rate, debt ratio, capital adequacy ratio, and asset growth. Such results imply that risks represented by NPL ratio, debt ratio, capital adequacy ratio are more important than growth represented by profit growth rate and asset growth; and that risk minimization plays a more important role than the pursuit of high growth and profits in ensuring bank sustainability.
Third, we used the SAW technique in the hybrid MCDM model to compute the final score for each bank with a distinct score and weight. Such information provides decision makers with an overall picture of bank sustainability performance. We divided the banks into FHC banks (state-owned banks, FHCs with banks as the largest subsidiaries, FHCs with insurance companies as the largest subsidiaries, FHCs with security firms as the largest subsidiaries) and non-FHC banks (state-owned banks, private banks, and company-affiliated banks). Based on the empirical results of SAW technique, the types of banks with the highest sustainability performance are non-FHC company affiliated banks, financial holding companies with insurance companies as their largest subsidiaries, and financial holding companies with banks as their main business. Such an outcome suggests that banks that are owned by corporations have steady and high-quality customers. In addition, financial holding companies that have insurance companies instead of banks as their largest subsidiaries enjoy high-quality assets, lower debt, and credit risk. Financial holding companies that have banks as their largest subsidiaries can be strengthened by selling fee-income products, such as insurance and securities.
Private banks achieve a similar level of sustainability performance as FHCs with banks as their largest subsidiaries, although these private banks are not owned by a large financial holding company. This implies that private banks are more efficient in managing their assets and liabilities in creating higher profits and lower risks. In contrast, state-owned banks under both FHCs and non-FHCs have lower sustainability performance, probably because they tend to rely on the government support for customers and funding, thus ignoring the development of their sustainability strategies among the fierce global competition. In general, FHC banks outperformed non-FHC banks, and private banks outperformed state-owned banks. These findings indicate that FHC banks are more sustainable because they diversify their risks and create higher profits through other businesses, such as selling of insurance and security trading. Private banks display a higher awareness of risk exposure; therefore, private banks formulate strategies to minimize risks and enlarge returns. Such results suggest that governments should continue to encourage the privatization of banks.
In order to track the performance indicators identified in this study, banks managers could use an ERP system which integrates all relevant information, such as deposit, loan, NPL, etc. in a single database. This is an important step that aid bank practitioners in ensuring bank sustainability. A master plan incorporating roadmap, framework, and guidelines can be developed with the participants’ involvement and testing. Bank top managers should evaluate such an ERP system regularly after implementation. Changes in the business process to align with ERP functions could further account for the sustainable implementation of ERP.
This paper makes several contributions to the banking industry literature. First, this study selects objective financial ratios and indicators to measure banking sustainability, and these factors were verified by experts to ensure their relevance. Second, this paper establishes a hybrid MCDM model incorporating the DEMATEL, DANP, and SAW techniques to evaluate bank sustainability performance. This integrated model provides a structure exhibiting the order of importance in the system for decision makers to comprehend the priority of alternatives in a multiple-criteria environment. Third, we divided the listed banks into several categories and compared FHC and non-FHC banks, and private and public banks. We further analyzed FHCs by categorizing them with either banks or insurance companies as their largest subsidiaries. Such classification provides evidence for investors and bank managers as to what types of banks are more sustainable, so that they may formulate their business strategies accordingly.
5.2. Limitations and Future Research
This paper has two limitations. First, the data is limited to Taiwanese listed banks. It would be interesting to compare banks in Taiwan, Hong Kong, and China because investors are likely to invest in the greater China area. Second, the criteria in this study are financial, which may be inadequate to measure the actual performance of financial institutions. In the future, non-financial criteria—such as board composition, political connection, government regulation, and corporate governance—may be added to explore bank sustainability performance further.
Author Contributions
A.L. analyzed the data. H.Y.C. designed the research framework, analyzed the data, and wrote the paper.
Funding
This research received no external funding.
Acknowledgments
We thank Wei Chung Yu for organizing the data in the MCDM model.
Conflicts of Interest
The authors declare no conflict of interest.
References
- Chu, C.C.; Teng, Y.M.; Lee, H.L. Corporate Governance and Mergers and Acquisitions Performance in Banks: Evidence under the Special Regulatory Environment in Taiwan. Emerg. Mark. Financ. Trade 2016, 52, 2309–2320. [Google Scholar] [CrossRef]
- Hwang, D.Y.; Wu, W.H. Financial system reform in Taiwan. J. Asian Econ. 2007, 18, 21–41. [Google Scholar] [CrossRef]
- Healy, P.M.; Palepu, K.G. Information Asymmetry, Corporate Disclosure, and the Capital Markets: A Review of the Empirical Disclosure Literature. J. Account. Econ. 2001, 31, 405–440. [Google Scholar] [CrossRef]
- Taiwan Stock Exchange Corporation (TWSE) Official Website. Corporate Social Responsibility Best Practice Principles for TWSE/GTSM Listed Companies. 2019. Available online: http://twse-regulation.twse.com.tw/ENG/EN/law/DAT0201.aspx?FLCODE=FL052368 (accessed on 9 April 2019).
- Fiscal Supervisory Commission (FSC) Official Website. Banking Bureau. 2019. Available online: https://www.banking.gov.tw/en/home.jsp?id=20&parentpath=0,6 (accessed on 9 April 2019).
- Iannotta, G.; Nocera, G.; Sironi, G. The Impact of Government Ownership on Bank Risk. J. Financ. Intermed. 2013, 222, 152–176. [Google Scholar] [CrossRef]
- Shen, C.H.; Wu, M.W.; Chen, T.H. To Engage or Not to Engage in Corporate Social Responsibility: Empirical Evidence from Global Banking Sector. Econ. Model. 2016, 55, 207–225. [Google Scholar] [CrossRef]
- Liang, L.W.; Chang, H.Y.; Shao, H.L. Does sustainability make banks more cost efficient? Glob. Financ. J. 2018, 38, 13–23. [Google Scholar] [CrossRef]
- Dyllick, T.; Hockerts, K. Beyond the business case for corporate sustainability. Bus. Strategy Environ. 2002, 11, 130–141. [Google Scholar] [CrossRef]
- Huang, J.Y.; Shen, K.Y.; Shieh, J.C.; Tzeng, G.H. Strengthen Financial Holding Companies’ Business Sustainability by Using a Hybrid Corporate Governance Evaluation Model. Sustainability 2019, 11, 582. [Google Scholar] [CrossRef]
- Funk, K. Sustainability and performance. MIT Sloan Manag. Rev. 2003, 44, 65–70. [Google Scholar]
- Kao, M.C.; Lin, C.T.; Xu, L. Do financial reforms improve the performance of financial holding companies? The case of Taiwan. Int. Rev. Financ. 2012, 12, 491–509. [Google Scholar] [CrossRef]
- Lai, L.H.; Hung, L.C.; Kuo, C.J. Do Well-Financial Holding Company Organized Banks in Taiwan Take More Risk? Rev. Pac. Basin Financ. Mark. Pol. 2016, 19, 1650024. [Google Scholar] [CrossRef]
- Cheng, C.P.; Liang, L.W.; Huang, C.T. Effect of Internationalization on the Cost Efficiency of Taiwan’s Banks. Emerg. Mark. Financ. Trade 2014, 50, 204–228. [Google Scholar] [CrossRef]
- Chiou, C.C. Effects of Financial Holding Company Act on bank efficiency and productivity in Taiwan. Neurocomputing 2009, 72, 3490–3506. [Google Scholar] [CrossRef]
- Huang, C.L.; Kuo, B.Y. The impact of credit rating, ownership and relationships on loan Spreads-Taiwan’s evidence. Asian J. Financ. Account. 2014, 6, 19–52. [Google Scholar] [CrossRef]
- Yang, C.C. Service, investment, and risk management performance in commercial banks. Serv. Ind. J. 2012, 32, 2005–2025. [Google Scholar] [CrossRef]
- Mohanty, S.K.; Lin, W.T.; Lin, H.J. Measuring cost efficiency in presence of heteroskedasticity: The case of the banking industry in Taiwan. J. Int. Financ. Mark. Inst. Money 2013, 26, 77–90. [Google Scholar] [CrossRef]
- Chao, C.M.; Yu, M.M.; Lee, Y.T.; Hsiao, B. Measurement of Banking Performance in a Dynamic Multiactivity Network Structure: Evidence from Banks in Taiwan. Emerg. Mark. Financ. Trade 2017, 53, 786–805. [Google Scholar] [CrossRef]
- Park, K. The Relationship between BPR Strategy and Change Management for the Sustainable Implementation of ERP: An Information Orientation Perspective. Sustainability. 2018, 9, 3080. [Google Scholar] [CrossRef]
- Chofreh, A.G.; Goni, F.A.; Ismail, S.; Shaharoun, A.M.; Klemeš, J.J.; Zeinalnezhad, M. A master plan for the implementation of sustainable enterprise resource planning systems (part I): Concept and methodology. J. Clean. Prod. 2016, 136, 176–182. [Google Scholar] [CrossRef]
- Chofreh, A.G.; Goni, F.A.; Klemeš, J.J. A roadmap for Sustainable Enterprise Resource Planning systems implementation (part III). J. Clean. Prod. 2017, 174, 1325–1337. [Google Scholar] [CrossRef]
- Chofreh, A.G.; Goni, F.A.; Klemeš, J.J. Development of a Roadmap for Sustainable Enterprise Resource Planning System Implementation (Part II). J. Clean. Prod. 2017, 166, 425–437. [Google Scholar] [CrossRef]
- Chofreh, A.G.; Goni, F.A.; Klemeš, J.J. Sustainable enterprise resource planning systems implementation: A framework development. J. Clean. Prod. 2018, 198, 1345–1354. [Google Scholar] [CrossRef]
- Huang, M.Y.; Fu, T.T. An examination of the cost efficiency of banks in Taiwan and China using the metafrontier cost function. J. Prod. Anal. 2013, 40, 387–406. [Google Scholar] [CrossRef]
- Deng, D.; Wen, S.; Chen, F.H.; Lin, S.L. A hybrid multiple criteria decision making model of sustainability performance evaluation for Taiwanese Certified Public Accountant firms. J. Clean. Prod. 2018, 180, 603–616. [Google Scholar] [CrossRef]
- Mardani, A.; Jusoh, A.; Nor, K.M.D.; Khalifah, Z.; Zakwan, N.; Valipour, A. Multiple criteria decision-making techniques and their applications—A review of the literature from 2000 to 2014. Econ. Res. 2015, 28, 516–571. [Google Scholar] [CrossRef]
- Soltani, A.; Hewage, K.; Reza, B.; Sadiq, R. Multiple stakeholders in multi-criteria decision-making in the context of Municipal Solid Waste Management: A review. Waste Manag. 2015, 35, 318–328. [Google Scholar] [CrossRef]
- Zolfani, S.H.; Zavadskas, E.K.; Khazaelpour, P.; Cavallaro, F. The Multi-Aspect Criterion in the PMADM Outline and Its Possible Application to Sustainability Assessment. Sustainability 2018, 10, 4451. [Google Scholar] [CrossRef]
- Opricovic, S.; Tzeng, G.H. Comparing DEA and MCDM method. Adv. Soft Comput. 2003, 21, 227–232. [Google Scholar] [CrossRef]
- Yang, W.; Zhao, B.; Zhao, J.; Li, Z. An Empirical Study on the Impact of Foreign Strategic Investment on Banking Sustainability in China. Sustainability 2019, 11, 181. [Google Scholar] [CrossRef]
- Malhotra, R.; Malhotra, D. Differentiating between good credits and bad credits using neuro-fuzzy systems. Eur. J. Oper. Res. 2002, 136, 190–211. [Google Scholar] [CrossRef]
- Levine, R. Finance and Growth: Theory and Evidence. In Handbook of Economic Growth, 1st ed.; Aghion, P., Durlauf, S., Eds.; Elsevier: Amsterdam, The Netherlands, 2005; Volume 1, Chapter 12; pp. 865–934. [Google Scholar]
- Beck, T.; Demirgüç-Kunt, A.; Levine, R. Financial Institutions and Markets across Countries and Over Time: The Updated Financial Development and Structure Database. World Bank Econ. Rev. 2010, 24, 77–92. [Google Scholar] [CrossRef]
- Kartadjumena, E.; Rodgers, W. Executive Compensation, Sustainability, Climate, Environmental Concerns, and Company Financial Performance: Evidence from Indonesian Commercial Banks. Sustainability 2019, 11, 1673. [Google Scholar] [CrossRef]
- Wu, M.W.; Shen, C.H. Corporate Social Responsibility in the Banking Industry: Motives and Financial Performance. J. Bank. Financ. 2013, 37, 3529–3547. [Google Scholar] [CrossRef]
- Altman, E.I. Financial ratios, discriminant analysis and the prediction of corporate bankruptcy. J. Financ. 1968, 23, 589–609. [Google Scholar] [CrossRef]
- West, R.C. A factor-analytic approach to bank condition. J. Bank. Financ. 1985, 9, 253–266. [Google Scholar] [CrossRef]
- Hays, F.H.; De Lurgio, S.A.; Gilbert, A.H. Efficiency ratios and community bank performance. J. Financ. Account. 2009, 1, 1–15. [Google Scholar]
- Shaverdi, M.; Ramezani, I.; Tahmasebi, R.; Rostamy, A.A.A. Combining fuzzy AHP and fuzzy TOPSIS with financial ratios to design a novel performance evaluation model. Int. J. Fuzzy Syst. 2016, 18, 248–262. [Google Scholar] [CrossRef]
- Presley, A.; Meade, L.; Sarkis, J. A strategic sustainability justification methodology for organizational decisions: A reverse logistics illustration. Int. J. Prod. Res. 2007, 45, 4595–4620. [Google Scholar] [CrossRef]
- Soppe, A. Sustainable finance as a connection between corporate social responsibility and social responsible investing. Indian Sch. Bus. WP-Indian Manag. Res. J. 2009, 1, 13–23. [Google Scholar]
- Weber, O. Corporate sustainability and financial performance of Chinese banks. Sustain. Account. Manag. Policy J. 2017, 8, 358–385. [Google Scholar] [CrossRef]
- Albertini, E. Does environmental management improve financial performance? A meta-analytical review. Organ. Environ. 2013, 26, 431–457. [Google Scholar] [CrossRef]
- Dixon-Fowler, H.R.; Slater, D.J.; Johnson, J.L.; Ellstrand, A.E.; Romi, A.M. Beyond “Does it pay to be green?” a meta-analysis of moderators of the CEP–CFP relationship. J. Bus. Ethics 2013, 112, 353–366. [Google Scholar] [CrossRef]
- Friede, G.; Busch, T.; Bassen, A. ESG and financial performance: Aggregated evidence from more than 2000 empirical studies. J. Sustain. Financ. Investig. 2015, 5, 210–233. [Google Scholar] [CrossRef]
- Al-Mamun, M.; Sohog, K.; Akhter, A. A dynamic panel analysis of the financial determinants of CSR in Bangladeshi banking industry. Asian Econ. Financ. Rev. 2013, 3, 560–578. [Google Scholar]
- Taiwan Stock Exchange Corporation (TWSE) Official Website. Market Observation Post System. 2019. Available online: http://cgc.twse.com.tw/frontEN/index (accessed on 9 April 2019).
- Battese, G.E.; Coelli, T.J. A model for technical inefficiency effects in a stochastic frontier production function for panel data. Empir. Econ. 1995, 20, 325–332. [Google Scholar] [CrossRef] [Green Version]
- Battese, G.E.; Rao, D.S.P.; O’Donnell, C.J. A metafrontier production function for estimation of technical efficiencies and technology gaps for firms operating under different technologies. J. Prod. Anal. 2004, 21, 91–103. [Google Scholar] [CrossRef]
- Huang, C.J.; Huang, T.H.; Liu, N.H. A new approach to estimating the metafrontier production function based on a stochastic frontier framework. J. Prod. Anal. 2014, 42, 241–254. [Google Scholar] [CrossRef]
- Chen, G.; Wang, J. Analysis on Performance Evaluation System of ERP Implementation. In Proceedings of the 2010 International Conference of Information Science and Management Engineering, ISME 2010, Xi’an, China, 7–8 August 2010; Volume 1, pp. 185–188. [Google Scholar] [CrossRef]
- De Laat, B.; Mckibbin, S. The Effectiveness of Technology Road Mapping: Building a Strategic Vision; Dutch Ministry of Economic Affairs: Den Hague, The Netherlands, 2003.
- Zhang, Z.; Lee, M.; Huang, P.; Zhang, L.; Huang, X. A framework of ERP systems implementation success in China: An empirical study. Int. J. Prod. Econ. 2005, 98, 56–80. [Google Scholar] [CrossRef]
- Simpson, W.; Kohers, T. The Link between Social and Financial Performance: Evidence from the Banking Industry. J. Bus. Ethics 2002, 35, 97–109. [Google Scholar] [CrossRef]
- Fontela, E.; Gabus, A. The DEMATEL Observer, DEMATEL 1976 Report; Battelle Geneva Research Center: Geneva, Switzerland, 1976. [Google Scholar]
- Peng, K.H.; Tzeng, G.H. A hybrid dynamic MADM model for problems-improvement in economics and business. Technol. Econ. Dev. Econ. 2013, 19, 638–660. [Google Scholar] [CrossRef]
- Su, C.M.; Horng, D.J.; Tseng, M.L.; Chiu, A.S.; Wu, K.J.; Chen, H.P. Improving sustainable supply chain management using a novel hierarchical grey- DEMATEL approach. J. Clean. Prod. 2016, 134, 469–481. [Google Scholar] [CrossRef]
- Najmi, A.; Makui, A. Providing hierarchical approach for measuring supply chain performance using AHP and DEMATEL methodologies. Int. J. Ind. Eng. Comput. 2010, 1, 199–212. [Google Scholar] [CrossRef]
- Tzeng, G.H.; Huang, C.Y. Combined DEMATEL technique with hybrid MCDM methods for creating the aspired intelligent global manufacturing & logistics systems. Ann. Oper. Res. 2012, 197, 159–190. [Google Scholar] [CrossRef]
- Saaty, T.L. The Analytic Hierarchy Process: Planning, Priority Setting, Resources Allocation; McGraw: New York, NY, USA, 1980. [Google Scholar]
- Saaty, T.L. Decision Making with Dependence and Feedback: The Analytic Network Process: The Organization and Prioritization of Complexity; Rws Publications: Pittsburgh, PA, USA, 1996. [Google Scholar]
- Chen, F.H.; Tzeng, G.H. Probing organization performance using a new hybrid dynamic MCDM method based on the balanced scorecard approach. J. Test. Eval. 2015, 43, 924–937. [Google Scholar] [CrossRef]
- Zionts, S.; Wallenius, J. An interactive multiple objective linear programming method for a class of underlying nonlinear utility functions. Manag. Sci. 1983, 29, 519–529. [Google Scholar] [CrossRef]
- Zhao, Q.; Tsai, P.H.; Wang, J.L. Improving Financial Service Innovation Strategies for Enhancing China’s Banking Industry Competitive Advantage during the Fintech Revolution: A Hybrid MCDM Model. Sustainability 2019, 11, 1419. [Google Scholar] [CrossRef]
Figure 1.
The hybrid MCDM model integrating the DEMATEL, DANP, and SAW techniques.

Figure 2.
Influential network relationships map (INRM).

Figure 3.
INRM of operating performance and earnings criteria.

Figure 4.
INRM of earnings and financial structure criteria.

Figure 5.
INRM of growth criteria.

Figure 6.
INRM of asset quality and liquidity criteria.


Table 1.
Criteria definitions.
| Dimension | Symbol | Criteria | Description |
|---|---|---|---|
| Operating Performance | C1 | Loans to Deposits Ratio | Total Loans/Total Deposits |
| C2 | Average Cost of Funds | Total Interest Expense/Total Average Deposits | |
| C3 | Average Return of Loans | Total Interest Revenue/Total Average Loans | |
| C4 | Total Assets Turnover | Net Revenue/Total Assets | |
| C5 | Average Profit per Employee | Average Profit/Total Number of Employee | |
| C6 | Average Net Income per Employee | Average Net Income/Total Number of Employees | |
| Earnings and Profitability | C7 | Return on Tier 1 Capital | Earnings before Interest and Tax (EBIT)/Tier 1 Capital Tier 1 Capital = returned earnings + common stock + noncumulative and nonredeemable preferred stock |
| C8 | Return on Asset (ROA) | EBIT/Total Average Assets | |
| C9 | Return on Equity (ROE) | EBIT/Total Shareholders’ Equity | |
| C10 | Ratio of Net Income to Net Operating Income | Net Income/Net Operating Income | |
| C11 | Earnings per Share (EPS) | Net Income − Preferred Dividends/Number of Common Shares Outstanding | |
| Financial Structure | C12 | Debt Ratio | Total Liabilities/Total Assets |
| C13 | Ratio of Non-Interest Investments financed by Equity | Property, Plan, and Equipment/Total Shareholders’ Equity | |
| Growth | C14 | Asset Growth | (Total Assets/Total Assets t-1) − 1 |
| C15 | Operating Profit Growth Rate | (Operating Profit/Operating Profit t-1) − 1 | |
| Asset Quality and Liquidity | C16 | Non-Performing Loan (NPL) Ratio | Non-Performing Loans/Total Loans |
| C17 | NPL Coverage Ratio | Loan Loss Provisions/Non-Performing Loans | |
| C18 | Capital Adequacy Ratio | (Tier 1 Capital + Tier 2 Capital)/Risk Weighted Assets Note: Tier 2 capital comprises revaluation reserves, general provisions, hybrid capital instruments, subordinated term debt |
Notes: C1 Loans to Deposits Ratio is a ratio that compares a bank’s total loans to its total deposits for the same period. C2 Average Cost of Funds is the interest rate paid by financial institutions for the funds that they use in their business. C3 Average Return of Loans is a ratio of interest a bank generates from its loan given to an individual or an institution. C4 Total Assets Turnover is the percentage of a bank’s sales generated from its assets. C5 Average Profit per Employee is a ratio that measures income interest and taxes each employee generates for the bank. C6 Average Net Income per Employee is a ratio that measures how much net income before interest and taxes each employee generates for the bank. C7 Return on Tier 1 Capital is a ratio that measures the amount of revenue generated from a bank’s equity capital and disclosed reserves. C7 Return on Asset is a ratio that measures net income generated from a bank’s assets. C8 Return on Asset is a ratio that measures net income generated from a bank’s assets. C9 Return on Equity is a ratio that measures income generated from shareholders’ equity. C10 Ratio of Net Income to Net Operating Income is a ratio that measure the percentage of net income in net operating income from property minus all necessary operating expenses. C11 Earnings per Share is a ratio of bank’s net income allocated to each share of common stock. C12 Debt Ratio is the ratio that measures a bank’s leverage as a percentage of a bank’s total assets. C13 Ratio of Non-Interest Investments financed by Equity is a percentage of a bank’s fixed assets financed by its shareholders’ equity. C14 Asset Growth is a percentage increase in value of a bank’s total assets over the previous period. C15 Operating Profit Growth Rate is the percentage increase in a bank’s operating income over the previous period. C16 Non-Performing Loan Ratio is the ratio of a bank’s loan which the borrower has not made the scheduled payment for a specified period. C17 NPL Coverage Ratio is the ratio that measures a bank’s reserves for non-performing loan as a percentage of its total non-performing loan. C18 Capital Adequacy Ratio is a ratio that measures a bank’s available capital as a percentage of its risk-weighted credit exposures.
Table 2.
Taiwanese listed banks and categories.
| Category | Sub-Category | Banks | Description |
|---|---|---|---|
| FHC bank | State-owned banks | Bank of Taiwan Mega International Commercial Bank First Commercial Bank Taiwan Cooperative Bank Hua Nan Commercial Bank | Subsidiaries of FHCs. |
| Bank as the largest subsidiary of FHC | E.SUN Commercial Bank Yuanta Commercial Bank Bank SinoPac Taishin International Bank Chinatrust Commercial Bank | FHCs have banks, insurance companies, and securities firms as their subsidiaries. Banks are the largest businesses of these FHCs. | |
| Insurance company as the largest subsidiary of FHC | Cathay United Bank Taiwan Shin Kong Commercial Bank Taipei Fubon Commercial Bank | Insurance companies are the largest businesses of these FHCs. | |
| Securities firm as the largest subsidiary of FHC | Jih Sun International Bank | Securities firms are the largest businesses of the FHCs. | |
| Non-FHC bank | State-owned bank | Bank of Kaohsiung Land Bank of Taiwan Chang Hwa Commercial Bank Taiwan Business Bank | These state-owned banks are not the subsidiaries of FHCs. |
| Private bank | The Shanghai Commercial & Savings Bank EnTie Commercial Bank Taichung Commercial Bank Taipei Star Bank | These private banks are not the subsidiaries of FHCs. | |
| Corporate-affiliated bank | King’s Town Bank Union Bank of Taiwan Far Eastern International Bank | These private banks are owned by corporations that seek diversification. |
Table 3.
The normalized matrix.
| C1 | C2 | C3 | C4 | C5 | C6 | C7 | C8 | C9 | C10 | C11 | C12 | C13 | C14 | C15 | C16 | C17 | C18 | |
|---|---|---|---|---|---|---|---|---|---|---|---|---|---|---|---|---|---|---|
| C1 | 0 | 0.073 | 0.0545 | 0.070 | 0.036 | 0.036 | 0.036 | 0.050 | 0.050 | 0.050 | 0.050 | 0.040 | 0.040 | 0.040 | 0.050 | 0.036 | 0.040 | 0.070 |
| C2 | 0.073 | 0 | 0.073 | 0.040 | 0.036 | 0.036 | 0.036 | 0.050 | 0.050 | 0.050 | 0.050 | 0.040 | 0.040 | 0.050 | 0.050 | 0.036 | 0.040 | 0.050 |
| C3 | 0.055 | 0.055 | 0 | 0.040 | 0.036 | 0.036 | 0.036 | 0.050 | 0.050 | 0.050 | 0.050 | 0.040 | 0.040 | 0.050 | 0.050 | 0.036 | 0.040 | 0.050 |
| C4 | 0.073 | 0.036 | 0.0364 | 0 | 0.018 | 0.018 | 0.018 | 0.040 | 0.040 | 0.040 | 0.040 | 0.020 | 0.020 | 0.020 | 0.050 | 0.018 | 0.020 | 0.020 |
| C5 | 0.036 | 0.018 | 0.0182 | 0.020 | 0 | 0.073 | 0.018 | 0.050 | 0.050 | 0.050 | 0.050 | 0.020 | 0.020 | 0.020 | 0.020 | 0.018 | 0.020 | 0.020 |
| C6 | 0.036 | 0.018 | 0.018 | 0.020 | 0.055 | 0 | 0.018 | 0.050 | 0.050 | 0.050 | 0.050 | 0.020 | 0.020 | 0.020 | 0.020 | 0.018 | 0.020 | 0.020 |
| C7 | 0.055 | 0.018 | 0.018 | 0.020 | 0.018 | 0.018 | 0 | 0.070 | 0.070 | 0.070 | 0.070 | 0.020 | 0.020 | 0.070 | 0.070 | 0.055 | 0.050 | 0.070 |
| C8 | 0.055 | 0.018 | 0.018 | 0.020 | 0.055 | 0.055 | 0.073 | 0 | 0.070 | 0.070 | 0.070 | 0.020 | 0.020 | 0.070 | 0.070 | 0.055 | 0.020 | 0.020 |
| C9 | 0.055 | 0.018 | 0.018 | 0.020 | 0.055 | 0.055 | 0.073 | 0.070 | 0 | 0.070 | 0.070 | 0.020 | 0.020 | 0.070 | 0.070 | 0.055 | 0.020 | 0.020 |
| C10 | 0.055 | 0.018 | 0.018 | 0.020 | 0.055 | 0.055 | 0.073 | 0.070 | 0.070 | 0 | 0.070 | 0.020 | 0.020 | 0.070 | 0.070 | 0.055 | 0.020 | 0.020 |
| C11 | 0.055 | 0.018 | 0.018 | 0.020 | 0.055 | 0.055 | 0.073 | 0.070 | 0.070 | 0.070 | 0 | 0.020 | 0.020 | 0.070 | 0.070 | 0.055 | 0.020 | 0.020 |
| C12 | 0.036 | 0.036 | 0.036 | 0.050 | 0.018 | 0.018 | 0.036 | 0.040 | 0.040 | 0.020 | 0.020 | 0 | 0.020 | 0.040 | 0.040 | 0.018 | 0.020 | 0.050 |
| C13 | 0.036 | 0.036 | 0.036 | 0.050 | 0.018 | 0.018 | 0.036 | 0.040 | 0.040 | 0.020 | 0.020 | 0.020 | 0 | 0.040 | 0.040 | 0.018 | 0.020 | 0.050 |
| C14 | 0.036 | 0.018 | 0.018 | 0.070 | 0.018 | 0.018 | 0.018 | 0.070 | 0.070 | 0.070 | 0.070 | 0.050 | 0.020 | 0 | 0.070 | 0.073 | 0.020 | 0.050 |
| C15 | 0.036 | 0.018 | 0.018 | 0.070 | 0.018 | 0.018 | 0.018 | 0.070 | 0.070 | 0.070 | 0.070 | 0.050 | 0.020 | 0.070 | 0 | 0.073 | 0.020 | 0.050 |
| C16 | 0.055 | 0.036 | 0.073 | 0.020 | 0.055 | 0.055 | 0.055 | 0.070 | 0.070 | 0.070 | 0.070 | 0.020 | 0.020 | 0.070 | 0.070 | 0 | 0.070 | 0.070 |
| C17 | 0.036 | 0.036 | 0.036 | 0.020 | 0.018 | 0.018 | 0.036 | 0.040 | 0.040 | 0.040 | 0.040 | 0.020 | 0.020 | 0.040 | 0.040 | 0.073 | 0 | 0.070 |
| C18 | 0.073 | 0.018 | 0.018 | 0.020 | 0.018 | 0.018 | 0.073 | 0.070 | 0.070 | 0.070 | 0.070 | 0.020 | 0.020 | 0.070 | 0.070 | 0.073 | 0.070 | 0 |
Notes: C1 Loans to Deposits Ratio is a ratio that compares a bank’s total loans to its total deposits for the same period. C2 Average Cost of Funds is the interest rate paid by financial institutions for the funds that they use in their business. C3 Average Return of Loans is a ratio of interest a bank generates from its loan given to an individual or an institution. C4 Total Assets Turnover is the percentage of a bank’s sales generated from its assets. C5 Average Profit per Employee is a ratio that measures income interest and taxes each employee generates for the bank. C6 Average Net Income per Employee is a ratio that measures how much net income before interest and taxes each employee generates for the bank. C7 Return on Tier 1 Capital is a ratio that measures the amount of revenue generated from a bank’s equity capital and disclosed reserves. C7 Return on Asset is a ratio that measures net income generated from a bank’s assets. C8 Return on Asset is a ratio that measures net income generated from a bank’s assets. C9 Return on Equity is a ratio that measures income generated from shareholders’ equity. C10 Ratio of Net Income to Net Operating Income is a ratio that measure the percentage of net income in net operating income from property minus all necessary operating expenses. C11 Earnings per Share is a ratio of bank’s net income allocated to each share of common stock. C12 Debt Ratio is the ratio that measures a bank’s leverage as a percentage of a bank’s total assets. C13 Ratio of Non-Interest Investments financed by Equity is a percentage of a bank’s fixed assets financed by its shareholders’ equity. C14 Asset Growth is a percentage increase in value of a bank’s total assets over the previous period. C15 Operating Profit Growth Rate is the percentage increase in a bank’s operating income over the previous period. C16 Non-Performing Loan Ratio is the ratio of a bank’s loan which the borrower has not made the scheduled payment for a specified period. C17 NPL Coverage Ratio is the ratio that measures a bank’s reserves for non-performing loan as a percentage of its total non-performing loan. C18 Capital Adequacy Ratio is a ratio that measures a bank’s available capital as a percentage of its risk-weighted credit exposures.
Table 4.
The total direct/indirect influence matrix.
| C1 | C2 | C3 | C4 | C5 | C6 | C7 | C8 | C9 | C10 | C11 | C12 | C13 | C14 | C15 | C16 | C17 | C18 | |
|---|---|---|---|---|---|---|---|---|---|---|---|---|---|---|---|---|---|---|
| C1 | 0.064 | 0.108 | 0.092 | 0.117 | 0.084 | 0.085 | 0.095 | 0.133 | 0.133 | 0.131 | 0.130 | 0.070 | 0.060 | 0.110 | 0.130 | 0.098 | 0.070 | 0.130 |
| C2 | 0.136 | 0.035 | 0.110 | 0.080 | 0.083 | 0.084 | 0.094 | 0.132 | 0.132 | 0.131 | 0.130 | 0.070 | 0.060 | 0.130 | 0.130 | 0.098 | 0.070 | 0.110 |
| C3 | 0.115 | 0.088 | 0.035 | 0.078 | 0.081 | 0.082 | 0.092 | 0.128 | 0.128 | 0.127 | 0.130 | 0.070 | 0.060 | 0.120 | 0.130 | 0.095 | 0.070 | 0.110 |
| C4 | 0.114 | 0.059 | 0.060 | 0.028 | 0.048 | 0.049 | 0.055 | 0.086 | 0.086 | 0.085 | 0.090 | 0.040 | 0.040 | 0.060 | 0.100 | 0.057 | 0.040 | 0.050 |
| C5 | 0.077 | 0.040 | 0.042 | 0.046 | 0.030 | 0.103 | 0.055 | 0.104 | 0.104 | 0.103 | 0.100 | 0.040 | 0.040 | 0.060 | 0.070 | 0.057 | 0.040 | 0.050 |
| C6 | 0.076 | 0.040 | 0.041 | 0.045 | 0.084 | 0.030 | 0.054 | 0.103 | 0.103 | 0.102 | 0.100 | 0.040 | 0.040 | 0.060 | 0.060 | 0.056 | 0.040 | 0.050 |
| C7 | 0.119 | 0.054 | 0.056 | 0.062 | 0.066 | 0.067 | 0.059 | 0.152 | 0.152 | 0.150 | 0.150 | 0.050 | 0.050 | 0.140 | 0.150 | 0.117 | 0.090 | 0.130 |
| C8 | 0.116 | 0.052 | 0.054 | 0.060 | 0.100 | 0.101 | 0.129 | 0.074 | 0.148 | 0.146 | 0.150 | 0.050 | 0.040 | 0.140 | 0.140 | 0.114 | 0.050 | 0.070 |
| C9 | 0.116 | 0.052 | 0.054 | 0.060 | 0.100 | 0.101 | 0.129 | 0.148 | 0.074 | 0.146 | 0.150 | 0.050 | 0.040 | 0.140 | 0.140 | 0.114 | 0.050 | 0.070 |
| C10 | 0.116 | 0.052 | 0.054 | 0.060 | 0.100 | 0.101 | 0.129 | 0.148 | 0.148 | 0.073 | 0.150 | 0.050 | 0.040 | 0.140 | 0.140 | 0.114 | 0.050 | 0.070 |
| C11 | 0.116 | 0.052 | 0.054 | 0.060 | 0.100 | 0.101 | 0.129 | 0.148 | 0.148 | 0.146 | 0.070 | 0.050 | 0.040 | 0.140 | 0.140 | 0.114 | 0.050 | 0.070 |
| C12 | 0.078 | 0.059 | 0.061 | 0.083 | 0.049 | 0.049 | 0.074 | 0.087 | 0.087 | 0.068 | 0.070 | 0.020 | 0.040 | 0.080 | 0.080 | 0.058 | 0.040 | 0.090 |
| C13 | 0.078 | 0.059 | 0.061 | 0.083 | 0.049 | 0.049 | 0.074 | 0.087 | 0.087 | 0.068 | 0.070 | 0.040 | 0.020 | 0.080 | 0.080 | 0.058 | 0.040 | 0.090 |
| C14 | 0.097 | 0.052 | 0.054 | 0.115 | 0.063 | 0.064 | 0.074 | 0.148 | 0.148 | 0.146 | 0.150 | 0.090 | 0.040 | 0.070 | 0.140 | 0.132 | 0.050 | 0.110 |
| C15 | 0.097 | 0.052 | 0.054 | 0.115 | 0.063 | 0.064 | 0.074 | 0.148 | 0.148 | 0.146 | 0.150 | 0.090 | 0.040 | 0.140 | 0.070 | 0.132 | 0.050 | 0.110 |
| C16 | 0.129 | 0.078 | 0.117 | 0.069 | 0.110 | 0.111 | 0.123 | 0.164 | 0.164 | 0.162 | 0.160 | 0.060 | 0.050 | 0.160 | 0.160 | 0.072 | 0.120 | 0.140 |
| C17 | 0.086 | 0.064 | 0.065 | 0.052 | 0.055 | 0.055 | 0.082 | 0.097 | 0.097 | 0.096 | 0.100 | 0.040 | 0.040 | 0.090 | 0.090 | 0.121 | 0.030 | 0.110 |
| C18 | 0.142 | 0.056 | 0.058 | 0.065 | 0.069 | 0.070 | 0.136 | 0.157 | 0.157 | 0.155 | 0.160 | 0.050 | 0.050 | 0.150 | 0.150 | 0.139 | 0.110 | 0.060 |
Notes: Please define “C” and “1–18” here. C1 Loans to Deposits Ratio is a ratio that compares a bank’s total loans to its total deposits for the same period. C2 Average Cost of Funds is the interest rate paid by financial institutions for the funds that they use in their business. C3 Average Return of Loans is a ratio of interest a bank generates from its loan given to an individual or an institution. C4 Total Assets Turnover is the percentage of a bank’s sales generated from its assets. C5 Average Profit per Employee is a ratio that measures income interest and taxes each employee generates for the bank. C6 Average Net Income per Employee is a ratio that measures how much net income before interest and taxes each employee generates for the bank. C7 Return on Tier 1 Capital is a ratio that measures the amount of revenue generated from a bank’s equity capital and disclosed reserves. C7 Return on Asset is a ratio that measures net income generated from a bank’s assets. C8 Return on Asset is a ratio that measures net income generated from a bank’s assets. C9 Return on Equity is a ratio that measures income generated from shareholders’ equity. C10 Ratio of Net Income to Net Operating Income is a ratio that measure the percentage of net income in net operating income from property minus all necessary operating expenses. C11 Earnings per Share is a ratio of bank’s net income allocated to each share of common stock. C12 Debt Ratio is the ratio that measures a bank’s leverage as a percentage of a bank’s total assets. C13 Ratio of Non-Interest Investments financed by Equity is a percentage of a bank’s fixed assets financed by its shareholders’ equity. C14 Asset Growth is a percentage increase in value of a bank’s total assets over the previous period. C15 Operating Profit Growth Rate is the percentage increase in a bank’s operating income over the previous period. C16 Non-Performing Loan Ratio is the ratio of a bank’s loan which the borrower has not made the scheduled payment for a specified period. C17 NPL Coverage Ratio is the ratio that measures a bank’s reserves for non-performing loan as a percentage of its total non-performing loan. C18 Capital Adequacy Ratio is a ratio that measures a bank’s available capital as a percentage of its risk-weighted credit exposures.
Table 5.
The influence of each criterion.
| Criteria | Row Sum(D) | Column Sum(R) | D + R | D − R |
|---|---|---|---|---|
| C1 Loans to Deposits Ratio (%) | 1.843 | 1.871 | 3.715 | −0.030 |
| C2 Average Cost of Funds | 1.815 | 1.052 | 2.867 | 0.763 |
| C3 Average Return of Loans | 1.734 | 1.123 | 2.857 | 0.611 |
| C4 Total Assets Turnover (number of times) | 1.147 | 1.277 | 2.425 | −0.130 |
| C5 Average Profit per Employee (thousands in NT dollars) | 1.162 | 1.334 | 2.495 | −0.170 |
| C6 Average Net Income per Employee (thousands in NT dollars) | 1.129 | 1.369 | 2.498 | −0.240 |
| C7 Return on Tier 1 Capital (%) | 1.815 | 1.658 | 3.473 | 0.156 |
| C8 Return on Asset (%) | 1.745 | 2.240 | 3.986 | −0.490 |
| C9 Return on Equity (%) | 1.745 | 2.240 | 3.986 | −0.490 |
| C10 Ratio of Net Income to Net Operating Income (%) | 1.745 | 2.182 | 3.928 | −0.440 |
| C11 Earnings per Share (NT dollars) | 1.745 | 2.182 | 3.928 | −0.440 |
| C12 Debt Ratio (%) | 1.178 | 0.981 | 2.159 | 0.197 |
| C13 Ratio of Non-Interest Investments financed by Equity (%) | 1.178 | 0.797 | 1.975 | 0.381 |
| C14 Asset Growth | 1.745 | 2.025 | 3.771 | −0.280 |
| C15 Operating Profit Growth Rate | 1.745 | 2.133 | 3.879 | −0.390 |
| C16 NPL Ratio (%) | 2.141 | 1.747 | 3.888 | 0.394 |
| C17 NPL Coverage Ratio | 1.376 | 1.118 | 2.495 | 0.258 |
| C18 Capital Adequacy Ratio | 1.935 | 1.594 | 3.529 | 0.341 |
Table 6.
Values of D + R and D − R (dimensions).
| Dimension | D | R | D + R | D − R |
|---|---|---|---|---|
| Operating Performance | 5.0131 | 4.2773 | 9.2904 | 0.7358 |
| Earnings and Profitability | 4.5257 | 4.9047 | 9.4305 | −0.3790 |
| Growth | 3.0820 | 3.1346 | 6.2167 | −0.0525 |
| Financial Structure | 4.8676 | 3.4750 | 8.3427 | 1.3926 |
| Asset Quality and Liquidity | 3.0924 | 4.7893 | 7.8810 | −1.6960 |
Table 7.
Normalized total influence–relation matrix.
| C1 | C2 | C3 | C4 | C5 | C6 | C7 | C8 | C9 | C10 | C11 | C12 | C13 | C14 | C15 | C16 | C17 | C18 | |
|---|---|---|---|---|---|---|---|---|---|---|---|---|---|---|---|---|---|---|
| C1 | 0.116 | 0.197 | 0.168 | 0.213 | 0.152 | 0.154 | 0.152 | 0.213 | 0.213 | 0.211 | 0.210 | 0.530 | 0.470 | 0.450 | 0.550 | 0.328 | 0.250 | 0.420 |
| C2 | 0.258 | 0.066 | 0.208 | 0.151 | 0.157 | 0.159 | 0.153 | 0.213 | 0.213 | 0.211 | 0.210 | 0.530 | 0.470 | 0.490 | 0.510 | 0.349 | 0.270 | 0.380 |
| C3 | 0.240 | 0.184 | 0.074 | 0.162 | 0.169 | 0.171 | 0.152 | 0.213 | 0.213 | 0.211 | 0.201 | 0.530 | 0.470 | 0.490 | 0.510 | 0.348 | 0.270 | 0.390 |
| C4 | 0.318 | 0.164 | 0.169 | 0.077 | 0.135 | 0.137 | 0.139 | 0.216 | 0.216 | 0.214 | 0.210 | 0.530 | 0.470 | 0.380 | 0.620 | 0.377 | 0.280 | 0.340 |
| C5 | 0.227 | 0.120 | 0.124 | 0.136 | 0.088 | 0.306 | 0.117 | 0.222 | 0.222 | 0.220 | 0.220 | 0.530 | 0.470 | 0.490 | 0.510 | 0.377 | 0.280 | 0.340 |
| C6 | 0.240 | 0.126 | 0.131 | 0.144 | 0.265 | 0.094 | 0.116 | 0.222 | 0.222 | 0.220 | 0.220 | 0.530 | 0.470 | 0.490 | 0.510 | 0.377 | 0.280 | 0.340 |
| C7 | 0.281 | 0.127 | 0.132 | 0.147 | 0.155 | 0.158 | 0.089 | 0.229 | 0.229 | 0.227 | 0.230 | 0.540 | 0.460 | 0.490 | 0.510 | 0.347 | 0.280 | 0.380 |
| C8 | 0.240 | 0.108 | 0.112 | 0.124 | 0.207 | 0.209 | 0.201 | 0.116 | 0.229 | 0.227 | 0.230 | 0.530 | 0.470 | 0.490 | 0.510 | 0.479 | 0.230 | 0.290 |
| C9 | 0.240 | 0.108 | 0.112 | 0.124 | 0.207 | 0.209 | 0.201 | 0.229 | 0.116 | 0.227 | 0.230 | 0.530 | 0.470 | 0.490 | 0.510 | 0.479 | 0.230 | 0.290 |
| C10 | 0.240 | 0.108 | 0.112 | 0.124 | 0.207 | 0.209 | 0.201 | 0.229 | 0.229 | 0.114 | 0.230 | 0.530 | 0.470 | 0.490 | 0.510 | 0.479 | 0.230 | 0.290 |
| C11 | 0.240 | 0.108 | 0.112 | 0.124 | 0.207 | 0.209 | 0.201 | 0.229 | 0.229 | 0.227 | 0.110 | 0.530 | 0.470 | 0.490 | 0.510 | 0.479 | 0.230 | 0.290 |
| C12 | 0.205 | 0.157 | 0.160 | 0.219 | 0.129 | 0.131 | 0.194 | 0.227 | 0.227 | 0.176 | 0.180 | 0.380 | 0.620 | 0.490 | 0.510 | 0.306 | 0.230 | 0.470 |
| C13 | 0.205 | 0.157 | 0.160 | 0.219 | 0.129 | 0.131 | 0.194 | 0.227 | 0.227 | 0.176 | 0.180 | 0.700 | 0.300 | 0.490 | 0.510 | 0.306 | 0.230 | 0.470 |
| C14 | 0.218 | 0.117 | 0.121 | 0.258 | 0.142 | 0.144 | 0.111 | 0.223 | 0.223 | 0.221 | 0.220 | 0.660 | 0.340 | 0.320 | 0.680 | 0.451 | 0.190 | 0.360 |
| C15 | 0.218 | 0.117 | 0.121 | 0.258 | 0.142 | 0.144 | 0.111 | 0.223 | 0.223 | 0.221 | 0.220 | 0.660 | 0.340 | 0.670 | 0.330 | 0.451 | 0.190 | 0.360 |
| C16 | 0.211 | 0.126 | 0.190 | 0.113 | 0.179 | 0.181 | 0.159 | 0.211 | 0.211 | 0.209 | 0.210 | 0.540 | 0.460 | 0.490 | 0.510 | 0.222 | 0.360 | 0.420 |
| C17 | 0.227 | 0.169 | 0.173 | 0.138 | 0.145 | 0.147 | 0.175 | 0.207 | 0.207 | 0.205 | 0.210 | 0.530 | 0.470 | 0.490 | 0.510 | 0.457 | 0.110 | 0.430 |
| C18 | 0.308 | 0.122 | 0.127 | 0.141 | 0.150 | 0.152 | 0.179 | 0.206 | 0.206 | 0.204 | 0.200 | 0.540 | 0.460 | 0.490 | 0.510 | 0.448 | 0.370 | 0.180 |
Table 8.
Weighted total influence–relation matrix.
| C1 | C2 | C3 | C4 | C5 | C6 | C7 | C8 | C9 | C10 | C11 | C12 | C13 | C14 | C15 | C16 | C17 | C18 | |
|---|---|---|---|---|---|---|---|---|---|---|---|---|---|---|---|---|---|---|
| C1 | 0.020 | 0.045 | 0.042 | 0.056 | 0.040 | 0.042 | 0.061 | 0.052 | 0.052 | 0.052 | 0.050 | 0.040 | 0.040 | 0.050 | 0.050 | 0.046 | 0.050 | 0.070 |
| C2 | 0.035 | 0.012 | 0.032 | 0.029 | 0.021 | 0.022 | 0.028 | 0.023 | 0.023 | 0.023 | 0.020 | 0.030 | 0.030 | 0.030 | 0.030 | 0.028 | 0.040 | 0.030 |
| C3 | 0.030 | 0.037 | 0.013 | 0.030 | 0.022 | 0.023 | 0.029 | 0.024 | 0.024 | 0.024 | 0.020 | 0.030 | 0.030 | 0.030 | 0.030 | 0.041 | 0.040 | 0.030 |
| C4 | 0.038 | 0.027 | 0.029 | 0.014 | 0.024 | 0.025 | 0.032 | 0.027 | 0.027 | 0.027 | 0.030 | 0.040 | 0.040 | 0.060 | 0.060 | 0.025 | 0.030 | 0.030 |
| C5 | 0.027 | 0.028 | 0.03 | 0.024 | 0.015 | 0.047 | 0.034 | 0.045 | 0.045 | 0.045 | 0.050 | 0.030 | 0.030 | 0.030 | 0.030 | 0.039 | 0.030 | 0.030 |
| C6 | 0.027 | 0.028 | 0.03 | 0.024 | 0.054 | 0.017 | 0.034 | 0.046 | 0.046 | 0.046 | 0.050 | 0.030 | 0.030 | 0.030 | 0.030 | 0.039 | 0.030 | 0.030 |
| C7 | 0.038 | 0.038 | 0.038 | 0.035 | 0.029 | 0.029 | 0.018 | 0.040 | 0.040 | 0.040 | 0.040 | 0.050 | 0.050 | 0.030 | 0.030 | 0.039 | 0.040 | 0.040 |
| C8 | 0.053 | 0.053 | 0.053 | 0.054 | 0.056 | 0.056 | 0.045 | 0.023 | 0.045 | 0.045 | 0.050 | 0.060 | 0.060 | 0.060 | 0.060 | 0.052 | 0.050 | 0.050 |
| C9 | 0.053 | 0.053 | 0.053 | 0.054 | 0.056 | 0.056 | 0.045 | 0.045 | 0.023 | 0.045 | 0.050 | 0.060 | 0.060 | 0.060 | 0.060 | 0.052 | 0.050 | 0.050 |
| C10 | 0.053 | 0.053 | 0.053 | 0.054 | 0.055 | 0.055 | 0.045 | 0.045 | 0.045 | 0.023 | 0.050 | 0.040 | 0.040 | 0.060 | 0.060 | 0.051 | 0.050 | 0.050 |
| C11 | 0.053 | 0.053 | 0.053 | 0.054 | 0.055 | 0.055 | 0.045 | 0.045 | 0.045 | 0.045 | 0.020 | 0.040 | 0.040 | 0.060 | 0.060 | 0.051 | 0.050 | 0.050 |
| C12 | 0.076 | 0.076 | 0.076 | 0.076 | 0.077 | 0.077 | 0.085 | 0.085 | 0.085 | 0.085 | 0.080 | 0.050 | 0.090 | 0.100 | 0.100 | 0.093 | 0.090 | 0.090 |
| C13 | 0.068 | 0.069 | 0.069 | 0.068 | 0.068 | 0.068 | 0.074 | 0.074 | 0.074 | 0.074 | 0.070 | 0.080 | 0.040 | 0.050 | 0.050 | 0.080 | 0.080 | 0.080 |
| C14 | 0.082 | 0.089 | 0.089 | 0.069 | 0.089 | 0.089 | 0.085 | 0.085 | 0.085 | 0.085 | 0.080 | 0.090 | 0.090 | 0.050 | 0.100 | 0.083 | 0.080 | 0.080 |
| C15 | 0.098 | 0.091 | 0.091 | 0.111 | 0.092 | 0.092 | 0.087 | 0.087 | 0.087 | 0.087 | 0.090 | 0.090 | 0.09 | 0.100 | 0.050 | 0.085 | 0.080 | 0.080 |
| C16 | 0.081 | 0.087 | 0.086 | 0.094 | 0.094 | 0.093 | 0.088 | 0.121 | 0.121 | 0.121 | 0.120 | 0.070 | 0.070 | 0.100 | 0.100 | 0.044 | 0.090 | 0.090 |
| C17 | 0.062 | 0.066 | 0.066 | 0.070 | 0.069 | 0.069 | 0.070 | 0.058 | 0.058 | 0.058 | 0.060 | 0.050 | 0.050 | 0.040 | 0.040 | 0.071 | 0.020 | 0.070 |
| C18 | 0.105 | 0.095 | 0.096 | 0.085 | 0.085 | 0.085 | 0.095 | 0.073 | 0.073 | 0.073 | 0.070 | 0.110 | 0.110 | 0.080 | 0.080 | 0.082 | 0.090 | 0.040 |
Table 9.
DANP weights of criteria.
| Dimension | Criteria | DANP Weight | Local Weight | Ranking | |
|---|---|---|---|---|---|
| Operating Performance 0.21 | C1 | Loans to Deposits Ratio | 4.84% | 23.21% | 12 |
| C2 | Average Cost of Funds | 2.73% | 13.11% | 18 | |
| C3 | Average Return of Loans | 2.92% | 14.01% | 17 | |
| C4 | Total Assets Turnover | 3.54% | 17.00% | 14 | |
| C5 | Average Profit per Employee | 3.37% | 16.17% | 16 | |
| C6 | Average Net Income per Employee | 3.44% | 16.50% | 15 | |
| C7 | Return on Tier 1 Capital | 3.76% | 15.88% | 13 | |
| C8 | Return on Asset | 5.09% | 21.50% | 8 | |
| C9 | Return on Equity | 5.09% | 21.50% | 8 | |
| Earnings and Profitability 0.24 | C10 | Ratio of Net Income to Net Operating Income | 4.86% | 20.56% | 10 |
| C11 | Earnings per Share | 4.86% | 20.56% | 10 | |
| Financial Structure 0.15 | C12 | Debt Ratio | 8.54% | 55.42% | 3 |
| C13 | Ratio of Non-Interest-Investments financed by Equity | 6.87% | 44.58% | 6 | |
| Growth 0.17 | C14 | Asset Growth | 8.30% | 48.80% | 5 |
| C15 | Operating Profit Growth Rate | 8.71% | 51.20% | 2 | |
| Asset quality and Liquidity 0.23 | C16 | NPL Ratio | 9.03% | 39.13% | 1 |
| C17 | NPL Coverage Ratio | 5.71% | 24.75% | 7 | |
| C18 | Capital Adequacy Ratio | 8.33% | 36.12% | 4 |
Table 10.
The 2012–2016 average sustainability performance score and ranking of twenty-five Taiwanese listed banks.
Table 10.
The 2012–2016 average sustainability performance score and ranking of twenty-five Taiwanese listed banks.
| FHC or Non-FHC | Type | Bank | Score | Global Ranking | Local Ranking |
|---|---|---|---|---|---|
| FHC | State-owned | 1. Bank of Taiwan | 0.2619 | 23 | 14 |
| FHC | State-owned | 2. Mega International Commercial Bank | 0.4839 | 4 | 2 |
| FHC | State-owned | 3. First Commercial Bank | 0.3690 | 15 | 10 |
| FHC | State-owned | 4. Taiwan Cooperative Bank | 0.2813 | 21 | 13 |
| FHC | State-owned Bank as the largest subsidiary of FHC | 5. Hua Nan Commercial Bank | 0.3624 | 16 | 11 |
| FHC | 6. E.SUN Commercial Bank | 0.4278 | 8 | 6 | |
| FHC | 7. Yuanta Commercial Bank | 0.4235 | 9 | 7 | |
| FHC | 8. Bank SinoPac | 0.3940 | 12 | 9 | |
| FHC | 9. Taishin International Bank | 0.4388 | 7 | 5 | |
| FHC | 10. Chinatrust Commercial Bank | 0.4786 | 5 | 3 | |
| FHC | Insurance company as largest subsidiary of FHC | 11. Cathay United Bank | 0.4886 | 3 | 1 |
| FHC | 12. Taiwan Shin Kong Commercial Bank | 0.4228 | 10 | 8 | |
| FHC | 13. Taipei Fubon Commercial Bank | 0.4742 | 6 | 4 | |
| FHC | Securities firm as largest subsidiary of FHC | 14. Jih Sun International Bank | 0.3072 | 19 | 12 |
| Non-FHC | State-owned | 15. Bank of Kaohsiung | 0.2029 | 25 | 11 |
| Non-FHC | State-owned | 16. Land Bank of Taiwan | 0.2993 | 20 | 8 |
| Non-FHC | State-owned | 17. Chang Hwa Commercial Bank | 0.3447 | 18 | 7 |
| Non-FHC | State-owned | 18. Taiwan Business Bank | 0.2586 | 24 | 10 |
| Non-FHC | Private | 19. The Shanghai Commercial & Savings Bank | 0.5320 | 2 | 2 |
| Non-FHC | Private | 20. EnTie Commercial Bank | 0.3992 | 11 | 3 |
| Non-FHC | Private | 21. Taichung Commercial Bank | 0.3536 | 17 | 6 |
| Non-FHC | Private | 22. Taipei Star Bank | 0.2665 | 22 | 9 |
| Non-FHC | Corporate affiliated | 23. King’s Town Bank | 0.7007 | 1 | 1 |
| Non-FHC | Corporate affiliated | 24. Union Bank of Taiwan | 0.3867 | 14 | 5 |
| Non-FHC | Corporate affiliated | 25. Far Eastern International Bank | 0.3881 | 13 | 4 |
Table 11.
Comparison of FHC and non-FHC banks in sustainability performance score.
| Year | FHC | Non-FHC |
|---|---|---|
| 2012 | 0.3737 | 0.3659 |
| 2013 | 0.3730 | 0.3789 |
| 2014 | 0.4286 | 0.3997 |
| 2015 | 0.4266 | 0.3814 |
| 2016 | 0.4032 | 0.3714 |
| Average | 0.4010 | 0.3795 |
Table 12.
Comparison of privates and state-owned banks in sustainability performance.
| Year | Private Banks | State-Owned Banks |
|---|---|---|
| 2012 | 0.4243 | 0.2743 |
| 2013 | 0.4147 | 0.2829 |
| 2014 | 0.4631 | 0.3320 |
| 2015 | 0.4389 | 0.3495 |
| 2016 | 0.4098 | 0.3526 |
| Average | 0.4302 | 0.3182 |
Table 13.
Average sustainability performance score of each type of bank.
| 2016 | 2015 | 2014 | 2013 | 2012 | Average | Rank | ||
|---|---|---|---|---|---|---|---|---|
| FHCs | State-owned banks | 0.3903 | 0.3920 | 0.3595 | 0.3114 | 0.3054 | 0.3327 | 6 |
| Bank as largest subsidiary | 0.4124 | 0.4413 | 0.4758 | 0.4100 | 0.4232 | 0.4210 | 4 | |
| Insurance company as largest subsidiary | 0.4430 | 0.4919 | 0.4959 | 0.4461 | 0.4325 | 0.4661 | 2 | |
| Securities firm as largest subsidiary | 0.3020 | 0.3298 | 0.3368 | 0.2766 | 0.2908 | 0.3072 | 7 | |
| Average | 0.3869 | 0.4138 | 0.4170 | 0.3610 | 0.3630 | 0.3817 | ||
| Non FHCs | State-owned bank | 0.3055 | 0.3055 | 0.2964 | 0.2976 | 0.2473 | 0.2353 | 8 |
| Private bank | 0.3962 | 0.3422 | 0.3884 | 0.4064 | 0.3760 | 0.4263 | 3 | |
| Corporate affiliated banks | 0.4984 | 0.4854 | 0.5270 | 0.4887 | 0.4596 | 0.4918 | 1 | |
| Corporate affiliates banks (without King’s Town) | 0.3723 | 0.4078 | 0.4132 | 0.3854 | 0.3582 | 0.3874 | 5 | |
| Average | 0.4000 | 0.3777 | 0.4039 | 0.3976 | 0.3610 | 0.3845 | ||
| Average performance score of Banks | 0.3926 | 0.3983 | 0.4114 | 0.3767 | 0.3621 | 0.3829 | ||
© 2019 by the authors. Licensee MDPI, Basel, Switzerland. This article is an open access article distributed under the terms and conditions of the Creative Commons Attribution (CC BY) license (http://creativecommons.org/licenses/by/4.0/).
Share and Cite
MDPI and ACS Style
Lin, A.J.; Chang, H.-Y. Business Sustainability Performance Evaluation for Taiwanese Banks—A Hybrid Multiple-Criteria Decision-Making Approach. Sustainability 2019, 11, 2236. https://doi.org/10.3390/su11082236
AMA Style
Lin AJ, Chang H-Y. Business Sustainability Performance Evaluation for Taiwanese Banks—A Hybrid Multiple-Criteria Decision-Making Approach. Sustainability. 2019; 11(8):2236. https://doi.org/10.3390/su11082236
Chicago/Turabian StyleLin, Arthur Jin, and Hai-Yen Chang. 2019. "Business Sustainability Performance Evaluation for Taiwanese Banks—A Hybrid Multiple-Criteria Decision-Making Approach" Sustainability 11, no. 8: 2236. https://doi.org/10.3390/su11082236
Note that from the first issue of 2016, this journal uses article numbers instead of page numbers. See further details here.