1. Introduction
Traditional industry is the pillar of economic development, and the main source of waste of resources and environmental pollution. Global climate change has attracted great attention all over the world, and many countries have taken steps to promote energy conservation and emission reduction. In order to develop a sustainable society in Japan, the manufacturing industries improve their operational efficiency and simultaneously reduce industrial pollutions [
1]. The Korean government established a 15-yearplan to retrofit existing industrial complexes into eco-industrial parks [
2]. Several eco-industrial parks were established in European countries [
3].
As the largest developing country, China is confronted with an urgent task to realize sustainable development. The energy-intensive industrial cluster is the industry with a lot of resource consumption and pollution emission. In 2015, energy consumption in an energy-intensive industrial cluster accounted for 40.84% of the total energy consumption in China, the industrial gas emissions accounted for 79.2% of total emissions, industrial wastewater emissions accounted for 25.56%, and solid waste emissions accounted for 43.01%. Besides, an energy-intensive industrial cluster mainly includes the chemical industry, metallurgical industry, thermal power industry, and building materials industry, with the characteristics of high energy consumption, high material consumption, and high pollution [
4]. Therefore, implementing the circular economy of an energy-intensive industrial cluster is the key to accomplish the project and practice the concept of “harmless nature means endless treasure”. Based on the theory of industrial symbiosis, an ecological combination and integration of energy-intensive industries has come into being, even forming energy-intensive industrial clusters. In another word, an ecological industry chain is the basic unit of an eco-industrial system [
5], and it plays a potential role in the circular economy of an industrial cluster. The effect of ecological industry chains is not easy to be measured directly, but it can be reflected by the eco-efficiency, which is an index to measure economic output and environmental input [
6]. It is widely used by the researchers to study environmental performance. Ramli [
7] evaluated the eco-efficiency of the manufacturing industry, and provided some direction in formulating policies and strategies about environmental issues.
From the point of view of production process, the energy-intensive industries need a lot of resources initially, and have lots of pollutant emissions finally. It is feasible to decompose the ecological efficiency into the resource efficiency and environmental efficiency to measure the ecological development level of the production activity. Yiwen Bian [
8] used a data envelopment analysis (DEA) model to measure the resource and environment efficiency of 30 provinces in China. By analyzing and comparing the resource efficiency and environment efficiency of energy-intensive industrial clusters, ecological efficiency was applied to evaluate the influence of the ecological industry chain on the sustainable development of the industrial cluster. It is rare to use ecological efficiency to research the effect of industrial chains in a specific industry.
Based the above considerations, this paper intends to research whether the eco-industry chains promote the eco-efficiency, and provide theoretical reference for the energy-intensive industrial cluster to construct ecological civilization.
2. Literature Review
The ecological industry chains improve the utilization of resources in industries by imitating the efficient use of materials and energy in the natural ecosystem [
9]. To some extent, it is the industry chain and industry chain network that reduce the environmental load [
10]. As for the study of ecological industry chains, it has been present in research for several decades. With the concept of industrial symbiosis being widely recognized, there are more and more scholars that have researched the symbiotic relationship between industries or enterprises based on ecological industry chains [
11,
12]. Here comes a question: how do the ecological industry chains influence the industry system? It is proposed that the chain network should be established around the core enterprise while supplementation to the core industry chain helps to improve system stability [
13]. The higher the productivity and resource utilization rate of an enterprise or industry itself, the stronger the ability to absorb other symbiotic enterprises or industries, the more likely it is to form a firm ecological industry chain, and the higher the ecological benefits and economic benefits [
14]. Built on waste recycling, the ecological industry chain is an important way to realize the sustainable development of economy and society [
15], and the ecological level of an industry chain determines the economic benefits and environmental benefits of industrial clusters or specific regions. However, the impact of ecological industry chains on sustainable development still needs to be empirically analyzed with objective data.
Eco-efficiency is an effective quantitative analysis tool for sustainable development [
16]. It is a comprehensive index reflecting economic value and environmental impact, and it can be used to analyze the sustainable development of industry [
17], industrial systems [
18,
19], and so on. The concept of eco-efficiency was first proposed by the German scholar Schaltegger in 1990 [
20]. At present, there are applications in many fields of eco-efficiency. Claudine Basset-Mens [
21] produced an updated reference of the ecological efficiency of New Zealand dairy farm systems and analyzed the implications of intensification on their eco-efficiency. Oggioni [
22] utilized ecological efficiency to measure 21 prototypes of cement industries operating in many countries, and the empirical results show that one country’s cement industries invest in technologically advanced kilns and adopt alternative fuels and raw materials in production processes are usually eco-efficient. Industry chains include the supply chain and enterprise chain value chain, etc. [
23]. Some researchers combine eco-efficiency with supply chains to learn the ecological impact. For example, Michelsen [
24] presented a methodology about how eco-efficiency in extended supply chains can be measured, based on furniture production. English [
25] used ecological efficiency to study cold roll formed products, and found that optimistic production rates improve the economic stability of the company, thus ensuring their sustainable economy and future.
However, ecological efficiency cannot evaluate specifically from two aspects of resource consumption and the pollution emission of environmental impact. Considering that eco-efficiency essentially covers two concepts of resource conservation and environmental friendliness [
26,
27], many scholars have broken down ecological efficiency into resource efficiency and environmental efficiency to analyze it in detail. For example, Dajian Chu [
28] constructed an eco-efficiency index that consisted of resource efficiency and environment efficiency. Lahouel [
29] selected 17 French consumer service enterprises as samples to conduct an empirical analysis of the resource efficiency and environment efficiency. Heping Huang [
30] analyzed the development mode and regularity of the circular economy of Jiangxi Province in eastern China by using resource energy efficiency and environment efficiency. Huilu Yu [
31] evaluated the circular economy level in Shizuishan from two dimensions of resource efficiency and environment efficiency. From the system perspective, Yingchun Gao [
32] measured the industrial eco-efficiency of Jilin Province by integrating the environment efficiency in different stages. Furthermore, Halkos [
33] used the data envelopment window method to analyze the environment efficiency of 17 countries for the time period 1980–2002. It can be seen that many scholars divided ecological efficiency into two parts, resource efficiency and environment efficiency, sometimes replacing eco-efficiency with environment efficiency, in order to evaluate the ecological development of a circular economy in an industry or region.
In addition, in order to accurately measure resource efficiency and environment efficiency, many scholars have scientifically quantified and expanded various factors of ecology and economy on the basis of the original eco-efficiency evaluation methods. For instance, Cunzhi Guo [
34] measured resource efficiency and environment efficiency through considering water, electricity, and gas consumption as an efficiency input index, and waste water, waste gas, solid waste emissions, and the total economic development as an efficiency output index. On this basis, Xiaojuan Cheng [
35] comprehensively integrated resource efficiency input indexes into energy consumption, water consumption, capital investment, and human resource investment. Liming Chen [
27] considered capital, manpower, water, electricity, and land as inputs of economic efficiency, wastewater, waste gas, and dust emissions as inputs of environment efficiency, and the industrial output as an output index; then, he constructed a relatively scientific and comprehensive evaluation system of resource efficiency and environment efficiency in order to accurately evaluate the synergetic development of the ecology and economy of the subjects. Overall, the input index of resource efficiency mainly includes the use of various resources, the input index of environment efficiency mainly includes the emission of various pollutants, and the output indicator of resource and environment efficiency usually use economic benefits to reflect.
3. Research Models
3.1. Two-Dimensional Three-Layer Matrix Analysis Framework
This energy-intensive industrial cluster mainly includes the chemical industry, building materials industry, metallurgy industry, and thermal power industry. It is the most concentrated industrial cluster of resource consumption and environmental pollution. Eco-efficiency emphasizes resource conservation and environmental friendliness. Thus, resource efficiency and environment efficiency is selected to represent the eco-efficiency of the energy-intensive industrial cluster, which can be utilized to measure the resource saving and environmental protection effect of the industry, industry chain, and industrial cluster, in order to reflect the resource utilization and environmental benefit level within and across industries. Due to the limitations of transportation distance and cost, energy-intensive industrial clusters are generally concentrated within a certain spatial range. The industry chains referred to in this paper are the industry chains within the industrial cluster. An industrial cluster is formed on the basis of the industrial chain relationship among enterprises within the cluster. In another word, practically, the industrial chain is always limited by space. Therefore, the industrial cluster referred to in this paper is at a higher level than the industry chain. Based on the existing eco-efficiency research and the relevant theories of the ecological industry chain, this paper analyzes the eco-efficiency from three levels of a single energy-intensive industry, an energy-intensive industry chain, and an energy-intensive industrial cluster (industry chain network), and constructs a two-dimensional three-layer matrix analysis framework of the eco-efficiency of an energy-intensive industrial cluster, as shown in
Table 1.
As for energy-intensive industry, the weakness and improvement direction of the eco-efficiency of a single industry can be found by analyzing the resource efficiency and environment efficiency within an energy-intensive industry. As for an energy-intensive industry chain, almost every energy-intensive industry has formed an ecological industry chain relationship with another industry. The resource recycling and energy cascade utilization between industries can help improve the level of resource efficiency, and the recycling of waste resource reduces environmental pollution and improves the level of environmental benefits. Therefore, we can evaluate the polymerization effect of the ecological industry chain between industries through the analysis of the eco-efficiency of two energy-intensive ecological industries. As for the energy-intensive industrial cluster, the link function of ecological industry chains makes the industrial cluster connect and influence each other, and finally forms the ecological industry chain network. Therefore, the resource efficiency and environment efficiency of the energy-intensive industrial cluster can reflect the network effect and the overall effect of resource saving and environmental protection at the regional level or park level.
3.2. Eco-Efficiency Models
The energy-intensive industries aim to improve the industrial eco-efficiency by reducing resource investment, improving resource utilization, reducing waste emissions, and improving environmental benefits. However, the utilization rate of resources is limited under the single industry, because the waste can hardly be fully converted and reused within the industry, and generally needs to be transported to other industries in order to improve the recycling rate of resources. Therefore, the construction of the energy-intensive industry chain and the energy-intensive industrial cluster will improve the eco-efficiency in theory. Based on the analysis of the characteristics of energy-intensive industries, the eco-efficiency analysis models of energy-intensive industry chains and the energy-intensive industrial cluster are as shown in
Figure 1 and
Figure 2, respectively.
At the level of energy-intensive industry, the eco-efficiency system of a single energy-intensive industry is composed of enterprises in this industry. Resource investment mainly includes energy resources, capital investment, and labor input, reflecting material, financial, and human input. Pollutant emissions mainly include sulfur dioxide emissions, industrial waste water discharge, and waste residue and other solid waste emissions. Resource input and waste emissions are the price that enterprises pay for product value. However, due to the similarity of all business types within the single industry and the extremely short industry chain, only a very small proportion of resources can be integrated and reused within the enterprise or industry, so that most of the by-products, residual heat, and residual energy cannot be used effectively.
At the level of an energy-intensive industry chain, every two industries can combine into six typical and representative energy-intensive ecological industry chains according to the relationship between the transfer and utilization of materials and energy between four energy-intensive industries. Energy-intensive industries lengthen the industry chains further than a single industry, and get more resources recycled to achieve a flow of by-products and waste between different industries. As a result, resource utilization can be improved, and the emission intensity of pollutants can be reduced, such as exhaust gas, waste water, and solid waste.
At the level of this energy-intensive industrial cluster, the majority of resource investment is toward coal, metal, non-metallic minerals, and chemical raw materials; the pollutant emissions are mainly three waste emissions, and the output are a variety of energy-intensive products, as well as recyclable electrical energy, thermal energy, and so on. The vertical extension and horizontal coupling of the industry chain make the various industries more closely linked. To be specific, the building materials industry uses the solid waste generated by thermal power and the chemical and metallurgical industries as raw materials for production. Furthermore, the residual energy generated by the chemical and metallurgical industries can be used for its own production activities, and the waste heat can be used by the thermal power industry to generate electricity. The coke oven gas is a by-product that is produced by the metallurgical industry, and can be converted into chemical products such as benzene and phenols using professional chemical techniques. The chemical industry provides the metallurgical industry with by-products such as coke as fuel. The waste heat generated in the production process of the building materials industry can also be used in the thermal power industry. Therefore, the realization of resource saving and environmental improvement while maximizing economic benefits can maximize the resource efficiency, environment efficiency, and eco-efficiency of this energy-intensive industrial cluster.
4. Research Methods
4.1. Input–Output Index of Eco-Efficiency
The eco-efficiency system of an energy-intensive industry includes resource efficiency and environment efficiency. According to the previous research, the data envelope analysis method is used to calculate its value. Besides, both input and output indicators use specific values to ensure reliability, as shown in
Table 2.
(1) Resource efficiency. The comprehensive energy consumption, unit output labor input, and unit output capital input are taken as the input index of the resource efficiency, and the average industrial output value is taken as the output index, in order to comprehensively reflect the input and product value output of the material, human, and financial resources of the energy-intensive industry. Besides, the ratio of the average annual number of employees to the industrial output value indicates the unit output labor input, while the ratio of the new fixed assets to the industrial output value indicates the unit output capital input, and the ratio of the industrial output value to the number of enterprises indicates the average industrial output value.
(2) Environment efficiency. The unit output of exhaust gas emission, unit output of waste water discharge, and the unit output value of solid waste emission are taken as the input index of the environment efficiency input, and the average industrial output value is taken to be the output index, in order to reflect the environmental cost and the corresponding economic benefit. Besides, the input index is expressed by the ratio of three waste emissions to the industrial output value.
(3) Eco-efficiency. Eco-efficiency is a composite of resource efficiency and environment efficiency, and the formula is shown as below [
36].
4.2. Evaluation Model of Eco-Efficiency
Data envelopment analysis (DEA) is based on the relative efficiency concept, and evaluates the relative effectiveness or benefit of unit, according to the multi-indicator input and multi-indicator output. It does not need to consider the functional relationship between input and output, and does not need to estimate the parameters and hypothesis weights in advance, avoiding subjective factors [
37]. At present, almost all eco-efficiency is calculated using the DEA models. Data envelopment analysis of the input index and output index is carried out, and the resource efficiency and environment efficiency value are obtained, respectively. The classic input-oriented CCR model assumes the outputs are fixed and has more attention on the inputs. It is used in this paper, as shown in Formula (1):
Presume that the DMU (decision-making unit) includes m inputs, s outputs, and that Model (1) is composed of n DMUs. It can be known from the model that i = 1, 2, ..., m; r = 1, 2, ..., s; j = 1, 2, ..., n. Besides, Xij and Yrj represent eco-efficiency inputs and outputs, Xij > 0 and Yrj > 0; Vi and Ur are weight coefficient variables. The meaning of the model is to take the weight coefficient Vi and Ur as the variables, and the efficiency hj of all DMUs as the constraint, and then aim at maximizing the production efficiency of the j0th DMU.
4.3. Classification of Eco-Efficiency
Eco-efficiency is the ratio of the economic output to the environmental impact. Resource efficiency is the ratio of the economic output to the consumption of resources, and environmental efficiency is the ratio of the economic output to the amount of pollution emissions. The efficiency values are in the interval (0.1). When the efficiency value is one, the production activity is at the forefront of production, and it is the most efficient. In addition, it can be seen from the expressions of eco-efficiency, resource efficiency, and environment efficiency that when the efficiency is higher, it is more efficient. Thus, producers can acquire more economic gains compared with its environmental impact. In another word, assuming the same economic output, the lower the total environmental impact, the higher the ecological efficiency. Therefore, the efficiency grade is divided accordingly. If
is used to represent resource efficiency, environment efficiency, and eco-efficiency, the specific division is shown in
Table 3.
5. Results and Analysis
The original data about the eco-efficiency of this energy-intensive industrial cluster are mainly derived from China Statistical Yearbook, China Industrial Statistics Yearbook, China Energy Statistics Yearbook, and China Environment Statistics Yearbook. In addition, the chemical raw materials and chemical manufacturing industry, the non-metallic mineral products industry, the ferrous metal smelting and rolling processing industry, and the thermal power production and supply industry are respectively selected to represent the chemical industry, building materials industry, metallurgical industry, and thermal power industry. Since the data in the statistical yearbooks of our energy-intensive industries are mostly complete, we chose the data from 2004 to 2015 for empirical analysis.
5.1. Evolution Analysis of Eco-Efficiency of Energy-Intensive Industry
According to the eco-efficiency index system and the data envelope analysis model, the evolution trend of resource efficiency and environment efficiency in four energy-intensive industries is obtained by using Deap2.1 Software, as shown in
Figure 3.
As can be seen from
Figure 3a,b, the resource efficiency and environment efficiency of four energy-intensive industries are generally on the rise, but with greater volatility. In terms of resource efficiency, the average values of the chemical industry and building materials industry are 0.702 and 0.797; they are at a better situation of development, which is significantly higher than the metallurgical industry and thermal power industry, which have values of 0.575 and 0.583, respectively. The chemical industry and building materials industry use raw materials sourced by upstream suppliers, as well as chemical by-products produced by metallurgical industry and thermal power industry, such as sulfuric acid and solid waste. That means that the chemical industry and building materials industry have strong capabilities regarding the absorption and utilization of resources. As for environment efficiency, the average values of the metallurgical industry and thermal power industry are 0.691 and 0.690, respectively. They are both at a better level, which is significantly higher than the averages of the chemical industry and building materials industry, which are 0.529 and 0.483, respectively. The reason is probably that the industrial waste water and industrial waste residue produced by the metallurgical industry and thermal power industry can be used as cooling water and production materials for other industries. Meanwhile, the chemical industry produces a large amount of waste, and its pollutants generally have a high risk, most of which cannot be recycled, resulting in a higher degree of environmental pollution, and thus a lower level of environment efficiency. The building materials industry can use waste from other industries to produce its products, but their own waste is difficult to be used by other industries; the majority of waste is released into the natural environment, resulting in the low environment efficiency of the building materials industry.
Besides, the fluctuation of the resource efficiency of four energy-intensive industries is more pronounced than that of their environment efficiency. The improvement of the resource efficiency in each industry needs technological innovation or transformation in to order to be realized, and the technical difficulty is hard to overcome in a short time. The overall increase in environment efficiency was significant, with the exception of the chemical industry, which showed significant fluctuations in 2009; the rest of the industry shows a steady growth trend. In recent years, the environment efficiency of energy-intensive industries is obviously higher than their resource efficiency, which shows to a certain extent that the binding effect of energy-saving and emission reduction policies has a greater effect.
5.2. Evolution Analysis of Eco-Efficiency of an Energy-Intensive Industry Chain
Based on the relevant data and the energy-intensive industry chain, the efficiency value of two industries in the industry chain is summed up. The evolution trend of resource efficiency and environment efficiency of six typical energy-intensive industry chains is shown in
Figure 4.
As can be seen from
Figure 4a,b, the resource efficiency and environment efficiency of the energy-intensive industry chains generally show an upward trend. From the point of view of resource efficiency, the average values of six industry chains between two different industries range from 0.5 to 0.9. In general, resource efficiency is in a good situation. To be specific, the average value of the resource efficiency of the metallurgical-thermal power industry chain is 0.566, and the average value of the chemical–thermal power industry chain is 0.841. The reuse of material resources between the metallurgical industry and the thermal power industry is less, and the main part is that the waste energy and waste heat produced by the metallurgical industry are reused by the thermal power industry. The thermal power industry provides electricity to the metallurgical industry for production and operation. This may be the main reason for the low level of resource efficiency in the metallurgical–thermal power industry chain. The metallurgical industry produce a large number of coke oven gas as a by-product, which can be recycled by the chemical industry and converted into benzene, phenol, and other chemical products after a deep processing, so that the resource efficiency is improved. From the point of view of environment efficiency, the evolution trend of the efficiency of six energy-intensive industry chains is generally consistent, showing a stable upward trend. The improvement of energy saving and emission reduction technology and environmental awareness, as well as the reinforcement of the link strength of ecological industry chains, make the environment efficiency of each industry chain improve, and the difference between industry chains is not overt.
Comparing
Figure 3 and
Figure 4, it can be seen that the means of the resource efficiency and environment efficiency of six energy-intensive industry chains are 0.762 and 0.594, while those of four energy-intensive industries are 0.664 and 0.598, respectively. This means that the resource efficiency average value of the energy-intensive industry chain is significantly higher than that of the energy-intensive industries, and the average value of the environment efficiency is roughly same. It shows that the role of the ecological industry chain significantly improves the resource efficiency of each industry chain. In addition, the evolution trends of resource efficiency and environment efficiency in the energy-intensive industry chain are more stable. The link effect of energy-intensive industry chains has a good effect on the resource efficiency and environment efficiency of energy-intensive industries.
5.3. Evolution Analysis of Eco-Efficiency of Energy-Intensive Industrial Cluster
Based on the concept of an ecological industry chain network and an energy-intensive industrial cluster, we sum up the resource efficiency and environment efficiency data in the industrial cluster and calculate the resource efficiency and environment efficiency of the energy-intensive industrial cluster by using the formula of the data envelope analysis model; the evolution trend is shown in
Figure 5.
As can be seen from
Figure 5, the resource efficiency and environment efficiency of the energy-intensive industrial cluster show an overall upward trend from 2004 to 2015. In terms of resource efficiency, the growth is stable. The average value is 0.697, but there was a significant decline in 2009 and 2012. Affected by the 2008 financial crisis, the total decline in product exports in 2009 was significant, leading to a negative impact on the overall environment and production and operation activities of energy-intensive industries, and resulting in a decline in resource efficiency. It was the first year of China’s economic structural reform in 2011, while being influenced by domestic and foreign political and economic factors such as the worsening of the European debt crisis, which led to fluctuations in resource efficiency. In terms of environment efficiency, the growth trend is significant: the average value is 0.608. It had a higher rate of environment efficiency growth from 2004 to 2011,but slowed down in 2012, and approached the maximum value.
Comparing
Figure 5,
Figure 4, and
Figure 3, it can be seen that the level of resource efficiency and environment efficiency of the energy-intensive industrial cluster and energy-intensive industry chains is significantly higher than that of a single energy-intensive industry. The growth trend of resource efficiency and environment efficiency in an industrial cluster and industry chains is more stable. It means that the energy cascade utilization in industry chains and the industrial cluster, the mutual utilization of by-products, and the flow and utilization of waste in the industry chains network not only improve the resource efficiency, but also reduce the environmental pollution and promote the eco-efficiency of the energy-intensive industrial cluster.
5.4. The Comparison of Eco-Efficiency in Three Layers
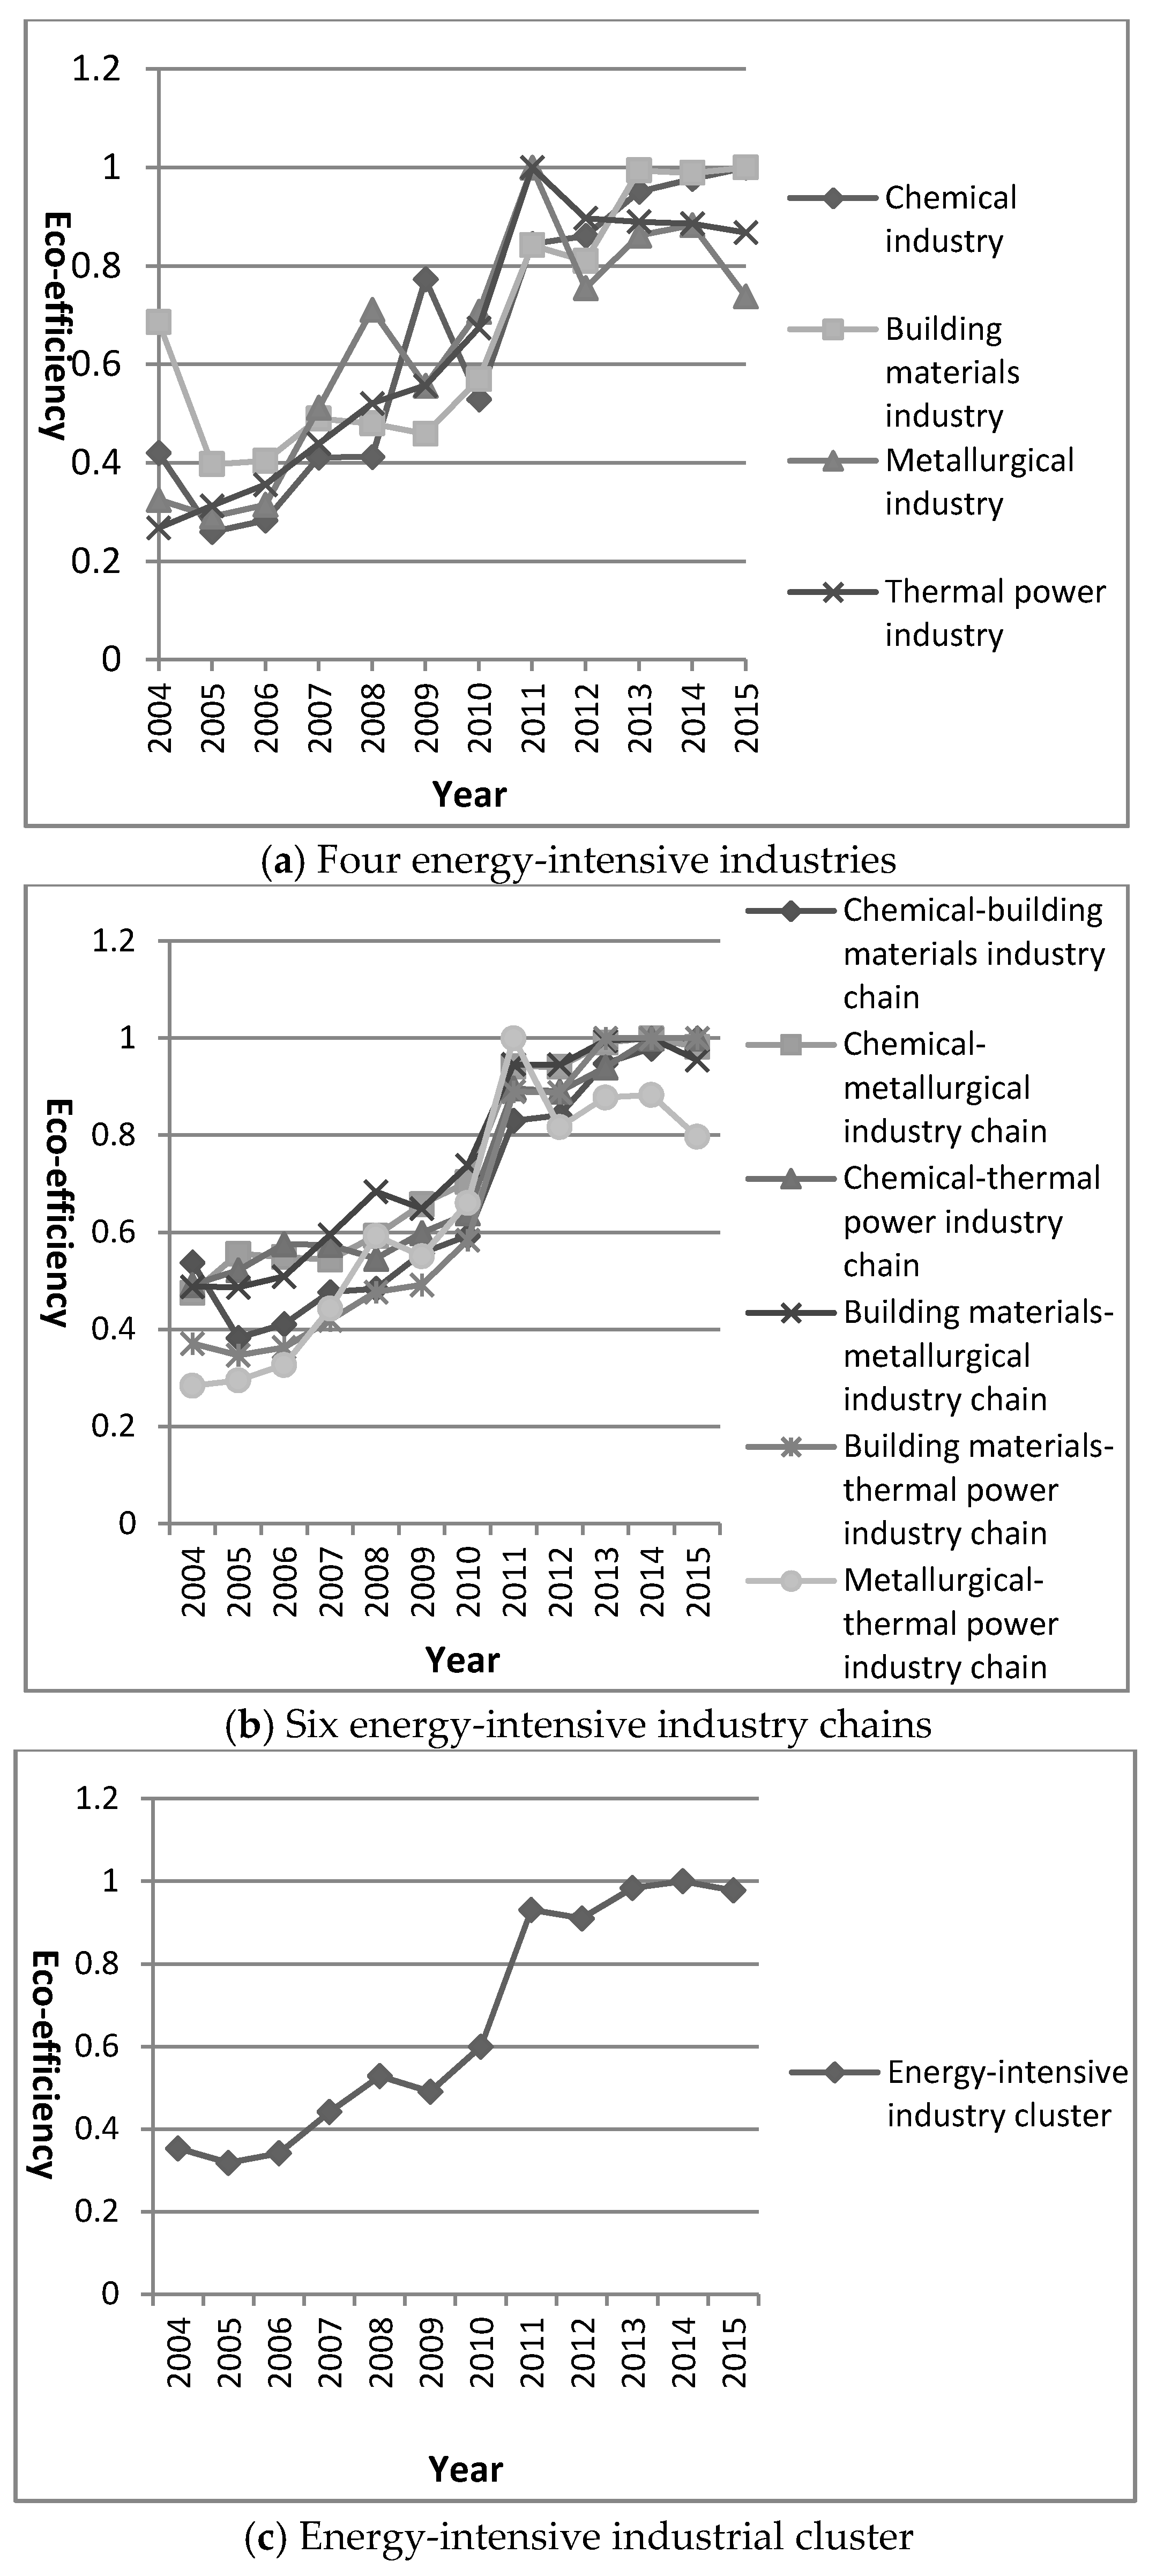
Based on the evolution and comparative analysis of the resource efficiency and environment efficiency of energy-intensive industries, industry chains, and the industrial cluster, the eco-efficiency is calculated and normalized according to the eco-efficiency evaluation model. The eco-efficiency values among the three levels of the energy-intensive industrial cluster are shown in
Table 4 and
Figure 6.
As can be seen from
Table 4,
Figure 6a–c, the eco-efficiency of the energy-intensive industries, industry chains, and the industrial cluster show an upward trend from 2004 to 2015. From the point of view of energy-intensive industries, the mean eco-efficiency was 0.649, and it is generally in a good condition. The mean eco-efficiencies of four industries were all near or reached 0.600 in 2010, which indicated achieving better development. From the perspective of six energy-intensive industry chains, the mean of their eco-efficiency was 0.695, which is about 15.8% higher than four single energy-intensive industries, and the upward trend is more stable. In other words, the effect of ecological industry chains contributes to the development and promotion of eco-efficiency. From the point of view of an energy-intensive industrial cluster, the mean of eco-efficiency was 0.656, which is higher than a single industry, but lower than industry chains. In general, the ecological industry chain network of an energy-intensive industrial cluster is not perfect, and not interconnected enough.
It is remarkable that the mean eco-efficiency of the energy-intensive industries, industry chains, and industrial cluster were 0.903, 0.940, and 0.961 from 2011 to 2015, respectively, which indicated achieving excellent development. Moreover, the eco-efficiency of this energy-intensive industrial cluster was significantly higher than that of any single industry or the industry chain, which shows that the construction of an eco-industry chain network has a great result in recent years, and has an optimistic effect on eco-efficiency.
6. Discussion
6.1. Comparative Analysis with Existing Studies
According to a previous literature review, there are many studies about eco-efficiency in various industries or regions. For example, Stefan [
38] used eco-efficiency to judge the relative environmental harmfulness of different source markets or forms of tourism, and assessed the sustainability of tourism. Andrés [
39] assessed farming eco-efficiency using the DEA model to analyze the factors of eco-efficiency, based on a case of rain-fed agriculture in Castilla and León (Spain). Randla [
40] analyzed the regional sustainability and ecological efficiency of energy production in Estonia. Olli Salmi [
41] found that complex utilization does increase eco-efficiency, but not all harmful emissions decrease. It can be seen that most scholars would like to use eco-efficiency to assess the sustainable development of an industry or region. However, there are few research studies about the eco-efficiency of a specific industrial cluster, especially the energy-intensive industrial cluster.
As for an ecological industry chain, Korhonen [
42] focused on the industrial ecology cascade chain of the paper industry, and founds that the paper industry lacks waste processors and handlers in its latter steps. It means that waste processors and handlers are indispensable for sustainability. Eco-Industrial parks are the embodiment of industrial symbiosis and ecological industry chain relationships. Behera [
43] found that eco-industrial parks can stimulate the development of symbioses through a systematic design approach. Based on the theory of an ecological system, Xiaoling Li [
44] designed a circular economy industrial chain of ecological agriculture, created a county recycling economy development model, and described the connotation of an ecological county. Si-hua Chen [
15] established an evolutionary game model for an ecological industry chain and applied it to the Poyang Lake ecological economic zone to verify the model. As for the ecological industry chain of an energy-intensive industrial cluster, Jiliang Zheng [
4] recognized that ecological industry chains have formed in energy-intensive clusters, and that the ecological industry chain is beneficial to the sustainable development of an industrial cluster, but there is no detailed analysis of the specific role of the ecological industry chains.
In a word, it is unusual to combine ecological industry chains with eco-efficiency in order to study an energy-intensive industry, energy-intensive industries, and energy-intensive industrial clusters. As we all know, energy-intensive enterprises and industries are both facing great pressure regarding energy saving and emission reduction, environment management, and ecological civilization construction. The energy-intensive industrial cluster contains numerous ecological industry chains and network relations, but there is no scientific evaluation of its effectiveness. Therefore, this paper intends to research and evaluate the effect of the ecological industry chain and network in the energy-intensive industrial cluster from the perspective of eco-efficiency, in order to objectively monitor the circular economy process.
6.2. Academic Value and Contribution
As we all know, China as the largest developing country in the world is confronted with a urgent task to realize sustainable development. The energy-intensive industrial cluster is the industry with the most concentrated resource consumption and pollution emission, and its construction and the closeness of the ecological industry chain affect China’s circular economy construction and degree of sustainable development. Therefore, this paper analyzes the different levels of the energy-intensive industrial cluster, and finds that the ecological industry chain can promote the improvement of eco-efficiency. In addition, this paper decomposes eco-efficiency into resource efficiency and environment efficiency, analyzes the energy-intensive industrial cluster from two angles of resource waste and environmental pollution, and provides a theoretical basis to select the direction of sustainable development and formulate an environmental protection policy.
6.3. Limitations
Limitations exist for this study. This paper selects the energy-intensive industrial cluster in the whole China region as the research object. It can only analyze the resource consumption and environmental pollution of the energy-intensive industrial cluster in general; it cannot analyze the resource efficiency and environment efficiency level of each region and compare the differences. Therefore, in future research, we can further analyze and compare the ecological efficiency of energy-intensive industrial clusters in different regions, and find out the areas where the need for improvement is urgent.
7. Conclusions
Based on the core concept of eco-efficiency and the theory of an ecological industry chain, eco-efficiency is regarded as an organic combination of resource efficiency and environment efficiency, which is reflected in the three levels of industry, industry chain, and industrial cluster, which together make up a two-dimensional three-layer matrix analysis framework. According to the empirical and comparative analysis of the chemical industry, building materials industry, metallurgy industry, and thermal power industry from 2004 to 2015, several conclusions are attained.
Firstly, the resource efficiency and environment efficiency of four energy-intensive industries show a significant upward trend. The average values of resource efficiency for the chemical industry and building materials industry are higher than those of the metallurgical industry and thermal power industry. The average values of the environment efficiency of the metallurgical industry and thermal power industry are higher than those of the chemical industry and building materials industry. Whether by-products and waste can be used by other industries in production activities are major factors affecting resource efficiency and environment efficiency.
Secondly, the resource efficiency and environment efficiency of six typical ecological industry chains and their energy-intensive industrial cluster show a gradual upward trend, and have reached an excellent level in recent years. Generally speaking, the resource efficiency and environment efficiency of these energy-intensive industry chains and this industrial cluster are both higher than that of any single energy-intensive industry. Besides, the resource efficiency and environment efficiency of the industry chains and this industrial cluster are more stable than that of any single industry.
Thirdly, the eco-efficiency of these energy-intensive industries, industry chains, and their industrial cluster are generally in a good condition. The eco-efficiency of the industry chains and industrial cluster are higher than that of any single energy-intensive industry, and the upward trend of the energy-intensive industries is more stable. The eco-efficiency of the energy-intensive industrial cluster reached an excellent level from 2011 to 2015, which was significantly higher than that of any single industry or the industry chains. It shows that the construction effect of an ecological industry chain network, such as a regional industrial cluster and eco-industrial zone, significantly improve the eco-efficiency of an energy-intensive industrial cluster. Especially in recent years, the construction of an ecological industry chain network of an industrial cluster has remarkable results. However, it can also be seen that the ecological industry chain network of an energy-intensive industrial cluster is not perfect enough, and there is room for further improvement.
Based on the above conclusions, there are some suggestions as following:
Firstly, energy-intensive enterprises should establish an ecological civilization outlook. Enterprise is the organizational unit that constitutes the industry, and the industry constitutes the industrial cluster. The by-product of each enterprise in the industry and the material flow of waste form the micro-circular economy network, while the materials and energy flow between industries form the large-scale ecological industry chain network. The development of a macroscopic circular economy and the construction of ecological civilization depend to a great extent on the resource saving, environmental protection consciousness, and action of enterprises. The government and social communities should help energy-intensive enterprises establish an ecological civilization outlook.
Secondly, the efficiency of energy saving and emission reduction between energy-intensive industries should be improved. The cooperation within different industries plays a crucial role in the promotion of energy saving and emission deduction, and has an impact on eco-efficiency. This is because the reduction of resources, energy consumption, and environmental pollutant emissions in various industries affect the comprehensive utilization of resources in an industrial cluster, as well as reduce the environmental load caused by pollution emissions. In other words, the improvement of energy saving and emission reduction efficiency between energy consumption industries is a effective way to enhance the link intensity of ecological industry chains and accelerate the pace of industrial cluster circular economy construction.
Thirdly, the construction of industrial clusters and ecological industrial parks should be vigorously promoted. The industrial organization model of an industrial cluster is more favorable to the improvement of eco-efficiency, and the length of an ecological industry chain within the energy-intensive industrial cluster should be extended appropriately in order to promote the recycling of resources and energy, reduce the intensity of waste emission, and improve the level of eco-efficiency. An eco-industrial park is the manifestation of an industrial cluster in a specific region, and it is the practice of the concept of a circular economy. Therefore, constructing industrial clusters and ecological industrial parks play an irreplaceable role in industrial transformation and upgrading.


