Improving the Performance of Dry and Maritime Ports by Increasing Knowledge about the Most Relevant Functionalities of the Terminal Operating System (TOS)

 , , and
Abstract
:1. Introduction
1.1. Container Terminal Structure
- The operational area between the quay wall and container yard (area just behind the berth front).
- The container yard (terminal storage, which is the stacking area): the area where the containers are stocked and where the loading and unloading activities of these units are carried out.
- The terminal area of landside operations, which includes the gate, parking, office buildings, customs facilities, container freight station with an area for stuffing and stripping, empty container storage, a container maintenance and repair area, and so on.
1.2. Terminal Operating System—Definition
- Software that provides management, storage, and movement control of different types of loads in terminals, with the basic function of supporting the logistic processes [27].
- “A computer system that is designed to plan, track, and manage the movement and storage of all cargo, the use of assets, and the deployment of people in and around the seaport terminal or the port (including the hinterland) on a real-time basis” [28].
- “Terminal Operating System (TOS) is the core application used by container terminal for both for planning, monitor and execute the containers movement from truck to yard, yard to truck, truck to vessel and vessel to truck using heavy lifting equipment (called Container Handling Equipment—CHE)” [29].
- “A TOS provides a set of applications to collect, store, manage, analyze, and disseminate information from different terminal activities in order to provide an integrated view on core terminal processes and ensure an efficient use of resources for handling cargo” [19].
1.3. State-of-the-Art of Previous Research on Inland Terminals, the Use of AHP in Inland and Port Terminals, and TOS
1.3.1. Application of AHP to Port and Inland Terminals
1.3.2. Terminal Operating System—Previous Studies
2. Materials and Methods
2.1. Description of Expert Panel
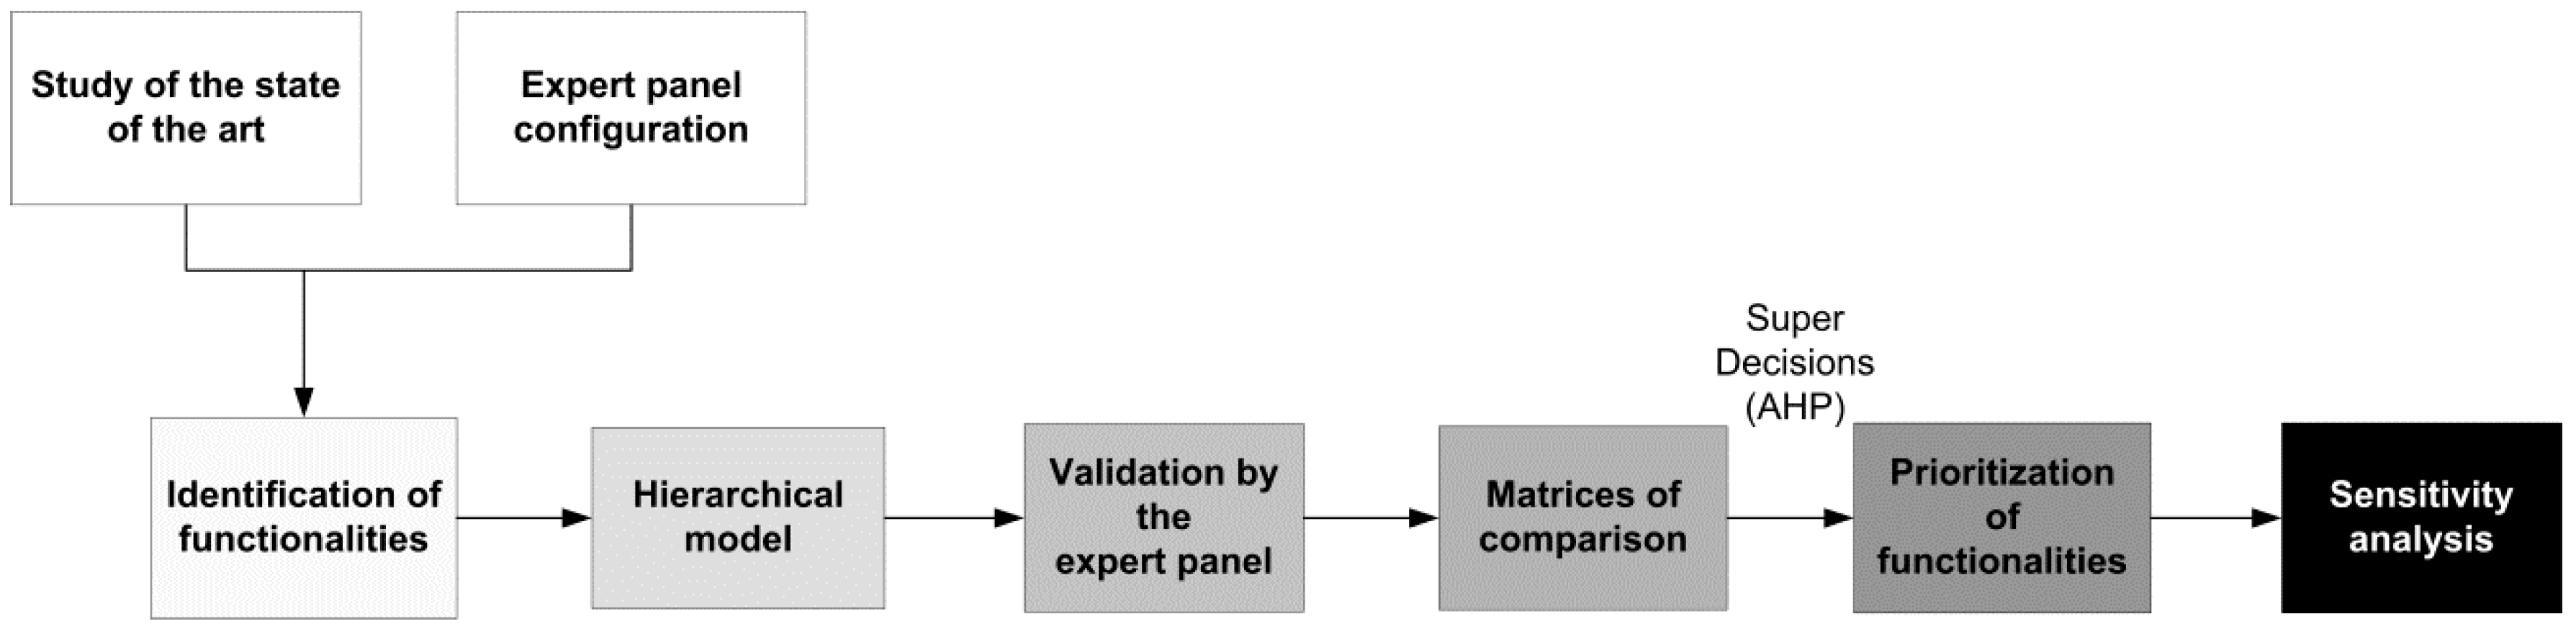
2.2. Method
- Identification of TOS functionalities. The first step is the identification of functionalities of the TOS (including current functionalities and potential functionalities that will improve the TOS performance and increase the efficiency of port and inland terminals). The selection of the methods to gather the requirements was done following the methodology developed by Carrizo et al. (2014) [61]. The selection of these functionalities was firstly assessed through a study of the state of the art, obtaining a first draft of the functionalities, which were then further extended by the expert panel through individual interviews.
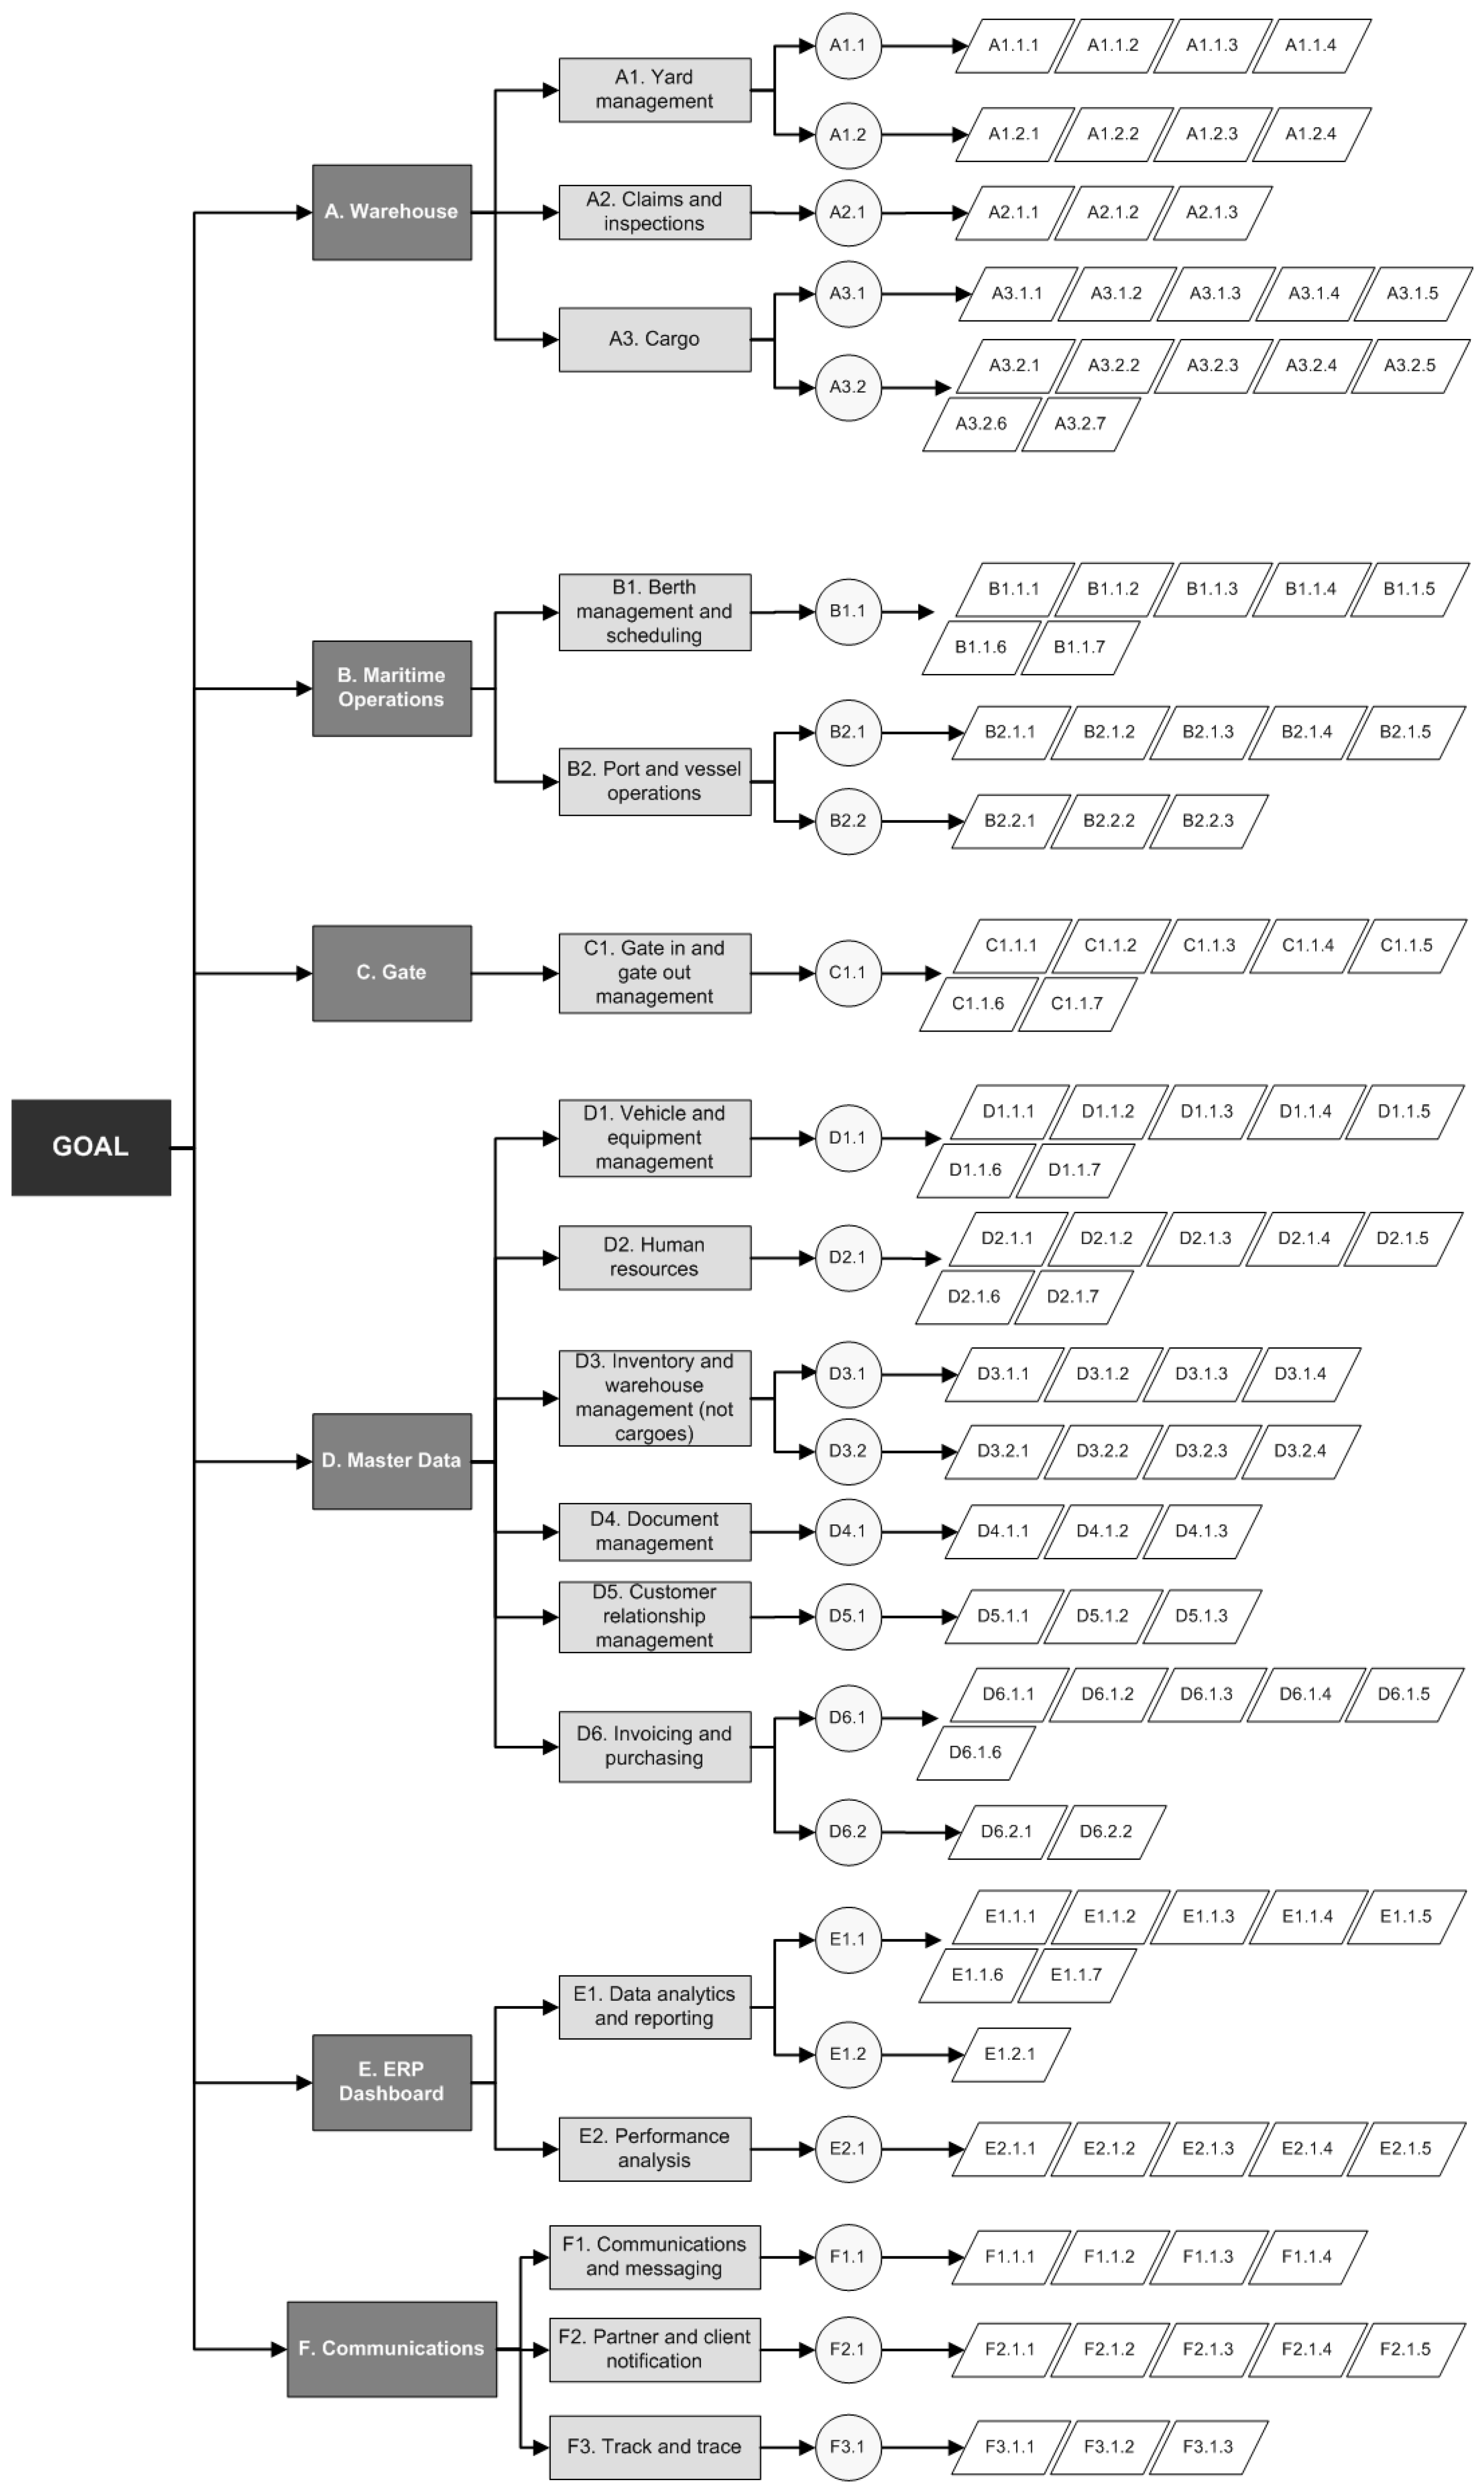
- Construction of the hierarchical model. After finding all the functionalities of a TOS, they were clustered into groups, forming the hierarchical model. The number of functionalities within each cluster or level was kept at seven or below, since there is a limit on the amount of information that the human mind can process and more variables will reduce the consistency and validity of the results [62,63].
- Validation by the expert panel. The role of the expert panel was to: (a) add, remove, and/or validate the functionalities defined in (1), (b) change or validate the defined hierarchical model, and (c) perform a pairwise comparison of the functionalities included in each of the clusters of criteria or levels with respect to the overall focus, using the scale of Saaty [56] (see Table 1).
- Obtainment of comparison matrices. In order to obtain a single matrix of comparison for each of the clusters or levels of functionalities, consensus between the responses of the expert panel was obtained through calculation of the consistency ratio [34].
- Prioritization of TOS functionalities. Prioritization of TOS functionalities was performed using the software Super Decisions, which uses the AHP to prioritize criteria.
- Sensitivity analysis. Finally, a sensitivity analysis was developed, changing the weights of first-level criteria by ±20%, in order to assess the robustness of the results.
3. Results
3.1. Identification of TOS Functionalities
3.2. Hierarchical Model
3.3. Prioritization of Functionalities Using AHP
- The consensus values obtained from the comparisons of the functionalities at the same level and in the same cluster form, for each level, a comparison Matrix A:where (Equation (2))
- The local normalized weight of each functionality for each cluster, is calculated by raising this Matrix A to a sufficiently large power:
- Then, summing over the rows and normalizing, the local normalized weight is obtained at the kth power:
- iv.
- The global normalized weights for each functionality at the fourth level (), third level (), and second level () are calculated as shown in Equations (5)–(7), respectively:
3.4. Sensitivity Analysis
4. Discussion
5. Conclusions
Author Contributions
Funding
Acknowledgments
Conflicts of Interest
Appendix A

| A. Warehouse | ||
| A1. Yard Management | A1.1. Yard Configurations | A.1.1.1 CUSTOMIZABLE LAYOUT: Ability to create a customizable yard layout for multiple terminals/yards and traffic patterns/routes. |
| A.1.1.2 HISTORIC LOCATION: Provide real-time visibility of each unit at all applicable locations (e.g., terminal/yard/workshop/loading/bays/vessel). | ||
| A.1.1.3 SPACE OPTIMIZED: Optimize space utilization of the yard(s). | ||
| A.1.1.4 LOCATION OPTIMIZED: Identify the optimal location for each unit based on its destination by carrier, loading/unloading sequence, or intervention requirements. | ||
| A1.2. Technical Optimizations | A.1.2.1 GIS INTEGRATION: Provides integration with GIS, allowing the display of geospatial related data from the TOS. | |
| A.1.2.2 OPERATING PROCEDURES: Integration with operating procedures. | ||
| A.1.2.3 CUSTOMER INTEGRATION: Integration with equipment and carrier operating systems. | ||
| A.1.2.4 MULTIMODAL OPTIMIZATION capability. | ||
| A2. Claims and Inspections | A2.1. Claims and Inspections | A.2.1.1 INSPECTION TRACEABILITY: Record when an inspection request has been submitted. |
| A.2.1.2 INSPECTION ALERTS: Notify when inspection has not occurred within time frame from when it was requested. | ||
| A.2.1.3 INSPECTION REPORTS: Capture cargo inspection information, for example: whether cargo was inspected, when it was inspected, inspector’s name, and how much time it took to complete the inspection. | ||
| A3. Cargo | A3.1. Track and Notifications | A3.1.1 DELIVERY NOTIFICATIONS: Verification of delivery order data against manifest data and notification of customer services about discrepancies for reconciliation. |
| A.3.1.2 DELIVERY ALERTS: Notification when a delivery order has not been received within the time frame from the original receipt date. | ||
| A.3.1.3 ARRIVAL NOTIFICATIONS: Provide notifications of truck or rail arrival to other parties in the process such as security, longshore, and railcar coordinators. | ||
| A.3.1.4 ACCEPTANCE NOTIFICATIONS: Record/confirm received cargo against the broker or freight forwarder dock receipt. | ||
| A.3.1.5 WORKS TRACEABILITY: Record and track cargo mitigation, for example: seasonal fumigation for cargo, country-specific requirements for steam cleaning, or manufacturer requirements for specific protective coatings for cargo. | ||
| A3.2. Cargo Control | A.3.2.1 BILL OF LADING (BoL) UPDATES: Add cargo items to a bill of lading; for example: a component of a unit has to be removed and added as a separate item before the document is created for the truck driver. | |
| A.3.2.2 FLEXIBLE TARIFFS: Change the tariff item/billing rate for a specific delivery, for example: engine on a drivable cargo unit will not start and the unit must be lifted onto the truck and, as a result, billed using a different tariff item/rate. | ||
| A.3.2.3 CARGO VERIFICATIONS: Verify broker and freight forwarder dock receipts against the shipping line’s export lineup and notify operations of discrepancies for reconciliation. | ||
| A.3.2.4. RECORDING OF DAMAGES: Record cargo damages. | ||
| A.3.2.5 Generate and print CARGO TAGS. | ||
| A.3.2.6 Verify GROSS MASS on yard. | ||
| A.3.2.7 PACKING LISTS: Provide a means to reconcile project cargo (cargo disassembled for shipping) prior to releasing cargo for loading. | ||
| B. Maritime Operations | ||
| B1. Berth Management and Scheduling | B1.1. Berth Management | B.1.1.1. TIME TRACKING: Track vessel time related data, for example: estimated time of arrival, estimated time of departure, actual arrival, actual departure, time anchored, time in berth, etc. |
| B.1.1.2 EXTENDED VESSEL DATA: Establish additional data related to vessel voyages, for example: berth, terminal name, number of projected shifts, stevedore, maintenance and security requirements, etc. | ||
| B.1.1.3 SPECIAL CALLS: Flag certain voyages, for example: military not to be included in reports or viewable in the system except by designated personnel. | ||
| B.1.1.4 CUSTOMIZABLE ALERTS: Configurable alert notifications, for example: two-hour delay in vessel arrival or departure, customs release has occurred, etc. | ||
| B.1.1.5 WATERWAY CONTROL: Visibility and data for waterway activities at all berths. | ||
| B.1.1.6 BARGE BERTHS: Designate some berths as ‘lay berths’ (typically for barges). | ||
| B.1.1.7 MOBILE DATA: Remote or mobile access to information for night and weekend on-call waterway coordination. | ||
| B2. Port and Vessel Operations | B2.1. List and Confirmations | B.2.1.1 DISCHARGE CONFIRMATIONS: Record and confirm discharged cargo, for example: commodity, quantity, marks. |
| B.2.1.2 LOADING LISTS: Submit cargo to the terminal operators for vessel loading along with the cargo location. | ||
| B.2.1.3 UPDATED LISTS: Track cargo as it is loaded onto the vessel, for example: know what cargo still remains to be loaded. | ||
| B.2.1.4 UPDATED STOCK: Track cargo that was unable to be loaded onto the vessel, for example: inoperable cargo needing repair. | ||
| B.2.1.5 LIST CONFIRMATIONS: Provide the ability to confirm vessel loading is complete. | ||
| B2.2. Maritime Reports | B.2.2.1 DAMAGE REPORTS: Record damages to discharged cargo. | |
| B.2.2.2. CLEANING REPORTS: Record whether cleaning was required. | ||
| B.2.2.3 EMERGENCY REPORTS: Record and follow up emergencies. | ||
| C. Gate | ||
| C1. Gate In and Gate Out Management | C.1.1. Gate In and Gate Out Management | C.1.1.1 DELIVERY MANAGEMENT: Create and manage truck delivery appointments. |
| C.1.1.2 MOVEMENT TRACEABILITY: Notify terminal gate personnel of pending truck arrivals after a truck is received at the gate. | ||
| C.1.1.3 PRIOR APPOINTMENTS: Notify longshore personnel of pending truck and rail arrivals and cargo to be loaded after a truck is received at the gate. | ||
| C.1.1.4 Notify PENDING rail ARRIVALS. | ||
| C.1.1.5 GATE OPERATIONS: Submit dispatch and retrieval requests to gate operations. | ||
| C.1.1.6 VERIFY GROSS MASS at gate. | ||
| C.1.1.7 Manage and control dynamic terminal CAPACITY LIMITS. | ||
| D. Master Data | ||
| D1. Vehicle and Equipment Management | D.1.1. Vehicle and equipment Management | D.1.1.1 TIME CONTROL: Integrated measurement of time by activity and by operative. |
| D.1.1.2 INCIDENCE TRACEABILITY: Measure of efficiency by individual and task. | ||
| D.1.1.3 Customer KPIs/SLAs. | ||
| D.1.1.4 TIME allocated PER TASK (from customer). | ||
| D.1.1.5 EQUIPMENT AVAILABILITY. | ||
| D.1.1.6 Ability to support/use QR CODES. | ||
| D.1.1.7 RESOURCE REQUESTS: Equipment and resource requests handled by the system. | ||
| D2. Human Resources | D.2.1. Human Resources | D.2.1.1 EFFICIENCY REPORTS: Record man hours (labor per shift) for labor efficiency reporting. |
| D.2.1.2 CAPACITY ISSUES: Analyze forecasted work orders/maintenance requirements from range of customers, match these to workshop/workforce capacity (±), and flag up capacity issues. | ||
| D.2.1.3 Match available hours with work order components allowing for RAMPING UP AND DOWN. | ||
| D.2.1.4 WORKER COMPETENCIES: Match operative competencies/experience with work order requirements. | ||
| D.2.1.5 Accommodate customer KPI/SLA REQUIREMENTS. | ||
| D.2.1.6 Incorporate known ARRIVAL AND DISPATCH SCHEDULES. | ||
| D.2.1.7 Incorporate EMPLOYMENT LEGISLATION. | ||
| D3. Inventory and Warehouse Management (Not Cargoes) | D.3.1. Inventory Management | D.3.1.1. Provide the ability to track and MANAGE INVENTORY. |
| D.3.1.2 INVENTORY DISCREPANCIES: Perform a physical inventory count and reconcile inventory discrepancies. | ||
| D.3.1.3. Detail every INVENTORY item BY DESCRIPTION and reference number. | ||
| D.3.1.4. Visibility of every INVENTORY item BY ARRIVAL/DISPATCH or fitting dates. | ||
| D.3.2. Automation | D.3.2.1 Direct REAL TIME ORDERING and order visibility. | |
| D.3.2.2. REAL TIME PARTS availability updates. | ||
| D.3.2.3 Pre-advised PICKING LIST to match work orders. | ||
| D.3.2.4 OPTIMIZED STOCKHOLDING. | ||
| D4. Document Management | D.4.1. Document Management | D.4.1.1 FILE REPOSITORY: Upload/attach files, for example: pictures and documents, and associate with a booking number, bill of lading, or cargo item. |
| D.4.1.2 DATE/TIME STAMP all documents and reports produced by the system. | ||
| D.4.1.3 Generate and PRINT signed and time stamped DOCUMENTS. | ||
| D5. Customer Relationship Management | D.5.1. Customer Relationship Management | D.5.1.1 CREATE and manage QUOTES. |
D.5.1.2 QUOTE performance REPORTING capability:
| ||
| D.5.1.3 RECORD TRACEABILITY: Provide the ability to submit customer records (new and changes) to the system. | ||
| D6. Invoicing and Purchasing | D.6.1. Invoicing | D.6.1.1 SPECIFIC TARIFFS: System automatically assesses storage charges for export and import cargo according to applicable tariff item parameters and rates as well as customer-specific parameters. |
| D.6.1.2 BL MANAGEMENT: Add a customer to a BoL who is not the notified party or consignee. | ||
| D.6.1.3 EVALUATE ORDERS: Submit import/export cargo billing to the system when cargo loading/discharge has been confirmed. | ||
| D.6.1.4 Associate a CUSTOMER with the BOOKING, including labor time/tracking. | ||
| D.6.1.5 Handle SPECIAL BILLINGS. | ||
| D.6.1.6 Capture customer-specific BILLING REQUIREMENTS in the TOS, for example: associated BoL on all invoices. | ||
| D.6.2. Cost Analysis | D.6.2.1. COST REPORTS: Accumulate all costs associated with a billable transaction. | |
| D.6.2.2. BILLING INTEGRATION: Interface with the customer’s existing financial systems to transfer costs for final invoicing and billing. | ||
| E. ERP Dashboard | ||
| E1. Data Analytics and reporting | E.1.1. Data Reporting | E.1.1.1 STANDARD REPORTS: Standard reports out of the box for all core system functions and activities. |
| E.1.1.2 Ability to develop CUSTOM REPORTS. | ||
| E.1.1.3 Ability to REPORT on all data fields WITHIN the SYSTEM. | ||
| E.1.1.4. Allow reporting by THIRD PARTY REPORTING applications. | ||
| E.1.1.5. AUTOMATE the DISSEMINATION of reports via email. | ||
| E.1.1.6. HISTORICAL REPORTING. | ||
| E.1.1.7 FILE EXPORT: Download reports to other formats, for example: Excel, PDF, etc. | ||
| E.1.2. Data Queries | E.1.2.1 Ability to perform DATA QUERIES. | |
| E2. Performance Analysis | E.2.1. Performance Analysis | E.2.1.1. ACTIVITIES LOG: Log all activities performed in the system, that is, who performed the activity and when. If data were changed by the activity, report the previous and current values. |
| E.2.1.2 Record and track TERMINAL OPERATING EXPENSES. | ||
| E.2.1.3 Select and show REAL TIME KPI STATUS. | ||
| E.2.1.4 Configure and customize PERFORMANCE DASHBOARDS. | ||
| E.2.1.5 COMPARE WITH OBJECTIVES. | ||
| F. Communications | ||
| F1. Communications and Messaging | F.1.1. Communications and Messaging | F.1.1.1 PCS INTEGRATION: Integration facility for bi-directional automated data transfers between the TOS and other port systems that maintains business rules and application logic. |
| F.1.1.2 PUBLISHED API’s to allow the port to develop application integrations that maintain business rules and application logic. | ||
| F.1.1.3 EDI COMMUNICATIONS: Automate the population of third-party data into or out of the system (including EDI, XML, XLS, etc.). | ||
| F.1.1.4 ELECTRONIC AUTHORIZATIONS: Provide the ability to electronically receive authorizations or approvals from brokers, freight forwarders, truckers, etc. | ||
| F2. Partner and Client Notification | F.2.1. Partner and Client Notification | F.2.1.1 VISIBILITY AND ETA for customers and partners. |
| F.2.1.2 Electronic PROOF OF DELIVERY. | ||
| F.2.1.3 Customer/dealer/carrier ALERT FLAG. | ||
| F.2.1.4 CUSTOMS CLEARANCE. | ||
| F.2.1.5 CHANGE THIRD PARTY DATA populated in the system. | ||
| F3. Track and Trace | F.3.1. Track and Trace | F.3.1.1 Full VEHICLE movement TRACEABILITY by vehicle identification and location. |
| F.3.1.2 TRACK/LOCATE CARGO as it is moved throughout the terminal/yard. | ||
| F.3.1.3 DAMAGE REPORTS: Track and report damaged/inoperable cargo associated with a vessel voyage and booking number (exports) or BoL (imports). | ||
References
- Eurostat Maritime Transport of Goods—Quarterly Data. Available online: http://ec.europa.eu/eurostat/statistics-explained/index.php/Maritime_transport_of_goods_-_quarterly_data (accessed on 1 July 2018).
- Prokopowicz, A.K.; Berg-Andreassen, J. An Evaluation of Current Trends in Container Shipping Industry, Very Large Container Ships (VLCSs), and Port Capacities to Accommodate TTIP Increased Trade. Transp. Res. Procedia 2016, 14, 2910–2919. [Google Scholar] [CrossRef] [Green Version]
- Oskin, B. Ship Traffic Increases Dramatically, to Oceans’ Detriment. Available online: https://www.livescience.com/48788-ocean-shipping-big-increase-satellites.html (accessed on 2 April 2018).
- Selfin, Y.; Hope, D. Future of world trade: Top 25 sea and air freight routes in 2030. Economic Views: Future of the World Trade; PricewaterhouseCoopers: London, UK, 2011. [Google Scholar]
- OOCL. OOCL Reaches Milestone with the Christening of the OOCL Hong Kong. Available online: http://www.oocl.com/eng/pressandmedia/pressreleases/2017/Pages/12may17.aspx (accessed on 2 June 2018).
- Gilding, P. The Great Disruption: How the Climate Crisis will Transform the Global Economy; Bloomsbury: New York, NY, USA, 2011; p. 304. [Google Scholar]
- Giddings, B.; Hopwood, B.; O’Brien, G. Environment, economy and society: Fitting them together into sustainable development. Sustain. Dev. 2002, 10, 187–196. [Google Scholar] [CrossRef]
- Van der vorst, R.; Grafé-Buckens, A.; Sheate, W.R. A systemic framework for environmental decision-making. J. Environ. Assess. Policy Manag. 2003, 01, 1–26. [Google Scholar] [CrossRef]
- Woxenius, J.; Roso, V.; Lumsden, K. The dry port concept–connecting seaports with their hinterland by rail. In Proceedings of the ICLSP, Dalian, China, 22–26 September 2004; pp. 22–26. [Google Scholar]
- Roso, V. Evaluation of the dry port concept from an environmental perspective: A note. Transp. Res. Part D Transp. Environ. 2007, 12, 523–527. [Google Scholar] [CrossRef]
- Awad-Nuñez, S.; González-Cancelas, N.; Soler-Flores, F.; Camarero-Orive, A. How should the sustainability of the location of dry ports be measured? A proposed methodology using Bayesian networks and multi-criteria decision analysis. Transport 2015, 30, 312–319. [Google Scholar] [CrossRef]
- Witte, P.; Wiegmans, B.; Ng, A.K.Y. A critical review on the evolution and development of inland port research. J. Transp. Geogr. 2019, 74, 53–61. [Google Scholar] [CrossRef]
- Roso, V.; Woxenius, J.; Lumsden, K. The dry port concept: Connecting container seaports with the hinterland. J. Transp. Geogr. 2009, 17, 338–345. [Google Scholar] [CrossRef]
- Hanaoka, S.; Regmi, M.B. Promoting intermodal freight transport through the development of dry ports in Asia: An environmental perspective. IATSS Res. 2011, 35, 16–23. [Google Scholar] [CrossRef] [Green Version]
- Tsao, Y.-C.; Linh, V.T. Seaport-dry port network design considering multimodal transport and carbon emissions. J. Clean. Prod. 2018, 199, 481–492. [Google Scholar] [CrossRef]
- Bask, A.; Roso, V.; Andersson, D.; Hämäläinen, E. Development of seaport-dry port dyads: Two cases from Northern Europe. J. Transp. Geogr. 2014, 39, 85–95. [Google Scholar] [CrossRef]
- Wiegmans, B.; Witte, P.; Spit, T. Inland port performance: A statistical analysis of Dutch inland ports. Transp. Res. Procedia 2015, 8, 145–154. [Google Scholar] [CrossRef]
- Crainic, T.G.; Dell’Olmo, P.; Ricciardi, N.; Sgalambro, A. Modeling dry-port-based freight distribution planning. Transp. Res. Part C Emerg. Technol. 2015, 55, 518–534. [Google Scholar] [CrossRef]
- Heilig, L.; Voß, S. Information systems in seaports: A categorization and overview. Inf. Technol. Manag. 2017, 18, 179–201. [Google Scholar] [CrossRef]
- Carlan, V.; Sys, C.; Vanelslander, T.; Roumboutsos, A. Digital innovation in the port sector: Barriers and facilitators. Compet. Regul. Netw. Ind. 2017, 18, 71–93. [Google Scholar] [CrossRef]
- Zhang, C.; Liu, J.; Wan, Y.; Murty, K.G.; Linn, R.J. Storage space allocation in container terminals. Transp. Res. Part B Methodol. 2003, 37, 883–903. [Google Scholar] [CrossRef]
- Kim, K.H.; Lee, H. Container Terminal Operation: Current Trends and Future Challenges. In Handbook of Ocean Container Transport Logistics, 1st ed.; Lee, C.-Y., Meng, Q., Eds.; Springer International Publishing: Zurich, Switzerland, 2015; Volume 220, pp. 43–73. ISBN 978-3-319-11890-1. [Google Scholar]
- Clott, C.; Hartman, B.C. Supply chain integration, landside operations and port accessibility in metropolitan Chicago. J. Transp. Geogr. 2016, 51, 130–139. [Google Scholar] [CrossRef]
- Santarremigia, F.E.; Molero, G.D.; Poveda-Reyes, S.; Aguilar-Herrando, J. Railway safety by designing the layout of inland terminals with dangerous goods connected with the rail transport system. Saf. Sci. 2018, 110, 206–216. [Google Scholar] [CrossRef]
- Böse, J.W. Handbook of terminal planning. Oper. Res. Comput. Sci. Interfaces Ser. 2011, 49, 25–40. [Google Scholar] [CrossRef]
- Shen, Y.; Yao, J.; Zhang, H. Design and implementation of the container terminal operating system based on service-oriented architecture (SOA). In Proceedings of the 2008 International Conference on Cyberworlds, Hangzhou, China, 22–24 September 2008; pp. 794–799. [Google Scholar] [CrossRef]
- Buhl, R.; Schwientek, A. Terminal Operating Systems 2016: An International Market Review of Current Software Applications for Terminal Operators; Jahn, C., Ed.; Fraunhofer Center for Maritime Logistics and Services: Stuttgart, Germany, 2016; ISBN 978-3-8396-1034-3. [Google Scholar]
- Min, H.; Ahn, S.B.; Lee, H.S.; Park, H. An integrated terminal operating system for enhancing the efficiency of seaport terminal operators. Marit. Econ. Logist. 2017, 19, 428–450. [Google Scholar] [CrossRef]
- Jamal, A.; Sarno, R.; Ginardi, H. Analyzing the benefit of implementing integrated dgps and terminal operating system at yard terminal Surabaya. J. Theor. Appl. Inf. Technol. 2017, 95, 948–959. [Google Scholar]
- Kia, M.; Shayan, E.; Ghotb, F. The importance of information technology in port terminal operations. Int. J. Phys. Distrib. Logist. Manag. 2000, 30, 331–344. [Google Scholar] [CrossRef]
- Willis, R. A Guide to Selecting, Implementing and Maximising a Tos. Available online: https://www.porttechnology.org/technical_papers/new_paper_an_early_christmas_gift_for_terminal_operators (accessed on 7 January 2019).
- Michele, A.; Patrizia, S. Strategic determinants of terminal operating system choice: An empirical approach using multinomial analysis. Transp. Res. Procedia 2014, 3, 592–601. [Google Scholar] [CrossRef]
- Velasquez, M.; Hester, P.T. An analysis of multi-criteria decision making methods. Int. J. Oper. Res. 2013, 10, 56–66. [Google Scholar]
- Saaty, T.L. The Analytic Hierarchy Process, Planning, Priority Setting, Resource Allocation; McGraw-Hill: New York, NY, USA, 1980. [Google Scholar]
- Tramarico, C.L.; Salomon, V.A.P.; Marins, F.A.S. Analytic hierarchy Process and supply chain management: A bibliometric study. Procedia Comput. Sci. 2015, 55, 441–450. [Google Scholar] [CrossRef]
- Molero, G.D.; Santarremigia, F.E.; Aragonés-Beltrán, P.; Pastor-Ferrando, J.-P. Total safety by design: Increased safety and operability of supply chain of inland terminals for containers with dangerous goods. Saf. Sci. 2017, 100, 168–182. [Google Scholar] [CrossRef]
- Wallenius, J.; Dyer, J.S.; Fishburn, P.C.; Steuer, R.E.; Zionts, S.; Deb, K. Multiple criteria decision making, multiattribute utility theory: Recent accomplishments and what lies ahead. Manag. Sci. 2008, 54, 1336–1349. [Google Scholar] [CrossRef]
- Lai, P.; Potter, A.; Beynon, M.; Beresford, A. Evaluating the efficiency performance of airports using an integrated AHP/DEA-AR technique. Transp. Policy 2015, 42, 75–85. [Google Scholar] [CrossRef] [Green Version]
- Bouzon, M.; Govindan, K.; Rodriguez, C.M.T.; Campos, L.M.S. Identification and analysis of reverse logistics barriers using fuzzy Delphi method and AHP. Resour. Conserv. Recycl. 2016, 108, 182–197. [Google Scholar] [CrossRef]
- Palacio, A.; Adenso-Díaz, B.; Lozano, S. A decision-making model to design a sustainable container depot logistic network: The case of the Port of Valencia. Transport 2015, 33, 1–12. [Google Scholar] [CrossRef]
- Ghorbanzadeh, O.; Moslem, S.; Blaschke, T.; Duleba, S. Sustainable urban transport planning considering different stakeholder groups by an interval-AHP decision support model. Sustainability 2019, 11, 9. [Google Scholar] [CrossRef]
- Ghorbanzadeh, O.; Feizizadeh, B.; Blaschke, T. An interval matrix method used to optimize the decision matrix in AHP technique for land subsidence susceptibility mapping. Environ. Earth Sci. 2018, 77, 1–19. [Google Scholar] [CrossRef]
- Nazari, S.; Fallah, M.; Kazemipoor, H.; Salehipour, A. A fuzzy inference—Fuzzy analytic hierarchy process-based clinical decision support system for diagnosis of heart diseases. Expert Syst. Appl. 2018, 95, 261–271. [Google Scholar] [CrossRef]
- Blanquero, R.; Carrizosa, E.; Conde, E. Inferring efficient weights from pairwise comparison matrices. Math. Methods Oper. Res. 2006, 64, 271–284. [Google Scholar] [CrossRef]
- Duleba, S.; Moslem, S. Examining Pareto optimality in analytic hierarchy process on real Data: An application in public transport service development. Expert Syst. Appl. 2019, 116, 21–30. [Google Scholar] [CrossRef]
- Ka, B. Application of Fuzzy AHP and ELECTRE to China Dry Port Location Selection. Asian J. Shipp. Logist. 2011, 27, 331–353. [Google Scholar] [CrossRef] [Green Version]
- Li, J.; Jiang, B. Cooperation Performance Evaluation between Seaport and Dry Port; Case of Qingdao Port and Xi’an Port. Int. J. E Navig. Marit. Econ. 2014, 1, 99–109. [Google Scholar] [CrossRef]
- Ha, M.H.; Yang, Z.; Heo, M.W. A New Hybrid decision making framework for prioritising port performance improvement strategies. Asian J. Shipp. Logist. 2017, 33, 105–116. [Google Scholar] [CrossRef]
- Stahlbock, R.; Voß, S. Operations research at container terminals: A literature update. OR Spectr. 2008, 30, 1–52. [Google Scholar] [CrossRef]
- Steenken, D.; Voβ, S.; Stahlbock, R. Container terminal operation and operations research—A classification and literature review. OR Spectr. 2004, 26, 3–49. [Google Scholar] [CrossRef]
- Li, C.-L.; Cai, X.; Lee, C.-Y. Scheduling with multiple-job-on-one-processor pattern. IIE Trans. 1998, 30, 433–445. [Google Scholar] [CrossRef]
- Kim, K.Y.; Kim, K.H. A routing algorithm for a single transfer crane to load export containers onto a containership. Comput. Ind. Eng. 1997, 33, 673–676. [Google Scholar] [CrossRef]
- Kim, K.H.; Kim, H.B. The optimal determination of the space requirement and the number of transfer cranes for import containers. Comput. Ind. Eng. 1998, 35, 427–430. [Google Scholar] [CrossRef]
- Bruno, G.; Ghiani, G.; Improta, G. Dynamic positioning of idle automated guided vehicles. J. Intell. Manuf. 2000, 11, 209–215. [Google Scholar] [CrossRef]
- Renken, K.; Zander, K. Terminal operation software: A saturated market? In Proceedings of the 7th Transport Research Arena TRA 2018, Vienna, Austria, 16–19 April 2018; pp. 1–8. [Google Scholar]
- Saaty, T.L. The analytic hierarchy process: What it is and how it is used. Math. Model. 1987, 9, 161–176. [Google Scholar] [CrossRef]
- Pedroso, G.; Bermann, C.; Sanches-Pereira, A. Combining the functional unit concept and the analytic hierarchy process method for performance assessment of public transport options. Case Stud. Transp. Policy 2018, 6, 722–736. [Google Scholar] [CrossRef]
- Achimugu, P.; Selamat, A.; Ibrahim, R.; Mahrin, M.N. A systematic literature review of software requirements prioritization research. Inf. Softw. Technol. 2014, 56, 568–585. [Google Scholar] [CrossRef]
- Mulliner, E.; Malys, N.; Maliene, V. Comparative analysis of MCDM methods for the assessment of sustainable housing affordability. Omega 2016, 59, 146–156. [Google Scholar] [CrossRef] [Green Version]
- The Clarkson Centre for Business Ethics. Principles of Stakeholder Management. The Clarkson Principles; University of Toronto: Toronto, ON, Canada, 1999; ISBN 0-7727-8609-7. [Google Scholar]
- Carrizo, D.; Dieste, O.; Juristo, N. Systematizing requirements elicitation technique selection. Inf. Softw. Technol. 2014, 56, 644–669. [Google Scholar] [CrossRef] [Green Version]
- Saaty, T.L.; Ozdemir, M.S. Why the magic number seven plus or minus two. Math. Comput. Model. 2003, 38, 233–244. [Google Scholar] [CrossRef]
- Sagir Özdemir, M. Seven. Int. J. Anal. Hierarchy Process 2017, 9. [Google Scholar] [CrossRef]
- Lee, B.K.; Kim, K.H. Optimizing the yard layout in container terminals. OR Spectr. 2013, 35, 363–398. [Google Scholar] [CrossRef]
- Golbabaie, F.; Seyedalizadeh Ganji, S.R.; Arabshahi, N. Multi-criteria evaluation of stacking yard configuration. J. King Saud Univ. Sci. 2012, 24, 39–46. [Google Scholar] [CrossRef] [Green Version]
- Guo, X.; Huang, S.Y. Dynamic Space and Time Partitioning for Yard Crane Workload Management in Container Terminals. Transp. Sci. 2012, 46, 134–148. [Google Scholar] [CrossRef]
- Kim, K.H.; Kim, H.B. The optimal sizing of the storage space and handling facilities for import containers. Transp. Res. Part B Methodol. 2002, 36, 821–835. [Google Scholar] [CrossRef]
- Said, G.A.E.-N.A.; El-Horbaty, E.-S.M. Simulation Modeling Approach for Optimization of Storage Space Allocation in Container Terminal. Int. J. Comput. Inf. Syst. Control Eng. 2015, 9, 168–173. [Google Scholar]
- Olesen, P.B.; Dukovska-Popovska, I.; Hvolby, H. Improving Port Terminal Operations through Information Sharing. In Proceedings of the 19th IFIP Conference on Advances in Production Management Systems (APMS), Advances in Information and Communication Technology, AICT-398 (Part. II), 24–26 September Rhodes, Greece, 2012; Springer: Berlin/Heidelberg, Germany, 2013; pp. 662–669. [Google Scholar] [CrossRef]


| Level of Importance of Functionality i Compared with j | Description |
|---|---|
| 1 | Functionalities i and j have the same importance. |
| 3 | i is moderately more important than j. |
| 5 | i is strongly favored over j. |
| 7 | i is very strongly favored over j. |
| 9 | Extreme importance. i is fully preferred when compared with j. |
| 2, 4, 6, 8 | Judgments can be refined using intermediate values. |
| Reciprocals (1/3, 1/7, etc.) | If j is the preferred option over i, then the same scale from 1 to 9 is used but in the form of a fraction (from 1/3 to 1/9). For example, if functionality i is strongly favored over j it will be given a 5, and when j is preferred to i, it will have the reciprocal value (1/5). |
| CR = 0.059 | A.1.1.1 Customizable Layout | A.1.1.2 Historic Location | A.1.1.3 Space Optimized | A.1.1.4 Location Optimized | |
|---|---|---|---|---|---|
| A.1.1.1 Customizable Layout | 1 | 1.24 | 0.76 | 0.87 | 0.230 |
| A.1.1.2 Historic Location | 1 | 0.50 | 0.46 | 0.159 | |
| A.1.1.3 Space Optimized | 1 | 1.1 | 0.314 | ||
| A.1.1.4 Location Optimized | 1 | 0.297 |
| 1 | 2 | 3 | 4 | 5 | 6 | 7 | 8 | 9 | 10 | |
|---|---|---|---|---|---|---|---|---|---|---|
| RI | 0 | 0 | 0.58 | 0.90 | 1.12 | 1.24 | 1.32 | 1.41 | 1.45 | 1.49 |
| Functionality | Cumulative Weight | Functionality | Cumulative Weight | ||
|---|---|---|---|---|---|
| B.1.1.1 | 0.04562 | 0.04562 | A.3.1.5. | 0.00543 | 0.84982 |
| A.1.1.3 | 0.03567 | 0.08129 | D.2.1.1. | 0.00513 | 0.85495 |
| B.2.1.2. | 0.03401 | 0.11530 | F.2.1.2. | 0.00511 | 0.86006 |
| A.1.1.4. | 0.03372 | 0.14902 | A.3.2.1. | 0.00500 | 0.86506 |
| B.2.2.3. | 0.02871 | 0.17773 | A.3.2.3. | 0.00470 | 0.86976 |
| C.1.1.5. | 0.02728 | 0.20501 | D.4.1.3. | 0.00463 | 0.87439 |
| A.1.1.1. | 0.02614 | 0.23115 | D.1.1.5. | 0.00456 | 0.87895 |
| C.1.1.1. | 0.02480 | 0.25595 | A.3.1.2. | 0.00451 | 0.88346 |
| B.1.1.2. | 0.02479 | 0.28074 | D.3.1.2. | 0.00451 | 0.88797 |
| C.1.1.2. | 0.02476 | 0.30550 | D.2.1.2. | 0.00434 | 0.89231 |
| B.2.1.1. | 0.02468 | 0.33018 | A.3.2.4. | 0.00419 | 0.8965 |
| C.1.1.7. | 0.02179 | 0.35197 | F.1.1.4. | 0.00415 | 0.90065 |
| B.2.1.3. | 0.02162 | 0.37359 | D.2.1.6. | 0.00412 | 0.90477 |
| B.2.1.4. | 0.02158 | 0.39517 | D.3.1.4. | 0.00411 | 0.90888 |
| B.2.1.5. | 0.02149 | 0.41666 | F.2.1.1. | 0.00398 | 0.91286 |
| B.1.1.5. | 0.02087 | 0.43753 | D.1.1.7. | 0.00394 | 0.91680 |
| B.2.2.1. | 0.01939 | 0.45692 | D.1.1.1. | 0.00352 | 0.92032 |
| B.1.1.7. | 0.01886 | 0.47578 | A.3.2.2. | 0.00345 | 0.92377 |
| A.1.1.2. | 0.01804 | 0.49382 | F.2.1.4. | 0.00342 | 0.92719 |
| C.1.1.6. | 0.01748 | 0.51130 | F.1.1.2. | 0.00338 | 0.93057 |
| B.1.1.4. | 0.01690 | 0.52820 | D.6.1.1. | 0.00325 | 0.93382 |
| B.1.1.3. | 0.01585 | 0.54405 | D.4.1.2. | 0.00307 | 0.93689 |
| A.2.1.1. | 0.01569 | 0.55974 | D.1.1.4. | 0.00302 | 0.93991 |
| A.2.1.2. | 0.01496 | 0.57470 | D.2.1.4. | 0.00299 | 0.94290 |
| F.3.1.2. | 0.01341 | 0.58811 | D.2.1.5. | 0.00285 | 0.94575 |
| C.1.1.3. | 0.01315 | 0.60126 | D.3.2.4. | 0.00274 | 0.94849 |
| A.1.2.2. | 0.01280 | 0.61406 | D.3.1.3. | 0.00273 | 0.95122 |
| A.3.2.6. | 0.01246 | 0.62652 | D.3.2.1. | 0.00270 | 0.95392 |
| D.5.1.1. | 0.01193 | 0.63845 | D.1.1.2. | 0.00266 | 0.95658 |
| C.1.1.4. | 0.01092 | 0.64937 | D.1.1.3. | 0.00260 | 0.95918 |
| F.1.1.3. | 0.01051 | 0.65988 | A.1.2.1. | 0.00251 | 0.96169 |
| D.3.1.1. | 0.01026 | 0.67014 | D.6.1.2. | 0.00244 | 0.96413 |
| A.2.1.3. | 0.01008 | 0.68022 | D.6.1.3. | 0.00236 | 0.96649 |
| B.2.2.2. | 0.00982 | 0.69004 | D.3.2.2. | 0.00235 | 0.96884 |
| E.2.1.2. | 0.00942 | 0.69946 | E.1.1.2. | 0.0023 | 0.97114 |
| B.1.1.6. | 0.00939 | 0.70885 | D.2.1.3. | 0.00228 | 0.97342 |
| A.3.2.7. | 0.00894 | 0.71779 | D.6.1.4. | 0.00222 | 0.97564 |
| E.2.1.1. | 0.00893 | 0.72672 | D.3.2.3. | 0.00212 | 0.97776 |
| A.3.1.4. | 0.00845 | 0.73517 | F.2.1.3. | 0.00206 | 0.97982 |
| A.1.2.4. | 0.00836 | 0.74353 | A.3.2.5. | 0.00203 | 0.98185 |
| A.3.1.1. | 0.00826 | 0.75179 | D.2.1.7. | 0.00184 | 0.98369 |
| D.6.2.1. | 0.00818 | 0.75997 | D.6.2.2. | 0.00184 | 0.98553 |
| D.5.1.3. | 0.00814 | 0.76811 | E.1.1.4. | 0.00179 | 0.98732 |
| F.1.1.1. | 0.00804 | 0.78424 | E.1.1.1. | 0.00174 | 0.98906 |
| D.5.1.2. | 0.00794 | 0.79218 | E.1.1.5. | 0.00165 | 0.99071 |
| F.3.1.1. | 0.00791 | 0.80009 | E.1.1.3. | 0.00156 | 0.99227 |
| A.3.1.3. | 0.00761 | 0.80770 | D.6.1.6. | 0.00155 | 0.99382 |
| A.1.2.3. | 0.00711 | 0.81481 | E.1.1.7. | 0.00140 | 0.99522 |
| E.2.1.3. | 0.00669 | 0.82150 | E.1.1.6. | 0.00121 | 0.99643 |
| E.2.1.4. | 0.00587 | 0.82737 | D.6.1.5. | 0.00120 | 0.99763 |
| F.3.1.3. | 0.00569 | 0.83306 | D.1.1.6. | 0.00118 | 0.99881 |
| D.4.1.1. | 0.00568 | 0.83874 | F.2.1.5. | 0.00118 | 0.99999 |
| E.2.1.5. | 0.00565 | 0.84439 |
| Nº | Initial | A + 20% | A − 20% | B + 20% | B − 20% | C + 20% | C − 20% | D + 20% | D − 20% | E + 20% | E − 20% | F + 20% | F − 20% |
|---|---|---|---|---|---|---|---|---|---|---|---|---|---|
| 1 | B.1.1.1 | A.1.1.3 | B.1.1.1 | B.1.1.1 | A.1.1.3 | B.1.1.1 | B.1.1.1 | B.1.1.1 | B.1.1.1 | B.1.1.1 | B.1.1.1 | B.1.1.1 | B.1.1.1 |
| 2 | A.1.1.3 | B.1.1.1 | B.2.1.2 | B.2.1.2 | A.1.1.4 | A.1.1.3 | A.1.1.3 | A.1.1.3 | A.1.1.3 | A.1.1.3 | A.1.1.3 | A.1.1.3 | A.1.1.3 |
| 3 | B.2.1.2 | A.1.1.4 | B.2.2.3 | B.2.2.3 | B.1.1.1 | B.2.1.2 | B.2.1.2 | B.2.1.2 | B.2.1.2 | B.2.1.2 | B.2.1.2 | B.2.1.2 | B.2.1.2 |
| 4 | A.1.1.4 | B.2.1.2 | A.1.1.3 | A.1.1.3 | C.1.1.5 | C.1.1.5 | A.1.1.4 | A.1.1.4 | A.1.1.4 | A.1.1.4 | A.1.1.4 | A.1.1.4 | A.1.1.4 |
| 5 | B.2.2.3 | A.1.1.1 | C.1.1.5 | A.1.1.4 | A.1.1.1 | A.1.1.4 | B.2.2.3 | B.2.2.3 | B.2.2.3 | B.2.2.3 | B.2.2.3 | B.2.2.3 | B.2.2.3 |
| 6 | C.1.1.5 | B.2.2.3 | A.1.1.4 | B.1.1.2 | B.2.1.2 | C.1.1.1 | A.1.1.1 | C.1.1.5 | C.1.1.5 | C.1.1.5 | C.1.1.5 | C.1.1.5 | C.1.1.5 |
| 7 | A.1.1.1 | C.1.1.5 | C.1.1.1 | B.2.1.1 | C.1.1.1 | C.1.1.2 | B.1.1.2 | A.1.1.1 | A.1.1.1 | A.1.1.1 | A.1.1.1 | A.1.1.1 | A.1.1.1 |
| 8 | C.1.1.1 | C.1.1.1 | B.1.1.2 | B.2.1.3 | C.1.1.2 | B.2.2.3 | B.2.1.1 | C.1.1.1 | C.1.1.1 | C.1.1.1 | C.1.1.1 | C.1.1.1 | C.1.1.1 |
| 9 | B.1.1.2 | C.1.1.2 | C.1.1.2 | B.2.1.4 | C.1.1.7 | C.1.1.7 | B.2.1.3 | B.1.1.2 | B.1.1.2 | B.1.1.2 | B.1.1.2 | B.1.1.2 | B.1.1.2 |
| 10 | C.1.1.2 | B.1.1.2 | B.2.1.1 | B.2.1.5 | B.2.2.3 | A.1.1.1 | B.2.1.4 | C.1.1.2 | C.1.1.2 | C.1.1.2 | C.1.1.2 | C.1.1.2 | C.1.1.2 |
| 11 | B.2.1.1 | B.2.1.1 | C.1.1.7 | B.1.1.5 | B.1.1.2 | B.1.1.2 | B.2.1.5 | B.2.1.1 | B.2.1.1 | B.2.1.1 | B.2.1.1 | B.2.1.1 | B.2.1.1 |
| 12 | C.1.1.7 | A.1.1.2 | B.2.1.3 | C.1.1.5 | B.2.1.1 | B.2.1.1 | C.1.1.5 | C.1.1.7 | C.1.1.7 | C.1.1.7 | C.1.1.7 | C.1.1.7 | C.1.1.7 |
| 13 | B.2.1.3 | C.1.1.7 | B.2.1.4 | A.1.1.1 | A.1.1.2 | C.1.1.6 | B.1.1.5 | B.2.1.3 | B.2.1.3 | B.2.1.3 | B.2.1.3 | B.2.1.3 | B.2.1.3 |
| 14 | B.2.1.4 | B.2.1.3 | B.2.1.5 | B.2.2.1 | C.1.1.6 | B.2.1.3 | B.2.2.1 | B.2.1.4 | B.2.1.4 | B.2.1.4 | B.2.1.4 | B.2.1.4 | B.2.1.4 |
| 15 | B.2.1.5 | B.2.1.4 | A.1.1.1 | B.1.1.7 | B.2.1.3 | B.2.1.4 | C.1.1.1 | B.2.1.5 | B.2.1.5 | B.2.1.5 | B.2.1.5 | B.2.1.5 | B.2.1.5 |
| Number of functionalities in the initial top 15 | 14 | 15 | 12 | 13 | 14 | 13 | 15 | 15 | 15 | 15 | 15 | 15 |
| Functionalities Making Up 80% | |
|---|---|
| Initial | 47 |
| A + 20% | 47 |
| A − 20% | 48 |
| B + 20% | 45 |
| B − 20% | 50 |
| C + 20% | 47 |
| C − 20% | 48 |
| D + 20% | 50 |
| D − 20% | 45 |
| E + 20% | 48 |
| E − 20% | 47 |
| F + 20% | 48 |
| F − 20% | 47 |
© 2019 by the authors. Licensee MDPI, Basel, Switzerland. This article is an open access article distributed under the terms and conditions of the Creative Commons Attribution (CC BY) license (http://creativecommons.org/licenses/by/4.0/).
Share and Cite
Hervás-Peralta, M.; Poveda-Reyes, S.; Molero, G.D.; Santarremigia, F.E.; Pastor-Ferrando, J.-P. Improving the Performance of Dry and Maritime Ports by Increasing Knowledge about the Most Relevant Functionalities of the Terminal Operating System (TOS). Sustainability 2019, 11, 1648. https://doi.org/10.3390/su11061648
Hervás-Peralta M, Poveda-Reyes S, Molero GD, Santarremigia FE, Pastor-Ferrando J-P. Improving the Performance of Dry and Maritime Ports by Increasing Knowledge about the Most Relevant Functionalities of the Terminal Operating System (TOS). Sustainability. 2019; 11(6):1648. https://doi.org/10.3390/su11061648
Chicago/Turabian StyleHervás-Peralta, Miguel, Sara Poveda-Reyes, Gemma Dolores Molero, Francisco Enrique Santarremigia, and Juan-Pascual Pastor-Ferrando. 2019. "Improving the Performance of Dry and Maritime Ports by Increasing Knowledge about the Most Relevant Functionalities of the Terminal Operating System (TOS)" Sustainability 11, no. 6: 1648. https://doi.org/10.3390/su11061648