Article

Nature-based Tourism or Mass Tourism in Nature? Segmentation of Mountain Protected Area Visitors Using Self-Organizing Maps (SOM)

by
Karolina Taczanowska
1,
Luis-Millán González
2,
Xavier García-Massó
3,
Antoni Zięba
4,
Christiane Brandenburg
1,
Andreas Muhar
1,
Maite Pellicer-Chenoll
2 and
José-Luis Toca-Herrera
5,*
1
Institute of Landscape Development, Recreation and Conservation Planning, University of Natural Resources and Life Sciences (BOKU), 1190 Vienna, Austria
2
Department of Physical Education and Sport, University of Valencia, 46010 Valencia, Spain
3
Departament de Didàctica de l’Expressió Musical, Plàstica i Corporal, University of Valencia, 46021 Valencia, Spain
4
Tatra National Park, 34-500 Zakopane, Poland
5
Institute for Biophysics, University of Natural Resources and Life Sciences (BOKU), 1180 Vienna, Austria
*
Author to whom correspondence should be addressed.
Sustainability 2019, 11(5), 1314; https://doi.org/10.3390/su11051314
Submission received: 18 January 2019 / Revised: 24 February 2019 / Accepted: 25 February 2019 / Published: 2 March 2019
(This article belongs to the Section Environmental Sustainability and Applications)

Abstract

:
Mountain protected areas play a fundamental role in the conservation of natural environment and at the same time provide the population with social benefits such as offering space for leisure and recreation. Understanding motivations and behavior of protected area visitors is crucial to effectively manage vulnerable areas. Our objective was to identify the profiles of visitors to a heavily used tourist destination—Kasprowy Wierch within the Tatra National Park (Poland), using the self-organizing maps (SOM) analytical method. In order to explore the socio-demographic and behavioral characteristics of the visitors a total sample of 2488 respondents were interviewed on site. Self-organizing map analysis is based on cerebral processes for managing and storing information in order to classify subjects and/or find relationships among variables. As a result, four heterogeneous tourist profiles were identified. Interestingly, two of these groups (Cluster 1 and Cluster 3), which were found to be the most challenging groups for management purposes, visited the national park for reasons other than its natural attractions. Especially, one sub-segment of Cluster 3 was mainly motivated by the possibility to use a cable car, admiring views and stayed within close proximity of the upper cable car station. Less than a half of visitors to Kasprowy Wierch (42%) were seeking a nature experience during their trip (Cluster 2 and Cluster 4). The results bring a new point of view in the discussion on visitor management within Kasprowy Wierch region, in particular by overlapping presented visitor segmentation with trip types and/or purchased cable car tickets. Within international context, we highlight the SOM technique as a valuable tool in profiling of tourists and underline the problem of the existence of mass tourism destinations within protected areas.

1. Introduction

Development of tourism in vulnerable environments belongs to important issues in many tourism destinations worldwide [1]. Especially, popular protected areas (PAs) often face the problem of balancing nature conservation objectives and being a consumable touristic product itself at one time [2,3].
PAs play a fundamental role in the conservation of species and ecosystems and also provide the population with social benefits. Currently, PAs cover 15.4% of the total terrestrial and inland water areas in the world. Approximately one quarter (26.6%) of all PAs classified by the IUCN Management Categories have national park status [4]. The main management objectives of the national parks are to protect their ecosystems and provide opportunities for recreation. These areas are often characterized by outstanding landscapes that attract large numbers of visitors [5].
On one hand, tourism is regarded as a serious threat to nature, and on the other, nature-based tourism is desirable for the development of local communities and may also generate considerable income for the PA itself [5]. The opportunity to spend time in an outstanding natural setting is believed to increase the visitors’ environmental awareness and has a positive influence on society in implementing environmental protection programs. The balance between the needs of visitors and the requirements of protection are major challenges in popular tourist destinations, especially those located in PAs [6].
According to Buckley [7] and Newsome et al. [1] nature-based tourism refers to “all forms of tourism where natural environments form the primary attraction or setting”. This broad definition includes consumption and adventure as well as non-consuming contemplative activities [8]. Nature-based tourism in protected areas (PAs), especially in national parks, is usually associated with ecotourism [7,9] and conservation tourism [3]. However, in popular PAs the border between mass tourism and sustainable nature-based tourism is often unclear and the existing tourism strategies may need to be questioned.
Therefore, a comprehensive understanding of visitors’ behavior in natural environments and its determinants is fundamental for an effective management of environmentally valuable outdoor leisure sites [6,10]. Visitor segmentation aims to divide tourists into homogeneous groups characterized by similar motives, attitudes and behavior that can be used for developing dedicated tourist offers and targeted management strategies [11,12,13,14]. In the field of nature-based tourism and outdoor recreation there are well-established theoretical visitor typologies [15,16,17] as well as empirical classifications based on specified characteristics, such as visit motivations [14], expected benefits from nature [18]; crowding perception [19], spatial behavior [20]; environment-friendly behaviour [21,22] or other multiple characteristics related to visitor consumption profile [23,24]. Most empirical studies use traditional statistical approaches and group visitors according to a single variable (nominal, ordinal or scale classifications) or multiple variables using k-means clustering or hierarchical clustering. Some other advanced clustering tools are also used in the natural and social sciences, one of which is the so-called artificial neural network.
An artificial neural network (ANN) is a mathematical model that imitates the brain’s biological processes to manage and store information. In the present study a type of ANN known as the self-organizing map (SOM) has been used. Since Teuvo Kohonen [25] introduced this type of analysis in 1982, more than 10,000 studies have used this type of algorithm or subsequent amendments of it in different scientific areas [26]. Its name refers to an algorithm class of competitive neural networks in the category of non-supervised learning. The main aim of the SOM is to transform an incoming signal pattern of arbitrary dimension into a one- or two-dimensional discrete map, and to perform this transformation adaptively in a topologically ordered fashion [27]. This type of analysis is usually employed to classify or find relationships among a number of variables that describe a certain problem. SOM and similar unsupervised learning algorithms have been successfully used in the field of tourism since two decades [28,29,30,31,32,33], however there was no dedicated application related to mountain protected areas yet. SOM analysis can bring new insight into visitor profiling problematics and the management of the PAs.
The aim of this study was thus to explore visitor characteristics in a popular touristic destination (Kasprowy Wierch) located within the borders of the Tatra National Park in Poland. Kasprowy Wierch is primarily known for its outstanding nature and easy access by cable-car, which creates the problem of high visitor load throughout all seasons conflicting nature protection objectives. Therefore the self-organizing maps (SOM) method was used to define visitor profiles according to their social characteristics and behavior in a way that would support the management of a heavily used destination within the mountain protected area.

2. Materials and Methods

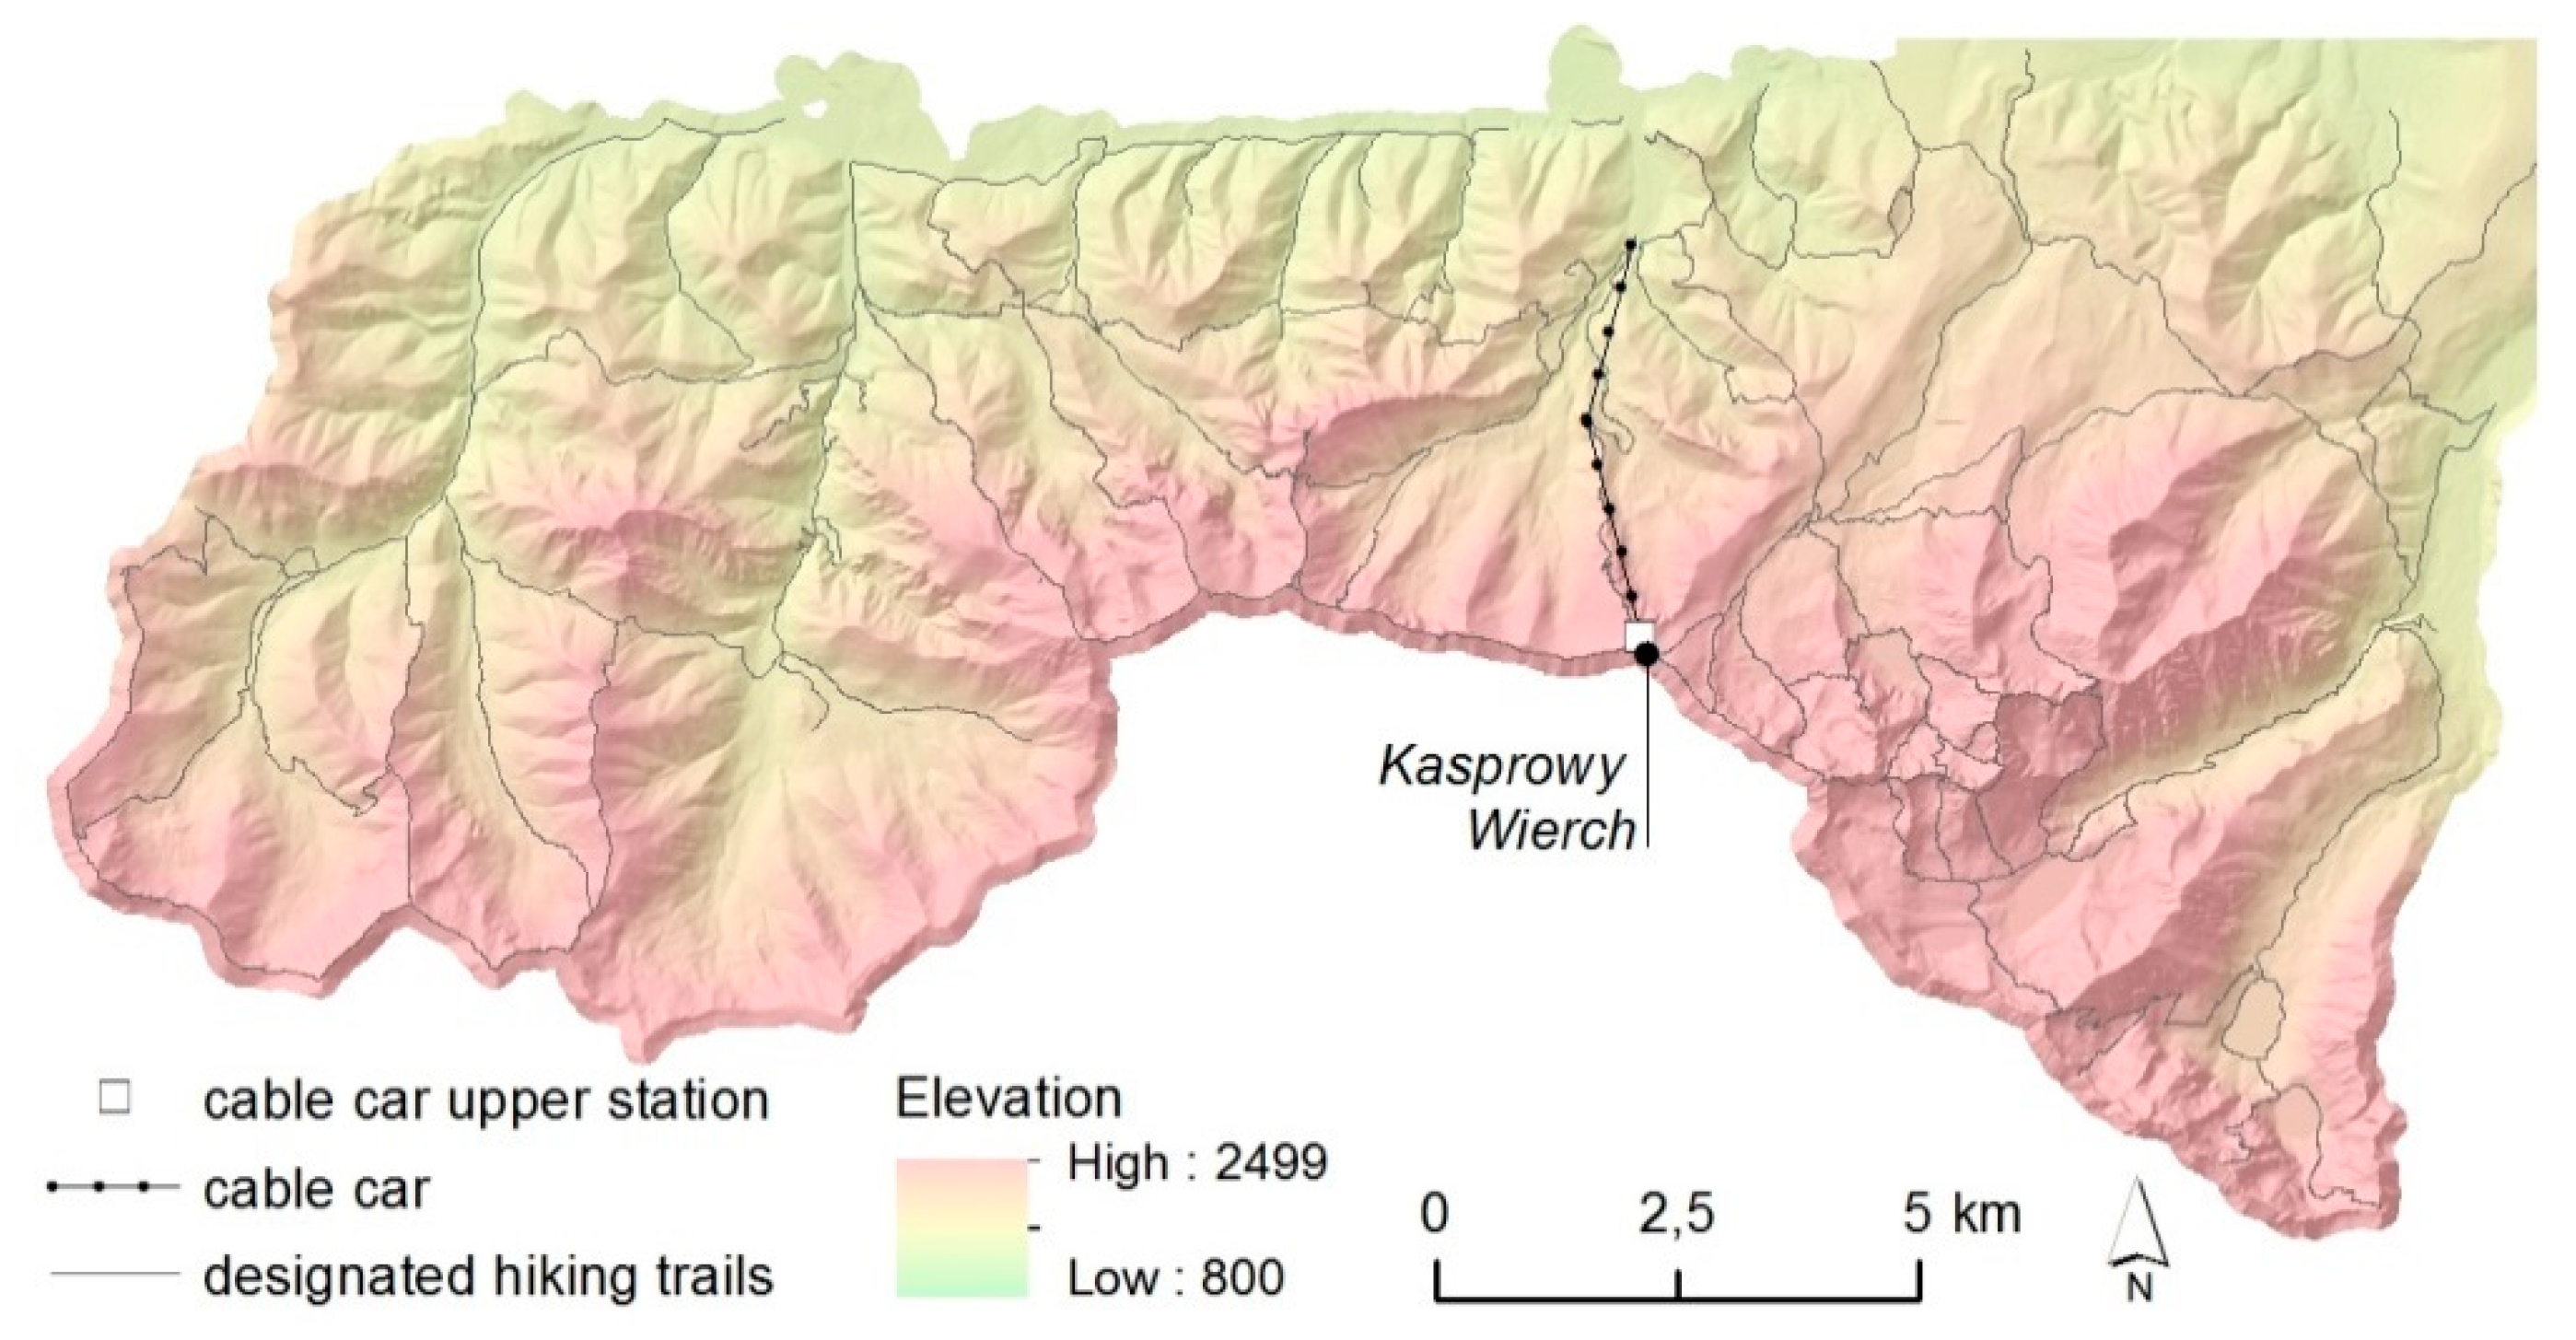
2.1. Case Study Area

The Tatra Mountains are situated in Central Eastern Europe and form the highest range in the Carpathian Mountains (Figure 1). The area is protected by two independently managed national parks: the Tatrzanski Park Narodowy (TPN) in Poland and Tatransko Narodny Park (TANAP) in Slovakia. Since November 1992 the whole mountain range has the status of a Biosphere Reserve (UNESCO-Man and the Biosphere Program). The Tatra Mountains are characterized by different natural areas, with a diversity of geological structures and reliefs. Elevation ranges from 900 to 2655 m above sea level. The case study area—Kasprowy Wierch—is on the main ridge of the Tatra Mountains on the border between Poland and Slovakia. Kasprowy Wierch is the third most visited destination in the Polish Tatra National Park (TPN).
The cable car connecting the valley (900 m AMSL) and the Kasprowy Wierch peak (1987 m AMSL) along with a dense network of recreational trails, attracts large numbers of visitors—skiers in winter and hikers in the summer season. Most of the tourist traffic concentrates here between July and September (daily average = approximately 3200 visitors). In summer 2014, the maximum daily tourist traffic exceeded 7500 visitors [34]. The cable car operator is now considering doubling its capacity in the summer season, although the national park authorities are against this idea, so that it will be difficult to achieve a compromise between the cable car operator, the visitors and the NP authorities.

2.2. Data Collection

A quantitative approach was used to explore the socio-demographic and behavioral profile of the national park visitors. In the summer season 2014 (July-September) on-site interviews with randomly selected visitors were carried out on 17 sampling days in the Kasprowy Wierch area. Four groups of visitors were distinguished in this study: (1) cable car users (ticket “UP&DOWN”); (2) cable car users (ticket “UP”); (3) cable car users (ticket “DOWN”) and (4) hikers that did not use the cable car at all. In this study the PAPI (Pen and Paper Interview) technique was combined with the documentation of trip itineraries (GPS-tracking or trip diary). The form of the standardized questionnaire used in the study is included in the supplementary material (S1). A total sample of 2488 interviews was obtained. Table 1 gives an overview of the trips registered in the Kasprowy Wierch area and the number of interviews grouped by visitor type. A total of 368 questionnaires was discarded as being partly incomplete.

2.3. Data Analysis

The data was analyzed on the MATLAB SOM Toolbox (Version 2.0 beta) [35]. This tool allows different types of training for generating SOMs through a number of already implemented functions, and at the same time it offers various result displays (e.g., u-matrix, component planes). It can also perform a cluster analysis by different methods.
The SOM was performed using MATLAB R2008a (Mathworks Inc., Natick, MA, USA), following the steps and using the parameters described below.
The process begins with the construction of a lattice of a suitable size for the 20 input variables characterizing visitors and their behavior (list of variables can be found in the results section in Figures 3 and 4). The lattice generally has a number of nodes (neurons) determined by the equation 5 × sqrt (n), where n represents sample size (i.e., 2120 visitors). In our study the final lattice used had a size of 19 × 12 neurons. A hexagonal shape was chosen for the representation.
Once the proper grid has been established, weights are assigned to each neuron randomly and the weight vectors are initialized with small random values. These weights will change throughout the training process according to the values of the different data vectors of the analyzed sample. Before beginning to train the neural network, it is necessary to normalize the data [0...1]. Values were normalized (between 0 and 1) using a feature scaling, according this formula: z i = ( x i min ( x ) ) / ( max ( x ) min ( x ) ) . Here, xi is the original value and zi is the normalized value.
In the training phase, each of the neurons that make up the grid competes against the others for each of the n cases in the sample. The data vector assignation (i.e. in our study, the value vector of each subject in the sample) is performed by comparing the values of the input with the weights of each of the neurons in the lattice. The winning neuron will be the one with the smallest Euclidean distance between the input values and the neuron weight, so that there can only be one winning neuron. There are different ways of initializing the data matrix, although the random method is the most frequently used.
This competitive process leads to an adaptive process by which, once assigned the input data vector of a neuron, the weights of the winning neuron and those of the neighbor neurons are changed and topologically sorted (i.e. ordering and convergence phases). The neurons nearest to the winning neuron undergo a major transformation in their values, while the farthest neurons change to a lesser extent. These changes are made with the neighbor function in a Gaussian way. It must be highlighted that at the beginning of the process the changes in the neuron values are greater than at the end of the process, when learning has already taken place. The whole process is usually performed about 100 times using different initializations, which generates a large number of maps.
In the present work we generated 1600 maps, due to the combination of the 2 initialization systems (random initialization; linear initialization) × 2 training ways (sequential; batch) × 4 neighborhood function (Gaussian; cut Gaussian; Epanechicov; bubble) × 100 initializations. There are different methods of choosing the highest quality map, and in this case we decided to select the map that had the lowest error when multiplying the combination of the quantization error by the topographic error [36]. In our analysis, the combination of random initialization, sequential training and cut Gaussian neighborhood function was the option with the lowest error. To perform a cluster classification we used a k-means algorithm. Figure 2 shows the map with the final cluster solution (4 clusters). These subgroups built from the general characteristics of the subjects were used to establish the interest areas for the component planes analysis.

3. Results

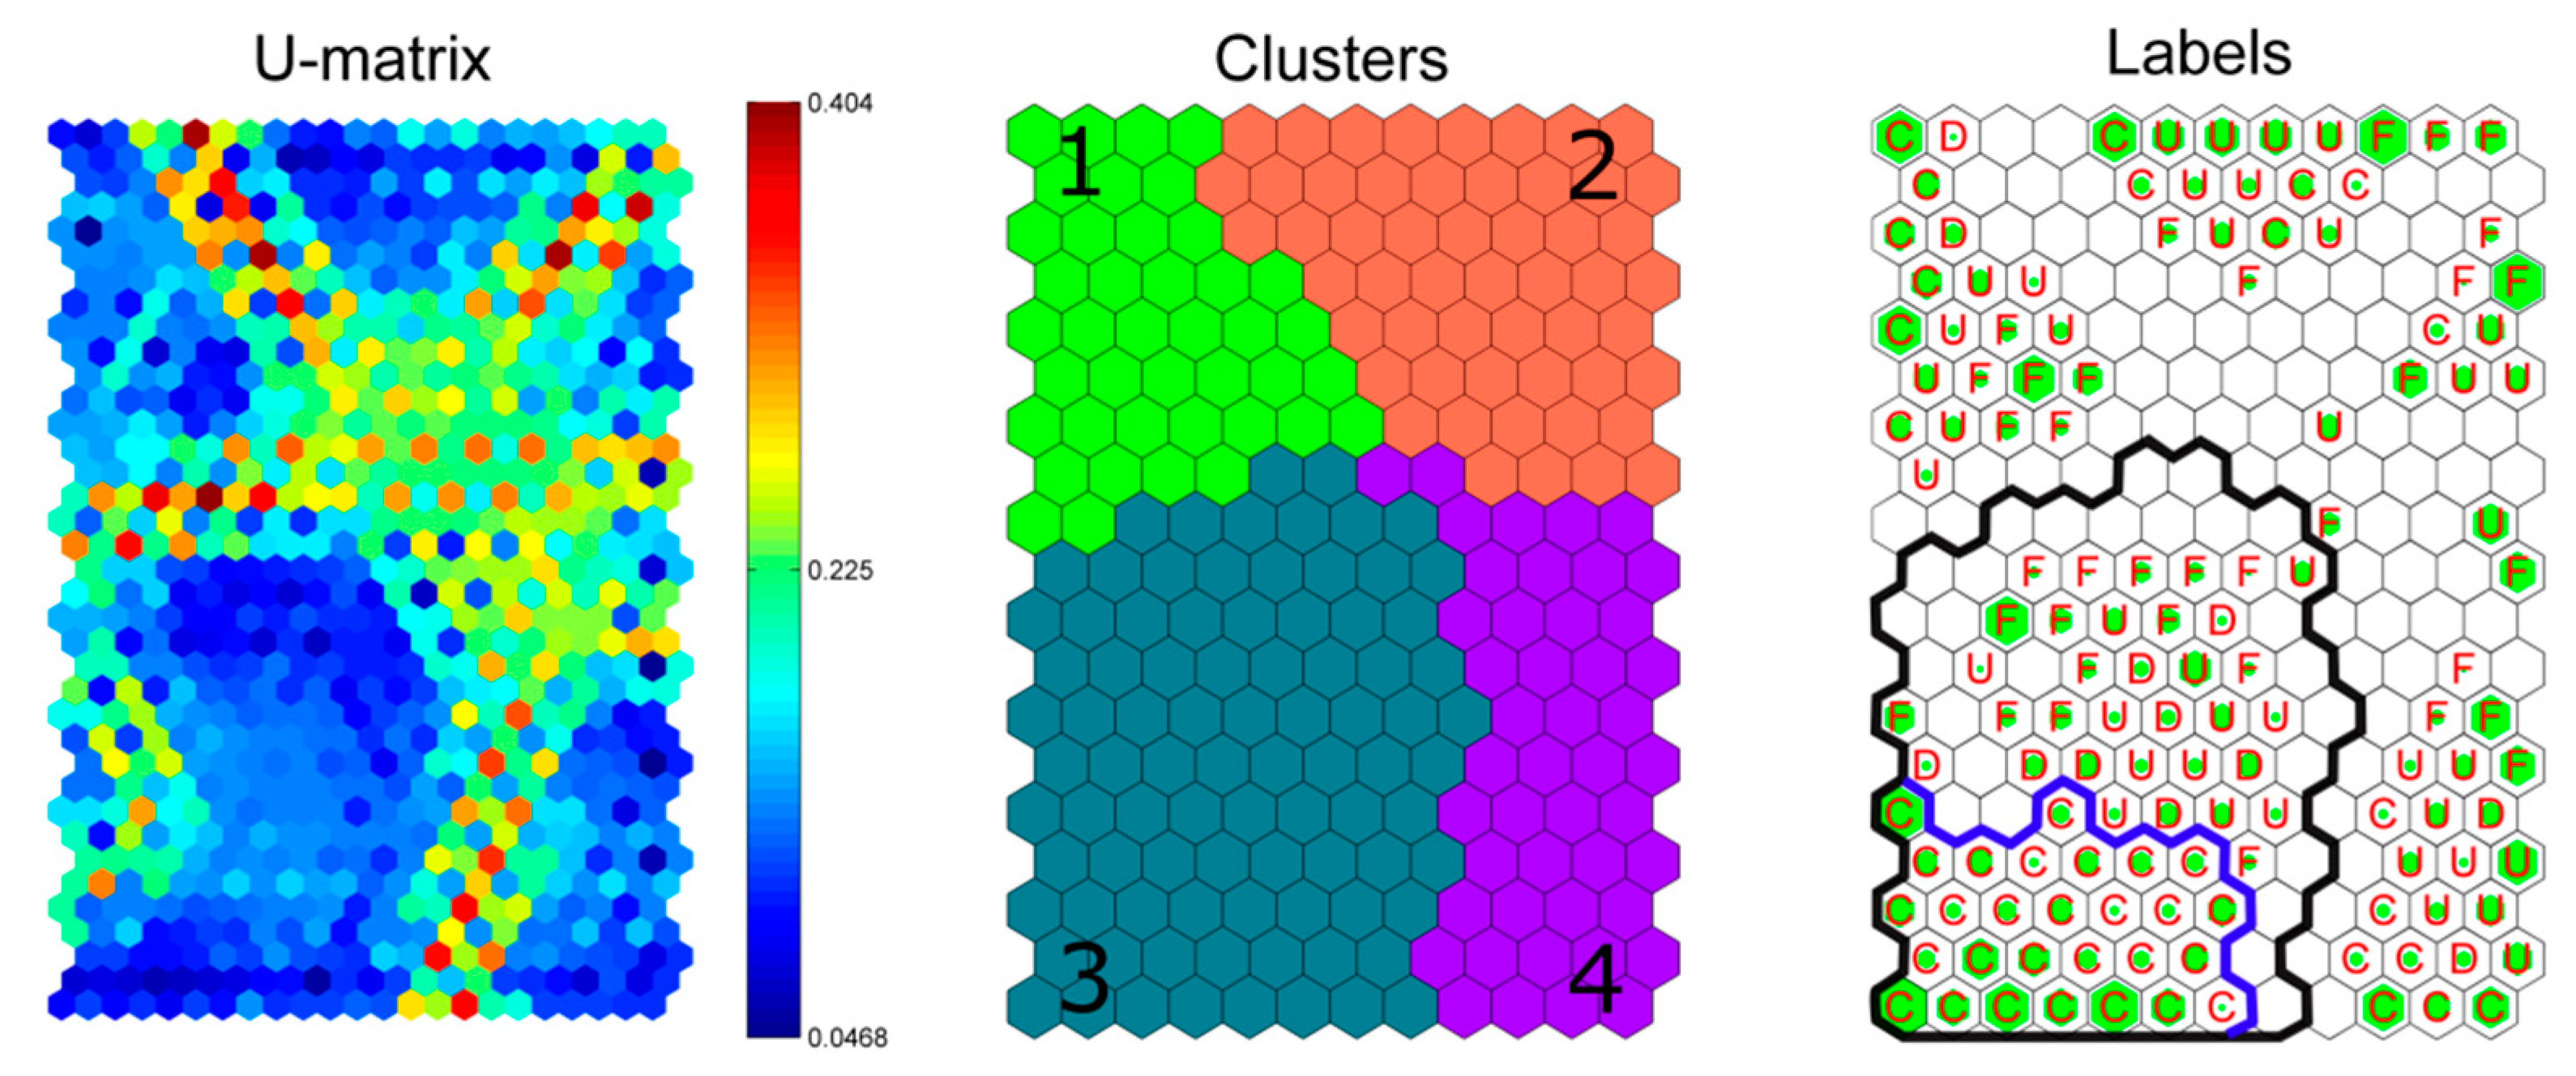
3.1. U-matrix, Clusters and Label Map

From the many maps generated we chose the one with the lowest error in the study. This type of analysis distributes the participants in the different neurons according to their similarity to each other. Obviously, there are small differences between the subjects in the same neuron with an error of 0.64. On the other hand, the fact of placing the adjacent neurons also introduces an error, because the neurons placed near each other could have similar values and different ones from those furthest away. This type of error, known as topographic error, was 0.006.
Figure 2 (left panel) shows one of the typical representations of the self-organizing maps, the U-matrix. This method of representation gives the distances separating the “inhabitants” of each neuron in relation to the adjacent ones because the representation is on a rectangle of fixed size for the sake of clarity. Distances are represented on a color scale. A central X-shaped area with the longest distances can be seen in the U-matrix. This means that the blue subjects in the adjacent neurons have similar characteristics to each other, while the ones separated by warm colors are less similar to each other. This type of representation gives a visual representation of four different areas. Although a clear division can be seen by visual inspection, we used a k-means algorithm to define the different clusters more clearly. Figure 2 (central panel) shows that the mathematical solution is very similar to the visual inspection of the U-matrix. Four clusters can be identified from left to right and from top to bottom, numbered from 1 to 4. The characteristics of each cluster are described in the following subsection.
In the right-hand panel in Figure 2, the label and hit maps are represented jointly. As already indicated, the subjects of the study were allocated through the different SOM neurons. The green neurons indicate the number of people “locked up” in each neuron. The densest areas of green neurons refer to more subjects (i.e., more populated areas), while the uncolored areas do not have any assigned subjects.
The label representing the variable indicating the trip type is directly superimposed on the neuron. The visitors were divided into four broad categories: (1) those using the cable car (C) to go up and down; (2) those using the cable car to go up to Kasprowy Wierch and then hiking back down to the valley; (3) visitors who hiked up and went down on the cable car (D) and (4) visitors who visited the area on foot without using the cable car (F). The label variable related to the trip type was used in the SOM analysis only for descriptive purposes and did not affect the clustering process. Once the maps were generated, the label variable was introduced and illustrated the most frequent trip type category in each neuron. This information helps to identify the tourist segments that tended to use the cable car and the type of trip they chose to do in the national park.
Table 2 gives the distribution of visitors among the clusters grouped by trip type. A large part of the visitors to the Kasprowy Wierch area belong to Cluster 3 (41%). Other tourist segments are less frequent (Cluster 1 = 16%; Cluster 2 = 23%; Cluster 4 = 19%).

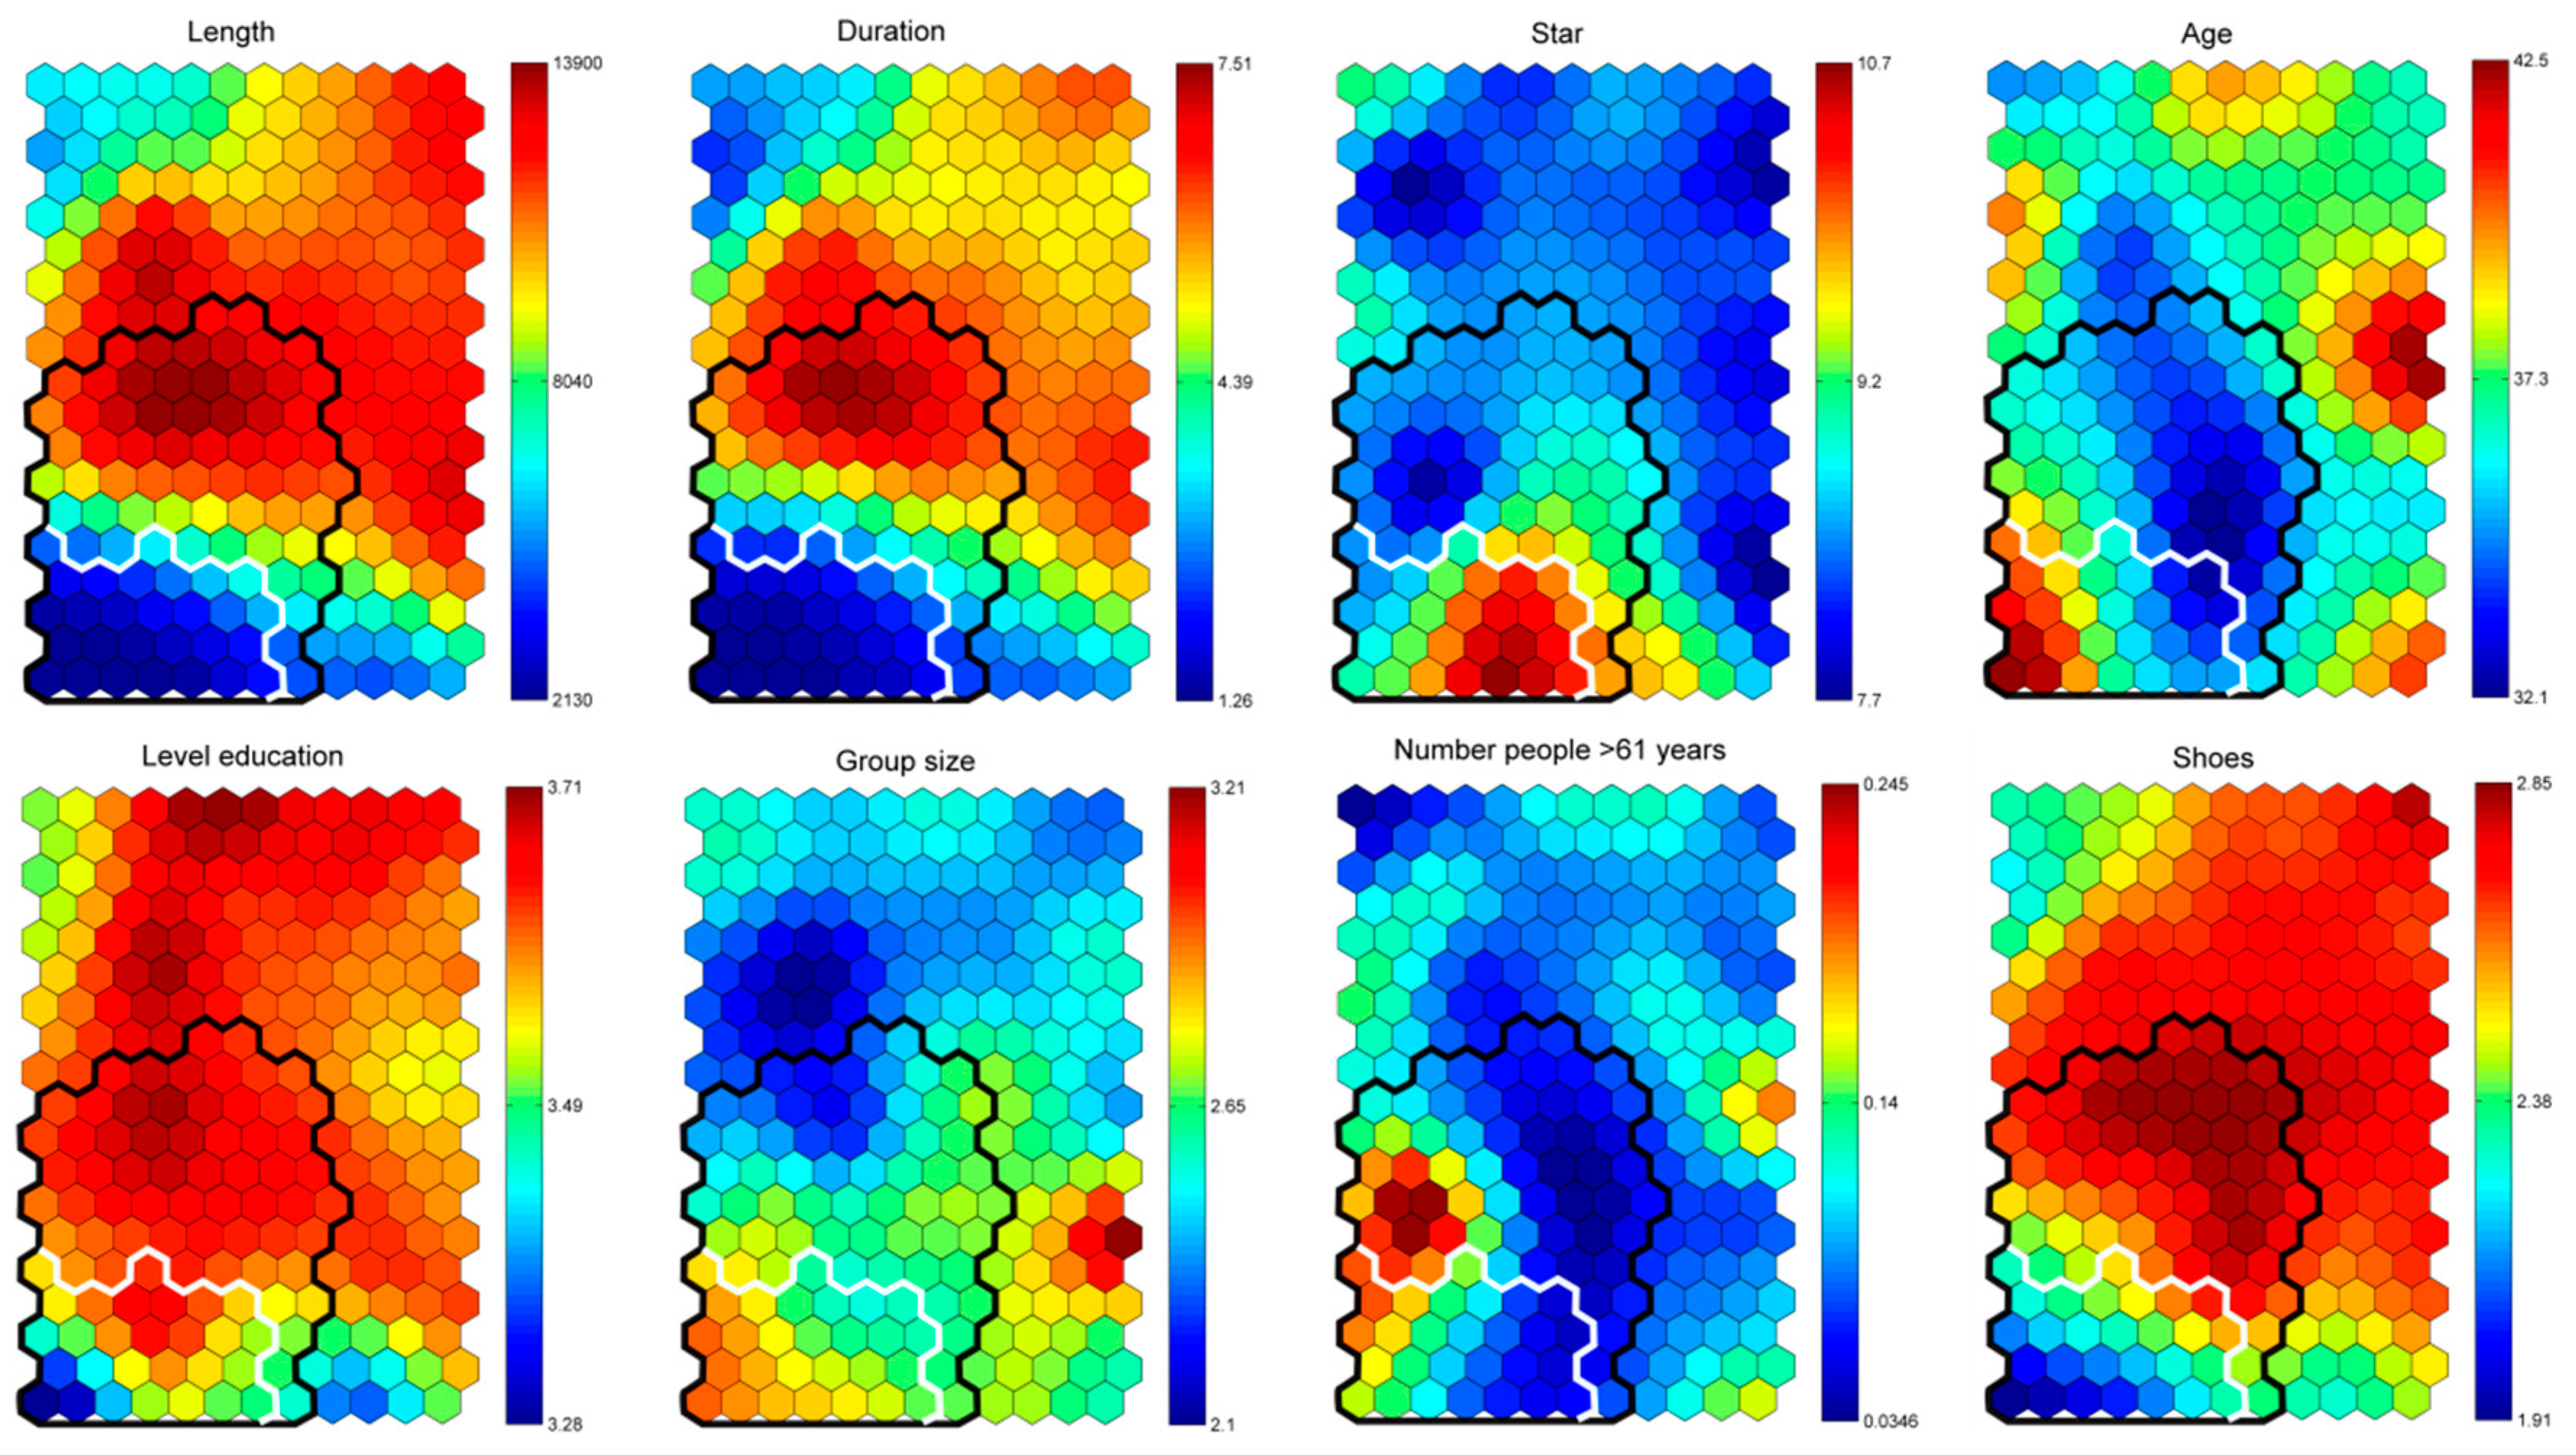
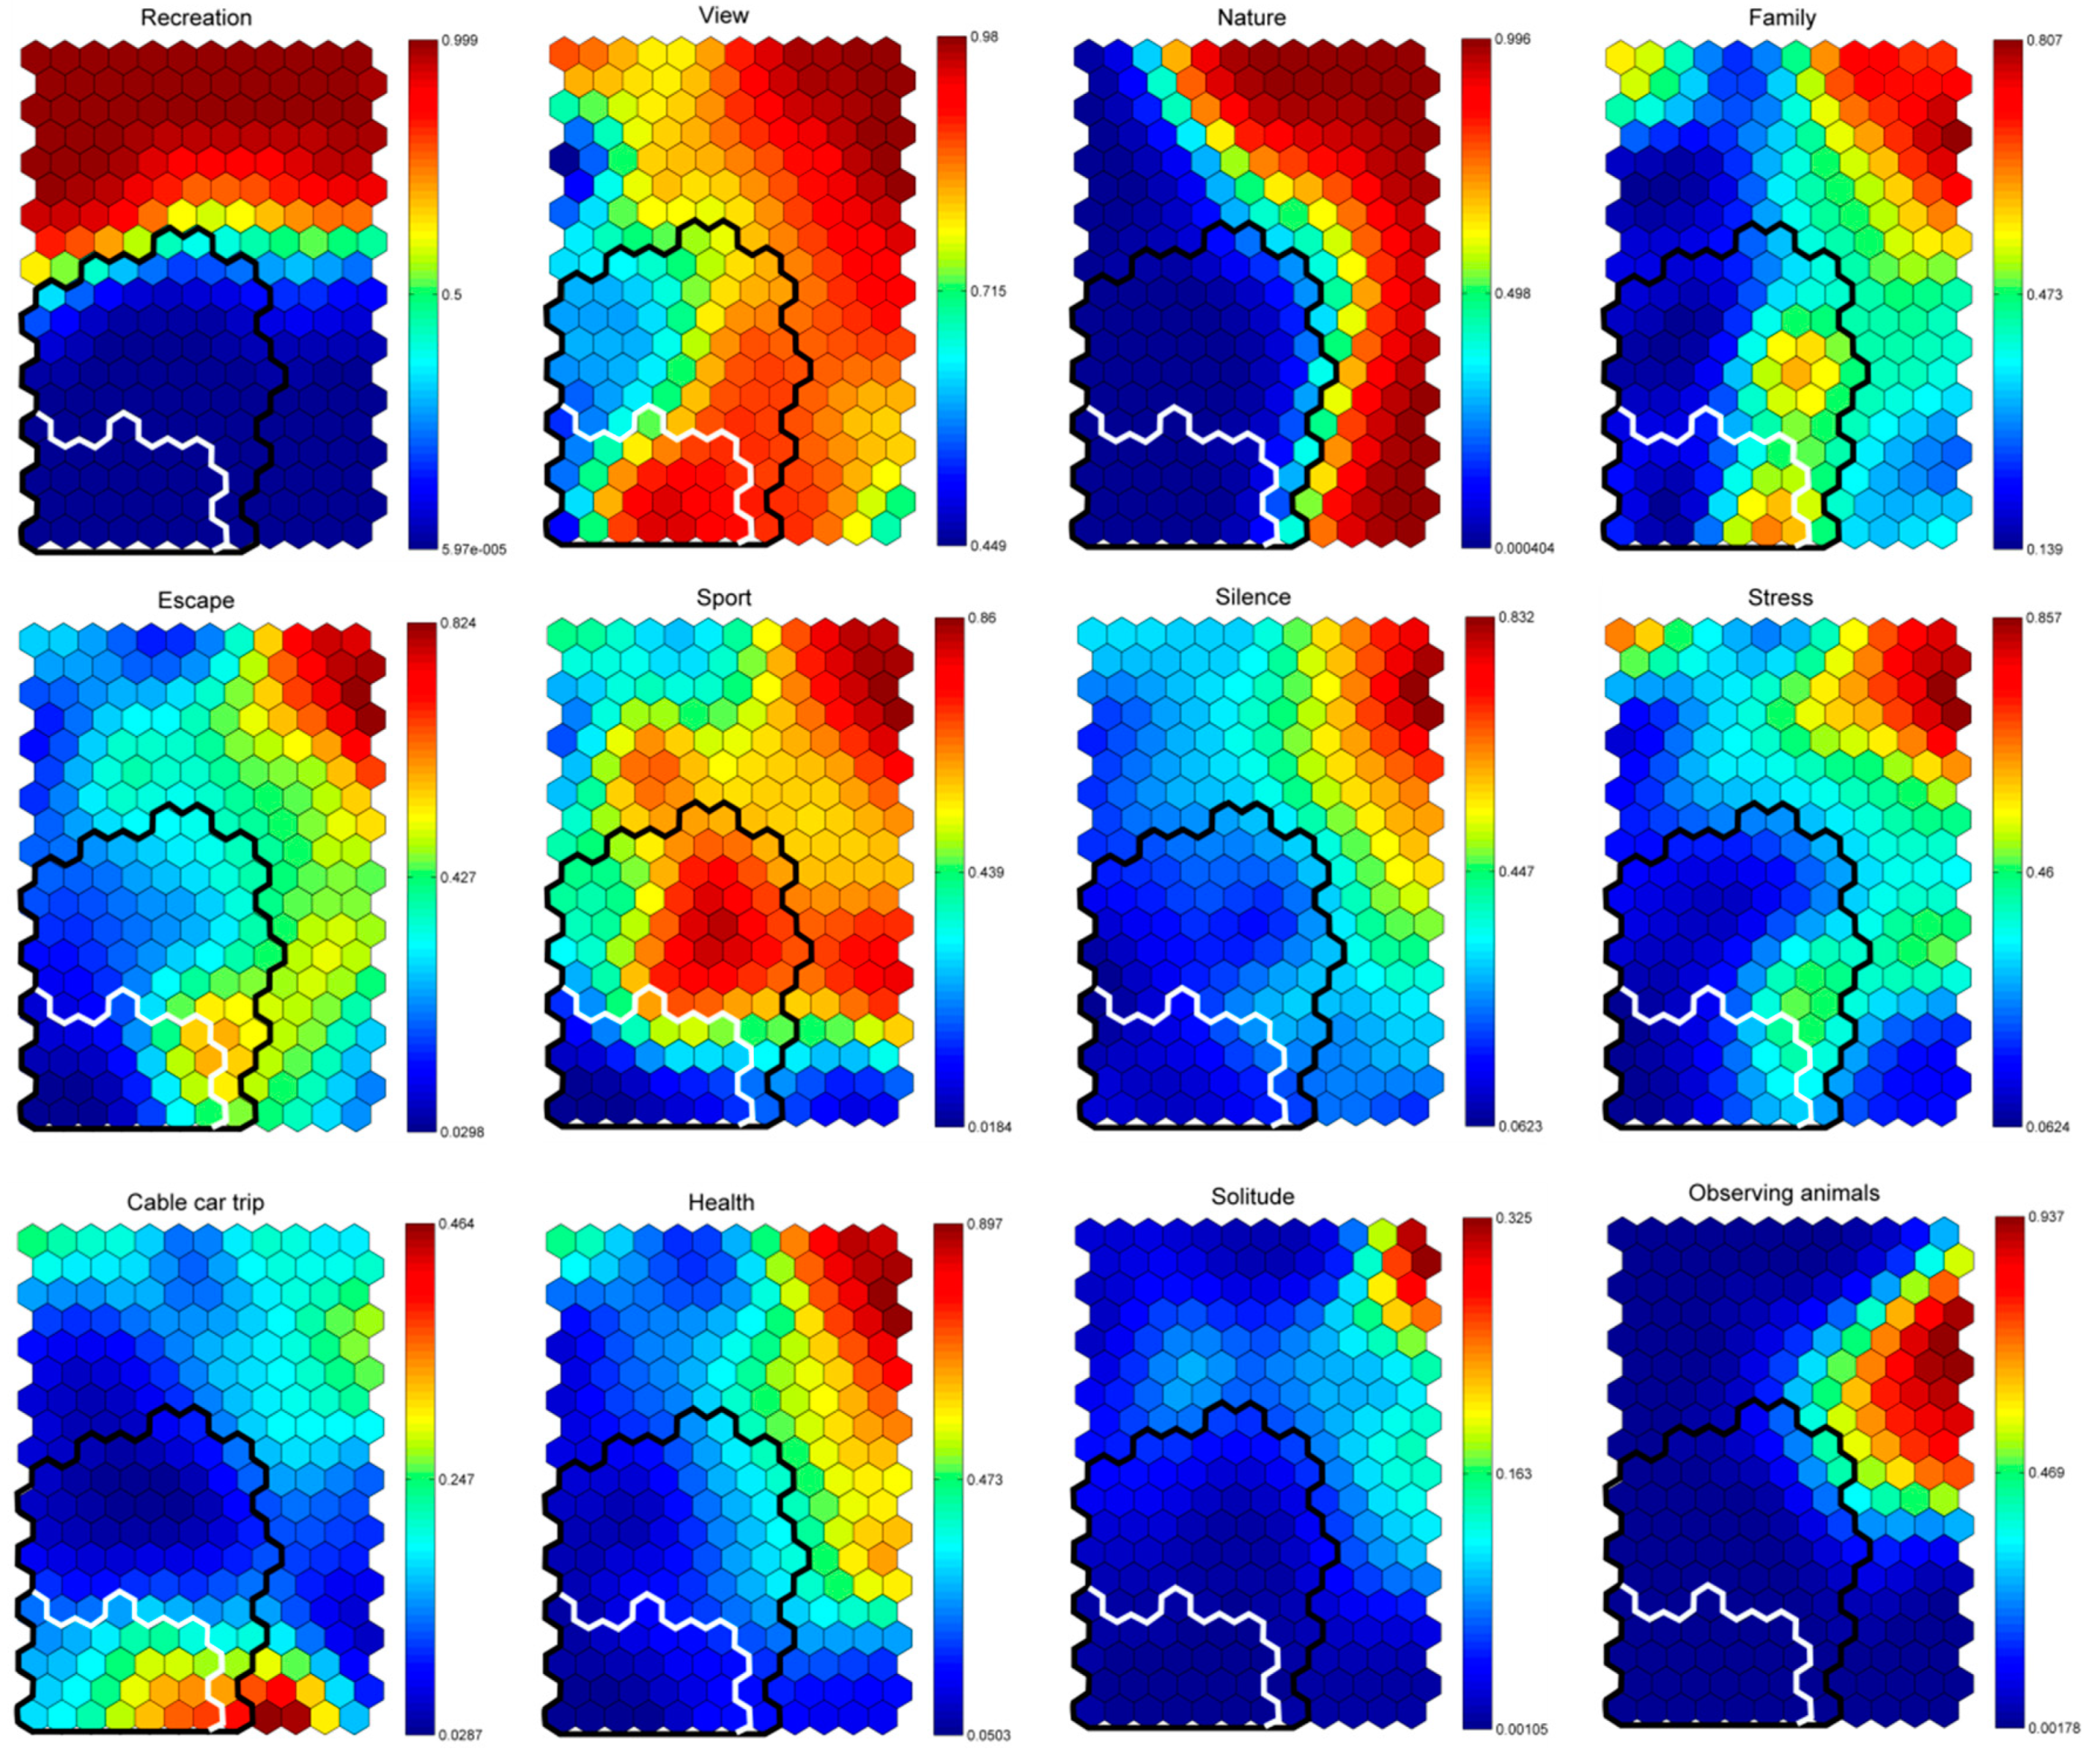
3.2. Cluster Characteristics Based on the Calculated Component Planes

One of the main advantages of SOM over other classification systems is that once the subjects have been assigned to a neuron, the values of this group of subjects in the variables that have been used for analysis can be shown in a display type called component planes. This means there will be as many component planes as variables in the analysis. This type of map shows the average value of the variable according to the subjects that are “locked” into a neuron by means of a color scale ranging from low (blue) to high values (red).
Before describing the behavior of each component plane, it should be remembered that the subjects inside a certain neuron do not change their positions in the different representations. If we follow a certain neuron through every component plane, we will see the value of the people inside the neuron for the different variables. Also, it is important to take into account that although some neurons are empty (no subjects inside) the SOM has assigned them a value. However, this value is not real, since it does not represent a subject, but is an approach value that takes into account the most likely value that this neuron would have if it contained a subject.
Figure 3 shows the component planes representing visitor and trip characteristics, such as route length [m], trip duration [h], departure time, age, education level, group size [number of people travelling together], number of older visitors in the group [>61 years] and type of footwear. Figure 4 gives the 12 main motivations for visiting Kasprowy Wierch.
The first visitor profile can be seen in the upper left corner of the maps (Cluster 1; 16.3% of the sample). The average age of this visitor group is 36, they walked around 10 km and spent approximately 5 hours in the national park and started out about 08:45. Their education level was intermediate-high and the groups were mostly composed of 2–3 people. There were no elderly people in the group and their footwear was suitable for mountain walking. They only gave two reasons for the visit: recreation and admiring the mountain views, and considered the remaining reasons as irrelevant.
Cluster 2 can be seen in the upper right corner. The characteristics of this group are similar to those of Cluster 1, although the values in the different neurons are more homogeneous. Overall, their scores are higher, with slightly longer routes and longer durations, and they started out earlier in the morning. The main difference between this group and the previous one is that the people in Cluster 2 (23.3% of the sample) gave a wider range of reasons for their visit. Most of them came to Kasprowy Wierch for recreation, the scenery and nature experience, although they also asserted a need for physical activity, health and well-being, experiencing silence and de-stressing environment as secondary reasons. In short, this cluster could be described as non-consuming, contemplative tourists.
Clusters 3 and 4 can be seen in the lower part of the maps. As already noted above, Cluster 3 will be dealt with in a separate sub-section. Cluster 4 contains people who made trips of similar length and duration to Clusters 1 and 2. However, as can be seen in the maps, there are great differences between the neurons in the same cluster, in other words this is a small (19.2% of the sample) and heterogeneous group. Curiously, their behavior is similar to Cluster 1, except for the reasons given for making the trip. Those in Cluster 3 were only interested in the scenery and nature, discounted all other reasons, and showed the second highest level of interest in nature experience.
A more detailed description of these profiles (in form of a Table) can be found in the Supplementary Material (S2), which gives the average values, standard deviation and 95% confidence interval of neuron values grouped by clusters.
Cluster 3 is the largest group (41.3% of the sample) and although its subjects share similar characteristics, two different types of behavior can be identified (Figure 3 and Figure 4). As we considered this cluster to be of special interest to our work, they are divided by a line in order to monitor the characteristics of both subgroups. As already noted, the trip type typical of each neuron is superimposed on Figure 2 (labels map). The lower left corner contains the visitors who used the cable car to go up and down, while the central area of this cluster represents those who either used the cable car in one direction only or did not use it at all.
The first subgroup in Cluster 3 (visitors who used the cable car) is composed of people who made a brief visit to the national park and covered a short distance of approximately 2.5 km. These visitors started their visit at around 10 a.m., are about 40 years old and their education level is medium-low. They travelled in larger groups (3 or more people), used unsuitable footwear and their reasons for visiting the park were mostly enjoying the views and scenery along with using the cable car.
The second subgroup in Cluster 3 (visitors who used the cable one way only or did not use it at all) made longer visits to the national park. They were younger (on average 32 years old), had a university education, came in groups of 2 and wore proper trekking shoes. Their main reasons for visiting Kasprowy Wierch were to engage in physical activity and to enjoy surrounding views and scenery.

4. Discussion

4.1. Significance of the Findings and Methodological Aspects

The main contribution of this study is its successful application of SOM technique to tourist segmentation in order to obtain a better understanding of the motives and behavior of visitors to a popular mountain protected area.
Theoretical assumptions concerning tourist types or empirical profiles based on basic statistical methods (cluster analysis) have typically been applied to tourist analyses. Recently, more advanced analytical concepts such as fuzzy logic have been applied in this field to support decision making processes in tourist destinations. Other techniques have also been used in the specialist literature for segmenting samples, such as time series analysis, regression analysis and other statistical methods [37]. However, all these techniques assume that the analyzed variables have linear relationships with each other. The complexity of data based on sociological parameters makes this assumption erroneous in many cases. To overcome this problem the latest statistical techniques such as fuzzy logic, neuronal networks, self-organizing maps (SOM), multidimensional scaling are now being used.
Although self-organizing maps (SOM) have gained recognition in the natural sciences [38], this method is still rarely used in social science [39]. Among SOMs’ several advantages, two are of special interest for our study: data can be classified non-linearly, and the distances between clusters can be calculated (i.e., spatial distance translates into statistical dissimilarity). On the other hand, visualization with maps (component planes) facilitates finding topographic relationships among the different measured variables.

4.2. Visitor Profiling in Nature-Based Tourism

The results obtained show a considerable degree of heterogeneity among the visitors to the Tatra National Park. We found four major profiles with distinct characteristics and behavior. Using the SOM technique enabled us to visualize the similarities and differences between clusters in the various measured variables.
Although all the respondents decided for one particular destination in the protected area, their motives and behavior differed widely. Surprisingly, contact with nature was not the common motivation for all the visitors, so that the initial assumption that nature-based tourists seek close contact with nature could not be confirmed. In this way, the results fit the broad definition of nature-based tourism and also include consumer tourism [1,7]. Our findings show that only a part of the visitors to the national park can be classified as ecotourists [7] or conservation tourists [3]. In our study Clusters 2 and 4 were motivated to experience nature, while the other two groups of visitors where mostly interested in admiring the scenery or getting physical exercise. The defined clusters are closely similar to the theoretical types proposed by Stankey [17]: purists, neutralists and urbanists. The four visitor profiles derived from the present study also have common patterns with empirical studies performed in outdoor leisure settings in Australia [40], China [41] and the USA [42].
From the nature conservation perspective, lack of interest in nature is dangerous or at least worrisome. A visual inspection of Cluster 3 (43.1% of subjects) reveals that there are two distinct behaviors inside the same group (Figure 3 and Figure 4, bottom left) separated by a thick black line. Both groups show different walking patterns and different reasons for their visits; some want to practice sport and others to enjoy the views and ride up in the cable car. Hereinafter the subgroups of this cluster will be referred to as “casual visitors” and “fitness visitors”. The “casual visitor” is the one who makes a short trip, minimizing the cost-physical benefit ratio of the excursion. To date, there is no precise and definitive classification of the types of tourist that visit natural environments. Our “casual visitor” profile fits in with the classification carried out by Hvenegaard in 2002, which divides ecotourists according to the activities they perform (i.e., activity-based typology). This author describes, among many others, two types of visitors called “intensive visitor” and “highlights visitor”. According to Hvenegaard “intensive and highlights visitors were primarily motivated by scenery, waterfalls, and the highest point” [43]. In our case, this typology matches with the fact that “casual visitors” are the cable car users (mostly return cable-car trippers). Obviously, their intention is to enjoy the sights and go up by cable car. According to the continuum of Orams [44] from the ecotourism point of view this type has a “passive” role that does not in principle negatively impact the environment, although neither do they actively contribute to its conservation.

4.3. Limitations of the Proposed Methodology

One of the limitations of our work is the relatively short list of questions used in the questionnaire. The main premise of the interview was to reduce its completion time in order to have more time to document the visitors’ trip itinerary. As the study showed that a large share of national park visitors are not particularly interested in nature, it will be necessary to explore this issue in detail in future studies, by extending the interview section concerning environmental awareness and knowledge of the natural environment of the visited area. Also extension of research to other seasons, especially winter season including additional recreational activities, such as downhill skiing would be desirable.
Another discussion point refers to the selection of input variables used in the analysis and the uneven scales of values among the variables. Pure categorical variables cannot be used directly in SOM procedures, which is one of this analytical method’s limitations. The categories need to be converted into separate binary variables that have a stronger influence on the results due to splitting one feature into a set of variables.

4.4. Implications for Tourism Management

The results obtained have important implications for developing tourism management strategies in the Kasprowy Wierch area, the Tatra National Park and the entire region. Due to the heterogeneity of the visitors’ motives and their recreational behavior, there is a great potential for marketing strategies or nature preservation policies in order to target different types of visitor.
The results depicted in Figure 3 show that the cable car users walked a distance of approximately 2 km in the area close to the cable car, so that an increase in the number of cable car users would probably harm the environment in this section of the park. This underlines the long-term problem between mass tourism (business returns, economic development) versus nature preservation and protection. From the ecological point of view (nature preservation), it would be beneficial to reduce the use of the cable car to avoid people concentrating in the alpine zones of the park, which are more vulnerable to high concentration of visitors than trails at lower elevations.
In the same cluster we find the “fitness visitors” whose major motivation is physical activity (hiking). Although sport and recreation in a natural environment has a positive impact on human health and wellbeing [45], such activities could have a negative impact on natural (protected) environments [46,47,48]. Therefore, these visitors should be informed about how to respect the ecosystem and reduce potential damage to the environment.
On the other hand, from the point of view of the cable car business, it could be interesting to promote leisure activities that start and/or end near the cable car station. It should not be forgotten that the cable car could be of social importance for visitors with physical disabilities, older visitors or visitors with small children who appreciate easier access of higher altitude alpine environment.
However, since these two problems are forced to live together, maybe the best solution to protect the natural environment while not harming the business interests of the cable car in the Tatra area would be to find a win-win strategy. A common goal would be focusing on persons with reduced mobility (e.g., the elderly, people with physical disabilities or families with small children).

5. Conclusions

The analysis and understanding of tourism phenomena needs reliable techniques in order to support management of tourism destinations. Segmentation is a widespread approach to reduce the complexity of visitor characteristics and their behavior. Self-organizing maps (SOM) is a reliable technique to create visitor profiles and establish relations between them. In our case, it enabled us to identify different types of visitors to a heavily used destination—Kasprowy Wierch—located in the Tatra National Park, Poland. The results revealed considerably large group of tourists visiting the national park for reasons other than nature experience. In this way, we contribute to international discussion concerning the problem of sustainable tourism management in popular protected areas and highlight the existence of visitor segment demonstrating consumptive, rather than contemplative needs regarding protected area. Our study also shows that, less than a half of visitors arrive to the alpine destination motivated by a need of a close contact with nature. Therefore, the widespread assumption that all national park visitors are interested in eco-tourism has been questioned.
The proposed clustering methodology (SOM) may be used for visitor profiling in any tourist or recreational domain. Exploring people’s social characteristics and behavior using the SOM approach can produce reliable results in any social science field, ranging from market research for tourism services providers and operators to area protection policies.

Supplementary Materials

The following are available online at https://www.mdpi.com/2071-1050/11/5/1314/s1. S1: Questionnaire form used in the study; S2: Table with descriptive statistics of the different clusters.

Author Contributions

K.T., L.-M.G. and J.L.T.-H. came across the idea of applying SOM in visitor profiling in the study area, K.T., C.B. and A.M. designed visitor monitoring methodology (including survey design) in the Tatra National Park, A.Z. coordinated data collection (direct interviews) in the field; K.T., L.-M.G and X.G.-M. designed the methodology of data analysis (choice of variables and analysis methods and parameters). L.-M.G and X.G.-M analyzed the data in Mathlab; K.T., L.-M.G., X.G.-M. and M.P.-C. wrote the entire paper, A.M. and C.B. contributed substantially to the introduction and the discussion part of the manuscript, J.L.T.-H. provided advice at the analytical stage of the study, contributed to data presentation and discussion of the results, as well as the overall manuscript, and did review editing.

Funding

Tatra National Park, Poland; individual research grants of the University of Valencia, Spain (Ayudas para estancias de investigación: UV-INV_EPDI15-272601 and UV-INV EPDI15-276152); BOKU-Vienna Open Access Publishing Fund.

Acknowledgments

This study has been supported by the Tatra National Park in Poland and received two research grants from the University of Valencia, Spain (Ayudas para estancias de investigación: UV-INV_EPDI15-272601 and UV-INV EPDI15-276152). The authors wish to thank the management, staff and the volunteers of the Tatra National Park for their efforts and great support during the course of the project, especially the TNP directors Paweł Skawiński and Szymon Ziobrowski for initiating the research. The publication of this manuscript has been supported by BOKU-Vienna Open Access Publishing Fund.

Conflicts of Interest

The authors declare no conflicts of interest. The founding sponsors had no role in the design of the study, analyses, or interpretation of data; in the writing of the manuscript. Volunteers of the Tatra National Park, coordinated by the national park staff took part in data collection in the field. The agreement to publish the results has been obtained from the Tatra National Park administration.

References

  1. Newsome, D. Natural Area Tourism: Ecology, Impacts and Management; Channel View Publications: Bristol, UK, 2002. [Google Scholar]
  2. Plummer, R.; Fennell, D.A. Managing protected areas for sustainable tourism: Prospects for adaptive co-management. J. Sustain. Tour. 2009, 17, 149–168. [Google Scholar] [CrossRef]
  3. Buckley, R.C. Conservation Tourism; CABI Publishing: Wallingford, UK; Cambridge, MA, USA, 2010; ISBN 978-1-84593-665-5. [Google Scholar]
  4. IUCN—Red List of Ecosystems. Available online: https://www.iucn.org/about/union/commissions/cem/cem_work/tg_red_list/ (accessed on 28 March 2016).
  5. Siikamäki, P.; Kangas, K.; Paasivaara, A.; Schroderus, S. Biodiversity attracts visitors to national parks. Biodivers. Conserv. 2015, 24, 2521–2534. [Google Scholar] [CrossRef]
  6. Eagles, P.F.J.; McCool, S.F.; Haynes, C.D. Sustainable Tourism in Protected Areas: Guidelines for Planning and Management, 2nd ed.; United Nations Environment Programme: Gland, Switzerland, 2002; ISBN 978-2-8317-0648-1. [Google Scholar]
  7. Buckley, R. Ecotourism: Principles and Practices; CABI Publishin: Wallingford, UK, 2009. [Google Scholar]
  8. Coghlan, A.; Buckley, R. Nature-Based Tourism. In A Handbook of Tourism and the Environment; Holden, A., Fennell, D., Eds.; Routledge: London, UK, 2012. [Google Scholar]
  9. Fennell, D.A. What’s in a name? Conceptualizing natural resource-based tourism. Tour. Recreat. Res. 2000, 25, 97–100. [Google Scholar] [CrossRef]
  10. Cessford, G.; Muhar, A. Monitoring options for visitor numbers in national parks and natural areas. J. Nat. Conserv. 2003, 11, 240–250. [Google Scholar] [CrossRef]
  11. Haley, R.I. Benefit Segmentation: A Decision-oriented Research Tool. J. Mark. 1968, 32, 30–35. [Google Scholar] [CrossRef]
  12. Van Marwijk, R.; Taczanowska, K. From Recreationists & Tourists to Artificial Agents. In Exploring the Nature of Management. Proceedings of the Third International Conference on Monitoring and Management of Visitor Flows in Recreational and Protected Areas. University of Applied Sciences Rapperswil, Switzerland; Siegrist, D., Clivaz, C., Hunziker, M., Iten, S., Eds.; Research Centre for Leisure, Tourism and Landscape, Institute for Landscape and Open Space, University of Applied Sciences Rapperswil: Rapperswil-Jona, Switzerland, 2006. [Google Scholar]
  13. Dolnicar, S.; Grün, B. Challenging “factor–cluster segmentation”. J. Travel Res. 2008, 47, 63–71. [Google Scholar] [CrossRef]
  14. Konu, H.; Kajala, L. Segmenting protected area visitors based on their motivations. Nat. Prot. Publ. Metsähall. Ser. A 2012, 15, 1–74. [Google Scholar]
  15. Plog, S. Why destination areas rise and fall in popularity. Cornell Hosp. Q. 2001, 42, 13. [Google Scholar] [CrossRef]
  16. Cohen, E. Rethinking the sociology of tourism. Ann. Tour. Res. 1979, 6, 18–35. [Google Scholar] [CrossRef]
  17. Stankey, G.H. Visitor Perception of Wilderness Recreation Carrying Capacity; US Department of Agriculture, Forest Service, Intermountain Forest and Range Experiment Station: Ogden, UT, USA, 1973.
  18. Palacio, V. Identifying ecotourists in Belize through benefit segmentation: A preliminary analysis. J. Sustain. Tour. 1997, 5, 234–243. [Google Scholar] [CrossRef]
  19. Arnberger, A.; Haider, W. Social effects on crowding preferences of urban forest visitors. Urban For. Urban Green. 2005, 3, 125–136. [Google Scholar] [CrossRef]
  20. Taczanowska, K. Modelling the Spatial Distribution of Visitors in Recreational Areas. Ph.D. Thesis, Universität für Bodenkultur Wien, Wien, Austria, 2009. [Google Scholar]
  21. Dolnicar, S. Insights into Sustainable Tourists in Austria: A Data-based A Priori Segmentation Approach. J. Sustain. Tour. 2004, 12, 209–218. [Google Scholar] [CrossRef] [Green Version]
  22. Dolnicar, S.; Crouch, G.I.; Long, P. Environment-friendly Tourists: What Do We Really Know about Them? J. Sustain. Tour. 2008, 16, 197–210. [Google Scholar] [CrossRef]
  23. Blamey, R.K.; Braithwaite, V.A. A Social Values Segmentation of the Potential Ecotourism Market. J. Sustain. Tour. 1997, 5, 29–45. [Google Scholar] [CrossRef]
  24. Boley, B.B.; Nickerson, N.P. Profiling geotravelers: An a priori segmentation identifying and defining sustainable travelers using the Geotraveler Tendency Scale (GTS). J. Sustain. Tour. 2013, 21, 314–330. [Google Scholar] [CrossRef]
  25. Kohonen, T. Self-organized formation of topologically correct feature maps. Biol. Cybern. 1982, 43, 59–69. [Google Scholar] [CrossRef]
  26. Kohonen, T. Essentials of the self-organizing map. Neural Netw. 2013, 37, 52–65. [Google Scholar] [CrossRef] [PubMed]
  27. Haykin, S.; Network, N. A comprehensive foundation. Neural Netw. 2004, 2, 41. [Google Scholar]
  28. Mazanec, J.A. Image measurement with self-organizing maps: A tentative application to Austrian tour operators. Tour. Rev. 1994, 49, 9–18. [Google Scholar] [CrossRef]
  29. Mazanec, J.A. Positioning analysis with self-organizing maps: An exploratory study on luxury hotels. Cornell Hotel Restaur. Adm. Q. 1995, 36, 80–95. [Google Scholar] [CrossRef]
  30. Dolnicar, S.; Grabler, K.; Mazanec, J.A. Analyzing Destination Images: A Perceptual Charting Approach. J. Travel Tour. Mark. 2000, 8, 43–57. [Google Scholar] [CrossRef] [Green Version]
  31. Kim, J.; Wei, S.; Ruys, H. Segmenting the market of West Australian senior tourists using an artificial neural network. Tour. Manag. 2003, 24, 25–34. [Google Scholar] [CrossRef]
  32. Zhang, G.P. Neural Networks in Business Forecasting; Idea Group Inc. (IGI): Hershey, PA, USA, 2004; ISBN 978-1-59140-215-2. [Google Scholar]
  33. Bloom, J.Z. Tourist market segmentation with linear and non-linear techniques. Tour. Manag. 2004, 25, 723–733. [Google Scholar] [CrossRef]
  34. Taczanowska, K.; Zięba, A.; Brandenburg, C.; Muhar, A.; Preisel, H.; Zięba, S.; Krzeptowski, J.; Krajewska, A.; Kamińska, K.; Latosińska, B.; et al. Visitor monitoring in the Tatra national park—A pilot study—Kasprowy Wierch [monitorig ruchu turystycznego w tatrzańskim parku narodowym—Studium pilotażowe—Kasprowy Wierch 2014; Final Report; Institute of Landscape Development, Recreation and Conservation Planning, University of Natural Resources and Life Sciences (BOKU): Wien, Austria, 2016. [Google Scholar]
  35. Vesanto, J.; Himberg, J.; Alhoniemi, E.; Parhankangas, J. Self-organizing map in Matlab: The SOM toolbox. In Proceedings of the Matlab DSP Conference; Citeseer: Espoo, Finland, 1999; pp. 35–40. [Google Scholar]
  36. Guerrero, J.D.M.; Marcelli, D.; Soria-Olivas, E.; Mari, F.; Martínez-Martínez, J.M.; Bech, I.S.; Martínez-Sober, M.; Scatizzi, L.; Gómez-Sanchis, J.; Stopper, A.; et al. Self-Organising Maps: A new way to screen the level of satisfaction of dialysis patients. Expert Syst. Appl. 2012, 39, 8793–8798. [Google Scholar] [CrossRef]
  37. Dragomir, O.E.; Dragomir, F.; Radulescu, M. Matlab Application of Kohonen Self-organizing Map to Classify Consumers’ Load Profiles. Procedia Comput. Sci. 2014, 31, 474–479. [Google Scholar] [CrossRef] [Green Version]
  38. Lek, S.; Guégan, J.-F. Artificial neural networks as a tool in ecological modelling, an introduction. Ecol. Model. 1999, 120, 65–73. [Google Scholar] [CrossRef]
  39. Lei, S.; Kelly, M. Evaluating Collaborative Adaptive Management in Sierra Nevada Forests by Exploring Public Meeting Dialogues Using Self-Organizing Maps. Soc. Nat. Resour. 2015, 28, 873–890. [Google Scholar] [CrossRef]
  40. Larson, S.; Herr, A. Sustainable tourism development in remote regions? Questions arising from research in the North Kimberley, Australia. Reg. Environ. Chang. 2008, 8, 1–13. [Google Scholar] [CrossRef]
  41. Cheung, L.T. Improving visitor management approaches for the changing preferences and behaviours of country park visitors in Hong Kong. In Natural Resources Forum; Wiley Online Library: Hoboken, NJ, USA, 2013; Volume 37, pp. 231–241. [Google Scholar]
  42. Lai, P.-H.; Sorice, M.G.; Nepal, S.K.; Cheng, C.-K. Integrating social marketing into sustainable resource management at Padre Island National Seashore: An attitude-based segmentation approach. Environ. Manag. 2009, 43, 985–998. [Google Scholar] [CrossRef] [PubMed]
  43. Hvenegaard, G.T. Using tourist typologies for ecotourism research. J. Ecotourism 2002, 1, 7–18. [Google Scholar] [CrossRef]
  44. Orams, M.B. Towards a more desirable form of ecotourism. Tour. Manag. 1995, 16, 3–8. [Google Scholar] [CrossRef]
  45. Nieuwenhuijsen, M.J.; Kruize, H.; Gidlow, C.; Andrusaityte, S.; Antó, J.M.; Basagaña, X.; Cirach, M.; Dadvand, P.; Danileviciute, A.; Donaire-Gonzalez, D.; et al. Positive health effects of the natural outdoor environment in typical populations in different regions in Europe (PHENOTYPE): A study programme protocol. BMJ Open 2014, 4, e004951. [Google Scholar] [CrossRef] [PubMed]
  46. Zwijacz-Kozica, T.; Selva, N.; Barja, I.; Silván, G.; Martínez-Fernández, L.; Illera, J.C.; Jodlowski, M. Concentration of fecal cortisol metabolites in chamois in relation to tourist pressure in Tatra National Park (South Poland). Acta Theriol. 2013, 58, 215–222. [Google Scholar] [CrossRef]
  47. Brown, C.L.; Hardy, A.R.; Barber, J.R.; Fristrup, K.M.; Crooks, K.R.; Angeloni, L.M. The effect of human activities and their associated noise on ungulate behavior. PLoS ONE 2012, 7, e40505. [Google Scholar] [CrossRef] [PubMed]
  48. Sterl, P.; Brandenburg, C.; Arnberger, A. Visitors’ awareness and assessment of recreational disturbance of wildlife in the Donau-Auen National Park. J. Nat. Conserv. 2008, 16, 135–145. [Google Scholar] [CrossRef]
Figure 1. Location of the case study area: Kasprowy Wierch, Tatra National Park, Poland.
Sustainability 11 01314 g001
Figure 2. U-matrix (Left), cluster (Central) and, label and hits maps (Right). Left map shows the U-matrix of the neuron distances; the central map shows clusters found through the K-means algorithm, from left to right and from top to bottom, Clusters 1, 2, 3 and 4. Right map, green represents the number of impacts (subjects) included inside each neuron; red labels = dominating trip type of each neuron, C = visitors using cable car to go up and down; U = visitors using cable car to go up to Kasprowy Wierch; D = visitors hiking up and using cable car to go down from Kasprowy Wierch; F = visitors hiking up and down both ways. The thick blue line separates the neurons including most cable car users and the neurons with other types of user in Cluster 3.
Sustainability 11 01314 g002
Figure 3. Component planes of the visitor characteristics and his/her trip characteristics. From left to right top row, component planes of the variable Route length: distance covered in meters. Trip duration: total time in hours; Start: time when the excursion started; Age: age in years of the visitors; Bottom row, Level of education: 1 = primary school, 2 = intermediate level and 3 = higher education; Group size = number of people travelling together; Number people > 61 = number of people in the group over 61 years old; Shoes = type of footwear, 1 = inappropriate, 2 = sports shoes, 3 = hiking shoes/boots. In the lower left corner of each map there is a thick black line surrounding Cluster 3. The thick white line shares the neurons with most subjects using the cable car and the neurons that include other types of users in the cluster.
Sustainability 11 01314 g003
Figure 4. Component planes of visitor motivations. From left to right, top and bottom rows, component planes of main reasons for visiting Kasprowy Wierch (more than one reason could be given). The variables were coded as 1 = yes, 0 = no. In the lower left corner of each map there is a thick black line surrounding Cluster 3. The thick white line shares the neurons with most subjects using the cable car and the neurons that include other types of users in the cluster.
Sustainability 11 01314 g004
Table 1. Overview of the trips registered in the Kasprowy Wierch area and sample size.
Visitor Group (Trip Type)Registered Trips
(Jul-Sept 2014)
Sample Size
(17 Sampling Days)
N%N%
T1 (C): cable car users (ticket up & down) 138 24347%104042%
T2 (U): cable car users (ticket up) 60 92121%51020%
T3 (D): cable car users (ticket down) 35 14712%34614%
T4 (F): hikers (not using the cable car)58 18220%59224%
Total292 493100%2488100%
Table 2. Type of visitors according to their use of the cable car.
Cluster 1
(n = 345)
Cluster 2
n = 493)
Cluster 3
(n = 876)
Cluster 4
(n = 406)
T1 (C): cable car users (ticket up & down)11391478106
T2 (U): cable car users (ticket up)90140152119
T3 (D): cable car users (ticket down)518110867
T4 (F): hikers (not using the cable car)91181138114
Χ2 = 223.4; p < 0.001.

