Improving Sustainable Mobile Health Care Promotion: A Novel Hybrid MCDM Method


1
School of Economics and Management, Harbin Institute of Technology, Weihai City 264209, China
2
Graduate Institute of Urban Planning, College of Public Affairs, National Taipei University, 151, University Rd., San Shia District, New Taipei City 23741, Taiwan
*
Authors to whom correspondence should be addressed.
Sustainability 2019, 11(3), 752; https://doi.org/10.3390/su11030752
Submission received: 5 January 2019
/
Revised: 28 January 2019
/
Accepted: 28 January 2019
/
Published: 31 January 2019
(This article belongs to the Special Issue Methodologies and Applications of Multiple Criteria Decision Making for Sustainable Development)
Abstract
:Identifying the key influencing factors that affected users’ adoption of sustainable mobile health care and improving alternative mobile health services continuously can help ordinary consumers (especially vulnerable populations) use extensive health resources cheaply and conveniently; which can increase the quality and equity of health services; so as to promote the sustainable development of medical resources. We integrated decision making trial and evaluation laboratory (DEMETEL)-based analytic network process (DANP) and a modified VlseKriterijumska Optimizacija I Kompromisno Resenje (VIKOR) method to form a DDANPMV (DEMATEL+ DANP + Modified VIKOR) model to examine consumers’ adoption of mobile health care. This method was developed to not only help decision-makers evaluate alternative mobile health care and determine the best option, but also use to identify and improve the performance gap of alternative products with the goal of satisfying the aspirations of consumers. Four types of mobile health care products were analyzed. The results indicate that social norms; product image; and consumer trust are three key factors in consumer adoption. The results can guide policy design and implementation. The government and enterprises should improve mobile health care through these three aspects.
1. Introduction
1.1. Research Background
Mobile health care is an important aspect of electronic medicine that involves using mobile devices (e.g., mobile phones, tablet computers, and personal digital assistants) to provide medical services and health information to patients [1]. Health care faces numerous problems, including high medical costs and poor medical service availability [2]. Nowadays, mobile health care allows people to access the services of certified doctors in a rapid speed and low price through health mobile applications or websites on mobile terminals like mobile-phones. Therefore, mobile health care can help to reduce medical costs and waiting times and improve the efficiency of medical resources use [3]. In turn, it can become a way of sustainable development in the field of medical health. As a result, ordinary consumers, especially the vulnerable ones, will benefit. In China, people in rural areas and urban migrant communities can hardly access quality medical resources and it is difficult for them to afford expensive medical expenses as well [4]. While the medical resources in some big cities are redundant, which reflects the uneven distribution of medical resources. However, with the help of mobile health care, people can treat many common diseases like influenza and toothache themselves under the suggestions of online certified doctors. The mobile medical devices worn by the elderly will feed the data back to the customer center of the enterprises, which will be analyzed and submitted by a professional physician to the customer. In this way, mobile health improves efficiency, reduces medical costs, and promotes quality, equity and sustainability of public health.
With the development of mobile networks, many countries have entered the 4G era and benefit from continuously improving mobile communication networks and innovation in software and hardware technology. According to a report issued by China Internet Network Information Center (CNNIC), the number of mobile internet users in China has reached 753 million, accounting for 97.5% of its internet population (772 million) [5]. In March 2015, the Internet Plus action plan was first promoted by Premier Li Keqiang, advocating combining traditional industries and the Internet. Under this action plan, merging medicine with the Internet will promote integration between health care and other areas of the mobile Internet industry.
The mobile health care industry evidently has good development prospects regarding mobile devices and market demand. Mobile health care services can have great social and economic benefits through their convenient and efficient allocation of hospital resources [6]. In addition, the rational allocation of medical resources through mobile healthcare can help people form a low-carbon and sustainable lifestyle. However, a report conducted by IQVIA in 2017 indicates that, although more than 318,500 health-related applications (apps) are available, 85% of them have fewer than 5000 downloads [7]. Considerable scope remains for consumers to further accept and adopt mobile health care.
Moreover, mobile medical care can transfer the surplus medical resources in big cities to areas with poor medical resources, such as rural areas. This process reduces the waste of medical resources and thus promotes sustainability. This study investigated the influence factors of consumers’ adoption of mobile health care. The three aims of the study were as follows: (1) to build an evaluation index system of consumers’ adoption of mobile health care (because few studies have addressed this issue, this is a pioneering study); (2) to investigate the key influence factors of consumers’ adoption of medical health care through a model, termed DDANPMV, based on the evaluation index system and decision-making trial and evaluation laboratory (DEMATEL), a DEMATEL-based analytic network process (DANP), and a modified VlseKriterijumska Optimizacija I Kompromisno Resenje (VIKOR) method, thereby providing guidance for providers to improve mobile health care; and (3) to verify the effectiveness of the model according to specific mobile health care products. This not only provides guidance to consumers in choosing mobile health care products but also enables optimal improvement strategies to be identified by revealing the gaps in different mobile health care products with respect to consumer aspirations. This study contributes by analyzing the influence factors of consumers’ adoption intention, which enables mobile health care products to be promoted. The promotion process presents various obstacles, such as users’ concerns regarding the safety and privacy of personal information [8] and the effect of e-payments on medical reimbursement [9]. Previous studies on mobile health care have mostly focused on the technological development and clinical expansion [10,11,12], and few studies have been conducted on consumer adoption. As mobile health care requires personal information, this creates higher requirements for privacy and safety. This study on the influence factors of consumer adoption is crucial for the improvement and promotion of mobile health. Based on the key influence factors identified in this research, decision-makers can accordingly adopt measures to promote consumers’ adoption of mobile health care.
Whereas previous studies have applied deficient research methods, in this study, the key mutually influential factors that more effectively promote mobile health care adoption can be identified. A new hybrid modified multi-criteria decision-making (MCDM) method was adopted. First, we constructed an influence network relation map (INRM) and determined the influence weights (IWs) of a DANP [13] by applying the influence relation matrix through a DEMATEL technique. We then combined the IWs with the modified VIKOR method to integrate these weights in the criteria evaluation. This method used INRM to systematically establish performance improvement strategies. The process was named the DDANPMV model [14,15,16,17,18,19]. We proposed that the DDANPMV model is a more effective method of solving the research problem. In this paper, an empirical case is illustrated to demonstrate the feasibility and effectiveness of the proposed method. Four mobile health care products were selected. P1 was developed by a sensor company, P2 is a smart pill with an embedded chip developed by a start-up company, P3 is the smart health scanner launched by a health care product company, and P4 is a mobile electrocardiogram device developed by a biotechnology company.
1.2. Foreign and Domestic Studies
Many foreign studies on mobile health care have concentrated on technological research and development such as using cloud computing, sensors, and Bluetooth to improve the application of mobile health care [20,21,22,23]. Additionally, there is also a wealth of studies across Europe looking at the adoption of mobile health care [24,25,26]. Initially, research mainly focused on the development prospects of mobile health care [27,28]. As an aspect of electronic health care, mobile health care has expanded constantly. Consequently, scholars have begun to research its effectiveness. They have verified the reliability and effectiveness of mobile health using qualitative methods such as focus groups and literature reviews [29,30]. In addition, scholars have researched specific consumers and areas on the basis of health care adoption. Brian and Ben-Zeev [31] conducted a literature review of the expansion of mobile health care in Asia and concluded that funding, cultural differences, data security, and privacy are barriers for mobile health care development in Asia. Khatun et al. [32] established a framework that includes the influence of technology, motivation, and resources on the adoption of mobile health, and they verified this framework through a questionnaire survey, thereby providing a reference for decision-makers. Medhanyie et al. [33] found that issues involving smartphones, the operation of medical systems, and staff behavior hindered medical staff from adopting mobile health care. Their study was conducted using a semi-structured questionnaire involving 13 health care providers and 25 health promotion personnel. On the basis of a motivational model (MM), Cocosila and Archer [34] concluded that internal incentives can motivate adoption, whereas perceived risk decreases adoption.
These studies were conducted mainly through qualitative analysis and lacked the objectivity of quantitative analysis because there is a richness to the data that can be gleaned from interviews/focus groups with the end users. Few researchers have applied quantitative analysis to the study of mobile health care adoption. Akter et al. used a partial least squares (PLS) path model to demonstrate that reliability has both a direct and indirect influence on sustaining the utilization of mobile health care information services. Consumer trust has a mediating effect between reliability and sustaining utilization, whereas reliability has no regulating effect between consumer trust and sustaining utilization [35]. They also extended the expectation-confirmation model (ECM) and utilized a continuous medical model in another study, the sustaining adoption intention of economically disadvantaged groups was analyzed and the model included consumer trust and quality of service help [36]. Hung and Jen [37] applied a technology acceptance model (TAM) and PLS data analysis and concluded that perceived usefulness and perceived ease of use have different influences on different adopters. There are also several mixed/multiple method studies which seek to take the benefits from both qualitative and quantitative analysis. For example, Michel-Verkerke and Hoogeboom (2013) used the USE IT-questionnaire to construct an evaluation system of the adoption of electronic patient records by healthcare and evaluated the questionnaire by applying a principal component analysis [38].
The mobile health care industry has developed rapidly in China. When searching for the keyword “health” in a popular mobile app store such as SnapPea, thousands of apps can be found. Domestic studies of mobile health care have mainly concentrated on two aspects: (1) the technological level of medical health care: with the development of embedded technology, struts + spring + hibernate architecture, and cloud computing, research on mobile health care has evolved with the development of new technologies [39,40]. (2) Analytical investigation of the development status of mobile health: researchers have analyzed the domestic development prospects and barriers of mobile health by using various management models [41]. These studies have mostly been conducted using qualitative research methods that lack analysis and verification. In recent years, few studies have been conducted on the adoption, acceptance, and trust of mobile health. Chinese scholars have only recently begun to conduct quantitative analysis of consumers’ adoption of mobile health care. Taiwanese scholars [42] studied the influence factors involved in medical staff choosing mobile services to support their work by using a TAM. Similarly, the behavior involved in consumers’ adoption of mobile health care can be analyzed using analogous models and methods. Yang and Wang explored the key influence factors of the adoption of an asthma treatment mobile service in Taiwan by using a TAM [43]. After analyzing questionnaire data through structural equation modeling, they concluded that attitude is the key influence factor, followed by perceived usefulness, management support, and subjective standards and perceived ease of use.
Studies on the adoption of mobile health have mainly used a TAM, and emphasized perceived usefulness and perceived ease of use. However, the influences of social norm [44] and perceived behavioral control [45] on acceptance behavior have been excluded. In addition, studies have mostly been conducted using qualitative analysis and minimal quantitative analysis. The limitations of previous studies lack systematic analysis, including that of the intrinsic influence relationships among index factors.
1.3. Research Content and Framework
To address the shortcomings of previous studies, this study applied a new conceptual framework of mobile health care to develop a measurable evaluation index system with the DDANPVM model. Therefore, we further explored the relationship and degree among dimensions and criteria [46,47,48,49,50,51,52,53,54] with respect to performance improvement. First, this study addressed both internal and external influence factors in consumers’ adoption of mobile health care, applying literature analysis, discussion, and summarization. Second, the evaluation index system was constructed synthetically at both the criterion and dimension levels according to domestic and foreign studies, thereby enriching current theoretical knowledge on mobile health care and providing new insights. Third, we recognized the cause–effect relationships between criteria and dimensions and confirmed the key influence factors and their IWs. The DEMATEL method can be used to construct an INRM and determine the IWs, preserving the relationships among dimensions and criteria in a universal model based on the basic concept of ANP, which has been termed DANP [14,15,16,17,18,19]. Finally, the study verified the effectiveness of the DDANPVM model through empirical analysis, and confirmed that the gap between various factors of several candidate products through the modified VIKOR method, providing references for decision-makers and consumers [14,15]. The combination of DANP and the modified VIKOR method enables the identification of performance limitations, thereby providing multicriteria optimization of complex systems [50] and prioritizing their improvement and promoting consumers’ adoption of mobile health care [15,16,17,18,19]. These results were concluded through quantitative analysis, which offered specific sustainable development planning advice. The structure of the paper is shown in Figure 1.
2. Identification of Key Influence Factors of Mobile Health Care Adoption
Mobile health care provides health services to mobile device owners. Mobile health care products have the characteristics of both health services and mobile devices, and these characteristics affect consumers’ experiences and satisfaction. Designing health services based on the analysis of these characteristics can contribute to the development of an index system of consumers’ adoption of mobile health care.
2.1. Analysis of the Characteristics and Adoption of Mobile Health Care
Health care services are provided to meet patients’ medical requirements and are thus a type of service product, sharing common characteristics, such as intangibility, synchronism, non-storage, and heterogeneity, with other service products [55]. As health care services are a special service that involves people’s health, consumers’ experiences and perceptions are influenced by specific characteristics, such as safety, effectiveness, and timeliness [56].
Mobile devices include mobile apps, wearable devices, and mobile terminals, which are the vehicles of mobile health care service provision. The performance of mobile devices affects whether consumers tend to adopt mobile health care products. If too many factors were considered at one time, the effect of key factors may be weakened in the empirical process. Therefore, several representative characteristics of mobile devices were considered in this paper, including convenience, safety, interactivity, and low-cost.
2.1.1. Convenience
Mobile devices are small and portable. From the time when personal computers (PCs) were the main means for transmitting information to the era of the mobile Internet, limitations of time and space have been transcended through a wide variety of portable devices. The combination of health services and mobile devices has expanded the scope of health care services. For instance, users can adopt some health services and obtain diagnoses after installing apps on smart phones.
2.1.2. Safety
Mobile devices require wireless networks to transmit data. In the process of network transmission, users’ personal medical information is potentially at risk. When health services and mobile devices are combined, users’ personal medical information is uploaded to the providers’ servers through a wireless network. Mobile health providers should be responsible for users’ information and ensure that mobile devices have encryption and safety protection.
2.1.3. Interaction
Mobile devices have powerful capacities for storage and computing. Users must interact with mobile devices to realize functions. However, the performance of mobile devices and apps that are related to the user interface, human–computer interaction, and ease of use also influence consumer adoption.
2.1.4. Low-cost
Technological development and the popularization of mobile devices and the mobile Internet present a promising opportunity for mobile health development. For example, users can make an appointment through the hospital’s app after downloading it from an app store, satisfying their medical demands and reducing costs, including value and time costs.
2.2. Evaluation Index System for Consumer Adoption of Mobile Health
According to the above discussion, we established a conceptual framework for influences on the adoption of mobile health care that includes three aspects: technology, motivation, and resources. The framework was verified by experts who have practical experience in this field by using a questionnaire survey. The framework is as follows: (1) technology level, including the availability of smart terminals and the ability to use the Internet on a mobile phone; (2) motivation level, consisting of use experience, trust, and intention to use mobile health care; and (3) resource level, which contains consciousness of using mobile health services, age, and demography. On this basis, and on the basis of the results of foreign and domestic studies, we proposed three first-level indexes (the dimensions): technological dimension, objective dimension, and environmental dimension. The second-level indexes (the criteria) were then determined based on relevant studies.
2.2.1. Technological Dimension (D1)
The technological development of mobile health care is an important factor that prompts consumer adoption. As a revolutionary technology, mobile health care has received considerable attention in recent years [8,57]. TAMs, as proposed by Davis [58], are usually used as basic theoretical models when studying the adoption of information technology. In a TAM, perceived usefulness and perceived ease of use determine people’s intention to accept information technology. Perceived usefulness measures the performance of specific technology in prompting people to act, whereas perceived ease of use indicates the degree of difficulty in using specific technology. Scholars have subsequently verified the effectiveness of this model [59], and the influence of perceived usefulness and perceived ease of use on the adoption of mobile health care have been demonstrated in numerous studies [60,61,62]. Therefore, the technological dimension of this study involves usefulness and ease of use.
In addition, users can receive service they need from mobile health care products. Quality of service significantly influences users’ satisfaction and adoption [63], including quality of medical technological service and quality of nonmedical technological service. Quality of medical technological service not only satisfies users’ requirement for the service value of health services but also provides information safely, effectively, and in a timely manner. Thus, quality of technological service is involved in the technological dimension in this paper.
2.2.2. Subjective Dimension (D2)
The adoption of new technology is related to users’ personal behavioral characteristics. In this field, subjective norm was considered as an important influencing variable [64]. Therefore, this paper includes the subjective dimension among the three influential factors.
The innovation diffusion theory (IDT) presented by Rogers [65] provides related factors that influence adoption behavior. These factors include comparative advantage, complexity, and compatibility. Comparative advantage indicates the dominance of a new innovative technology relative to the time before this technology was applied. Complexity means the difficulty users encounter in using or operating this innovation. Compatibility refers to the degree to which the consistency of innovation, and the extant value, belief and experience that users have. Based on the description of each factor in the TAM and IDT, comparative advantage is similar to perceived usefulness, whereas complexity is similar to perceived ease of use. Among the influential factors presented by Rogers, comparative advantage, complexity, and compatibility are most frequently applied in studies of Internet technology [66]. Therefore, compatibility was included in the objective dimension as an influential factor.
In contrast to traditional approaches to health service, mobile health care uses wireless networks to transmit data and information, which presents the risk of information leakage through the Internet. Information security and user privacy are key factors that affect development of e-commerce [67]. Privacy protection for user information is an urgent issue [68]. Users’ trust towards mobile device technology and providers affects their acceptance of this type of technology and application [69]. This relates to whether providers have the necessary knowledge and skill to satisfy users’ needs, and whether providers have good motives and comply with moral and ethical principles. Hence, users’ trust is involved in the objective dimension as an influencing factor.
Users’ perception of the utility value of products is an important factor that affects satisfaction. Perceived value is a comprehensive evaluation made by consumers based on benefits and costs [70]. Zeithaml [71] indicated that consumers’ perception of product value includes price, whether product utility can be maximized, performance–price ratio, and the relationship between cost and benefit. According to a study by Moore [72], users with different levels of consumption make different choices regarding technological innovation perception and value perception. Hence, users’ perceived value regarding mobile health care is involved in the objective dimension as an influence factor.
2.2.3. Environmental Dimension (D3)
Social identity theory indicates that individuals hope to gain social identity and improve self-esteem by maintaining positive recognition from social groups [73]. Social factors of mobile health care refer to a social group’s degree of recognition of users’ adoption of mobile health care. This social group includes a users’ family, friends, and colleagues, and whether they hold a positive attitude that supports them to use mobile health services. For instance, children might support and persuade their parents to adopt mobile health care due to their poor health status. Social factors influence consumers’ behavior intention [74,75,76,77]. In the mobile health care service field, social factors are one of the most important influence factors in consumer adoption [78]. Thus, social factors are involved in the environmental dimension.
Whether an information technology is widely used and whether the application of this technology is given appropriate social status influences users’ adoption [74]. Hospital or company image, social reputation. and service attitude also influence users’ satisfaction. This study unified objective influences in society into product image and included it in the environmental dimension. The evaluation index system of consumer adoption of mobile health is shown in Table 1.
3. Building a DDANPMV Model for Evaluating and Improving Mobile Health Care
Multiple criteria decision-making (MCDM) is described as “a branch of operational research dealing with finding optimal results in complex scenarios including various indicators, conflicting objectives and criteria” [79]. In recent years, researchers have tried to combine multiple techniques to use MCDM approach to construct optimal decision schemes. Li et al. (2016) integrated heterogeneous information to construct a group decision making model [80]. Yazdani et al. (2016) integrated DEMATEL and quality function deployment model to select the best green supplier [81]. Wang et al. (2016) combined simple additive weighting, techniques for order preference by similarity to an ideal solution and grey relational analysis techniques to construct a hybrid decision-making model which can guide a decision-maker in making a reasonable judgment without requiring professional skills or extensive experience [82]. Mousavi-Nasab and Sotoudeh-Anvari (2017) combined TOPSIS, COPRAS and DEA to solve the problem of material selection [83].
The DDANPMV model was developed to not only to help decision-makers evaluate alternative mobile health care services and identify the best option, but also used for identifying and improving the performance of alternative products and increasing consumer satisfaction. This process includes the DMATEL, DANP, and modified VIKOR methods. This study introduced consumer preference to establish a modified DDANPMV model based on the DDANPV method. This is generally called hybrid MCDM (HMCDM) [13,16,17,18] and was proposed by Prof. Gwo-Hshiung Tzeng. In this approach, the key influence factors of consumers’ adoption of mobile health care are identified to help consumers choose the best mobile health product, thereby improving mobile health care services. This study was designed on the DEMATEL technique which assists in identifying the influence relationship matrix for an INRM and then in determining the influential weights of DANP among dimensions and criteria using basic concepts based on ANP [84,85,86]. Finally, practical problems were solved in real-world situations [87]. The DANP method can effectively measure key influential factors for the development of mobile health care. This method evaluated each criterion through the modified VIKOR method, combining this with satisfying consumer needs (preferences) to fit today’s competitive markets. In other words, “aspired–worst” was used as a benchmark for performance evaluation instead of the “max–min” benchmark which is the most appropriate solution among the existing alternatives. This study also used the influential weights of DANP to represent the integrated performance gap of each criterion or dimension overall. We then considered how this can be used to improve the performance of each criterion or dimension to systematically reduce the performance gap through the continuous improvement and sustainable development of mobile health care. The performance gaps of criteria or dimensions obtained based on INRM enable decision-makers to determine which gaps (maximal gap in overall-viewing of all criteria or in viewing each dimension) should be improved. The new hybrid modified VIKOR method can not only be used for ranking, selection, and improved processing with several mobile health care products (alternatives), but can also be used for optimizing the improvement strategies for single mobile health products, thereby achieving aspiration levels through continuous improvement and sustainable development. The aims of this subsection were to (1) use the DEMATEL method to determine the influence relationships among influence factors, (2) use DANP based on the basic concept of ANP to measure influential weights, and (3) use the modified VIKOR method, which was combined with satisfying consumer needs (preferences) to evaluate the mobile health care products. The framework of the research model is shown in Figure 2.
3.1. Constructing the INRM of Mobile Health Care Based on the DEMATEL Technique
The DEMATEL technique was first developed by the Battelle Research Center in 1972 to build an interrelationship network and explore complex real-world problems [87]. For the current study, we first identified eight criteria for the evaluation index system of mobile health care through literature analysis, discussion, and summarization. These criteria were then confirmed and adopted on the basis of the opinions of experts with practical experience in order to build an influence relation matrix T for the criteria and dimensions and thereby construct an INRM based on the DEMATEL technique. This also involved identifying the cause–effect relationships among eight criteria to obtain more precise IWs in line with real-world problems in the following step [88,89]. Therefore, this was more suitable than traditional applications for solving real-world applications. Thus, the procedures for establishing an INRM [90,91,92,93,94,95] entail the following steps.
Step 1: Obtaining the initial influence matrix. Expert questionnaires can be converted to an initial influence matrix for the influence values of criteria i to j by using the Delphi method. This process uses a scale of 0–4 to represent the factors as follows: complete lack of influence (0), low influence (1), medium influence (2), high influence (3), and extremely high influence (4). The Delphi method enables convergence of experts’ opinion to be obtained. We can then calculate the initial influence matrix in which represents the degree of influence of criterion i on criterion j.
Step 2: Building the normalized direct effect matrixN. Matrix N can be obtained using Equations (1) and (2).
Step 3: Building the total influence matrix T. Matrix T can be obtained from Equation (3), where matrix I is an identity matrix and .
Step 4: Constructing the INRM. In this study, we comprehensively considered the total influence matrix of criteria and the total influence matrix of dimensions , which were obtained from the total influence matrix T. According to Equations (4)–(6), the sum of each row and column for T can be expressed as the vector r (the sum of rows in the total influence matrix T: ) and the vector y (the sum of columns in the total influence matrix T: ). When i = j and the vector indicates the total influence of the criteria i, including influences from and to the other criteria, simultaneously. The vector represents the degree of causality among criteria. If is positive, the criterion i belongs to the cause group, and if is negative, the criterion i belongs to the effect group. The degree of influence and causality provides a reference for making decisions by plotting the INRM [16].
3.2. Obtaining the Influential Weights of Criteria and Dimensions by DANP
ANP was first proposed by Saaty [96] in 1996. It originates from the analytic hierarchy process (AHP) and can be applied to solve nonlinear and complex networks. It deals with dependence and feedback problems on only two levels: dimensions (or clusters) and criteria (inner dimensions/clusters). The diagonal matrix is assumed to be independent (zero matrix ) or self-related (identity matrix I), and the weighted super-matrix is obtained using equal weights (ignoring the influence of different degrees) for the dimensions [90,91,97]. Saaty’s ANP eliminates the limitation of AHP, which assumes that the criteria (inner and outer dimensions and clusters) are all independent [96]. The difference between the two methods is that ANP is applied to the decision-making problems of the interrelationship only in outer dimensions (or clusters), whereas AHP assumes that the relationships between outer and inner dimensions (all the dimensions and criteria) are independent, and there are more comparison matrices in the ANP than in the AHP [98]. The issue of pairwise comparison matrix in MCDM has been studied by many researchers in recent years, and Kou et al. (2016) found the current hot research topics and research techniques in this field [99]. The IWs of DANP are in line with the need to solve practical issues to relax or relieve some unreasonable assumptions in AHP and ANP. Consequently, it may affect the outcome of decision-making if we do not take the influence interrelationship among dimensions and criteria into account. Therefore, in this study, we identified the mutual IWs of DANP among the criteria based on the basic concept of ANP to solve these problems [100,101]. This approach is more suitable for solving real-world applications. The specific processes are as follows:
Step 1: Obtaining the unweighted super-matrix . The total influence matrix is normalized to obtain the normalized matrix . The unweighted super-matrix W can be obtained by transposing the normalized matrix . is shown in Equation (7) and the normalized matrix is shown in Equation (8). The normalization of the first dimension is shown as an example in Equations (9) and (10), and can then be obtained. The normalized matrix is transposed to obtain the unweighted super-matrix W, as shown in Equation (11), where represents the mth dimension and represents the mth criteria in the mth dimension.
![Sustainability 11 00752 i001]()
![Sustainability 11 00752 i002]()
![Sustainability 11 00752 i003]()


Step 2: Determining the normalized super-matrix . The dimensional matrix is shown in Equation (12), which can be normalized to as shown in Equations (13)–(15). The normalized super-matrix can be obtained by multiplying by W as shown in Equation (16).
Step 3: Calculating the IWs of each criterion in the stable matrix. The normalized super-matrix is multiplied several times to obtain the stable matrix , where g represents a positive integer number.
3.3. Analysis of Mobile Health Care Performance and Evaluation of the Gaps by the Modified VIKOR Method
The modified VIKOR method can be used for ranking and selection. It can also be used for performance improvement methods involving multiple alternatives that are influenced by the interaction of various factors [14]. However, the modified VIKOR method does not take decision-makers’ preferences into consideration. This study introduced preference functions to address this problem and established a multi-scheme selection decision model on the basis of the preference information of decision-makers [84,85], and replaced information by influence weight. The processes are as follows:
Step 1: Determining the best value (aspiration level) and the worst value. A questionnaire survey was conducted on the performance of different mobile health care products with scores ranging from 0 (very bad/dissatisfied) to 10 (very good/satisfied) for each criterion to gauge consumers by social response. We can set the best value (aspiration level) as and the worst value as , using aspired–worst as the benchmark to avoid choosing the best among inferior alternatives. Thus, we can not only apply this for ranking and selection but also use it for performance-gap improvement. This method can even be used for a single alternative for performance-gap improvement based on INRM. This new modified VIKOR method is different from the max–min oriented criterion (max: positive ideal point, min: negative ideal point). For the max–min benchmark, the highest score (i.e., max-oriented, positive ideal point) is , and the lowest score (i.e., min-oriented, negative ideal point) is . This approach can only be used for ranking and selection (i.e., it cannot be used for performance-gap improvement), and two alternatives are required. Therefore, our modified VIKOR method is described by the following :
where . For consistency, the influential weight is also used for the IWs derived from the DAN; is called the performance gap ratio and can be written as shown in Equation (18).
Step 2: Calculating the average degree of gap (or regret) when for the ranking and selection of the overall and maximal degree of gap (or regret) and when in each dimension and overall for priority improvements. The performance gap ratios for the measures (as ) and (as ) are expressed as follows:
The compromise solution reveals that the synthesized and integrated gap should be the minimum. Consequently, the gap is ranked, selected, and improved, so that its value is sufficiently close to the aspirational level. In addition, the group utility (called the average gap or average degree of regret) is emphasized when the value of is low (such as ); however, if is infinite, then the individual maximal regrets and gaps gain prominence through prior improvements. In other words, in the basic DANP-modified VIKOR method, the solution is obtained by minimizing the average gap; however, stresses the selection of the kth minimum of the maximal individual regrets and gaps (shown by the maximal gap for the prior improvement). The compromise-based ranking and selection and the DANP-modified VIKOR improvement methods follows Step 2.
Step 3: Calculating the final evaluation value of the alternatives using Equation (21). Equation (21) can be provided the integration performance index value () from each criterion, considering the average performance gap () and the dislike value (“regret value”) of the maximal performance gap (, the smaller the better) of each criterion for individual/each alternative k (existing non-additive situation of integrated value in the real world).
where denotes that how to pursue the improvement toward achieving the best value (aspiration level) as benchmark, the total average performance gap ratio should reach zero, denotes the worst value close to one in a measurement scale from 0–1, and denotes the maximal performance gap for criterion j (i.e., the smaller the better}) when the maximal performance value is close to the aspiration level. The maximal performance gap should also be close to zero, and conversely, the worst value of the maximal performance gap should be close to one (i.e., ). The evaluation coefficient v provides the weighting of the average performance gap strategy and the maximal performance gap strategy for priority improvement among the alternatives . Therefore, Equation (21) can be rewritten as . In this real case, the evaluation coefficient v represents the different decision-making styles and can also be adjusted according to different situations. means to only minimize the average gap, and, for , only the maximal performance gap ratio for priority improvement is considered; in general, .
Step 4: Ranking alternative products. Sort the values of in ascending order; this order may be the order of alternatives for ranking and selection or that of performance gap improvements of all alternatives.
The modified VIKOR method can not only be used for ranking and selecting alternatives but can also be used for performance gap improvement for all alternatives through the bridging of performance gaps by evaluating all criteria. This process is based on a systematically acquired INRM and avoids choosing the best among inferior alternatives. Moreover, this approach can be used to solve daily and single problems (i.e., single problems with no alternatives) through the bridging of performance-gap improvement by considering all perspectives (dimensions) and criteria [90], with the aim of achieving the aspiration level.
4. Empirical Case Study on Mobile Health Care Adoption
This section describes our case study, which used four types of mobile health products to verify the practicality and effectiveness of our model. We calculated the influence degree of the factors and obtained the IWs of the criteria by using the DDANPMV model and determined the key factors that influence consumers’ adoption of these products. Finally, we identified gaps among the products to help consumers to make decisions and providers to implement the optimal strategies and realize how to improve the performance of their products.
4.1. Problem Description
The mobile health care industry has good development prospects with respect to both mobile devices and market needs. Mobile health services provide substantial social and economic benefits through their facilitating convenient and efficient regulation of hospital resource allocation. However, mobile health care has not yet permeated people’s daily lives in the Internet of Things (IoT) era. Considerable scope remains for consumers to accept and adopt mobile health care. Thus, in this study, we selected four mobile health care products: P1 is developed by a sensor company, P2 is a smart pill with an embedded chip developed by a start-up company, P3 is a smart health scanner launched by a health care product company, and P4 is a mobile electrocardiogram equipment developed by a biotechnology company. These popular IoT products were examined as a case study.
4.2. Collection of Data
The initial influence matrix and degree of influence were obtained from a questionnaire conducted on experts who have practical experience in the fields of IoT and mobile health care. We collected their opinions of the evaluation criteria consisting of the three dimensions (eight criteria) on sustainable development of mobile health care. There are two steps in this period. At first, we listed a set of influencing factors according to experts’ views, and selected several of them as the most important influencing factors based on the importance scale of triangular fuzzy numbers, the average score was 8 points or higher in the range of 0–10 points. In this step, we formed an importance scale (evaluation index system of the adoption of mobile health care) in Table 1. For the second step, we invited eight experts to assign scores for the influence relationship for each pair of factors, namely no impact (0), low impact (1), medium impact (2), high impact (3), and very high impact (4). The experts should assign scores for the influence relationship by comparing one to another. For example, if an expert thinks that criteria A has no impact on criteria B, the number “0 (no impact)” should be entered. The degree of direct influence each perspective (dimension) and criterion (factors) has on every other perspective and criterion were assessed by experts, respectively. Then, we recycled and provided the feedback on the results to experts for modification. After two rounds of feedback modification, the results were basically consistent. Lastly, we calculate the average values of these indexes and formed an influencing factor scale which obtained a consistent opinion of experts. The consensus ratio reached a 95.19% confidence level (>95%). The initial influence matrix is shown in Table 2.
4.3. Results and Analysis
4.3.1. Building an INRM Using the DEMATEL Technique
The total influence matrix T of the criteria reveals interactions among all factors (Table 3). The total influence matrix of dimensions indicates the relationships between the three dimensions based on the consensus of the experts (Table 4). The value indicates the total influence of the criteria i both from and to the other criteria. The environmental dimension (D3) has the highest total degree of influence and is thus considered the most important influential dimension. By contrast, the technological dimension (D1) relates least to other criteria. The values indicate that the technological dimension (D1) influences other criteria the most and the environmental dimension (D3) is most easily influenced by other criteria. The sum of influences given or received for criteria reveals the degree of influence among criteria (Table 5). Social factors (C31) is considered the most important criterion by experts based on the total degree of influence . Quality of technological service (C13) influences other criteria the most and product image (C32) is the most easily influenced by other criteria based on the value. By combining the parameter values r and y, the influential network relationship maps were constructed for both the dimension and criterion levels (Figure 3).
Figure 3 shows the influential relationships between the three dimensions and the criteria. The environmental dimension (D3) is influenced by the technological dimension (D1) and the subjective dimension (D2). Hence, the influence hierarchy can be ordered as the technological dimension (D1), subjective dimension (D2), and environmental dimension (D3). Thus, the improvement of mobile health care technology can most effectively prompt consumers to adopt mobile health care products. Mobile health care providers should prioritize improving the technological level of mobile health care because this directly relates to consumers’ subjective feeling and external environment influence. In the technological dimension (D1), the quality of technological service (C13) influences the ease of use (C12) and usefulness (C11), and the ease of use (C12) influences usefulness (C11). Thus, it is more important for mobile health products to possess the characteristic of high quality of technological service to meet the needs and demands of consumers, thereby affecting the degree of usefulness and ease of use. Mobile health care providers should prioritize developing the quality of technological service. In the subjective dimension (D2), compatibility (C21) influences customers’ perceived value (C23) and trust (C22), and perceived value (C23) influences trust (C22). Therefore, in the aspect of consumers’ subjective perception, the degree of matching between mobile health products and consumers’ previous experience and values directly affects consumers’ perceived value and trust in mobile health. This requires precise market segmentation according to consumer characteristics and psychology to position specific products. In the environmental dimension (D3), social factors (C31) directly influences product image (C32). As public group members, consumers readily trust people around them when making uncertain decisions.
4.3.2. Obtaining the Influence Weights of the DANP
The influence weight of each criterion can be obtained by applying the DANP method, as shown in Equation (12). The unweighted super-matrix W can be obtained by transposing the normalized matrix , as shown in Table 6.
4.3.3. Evaluating the Adoption of Mobile Health Care Using the Modified VIKOR Method
In accordance with the DANP method, we selected four mobile health care products for our case study to obtain the IWs of the factors and evaluate consumers’ adoption decisions regarding different mobile health care products.
The four mobile health care products, P1, P2, P3, and P4, have distinct characteristics. P1 was developed by a sensor company. A flexible microchip is placed on users’ skin to monitor body temperature, heart rate, and other vital signs when users are sleeping. The vital sign data is sent to the users’ smartphone by using Bluetooth technology. P2 is a smart pill with an embedded chip developed by a start-up company. When the pill enters the stomach, it can monitor users’ physical condition and transmit data to a smartphone together with an inductor patch outside the body. P3 is a smart health scanner developed by a health care products company. The product is placed on a user’s forehead for a few seconds. Information is then sent to a smartphone app, which provides effective references based on algorithmic analysis of vital signs and parameters. P4 is a mobile electrocardiogram device developed by a biotechnology company and is used for monitoring heart rate and other vital signs. Its accuracy has been demonstrated to be superior to Holt’s dynamic electrocardiogram device. It is a safe, waterproof electrical device that can be worn on the chest for approximately 2 weeks and has been certified by the US Food and Drug Administration.
Based on considerations of the four mobile health care products’ performance and evaluation, we graded them and produced a comprehensive evaluation. All indexes were performance-based (i.e., higher scores indicate stronger performance). Questionnaire surveys were used to obtain the performance scores of mobile health care products , from 0 (very bad/dissatisfaction) to 10 (very good/satisfaction), for each criterion from consumers by social response. We set the aspired value as 10 (i.e., ) and the worst value as 0 (i.e., ). The gap ratio (i.e., according to the normalization scale, with aspired-worst as the benchmark) is ; and the max value of the gap ratios is Qk, while . In addition, Sk is ratios of the average gap from aspired value () to performance value fkj in criterion j of alternative k. Among them, . Thereby the modified VIKOR can replace the traditional VIKOR approach. The positive ideal solution was , the negative ideal solution was , the performance gap ratio was , and . The results are shown in Table 9.
5. Discussion and Implications
Figure 3 presents the causal relationships between the dimensions and criteria for the promotion of mobile health care, as determined by INRM. The degree of the dimension effect indicated that improvements should be made in the following order: technological dimension (D1), subjective dimension (D2), and environmental dimension (D3). The results indicated that the technological dimension has the greatest immediate network effect on the other dimensions and can help resolve multiple problems simultaneously. The findings imply that mobile health care technology should be developed further by mobile health care service providers. This is because it directly relates to consumers’ subjective feelings and external environment influences. Moreover, the quality and efficiency of mobile health products are effective enhancing factors. The improvement of technology can ensure that the services obtained through mobile medical treatment are of high quality, and it makes sense to reduce medical costs and promote equity.
Some criteria in each dimension, such as quality of technological service (C13), compatibility (C21), and social factors (C31), demonstrated the same network effect. These are the major influential factors within each dimension, implying their priority for improvements. Moreover, they provide a higher-level model for the improvement of mobile health care products. In terms of the results for technological dimension (D1), consumers were more concerned with the quality of technological service, indicating that to consistently satisfy the requirements of consumers, mobile health providers should strengthen the supervision and management of technology before it is released onto the market. Relevant aspects include technical development, installation, commissioning, personnel training, and system acceptance. For the subjective dimension (D2), enhancing the compatibility of mobile health care products is evidently important for consumers’ decision-making. The findings for the environmental dimension (D3) indicate that social factors affect consumers’ adoption of mobile health products. Consumers hoped that usage behavior involving mobile health care products can be recognized by people in their social environment.
The performance gap results revealed by the traditional VIKOR method were calculated for comparison. The data in Table 9 shows a major shortcoming of the traditional VIKOR method: there must be at least two alternatives to rank the numerical size of each criterion. There is at least one performance gap ratio scoring 0, representing no need for improvement, and at least one with a score of 1, representing the maximum gap. However, the alternative, with a score of 0 may also have a gap with respect to the best performance. The alternative, with a score of 1, could not show how much improvement is required. In the modified VIKOR method, only one product is allowed for the improvement strategy and normally there are no scores of 0 and 1 in the gap ratio. Compared with the results for the traditional VIKOR method in Table 9, the results in Table 10 indicated that the modified VIKOR method is superior. In the traditional VIKOR method, the maximal performance score for each criterion for the four alternatives is set as a reference point or benchmark representing the relative best score, thereby comparing the four alternatives. Similarly, the minimal performance score for each criterion represents a relative worst score among the four alternatives. However, the score differs for each criterion of max–min value. Thus, the calculated relative gap ratios can be used only for ranking and selection of alternatives in one criterion, and the comparison of gap ratios among eight criteria could be meaningless because of the different reference points or benchmarks. In the modified VIKOR method (Table 10), all gap ratios are calculated using Equation 18 with the same reference point or benchmark setting of 10 for the aspired level and 0 for the worst level. Thus, this method can be used not only for ranking and selection but also for performance gap improvement. The modified VIKOR method uses aspired–worst to limit the large performance gaps for each criterion. This was combined with the INRM and possible systematic improvements were mapped out to avoid choosing the best among inferior alternatives.
According to the gap ratio and ranking results in Table 10, the four products were evaluated as follows to provide product improvement guidance.
The gaps between P1 and the aspiration level were 0.226, 0.254, and 0.281. The chip in P1 must touch the user’s skin to obtain vital signs when the user is sleeping. This leads to poorer performance for quality of technological service (C13) compared with the other products, with a gap ratio of 0.300. Consumers always prefer more secure ways to obtain medical diagnoses. There are also substantial gaps in consumers’ compatibility (C21), trust (C22), and social factors (C31) compared with the aspiration level, which hinders P1 from obtaining public popularity. However, for usefulness (C11), ease of use (C12), perceived value (C23), and product image (C32), the gaps were almost all under 0.200, which shows that the performance of P1 is good for product use and satisfaction. By combining INRM with gap ratios indicated that the technological dimension (D1) is the most influential and that quality of technological service (C13) also acts as a resource for D1. The weakness in quality of technological service (C13) must be improved first, followed by compatibility (C21), trust (C22), and social factors (C31). P1 can be regarded as a cost-effective and user-friendly mobile health product. However, the method for obtaining users’ vital signs should be made more user-friendly.
P2 exhibits the greatest deviation from the aspiration level, with a total average performance gap ratio of 0.227 (the highest gap) in different decision-making styles. P2 performs similarly to P1, except that it has a high gap (0.250) for ease of use (C12) rather than quality of technological service (C13) in D1. There was an absolute gap for ease of use (C12), compatibility (C21), trust (C22), and social factors (C31) compared with aspiration levels. Nevertheless, P2 has an obvious advantage with respect to usefulness (C11), quality of technological service (C13), perceived value (C23), and product image (C32). Hence, the most effective improvement strategies should first improve the ease of use (C12) of P2 as it will strongly influence compatibility (C21), trust (C22), and social factors (C31).
Among the four products, P3 exhibited above average performance and possessed low gaps of 0.162, 0.196, and 0.228 for the different decision-making styles and a low gap of 0.142 for total average performance. Compared with other products, its main distinguishing feature lies in having the lowest gap for perceived value (C23; 0.25), which may cause poor performance–price ratio and product utility from a consumer perspective. Price might be considered a critical factor to be strictly controlled, and consumer satisfaction should be a primary goal of price strategy. However, there are no obvious gaps in the technological dimension (D1), environmental dimension (D3), compatibility (C21), and trust (C22). In general, P3 is a high-end product trusted by consumers. To excel in their field, the providers of P3 should maintain the product’s technological advantages and help users maximize the product’s benefits by improving the performance–price ratio and utility through technical innovation.
P4 has the best performance of the four products, with a lowest total average performance score of 0.141. It ranked first whether the aim was to minimize the average gap ( = 0.146) or select the maximum gap for priority improvement ( = 0.186). The gaps for ease of use (C12) and perceived value (C23) were more prominent than those of other criteria. This may be because users must wear P4 constantly to monitor vital signs synchronously, which directly decreases users’ comfort and satisfaction, thus decreasing perceived ease of use (C12) and perceived value (C23). However, P4 achieves a nearly ideal performance level in the other criteria. For promotion, the providers of P4 should improve ease of use (C12) to affect consumers’ perceived value (C23) based on the advantages of other criteria. The details of the dimensions and the criteria for their improvement priorities regarding consumers’ adoption of the mobile health care assessment framework are shown in Table 11.
6. Conclusions
Mobile health care which provides effective solutions is convenient and cheap, and can promote the rational allocation and sustainable development of medical resources. However, considerable scope remains for improvement in the adoption of mobile health care. This study examined the influential factors for customers’ adoption of mobile health, and we constructed an INRM to identify cause–effect relationships. A modified VIKOR method for calculating the performance gaps for product improvement was established. In summary, the conclusions and innovations of this study are as follows:
(1) An evaluation index system, including three dimensions and eight criteria, was constructed for influential factors in consumers’ adoption of mobile health care. Numerous domestic and foreign studies on consumers’ adoption of mobile health care have focused on the analysis of one or several factors, but failed to construct a systematic scientific evaluation index system. In this study, we analyzed the characteristics of mobile health care and developed the work of other studies through a literature review, investigation of previous theories, discussion, and summary.
(2) The relationships between dimensions and criteria were represented graphically through INRM. On the basis of this representation, we concluded that the technological dimension (D1) directly influences the subjective dimension (D2) and environmental dimension (D3), and the subjective dimension (D2) in turn influences the environmental dimension (D3). Providers can improve their products more flexibly and accurately on the basis of the identification of cause–effect relationships between the dimensions and criteria and the actual situation of their own products.
(3) We empirically verified the VIKOR method by identifying the performance gaps of four mobile health products and thus ranking the products, thereby assisting in continuous improvement and product development. The study compared the traditional VIKOR method and the modified VIKOR method to illustrate the effectiveness of the modified version. Modified VIKOR aids product comparison within a specific criterion. Moreover, the comparison of the criteria was meaningful because of a unified reference point or benchmark. This paper can thereby provide guidance for decision-makers developing product improvement strategies and for consumers ranking and selecting alternatives to solve real-world problems more effectively. This conforms more closely to real-world concepts because it assigns factors to represent the best value rather than choosing the best among inferior alternatives.
This study has limitations that should be addressed in future research. The initial data were obtained from a limited number of experts in the field of IoT and mobile health care. Although adjusted, different opinions were obtained in the collection of the data of the initial influence matrix because of differences in professional perspectives. Further studies can expand their sources and scope to obtain initial data and thereby increase the accuracy of their final results. With the further development of the mobile health care industry, further studies should expand the range of investigation and explore the causes of differences in-depth, thereby more accurately grasping the relationships between the criteria.
Author Contributions
G.-H.T. designed the research; Y.L. (Yupeng Liu) provided the research idea and designed the assessment framework; Y.Y. analyzed the data and drafted the manuscript; Y.L. (Yue Liu) collected the data; Finally, G.-H.T. revised the paper. All authors have read and approved the final manuscript.
Funding
The 13th Five—Year Plan of Education Science in Shandong Province: Research on competency assessment and ability improvement path for teachers of innovation and entrepreneurship (BYG12017017).
Acknowledgments
We are grateful for the valuable suggestions and revisions of the English language from Yujia Zhai.
Conflicts of Interest
No potential conflicts of interest are declared.
References
- Royston, G.; Hagar, C.; Long, L.; McMahon, D.; Pakenham-Walsh, N.; Wadhwani, N. Mobile health-care information for all: A global challenge. Lancet Glob. Health 2015, 3, 356–357. [Google Scholar] [CrossRef]
- Gupta, S.; Clements, B.; Coady, D.; Wang, Y. Challenges Faced by Health Care Reform. J. Financ. Dev. Res. 2015, 3, 42–45. (In Chinese) [Google Scholar] [CrossRef]
- Sliva, B.M.C.; Rodrigues, J.J.P.C. Mobile-health: A review of current state in 2015. J. Biomed. Inform. 2015, 56, 265–272. [Google Scholar] [CrossRef] [PubMed] [Green Version]
- Wang, X.; Zheng, A. Ideas about the Protection of High-quality Medical Resources in Rural Areas. Chin. Health Econ. 2012, 31, 54–55. (In Chinese) [Google Scholar]
- China Internet Network Information Center (CNNIC). 41th Statistical Survey Report on the Internet Development in China. 2018. Available online: http://www.cnnic.net.cn/hlwfzyj/hlwxzbg/hlwtjbg/201803/P020180305409870339136.pdf (accessed on 15 November 2018).
- Dwivedi, Y.K.; Shareel, M.A.; Simintiras, A.C.; Lal, B.; Weerakkody, V. A generalised adoption model for services: A cross-country comparison of mobile health (m-health). Gov. Inf. Q. 2016, 33, 174–187. [Google Scholar] [CrossRef] [Green Version]
- IQVIA Institute for Human Data Science Study. Impact of Digital Health Grows as Innovation, Evidence and Adoption of Mobile Health Apps Accelerate. Available online: https://www.iqvia.com/en/newsroom/2017/11/impact-of-digital-health-grows-as-innovation-evidence-and-adoption-of-mobile-health-apps-accelerate (accessed on 7 November 2017).
- Guo, X.; Zhang, X.; Sun, Y. The privacy–personalization paradox in mHealth services acceptance of different age groups. Electron. Commerce Res. Appl. 2016, 16, 55–65. [Google Scholar] [CrossRef]
- Nierengarten, M.B. Repeal of SGR: US payment reform for Medicare reimbursement. Lancet Oncol. 2015, 16, 613. [Google Scholar] [CrossRef]
- Sung, W.T.; Chang, K.Y. Evidence -based multi-sensor information fusion for remote health care systems. Sens. Actuators A Phys. 2013, 204, 1–19. [Google Scholar] [CrossRef]
- Barata, D.; Louzada, G.; Carreiro, A.; Damasceno, A. System of Acquisition, Transmission, Storage and Visualization of Pulse Oximeter and ECG Data Using Android and MQTT. Procedia Technol. 2013, 9, 1265–1272. [Google Scholar] [CrossRef]
- Hamine, S.; Guyette, E.G.; Faulx, D.; Green, B.B.; Ginsburg, A.S. Impact of mHealth Chronic Disease Management on Treatment Adherence and Patient Outcomes: A Systematic Review. J. Med. Internet Res. 2015, 17, 52. [Google Scholar] [CrossRef]
- Hsu, C.H.; Wang, F.K.; Tzeng, G.H. The best vendor selection for conducting the recycled material based on a hybrid MCDM model combining DANP with VIKOR. Resour. Conserv. Recycl. 2012, 66, 95–111. [Google Scholar] [CrossRef]
- Opricovic, S.; Tzeng, G.H. Compromise solution by MCDM methods: A comparative analysis of VIKOR and TOPSIS. Eur. J. Oper. Res. 2004, 156, 445–455. [Google Scholar] [CrossRef]
- Opricovic, S.; Tzeng, G.H. Extended VIKOR method in comparison with outranking methods. Eur. J. Oper. Res. 2007, 178, 514–529. [Google Scholar] [CrossRef]
- Lu, M.T.; Tzeng, G.H.; Cheng, H.; Hsu, C.C. Exploring mobile banking services for user behavior in intention adoption: Using new hybrid MADM model. Serv. Bus. 2015, 9, 541–565. [Google Scholar] [CrossRef]
- Lu, M.T.; Lin, S.W.; Tzeng, G.H. Improving RFID adoption in Taiwan’s healthcare industry based on a DEMATEL technique with a hybrid MCDM model. Decis. Support Syst. 2013, 56, 259–269. [Google Scholar] [CrossRef]
- Hsu, W.C.J.; Tsai, M.H.; Tzeng, G.H. Exploring the best strategy plan for improving the digital convergence by using a hybrid MADM model. Technol. Econ. Dev. Econ. 2018, 24, 164–198. [Google Scholar] [CrossRef]
- Zhu, B.W.; Zhang, J.R.; Tzeng, G.H.; Huang, S.L.; Xiong, L. Public open space development for elderly people by using the DANP-V model to establish improvement strategies towards a sustainable healthy aging society. Sustainability 2017, 9, 420. [Google Scholar] [CrossRef]
- Nkosi, M.T.; Mekuria, F. Cloud Computing for Enhanced Mobile Health Applications. In Proceedings of the IEEE Second International Conference on Cloud Computing Technology and Science, Indianapolis, IN, USA, 30 November–3 December 2010; pp. 629–633. [Google Scholar]
- Talaei-Khoei, A.; Ray, P.; Parameswaran, N. An Awareness Framework for Agent-Based Mobile Health Monitoring. In Proceedings of the Third International Conference on Next Generation Mobile Applications, Services and Technologies, Cardiff, UK, 15–18 September 2009; pp. 108–113. [Google Scholar]
- Fernández, G.; de la Torre-Diez, I.; Rodrigues, J.J.P.C. Analysis of the Cloud Computing Paradigm on Mobile Health Records Systems. In Proceedings of the Sixth International Conference on Innovative Mobile and Internet Services in Ubiquitous Computing, Palermo, Italy, 4–6 July 2012; pp. 927–932. [Google Scholar]
- Ray, S.; Biswas, G.P. Design of an Efficient Mobile Health System for Achieving HIPAA Privacy-Security Regulations. Int. J. Wirel. Mob. Comput. 2014, 7, 378–387. [Google Scholar] [CrossRef]
- Maguire, R.; Mccann, L.; Miller, M.; Kearney, N. Nurse’s perceptions and experiences of using of a mobile-phone-based Advanced Symptom Management System (ASyMS©) to monitor and manage chemotherapy-related toxicity. Eur. J. Cancer Care 2008, 12, 380–386. [Google Scholar] [CrossRef]
- Jena, A.B.; Philipson, T.J. Endogenous cost-effectiveness analysis and health care technology adoption. J. Health Econ. 2013, 14, A363–A364. [Google Scholar] [CrossRef]
- Nielsen, J.A.; Mengiste, S.A. Analysing the diffusion and adoption of mobile IT across social worlds. Health Inform. J. 2014, 20, 87–103. [Google Scholar] [CrossRef] [PubMed]
- United Nations Foundation, Vodafone Foundation. mHealth for Development: The Opportunity of Mobile Technology for Healthcare in the Developing World. 2009. Available online: https://reliefweb.int/sites/reliefweb.int/files/resources/A695C439809709CF49257689001019B9-UNF_Feb2009.pdf (accessed on 12 September 2018).
- Fife, E.; Pereira, F. Digital home health and mHealth: Prospects and challenges for adoption in the U.S. In Proceedings of the 2011 50th FITCE Congress—“ICT: Bridging an Ever Shifting Digital Divide”, Palermo, Italy, 31 August–3 September 2011; pp. 1–11. [Google Scholar]
- Chaiyachati, K.H.; Loveday, M.; Lorenz, S.; Lesh, N.; Larkan, L.M.; Cinti, S.; Haberer, G.H.F.J.E. A Pilot Study of an mHealth Application for Healthcare Workers: Poor Uptake Despite High Reported Acceptability at a Rural South African Community-Based MDR-TB Treatment Program. PLoS ONE 2013, 8, e64662. [Google Scholar] [CrossRef] [PubMed] [Green Version]
- Maddalena, F.; Nicola, D.; Schulz, P.J. Mapping mHealth Research: A Decade of Evolution. J. Med. Internet Res. 2013, 15, 259. [Google Scholar]
- Brian, R.M.; Ben-Zeev, D. Mobile health (mHealth) for mental health in Asia: Objectives, strategies, and limitation. Asian J. Psychiatry 2014, 10, 96–100. [Google Scholar] [CrossRef]
- Khatun, F.; Heywood, A.E.; Ray, P.K.; Hanifi, S.M.A.; Bhuiya, A.; Liaw, S.T. Determinants of readiness to adopt mHealth in a rural community of Bangladesh. Int. J. Med. Inform. 2015, 84, 847–856. [Google Scholar] [CrossRef] [PubMed]
- Medhanyie, A.A.; Little, A.; Yebyo, H.; Spigt, M.; Tadesse, K.; Blanco, R.; Dinant, G.J. Health workers’ experiences, barriers, preferences and motivating factors in using mHealth forms in Ethiopia. Hum. Resour. Health 2015, 13, 1–10. [Google Scholar] [CrossRef]
- Cocosila, M.; Archer, N. Adoption of mobile ICT for health promotion: An empirical investigation. Electron. Mark. 2010, 20, 241–250. [Google Scholar] [CrossRef]
- Akter, S.; D’Ambra, J.; Ray, J. Trustworthiness in mHealth information services: An assessment of a hierarchical model with mediating and moderating effects using partial least squares (PLS). J. Am. Soc. Inf. Sci. Technol. 2011, 62, 100–116. [Google Scholar] [CrossRef]
- Akter, S.; Ray, P.; D’Ambra, J. Continuance of Mhealth Services at the Bottom of the Pyramid: The Roles of Service Quality and Trust. Electron. Mark. 2013, 23, 29–47. [Google Scholar] [CrossRef]
- Hung, M.C.; Jen, W.Y. The Adoption of Mobile Health Management Services: An Empirical Study. J. Med Syst. 2012, 36, 1381–1388. [Google Scholar] [CrossRef]
- Michel-Verkerke, M.B.; Hoogeboom, M. Evaluation of the USE IT-questionnaire for the Evaluation of the Adoption of Electronic Patient Records by Healthcare Professionals. Methods Inf. Med. 2013, 52, 189–198. [Google Scholar] [PubMed] [Green Version]
- Jia, K.; Li, H.; Yuan, Y. Application of Data Mining in Mobile Health System Based on Apriori Algorithm. J. Beijing Univ. Technol. 2017, 43, 394–401. (In Chinese) [Google Scholar]
- Xu, B.; Xu, L.; Cai, H.; Jiang, L. Architecture of M-Health Monitoring System Based on Cloud Computing for Elderly Homes Application. In Proceedings of the 2014 Enterprise Systems Conference, Shanghai, China, 2–3 August 2014. [Google Scholar]
- Tao, J.; Qiao, Y.; Yan, W. The Implication and Prospective of Mobile Health in China. Chin. Health Serv. Manag. 2015, 2, 88–90. (In Chinese) [Google Scholar]
- Wu, I.L.; Li, J.Y.; Fu, C.Y. The adoption of mobile healthcare by hospital’s professionals: An integrative perspective. Decis. Support Syst. 2011, 51, 587–596. [Google Scholar] [CrossRef]
- Yang, H.Y.; Wang, M.J. What factors affect physicians’ decisions to use an e-health care system? Health 2012, 4, 1023–1028. [Google Scholar]
- Tajfel, H.; Billig, M.G.; Bundy, R.P.; Flament, C. Social categorization and intergroup behaviour. Eur. J. Soc. Psychol. 2010, 1, 149–178. [Google Scholar] [CrossRef]
- Mathieson, K.; Peacock, E.; Chin, W.W. Extending the technology acceptance model: The influence of perceived user resources. ACM SIGMIS Database 2001, 32, 86–112. [Google Scholar] [CrossRef]
- Hu, K.H.; Chen, F.H.; Tzeng, G.H.; Lee, J.D. Improving corporate governance effects on an enterprise crisis based on a new hybrid DEMATEL with the MADM model. J. Test. Eval. 2014, 43, 1395–1412. [Google Scholar] [CrossRef]
- Chen, F.H.; Tzeng, G.H.; Chang, C.C. Evaluating the enhancement of corporate social responsibility websites quality based on a new hybrid MADM model. Int. J. Inf. Technol. Decis. Mak. 2015, 14, 697–724. [Google Scholar] [CrossRef]
- Lin, C.L.; Shih, Y.H.; Tzeng, G.H.; Yu, H.C. A service selection model for digital music service platforms using a hybrid MCDM approach. Appl. Soft Comput. 2016, 48, 385–403. [Google Scholar] [CrossRef]
- Su, C.H.; Tzeng, G.H.; Hu, S.K. Cloud e-learning service strategies for improving e-learning innovation performance in a fuzzy environment by using a new hybrid fuzzy multiple attribute decision-making model. Interact. Learn. Environ. 2016, 24, 1812–1835. [Google Scholar] [CrossRef]
- Kou, G.; Peng, Y.; Wang, G. Evaluation of clustering algorithms for financial risk analysis using MCDM methods. Inf. Sci. 2014, 275, 1–12. [Google Scholar] [CrossRef]
- Hu, K.H.; Chen, F.H.; Tzeng, G.H. Evaluating the improvement of sustainability of sports industry policy based on MADM. Sustainability 2016, 8, 606. [Google Scholar] [CrossRef]
- Huang, K.W.; Huang, J.H.; Tzeng, G.H. New hybrid multiple attribute decision-making model for improving competence sets: Enhancing a company’s core competitiveness. Sustainability 2016, 8, 175. [Google Scholar] [CrossRef]
- Shen, K.Y.; Tzeng, G.H. A new approach and insightful financial diagnoses for the IT industry based on a hybrid MADM model. Knowl. Based Syst. 2015, 85, 112–130. [Google Scholar] [CrossRef]
- Hu, S.; Lu, M.T.; Tzeng, G.H. Improving mobile commerce adoption using a new hybrid fuzzy MADM model. Int. J. Fuzzy Syst. 2015, 17, 399–413. [Google Scholar] [CrossRef]
- Duan, Y.; Jia, D.; Jia, Y. Joint demand and capacity optimization in a service system. In Proceedings of the IEEE Conference Anthology, China, 1–8 January 2013. [Google Scholar]
- Chabanuk, A.J. Improving care through effectiveness, efficiency, equity, patient centeredness, safety, and timeliness with a diabetes update. Home Healthc. Nurse 2012, 30, 204. [Google Scholar]
- Marianppan, P.M.; Raghavan, D.R. Effects of electromagnetic interference on the functional usage of medical equipment by 2G/3G/4G cellular phones: A review. J. Adv. Res. 2016, 7, 727–738. [Google Scholar] [CrossRef] [Green Version]
- Davis, F.D. Perceived Usefulness, Perceived Ease of Use, and User Acceptance of Information Technology. Mis Q. 1989, 13, 319–339. [Google Scholar] [CrossRef]
- Liu, Y.; Li, H.X.; Kostakos, V.; Goncalves, J.; Hosio, S.; Hu, F. An empirical investigation of mobile government adoption in rural China: A case study in Zhejiang province. Gov. Inf. Q. 2014, 31, 432–442. [Google Scholar] [CrossRef]
- Mohamed AH, H.M.; Tawfik, H.; Al-Jumeily, D.; Norton, L. MoHTAM: A Technology Acceptance Model for Mobile Health Applications. In Proceedings of the Developments in E-Systems Engineering, Dubai, UAE, 6–8 December 2012; pp. 13–18. [Google Scholar]
- Hsieh, P.J. An empirical investigation of patients’ acceptance and resistance toward the health cloud: The dual factor perspective. Comput. Hum. Behav. 2016, 63, 959–969. [Google Scholar] [CrossRef]
- Campbell, J.I.; Aturinda, I.; Mwesigwa, E.; Burns, B.; Santorino, D.; Haberer, J.E.; Bangsberg, D.R.; Holden, R.J.; Ware, N.C.; Siedner, M.J. The Technology Acceptance Model for Resource-Limited Settings (TAM-RLS): A Novel Framework for Mobile Health Interventions Targeted to Low-Literacy End-Users in Resource-Limited Settings. Aids Behav. 2017, 21, 3129–3140. [Google Scholar] [CrossRef] [PubMed]
- Wilson, E.V.; Lankton, N.K. Modeling Patients’ Acceptance of Provider-Delivered E-Health. J. Am. Med Inform. Assoc. 2004, 11, 241–248. [Google Scholar] [CrossRef]
- Liu, Y.; Yang, Y. Empirical Examination of Users’ Adoption of the Sharing Economy in China Using an Expanded Technology Acceptance Model. Sustainability 2018, 10, 1262. [Google Scholar] [CrossRef]
- Rogers, E. Diffusion of Innovation; Free Press: New York, NY, USA, 1995. [Google Scholar]
- Lin, H.F. Predicting consumer intentions to shop online: An empirical test of competing theories. Electron. Commer. Res. Appl. 2007, 6, 433–442. [Google Scholar] [CrossRef]
- Malhotra, N.K.; Kim, S.S.; Agarwal, J. Internet privacy and security: An examination of online retailer disclosures. J. Public Policy Mark. 2000, 19, 54–61. [Google Scholar]
- Li, H.; Li, F.H.; Cao, J. Survey on security and privacy preserving for mobile internet service. J. Commun. 2014, 35, 1–11. [Google Scholar]
- Boukerche, A.; Ren, Y. A secure mobile healthcare system using trust-based multicast scheme. IEEE J. Sel. Areas Commun. 2009, 27, 387–399. [Google Scholar]
- Gimun, K.; Shin, B.S.; Lee, H.G. Understanding dynamics between initial trust and usage intentions of mobile banking. Inf. Syst. J. 2009, 19, 283–311. [Google Scholar]
- Zeithaml, V.A. Consumer perceptions of price, quality, and value: A means-end model and synthesis of evidence. J. Mark. 1988, 52, 2–22. [Google Scholar] [CrossRef]
- Moore, G.C.; Benbasat, I. Development of an instrument to measure the perceptions of adopting an information technology innovation. Inf. Syst. Res. 1991, 2, 192–222. [Google Scholar] [CrossRef]
- Bernabe, M.; Lisbona, A.; Palaci, F.J.; Maite, M.A. Social identity and engagement: An exploratory study at university. Revista de Psicología del Trabajo y de las Organizaciones 2016, 32, 103–107. [Google Scholar] [CrossRef] [Green Version]
- Lu, J.; Liu, C.; Yu, C.S.; Wang, K. Determinants of accepting wireless mobile data services in China. Inf. Manag. 2008, 45, 52–64. [Google Scholar] [CrossRef]
- Fu, J.R.; Farn, C.K.; Chao, W.P. Acceptance of electronic tax filing: A study of taxpayer intentions. Inf. Manag. 2006, 43, 109–126. [Google Scholar] [CrossRef]
- Al-Gahtani, S.S.; Hubona, G.S.; Wang, J. Information technology (IT) in Saudi Arabia: Culture and the acceptance and use of IT. Inf. Manag. 2007, 44, 681–691. [Google Scholar] [CrossRef]
- King, W.R.; He, J. A meta-analysis of the technology acceptance model. Inf. Manag. 2006, 43, 740–755. [Google Scholar] [CrossRef]
- Zhang, X.; Guo, X.; Lai, K.H.; Guo, F.; Li, C. Understanding Gender Differences in m-Health Adoption: A Modified Theory of Reasoned Action Model. Telemed. E-Health 2014, 20, 39–46. [Google Scholar] [CrossRef] [PubMed]
- Kumar, A.; Sah, B.; Singh, A.R.; Deng, Y. A review of multi criteria decision making (MCDM) towards sustainable renewable energy development. Renew. Sustain. Energy Rev. 2017, 69, 596–609. [Google Scholar] [CrossRef]
- Li, G.; Kou, G.; Peng, Y. A Group Decision Making Model for Integrating Heterogeneous Information. IEEE Trans. Systems Man Cybern. Syst. 2018, 48, 982–992. [Google Scholar] [CrossRef]
- Yazdani, M.; Chatterjee, P.; Zavadskas, E.K.; Zolfani, S.H. Integrated QFD-MCDM framework for green supplier selection. J. Clean. Prod. 2016, 142, 3728–3740. [Google Scholar] [CrossRef]
- Wang, P.; Zhu, Z.; Wang, Y. A novel hybrid MCDM model combining the SAW, TOPSIS and GRA methods based on experimental design. Inf. Sci. 2016, 345, 27–45. [Google Scholar] [CrossRef]
- Mousavi-Nasab, S.H.; Sotoudeh-Anvari, A. A comprehensive MCDM-based approach using TOPSIS, COPRAS and DEA as an auxiliary tool for material selection problems. Mater. Des. 2017, 121, 237–253. [Google Scholar] [CrossRef]
- Tzeng, G.H.; Huang, J.J. Multiple Attribute Decision Making: Methods and Applications; CRC Press/Taylor & Francis Group: Boca Raton, FL, USA, 2011; 349p. [Google Scholar]
- Tzeng, G.H.; Kao, K.Y. New Concepts and Trend of Hybrid Multiple Criteria Decision Making; CRC Press/Taylor & Francis Group: Boca Raton, FL, USA, 2017. [Google Scholar]
- Zavadskas, E.K.; Govindan, K.; Antucheviciene, J.; Turskis, Z. Hybrid multiple criteria decision-making methods: A review of applications for sustainability issues. Econ. Res. 2016, 29, 857–887. [Google Scholar] [CrossRef]
- Hu, S.H.; Lu, M.T.; Tzeng, G.H. Exploring smart phone improvements based on a hybrid MCDM model. Experts Syst. Appl. 2014, 41, 4401–4413. [Google Scholar] [CrossRef]
- Tzeng, G.H.; Cheng, H.J.; Huang, T.D. Multi-objective optimal planning for designing relief delivery systems. Transp. Res. Part E Logist. Transp. Rev. 2007, 43, 673–686. [Google Scholar] [CrossRef]
- Tzeng, G.H.; Chiang, C.H.; Li, C.W. Evaluating intertwined effects in e-learning programs: A novel hybrid MCDM model based on factor analysis and DEMATEL. Expert Syst. Appl. 2007, 32, 1028–1044. [Google Scholar] [CrossRef]
- Yang, Y.P.O.; Shieh, H.M.; Tzeng, G.H. A VIKOR-based multiple criteria decision method for improving information security risk. Int. J. Inf. Technol. Decis. Mak. 2009, 8, 267–287. [Google Scholar] [CrossRef]
- Yang, Y.P.O.; Shieh, H.M.; Tzeng, G.H. A VIKOR technique based on DEMATEL and ANP for information security risk control assessment. Inf. Sci. 2013, 232, 482–500. [Google Scholar] [CrossRef]
- Lee, W.S.; Tzeng, G.H.; Guan, J.L.; Chien, K.T.; Huang, J.M. Combined MCDM techniques for exploring stock selection based on Gordon model. Expert Syst. Appl. 2009, 36, 6421–6430. [Google Scholar] [CrossRef]
- Liou, J.J.H.; Chuang, U.T. Developing a hybrid multi-criteria model for selection of outsourcing providers. Expert Syst. Appl. 2010, 37, 3755–3761. [Google Scholar] [CrossRef]
- Liu, C.H.; Tzeng, G.H.; Lee, M.H. Improving tourism policy implementation—The use of hybrid MCDM models. Tour. Manag. 2012, 33, 413–426. [Google Scholar] [CrossRef]
- Liu, C.H.; Tzeng, G.H.; Lee, M.H.; Lee, P.Y. Improving metro-airport connection service for tourism development: Using hybrid MCDM models. Tour. Manag. Perspect. 2013, 6, 95–107. [Google Scholar] [CrossRef]
- Saaty, T.L. Decision making with dependence and feedback: The analytic network process. International 1996, 95, 129–157. [Google Scholar]
- Ho, W.R.J.; Tsai, C.L.; Tzeng, G.H.; Fang, S.K. Combined DEMATEL technique with a novel MCDM model for exploring portfolio selection based on CAPM. Expert Syst. Appl. 2011, 38, 16–25. [Google Scholar]
- Ergu, D.; Kou, G.; Shi, Y.; Shi, Y. Analytic network process in risk assessment and decision analysis. Comput. Oper. Res. 2014, 42, 58–74. [Google Scholar] [CrossRef]
- Kou, G.; Ergu, D.; Lin, C.; Chen, Y. Pairwise Comparison Matrix in Multiple Criteria Decision Making. Technol. Econ. Dev. Econ. 2016, 22, 738–765. [Google Scholar] [CrossRef]
- Yang, Y.P.O.; Leu, J.D.; Tzeng, G.H. A novel hybrid MCDM model combined with DEMATEL and ANP with applications. Int. J. Oper. Res. 2008, 5, 160–168. [Google Scholar]
- Lu, I.Y.; Kuo, T.; Lin, T.S.; Tzeng, G.H.; Huang, S.L. Multicriteria decision analysis to develop effective sustainable development strategies for enhancing competitive advantages: Case of the TFT-LCD industry in Taiwan. Sustainability 2016, 8, 646. [Google Scholar] [CrossRef]
Figure 1.
The framework and structure of this paper.

Figure 2.
Framework of research model.

Figure 3.
The influential network relation map of each dimension and criterion. (a)Dimensions (b)Technological dimension (c)Subjective dimension (d)Environmental dimension.
Figure 3.
The influential network relation map of each dimension and criterion. (a)Dimensions (b)Technological dimension (c)Subjective dimension (d)Environmental dimension.


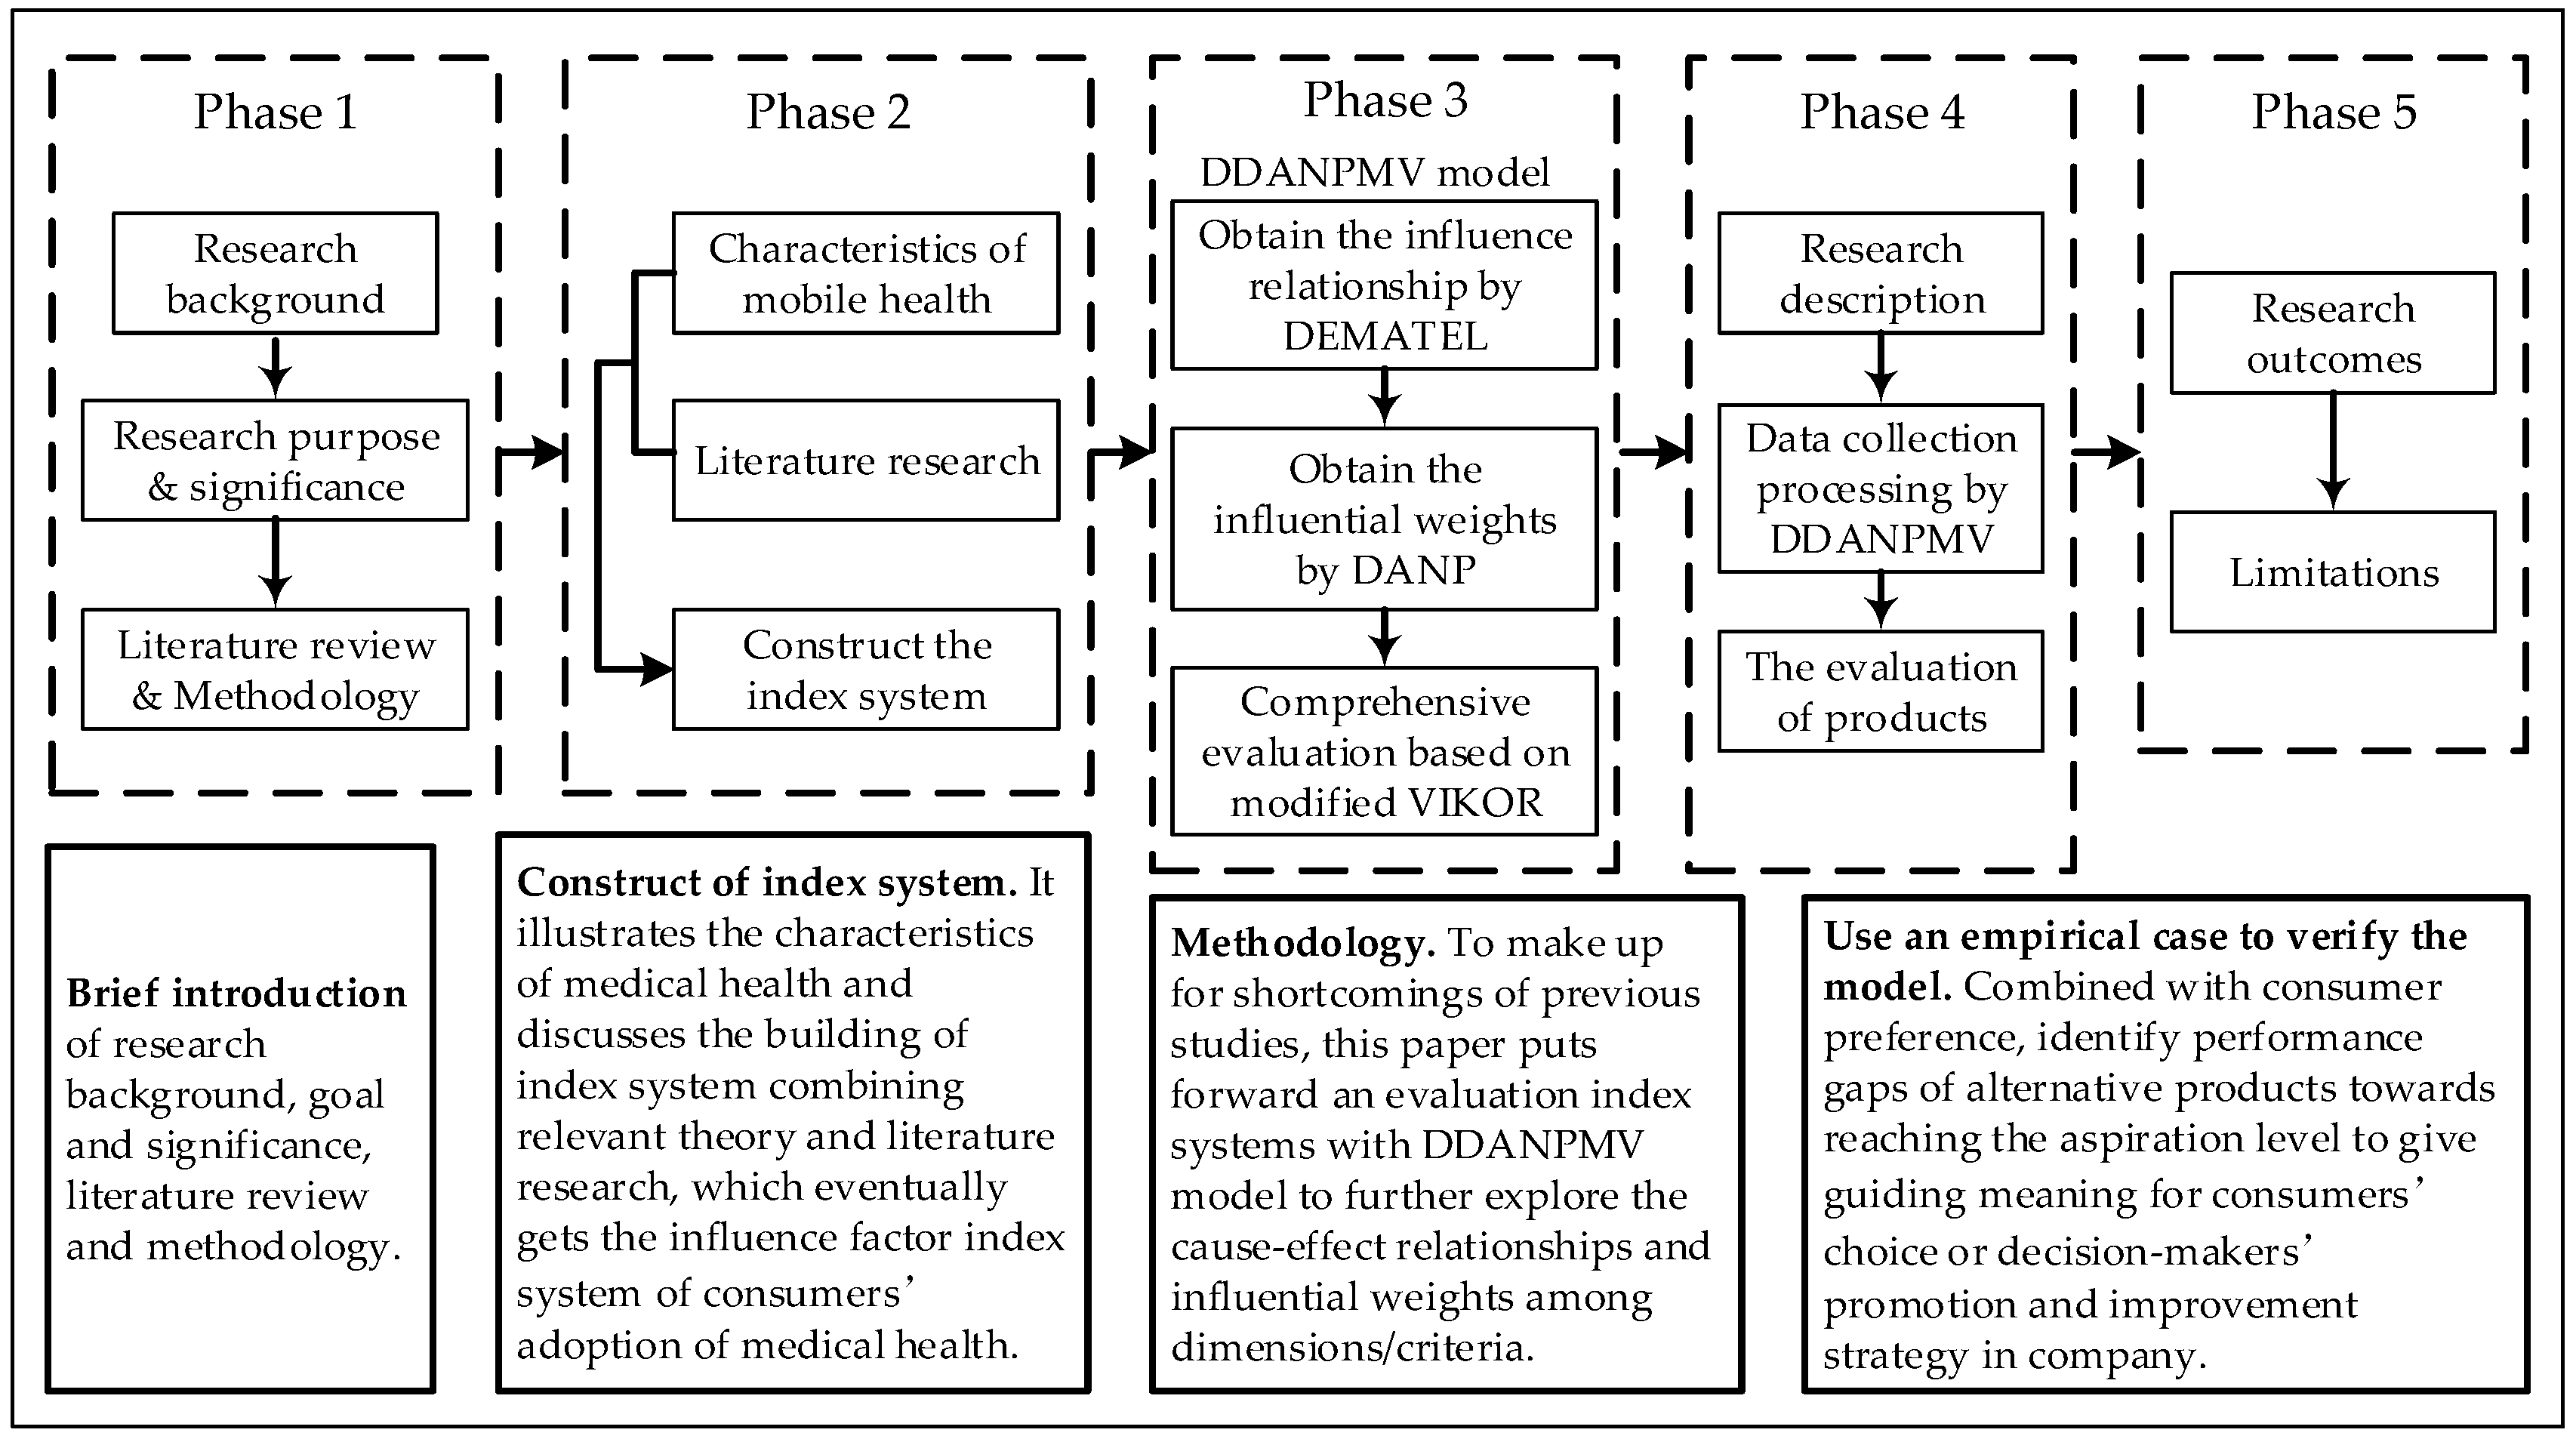
Table 1.
Evaluation index system of the adoption of mobile health.
| Dimensions/Criteria | Descriptions | References |
|---|---|---|
| Technological dimension (D1) | ||
| Usefulness (C11) | The performance of mobile health on prompting consumers to do something. | [58,59,61] |
| Ease of use (C12) | The degree of difficulty in using mobile health products. | [58,59,61] |
| Quality of technological service (C13) | Whether it could satisfy users’ requirement for using value of health service and provide health service information safely, timely and effectively to meet consumers’ needs. | [63] |
| Subjective dimension (D2) | ||
| Compatibility (C21) | The consistency degree of medical health products with consumers’ existing values, belief and experience. | [65,66] |
| Trust (C22) | Whether providers have necessary knowledge and skill to satisfy users’ needs, whether providers serve well-intended without bad motives, and whether providers comply with the moral and ethical principles. | [67,68] |
| Perceived value (C23) | A comprehensive evaluation made by consumers based on benefits and costs, including price, utility maximum, performance–price ratio of product or service and relationship between cost and benefit of product. | [70,71,72] |
| Environmental dimension(D3) | ||
| Social factors(C31) | The social group’s influential degree of users’ recognition on the adoption of mobile health, which users belong to, including users’ family, friends, colleagues, etc. Additionally, whether they hold positive attitudes and support consumers to use mobile health. | [74,75,76,77] |
| Product image(C32) | Whether an information technology is widely-used and whether the application of this technology is given social status. How the image, social reputation and service attitude of hospital or company is. | [74] |
Table 2.
Initial influence matrix A.
| Criteria | C11 | C12 | C13 | C21 | C22 | C23 | C31 | C32 |
|---|---|---|---|---|---|---|---|---|
| C11 | 0.000 | 0.625 | 0.250 | 0.125 | 0.875 | 2.250 | 2.250 | 0.750 |
| C12 | 0.750 | 0.000 | 0.250 | 0.875 | 0.750 | 2.125 | 2.125 | 0.750 |
| C13 | 2.000 | 2.000 | 0.000 | 1.000 | 1.750 | 1.250 | 1.750 | 1.750 |
| C21 | 2.750 | 2.750 | 0.375 | 0.000 | 2.000 | 1.750 | 0.750 | 0.875 |
| C22 | 0.000 | 0.125 | 0.000 | 0.125 | 0.000 | 0.875 | 2.875 | 3.000 |
| C23 | 0.000 | 0.000 | 0.125 | 0.125 | 3.000 | 0.000 | 3.000 | 3.125 |
| C31 | 0.000 | 0.250 | 1.125 | 1.125 | 2.125 | 2.125 | 0.000 | 3.750 |
| C32 | 0.000 | 0.000 | 0.125 | 0.125 | 0.875 | 3.000 | 3.125 | 0.000 |
Note: Average consensus gap ratio in experts’ initial influence scores = 4.81% . These results indicate the confidence of significance in consensus ratio to reach 95.19%. The number of criteria is n = 8; The number of experts in practical experience is H = 8.
Table 3.
The total influence matrix of criteria T.
| Criteria | C11 | C12 | C13 | C21 | C22 | C23 | C31 | C32 |
|---|---|---|---|---|---|---|---|---|
| C11 | 0.014 | 0.057 | 0.041 | 0.038 | 0.161 | 0.242 | 0.272 | 0.199 |
| C12 | 0.068 | 0.028 | 0.042 | 0.084 | 0.161 | 0.244 | 0.271 | 0.204 |
| C13 | 0.156 | 0.161 | 0.034 | 0.104 | 0.250 | 0.250 | 0.315 | 0.306 |
| C21 | 0.196 | 0.201 | 0.053 | 0.040 | 0.255 | 0.267 | 0.254 | 0.243 |
| C22 | 0.011 | 0.024 | 0.027 | 0.037 | 0.101 | 0.173 | 0.305 | 0.321 |
| C23 | 0.013 | 0.021 | 0.039 | 0.043 | 0.296 | 0.147 | 0.355 | 0.374 |
| C31 | 0.032 | 0.052 | 0.095 | 0.102 | 0.266 | 0.285 | 0.210 | 0.412 |
| C32 | 0.012 | 0.018 | 0.036 | 0.039 | 0.173 | 0.286 | 0.327 | 0.174 |
Table 4.
The total influence matrix of dimension and sum of influences given/received on dimensions.
Table 4.
The total influence matrix of dimension and sum of influences given/received on dimensions.
| Dimension | D1 | D2 | D3 | ||||
|---|---|---|---|---|---|---|---|
| D1 | 0.067 | 0.170 | 0.261 | 0.498 | 0.173 | 0.671 | 0.325 |
| D2 | 0.065 | 0.151 | 0.309 | 0.525 | 0.513 | 1.038 | 0.011 |
| D3 | 0.041 | 0.192 | 0.281 | 0.514 | 0.850 | 1.364 | −0.337 |
Table 5.
Sum of influences given/received on criteria.
| Criteria | ||||
|---|---|---|---|---|
| C11 | 1.023 | 0.504 | 1.527 | 0.519 |
| C12 | 1.101 | 0.562 | 1.663 | 0.539 |
| C13 | 1.577 | 0.366 | 1.943 | 1.210 |
| C21 | 1.509 | 0.488 | 1.997 | 1.021 |
| C22 | 0.998 | 1.663 | 2.660 | −0.665 |
| C23 | 1.288 | 1.894 | 3.182 | −0.606 |
| C31 | 1.455 | 2.308 | 3.763 | −0.853 |
| C32 | 1.066 | 2.232 | 3.298 | −1.166 |
Table 6.
The unweighted super-matrix W.
| W | C11 | C12 | C13 | C21 | C22 | C23 | C31 | C32 |
|---|---|---|---|---|---|---|---|---|
| C11 | 0.128 | 0.494 | 0.444 | 0.437 | 0.179 | 0.183 | 0.180 | 0.183 |
| C12 | 0.510 | 0.202 | 0.459 | 0.446 | 0.385 | 0.286 | 0.291 | 0.276 |
| C13 | 0.362 | 0.304 | 0.097 | 0.117 | 0.437 | 0.532 | 0.530 | 0.541 |
| C21 | 0.086 | 0.172 | 0.172 | 0.071 | 0.120 | 0.089 | 0.157 | 0.079 |
| C22 | 0.365 | 0.330 | 0.413 | 0.454 | 0.324 | 0.609 | 0.407 | 0.347 |
| C23 | 0.549 | 0.499 | 0.414 | 0.475 | 0.557 | 0.302 | 0.436 | 0.574 |
| C31 | 0.577 | 0.571 | 0.508 | 0.511 | 0.487 | 0.487 | 0.338 | 0.653 |
| C32 | 0.423 | 0.429 | 0.492 | 0.489 | 0.513 | 0.513 | 0.663 | 0.347 |
The weighted super-matrix can then be obtained by multiplying by W, as shown in Table 7.
Table 7.
The weighted super-matrix .
| C11 | C12 | C13 | C21 | C22 | C23 | C31 | C32 | |
|---|---|---|---|---|---|---|---|---|
| C11 | 0.017 | 0.066 | 0.060 | 0.149 | 0.061 | 0.062 | 0.094 | 0.096 |
| C12 | 0.069 | 0.027 | 0.062 | 0.152 | 0.132 | 0.098 | 0.152 | 0.145 |
| C13 | 0.049 | 0.041 | 0.013 | 0.040 | 0.149 | 0.182 | 0.278 | 0.284 |
| C21 | 0.011 | 0.021 | 0.021 | 0.021 | 0.035 | 0.026 | 0.092 | 0.047 |
| C22 | 0.045 | 0.041 | 0.051 | 0.131 | 0.093 | 0.176 | 0.240 | 0.204 |
| C23 | 0.068 | 0.062 | 0.051 | 0.137 | 0.160 | 0.087 | 0.257 | 0.338 |
| C31 | 0.046 | 0.046 | 0.041 | 0.191 | 0.182 | 0.182 | 0.184 | 0.357 |
| C32 | 0.034 | 0.034 | 0.039 | 0.183 | 0.192 | 0.192 | 0.362 | 0.190 |
The weighted super-matrix is multiplied by itself several times to obtain the stable matrix; that is, the matrix is raised to the power of g (). The global IWs are obtained from the result. The local weights are calculated from the global weights, as shown in Table 8.
Table 8.
Influential weights of DEMETEL-based analytic network process (DANP).
| Dimensions/Criteria | Local Weights | Global Weights |
|---|---|---|
| Technological dimension (D1) | 0.135 | — |
| Usefulness (C11) | 0.311 | 0.042 |
| Ease of use (C12) | 0.341 | 0.046 |
| Quality of technological service (C13) | 0.348 | 0.047 |
| Subjective dimension (D2) | 0.407 | — |
| Compatibility (C21) | 0.332 | 0.135 |
| Trust (C22) | 0.336 | 0.137 |
| Perceived value (C23) | 0.332 | 0.135 |
| Environmental dimension (D3) | 0.458 | — |
| Social factors (C31) | 0.517 | 0.237 |
| Product image C32) | 0.483 | 0.221 |
The final results of the obtained IWs derived from experts’ opinions indicate that social factors (C32), product image (C32), and trust (C22) are the most important criteria, with IWs of 0.237, 0.211, and 0.137, respectively. Usefulness (C11) and ease of use (C12) are considered less important, with IWs of 0.042 and 0.047, respectively. For the technological dimension (D1), experts considered quality of technological service (C13) as the most important criterion, with a local influence weight of 0.047. For the subjective dimension (D2), trust (C22) was considered to be the most important criterion by experts, with a local influence weight of 0.137. In the case of the environmental dimension (D3), social factors (C31) was considered to be the most important criterion, with a local influence weight of 0.237. Social factors strongly influence consumers’ decision regarding whether to choose mobile health care, and it is a key factor that cannot be ignored by mobile health providers. Regarding global weights, the technological dimension (D1) was seldom considered when consumers made decisions to adopt mobile health care products.
Table 9.
The performance evaluation of four mobile health products using traditional VlseKriterijumska Optimizacija I Kompromisno Resenje (VIKOR).
Table 9.
The performance evaluation of four mobile health products using traditional VlseKriterijumska Optimizacija I Kompromisno Resenje (VIKOR).
| Dimensions/Criteria | Local Weights | Global Weights | Performance Scores | Traditional VIKOR (Performance Gap Ratio) | |||||||
|---|---|---|---|---|---|---|---|---|---|---|---|
| P1 | P2 | P3 | P4 | P1 | P2 | P3 | P4 | ||||
| Technological dimension (D1) | 0.135 | — | 7.959 | 8.302 | 8.759 | 8.748 | 0.719 | 0.563 | 0.250 | 0.255 | |
| Usefulness (C11) | 0.311 | 0.042 | 8.000 | 8.400 | 8.900 | 9.400 | 1.000 | 0.714 | 0.357 | 0.000 | |
| Ease of use (C12) | 0.341 | 0.046 | 8.900 | 7.500 | 9.200 | 8.100 | 0.176 | 1.000 | 0.000 | 0.647 | |
| Quality of technological service (C13) | 0.348 | 0.047 | 7.000 | 9.000 | 8.200 | 8.800 | 1.000 | 0.000 | 0.400 | 0.100 | |
| Subjective dimension(D2) | 0.407 | — | 8.205 | 7.706 | 8.274 | 8.645 | 0.599 | 0.842 | 0.526 | 0.340 | |
| Compatibility (C21) | 0.332 | 0.135 | 7.500 | 7.300 | 9.200 | 8.700 | 0.895 | 1.000 | 0.000 | 0.263 | |
| Trust (C22) | 0.336 | 0.137 | 7.500 | 7.300 | 8.100 | 9.200 | 0.895 | 1.000 | 0.579 | 0.000 | |
| Perceived value (C23) | 0.332 | 0.135 | 9.600 | 8.500 | 7.500 | 8.000 | 0.000 | 0.524 | 1.000 | 0.762 | |
| Environmental dimension (D3) | 0.458 | — | 7.683 | 7.573 | 8.800 | 8.693 | 0.897 | 0.862 | 0.069 | 0.077 | |
| Social factors (C31) | 0.517 | 0.237 | 7.200 | 6.800 | 8.800 | 8.500 | 0.800 | 1.000 | 0.000 | 0.150 | |
| Product image (C32) | 0.483 | 0.221 | 8.200 | 8.400 | 8.800 | 8.900 | 1.000 | 0.714 | 0.143 | 0.000 | |
| Total average performance score and gap-ratio, and ranking shown in brackets | 7.933(3) | 7.726(4) | 8.582(2) | 8.593(1) | 0.752(3) | 0.813(4) | 0.279(2) | 0.208(1) | |||
| Gap ratio: | |||||||||||
| Qk =(v = 0) | Fk (v = 0.8) | Fk (v = 0.5) | Fk (v = 0.2) | ||||||||
| P1(k = 1) | 0.752 (3) | 1.000 (2) | 0.801 (3) | 0.876 (3) | 0.950 (3) | ||||||
| P2(k = 2) | 0.813 (4) | 1.000 (2) | 0.851 (4) | 0.907 (4) | 0.963 (4) | ||||||
| P3(k = 3) | 0.279 (2) | 1.000 (2) | 0.424 (2) | 0.640 (2) | 0.856 (2) | ||||||
| P4(k = 4) | 0.208 (1) | 0.762 (1) | 0.319 (1) | 0.485 (1) | 0.651 (1) | ||||||
The gap ratio matrix of the four products determined using the modified VIKOR method can be obtained from Equations (19)–(21), as shown in Table 10.
Table 10.
The performance evaluation of four mobile health products using modified-VIKOR.
| Dimensions/Criteria | Local Weights | Global Weights | Performance Scores | Modified VIKOR (Performance Gap Ratio) | |||||||
|---|---|---|---|---|---|---|---|---|---|---|---|
| P1 | P2 | P3 | P4 | P1 | P2 | P3 | P4 | ||||
| Technological dimension (D1) | 0.135 | — | 7.959 | 8.302 | 8.759 | 8.748 | 0.170 | 0.204 | 0.124 | 0.125 | |
| Usefulness (C11) | 0.311 | 0.042 | 8.000 | 8.400 | 8.900 | 9.400 | 0.200 | 0.160 | 0.110 | 0.060 | |
| Ease of use (C12) | 0.341 | 0.046 | 8.900 | 7.500 | 9.200 | 8.100 | 0.110 | 0.250 | 0.080 | 0.190 | |
| Quality of technological service (C13) | 0.348 | 0.047 | 7.000 | 9.000 | 8.200 | 8.800 | 0.300 | 0.100 | 0.180 | 0.120 | |
| Subjective dimension (D2) | 0.407 | — | 8.205 | 7.706 | 8.274 | 8.645 | 0.179 | 0.229 | 0.173 | 0.135 | |
| Compatibility (C21) | 0.332 | 0.135 | 7.500 | 7.300 | 9.200 | 8.700 | 0.250 | 0.270 | 0.080 | 0.130 | |
| Trust (C22) | 0.336 | 0.137 | 7.500 | 7.300 | 8.100 | 9.200 | 0.250 | 0.270 | 0.190 | 0.080 | |
| Perceived value (C23) | 0.332 | 0.135 | 9.600 | 8.500 | 7.500 | 8.000 | 0.040 | 0.150 | 0.250 | 0.200 | |
| Environmental dimension (D3) | 0.458 | — | 7.683 | 7.573 | 8.800 | 8.693 | 0.232 | 0.243 | 0.120 | 0.131 | |
| Social factors (C31) | 0.517 | 0.237 | 7.200 | 6.800 | 8.800 | 8.500 | 0.280 | 0.320 | 0.120 | 0.150 | |
| Product image (C32) | 0.483 | 0.221 | 8.200 | 8.400 | 8.800 | 8.900 | 0.180 | 0.160 | 0.120 | 0.110 | |
| Total average performance score and gap-ratio, and ranking shown in brackets | 0.517 | 7.933(3) | 7.726(4) | 8.582(2) | 8.593(1) | 0.207(3) | 0.227(4) | 0.142(2) | 0.141(1) | ||
| Gap ratio: | |||||||||||
| Sk = Fk (v = 1) | Qk = Fk (v = 0) | Fk (v = 0.8) | Fk (v = 0.5) | Fk (v = 0.2) | |||||||
| P1(k = 1) | 0.207 (3) | 0.300 (3) | 0.226 (3) | 0.254 (3) | 0.281 (3) | ||||||
| P2(k = 2) | 0.227 (4) | 0.320 (4) | 0.246 (4) | 0.274 (4) | 0.302 (4) | ||||||
| P3(k = 3) | 0.142 (2) | 0.250 (2) | 0.164 (2) | 0.196 (2) | 0.228 (2) | ||||||
| P4(k = 4) | 0.141 (1) | 0.190 (1) | 0.146 (1) | 0.166 (1) | 0.186 (1) | ||||||
Note: (1) Dimension scores were determined from dimension indexes and the weight of all indexes within the dimension. For example, for dimension D1: (0.311 × 0.00) + (0.341 × 0.000) + (0.348 × 1.000) = 0.348; (2) Parentheses (1), (2), (3) and (4) denote the ranking in four alternatives, when the minimal gap is better.
Table 11.
Consumers’ adoption of mobile health implementation improvement plan.
| Items | Strategy (Sequence of Improvement Priority) |
|---|---|
| F1: Influential network of dimensions of DEMATEL | D1_D2_D3 |
| F2: Influential network of criteria within individual dimensions | D1: (C13_C12_C11) |
| (C12_C11) | |
| D2: (C21_C23_ C22) | |
| (C23_C22) | |
| D3: (C31_C32) | |
| F3: Sequence of P1 dimensions to rise to the aspiration level | D1_D2_D3 |
| F4: Sequence of P1 dimensions to rise to the aspiration level within individual dimensions | D1: (C12_C11_C13) |
| D2: (C23_C21/C22) | |
| D3: (C31_C32) | |
| F5: Sequence of P2 dimensions to rise to the aspiration level | D1_D2_D3 |
| F6: Sequence of P2 dimensions to rise to the aspiration level within individual dimensions | D1: (C13_C11_C12) |
| D2: (C23_C21/C22) | |
| D3: (C32_C31) | |
| F7: Sequence of P3 dimensions to rise to the aspiration level | D3_D1_D2 |
| F8: Sequence of P3 dimensions to rise to the aspiration level within individual dimensions | D3: (C31/C32) |
| D1: (C12_C11_C13) | |
| D2: (C21_C22_ C23) | |
| F9: Sequence of P4 dimensions to rise to the aspiration level | D1_D3_D2 |
| F10: Sequence of P4 dimensions to rise to the aspiration level within individual dimensions | D1: (C11_C13_C12) |
| D3: (C32_C31) | |
| D2: (C22_C21_ C23) |
© 2019 by the authors. Licensee MDPI, Basel, Switzerland. This article is an open access article distributed under the terms and conditions of the Creative Commons Attribution (CC BY) license (http://creativecommons.org/licenses/by/4.0/).
Share and Cite
MDPI and ACS Style
Liu, Y.; Yang, Y.; Liu, Y.; Tzeng, G.-H. Improving Sustainable Mobile Health Care Promotion: A Novel Hybrid MCDM Method. Sustainability 2019, 11, 752. https://doi.org/10.3390/su11030752
AMA Style
Liu Y, Yang Y, Liu Y, Tzeng G-H. Improving Sustainable Mobile Health Care Promotion: A Novel Hybrid MCDM Method. Sustainability. 2019; 11(3):752. https://doi.org/10.3390/su11030752
Chicago/Turabian StyleLiu, Yupeng, Yutao Yang, Yue Liu, and Gwo-Hshiung Tzeng. 2019. "Improving Sustainable Mobile Health Care Promotion: A Novel Hybrid MCDM Method" Sustainability 11, no. 3: 752. https://doi.org/10.3390/su11030752
Note that from the first issue of 2016, this journal uses article numbers instead of page numbers. See further details here.