Particle Deposition Characteristics and Efficiency in Duct Air Flow over a Backward-Facing Step: Analysis of Influencing Factors

Key Laboratory of Enhanced Heat Transfer and Energy Conservation of Education Ministry, School of Chemistry and Chemical Engineering, South China University of Technology, Guangzhou 510640, China
*
Author to whom correspondence should be addressed.
Sustainability 2019, 11(3), 751; https://doi.org/10.3390/su11030751
Submission received: 3 December 2018
/
Revised: 18 January 2019
/
Accepted: 26 January 2019
/
Published: 31 January 2019
(This article belongs to the Special Issue Sustainability in Civil Engineering: from Sustainable Materials to Sustainable Structures)
Abstract
:Dry deposition of airborne particles in duct air flow over a backward-facing step (BFS) is commonly encountered in built environments and energy engineering. However, the understanding of particle deposition characteristics in BFS flow remains insufficient. Thus, this study investigated particle deposition behaviors and efficiency in BFS flow by using the Reynolds stress model and the discrete particle model. The influences of flow velocities, particle diameters, and duct expansion ratios on particle deposition characteristics were examined and analyzed. After numerical validation, particle deposition velocities, deposition efficiency, and deposition mechanisms in BFS duct flow were investigated in detail. The results showed that deposition velocity in BFS duct flow monotonically increases when particle diameter increases. Moreover, deposition velocity falls with increasing expansion ratio but rises with increasing air velocity. Deposition efficiency, the ratio of deposition velocity, and flow drag in a BFS duct is higher for small particles but lower for large particles as compared with a uniform duct. A higher particle deposition efficiency can be achieved by BFS with a smaller expansion ratio. The peak deposition efficiency can reach 33.6 times higher for 1-μm particles when the BFS expansion ratio is 4:3. Moreover, the “particle free zone” occurs for 50-μm particles in the BFS duct and is enlarged when the duct expansion ratio increases.
1. Introduction
Dry deposition of aerosol particles in duct air flow over a backward-facing step (BFS) is of significant relevance in built environments and energy engineering, such as for particle removal devices, building ventilation systems, and pulverized coal burners [1,2,3,4]. As a BFS can greatly modify flow structure and turbulent kinetic energy (TKE) distribution, particle dispersion and deposition in BFS flow are quite different from the case of uniform duct flow [5]. Particle deposition in a uniform duct has been well studied. However, particle deposition characteristics and behaviors in BFS flow have been seldom examined. Therefore, more attention needs to be paid to this important issue to improve the efficiency of many related energy and environmental engineering devices.
Particle deposition characteristics in duct air flow are complicated and determined by many factors, such as the properties of the particles (density, size, and shape), gravitational effect, Brownian diffusion, turbulent flow structures (turbulent eddies and turbulent kinetic energy distributions), geometric structure of the duct, temperature difference in flow fields (thermophoresis), and humidity of the air (three-phase flow) [4,5,6]. For particle deposition in a vertical duct, particle deposition velocity will firstly decrease, then increase greatly, and finally remain constant when particle relaxation time increases, as the mechanisms of particle deposition greatly change from small to large particle sizes [7,8]. For low particle relaxation time, Brownian diffusion and turbulent vortex are dominant factors for particle deposition [9,10]. However, particle inertia is much more significant than particle relaxation time increases [11,12].
In recent years, the research method for particle deposition in duct air flow has dramatically changed. Compared with experimental study and theoretical prediction, numerical simulation has become the main way to study particle deposition [13,14,15]. As it is challenging to experimentally measure or theoretically predict particle deposition behaviors in duct air flow with complicated duct geometries, computational fluid dynamics (CFD) methods are heavily used to predict particle deposition behaviors in complex turbulent flow fields. The Eulerian–Eulerian and Eulerian–Lagrangian methods are the two main methodologies used to predict duct flow particle deposition. The first method treats particles as a pseudo-fluid and models particle motion as fluid flow [16]. However, the second method tracks particle movement trajectories and solves the Newtonian kinetic equation for each particle [17]. The Eulerian–Eulerian approach neglects the difference between the velocities of the air flow and particle motion, which results in errors opposite to the physics. The Eulerian–Lagrangian method can accurately simulate particle movements by tracking the trajectories of each particle. Thus, the discrete particle model (DPM) (Lagrangian method) was adopted in the present study.
For the uniform duct case, Zhao and Chen [18] investigated the deposition characteristics of particles in ventilation ducts by using the Eulerian–Eulerian approach. Zhang and Chen [19] predicted the deposition velocity of particles in a uniform duct by using the turbulence model. The Reynolds stress model (RSM) proved to be the most accurate Reynolds-averaged Navier–Stokes (RANS) model compared with other turbulence models by Tian [20] and Gao [21] because the RSM includes turbulent anisotropy while other turbulence models assume turbulent isotropy. For the nonuniform duct case, Haber [22] and Lee [23] predicted the deposition behaviors of particles in expanding and contracting alveolus by solving the creeping flow equations, as the flow velocities in their cases were quite slow. This method can capture the basic flow eddies. They found that particle deposition velocity increases due to the capture of flow eddies near the wall. Li et al. [24] studied particle deposition in air duct flow over an obstacle. They found that interception of obstacles can obviously increase particle deposition velocity. Iacono et al. [25] compared deposition characteristics of spherical and nonspherical particles in turbulent ribbed pipe flow by using large eddy simulation (LES). The results showed that nonspherical particles would not accumulate before the ribbed surface, which is quite different from spherical particles. Benedetto et al. [26] and Sarli and co-workers [27,28] examined dust deposition in air flow inside an explosion chamber. Dust mainly accumulates at the walls and this tendency is stronger with an increase of dust nominal concentration and diameter.
Particle deposition in BFS duct flow is quite complicated and influenced by many factors. Moreover, it is challenging to measure particle motions in near-wall regions by experiments. Therefore, studies on particle deposition in BFS flow are very limited, and the related deposition behaviors and mechanisms remain unclear. Nevertheless, CFD can be a powerful tool to study particle deposition characteristics in BFS ducts. Thus, this study investigated particle deposition in BFS flow using the Reynolds stress model and the discrete particle model. The influencing factors on particle deposition characteristics, including different air flow velocities, particle sizes, and expansion ratios of the BFS duct, were considered in the study. Turbulent air flow fields, particle movement trajectories, particle deposition velocities, and deposition efficiency considering flow drag were obtained and analyzed carefully. Moreover, the deposition mechanisms of BFS flow were studied and compared with a uniform duct case.
2. Numerical Methodology
This section describes the numerical models for the air-particle flow simulation. The RSM for air flow and the DPM for particle motion are demonstrated in Section 2.1. The modification of turbulent velocity fluctuation to improve the prediction accuracy is described in Section 2.2. The fully developed velocity and turbulent kinetic energy for the inlet are described in Section 2.3.
2.1. 2D Air-Particle Two-Phase Models
The governing equation of dust air flow can be described by
where is the air velocity, is the pressure, and is the Reynolds stress tensor. The RSM was employed in this study to close the RANS equations. The Reynolds stress governing equation can be written as follows:
The terms on the left-hand side of Equation (3) are the time and convective terms, respectively. The terms on the right-hand side of Equation (3) are the turbulent diffusion, stress production, pressure strain, and dissipation terms, respectively. In Equation (3), empirical constants , , and [20]. A two-layer zonal model with enhanced wall function was used near the wall to improve turbulence prediction [20]. More details on the air flow model can be found in the authors’ previous studies [29,30,31].
DPM was adopted to simulate particle motions in air flow. Considering dilute particulate flow in the present study, particle modification on fluids and collisions between particles were neglected. Five main forces were modeled in the simulation. The term on the left-hand side of Equation (4) is the accelerated velocity of the particles. The terms on the right-hand side of Equation (4) are the drag, gravitational, buoyancy, Brownian, and Saffman’s lift forces, respectively. These five forces were the main factors used to determine particle deposition behaviors. The detailed particle motion equation is described as follows [20,21]:
where is the time step. However, we conducted a steady simulation in this study. is a timescale constant in the steady calculation in ANSYS FLUENT. The particle dispersion behaviors were related to the time step length in the unsteady simulation. The effects of time step on particle dispersion and deposition characteristics were investigated, as they represent an important research issue in our future unsteady simulation research.
The drag coefficient CD was calculated by [20]
where is the particle Reynolds number. Its physical significance is the ratio of inertial force to viscous force per unit mass.
where is the particle terminal fall velocity, is the particle diameter, is the fluid kinematic viscosity, and S0 is the spectral intensity of a Gaussian white noise random process. The particle deposition velocity has been widely used to describe the deposition rate of particles. Particle deposition velocity can be calculated by [20]
where J is the deposited particle number and is mean particle concentration. The nondimensional particle deposition velocity can be calculated by
where is the friction velocity.
The particle relaxation time can be computed by
where is the Cunningham slip correction factor, which is calculated by
where is the mean free path of gas molecules (air = 0.066 µm), is the particle diameter, is the density ratio of the particle and fluid, is the particle diameter, and is the kinematic viscosity of the fluid. The particle relaxation time represents the time required for a particle to adjust its velocity to a new condition of forces in the fluids. The nondimensional particle relaxation time can be computed by
Considering the flow drag of the duct, a particle deposition efficiency can be defined compared with the uniform duct case [32]:
where is the increase ratio of flow drag.
2.2. Modification of Turbulent Velocity Fluctuation
Particle turbulent dispersion was modeled by the discrete random walk (DRW) model [20,21]. Fluid velocity fluctuation produced by a Gaussian random distribution as well as turbulent vortex were used in the DRW model [32]. Instantaneous fluid velocity fluctuation in RSM can be described by
where , , and are the fluid velocity fluctuation in different directions, respectively, and is random number with normal distribution. The present simulation was a steady prediction. Thus, the random fluid velocity fluctuation updated every iterative step, which is consistent with the literature [20]. Nevertheless, it was found that particle deposition velocity will be overpredicted by directly using RSM [20,21]. Thus, turbulent velocity fluctuation was corrected in near-wall regions by a user-defined function (UDF) to improve prediction accuracy. For the uniform duct, direct numerical simulation (DNS) results [33] were employed and are shown as follows:
where . For the uniform duct, Equation (14) was used for the same range . In addition, turbulent velocity fluctuation in BFS duct flow was corrected by [34]
where , , and . Equation (13) was successfully imposed in modeling particle deposition in ribbed duct flow [34]. For the BFS duct, Equation (15) was adopted for the range .
2.3. Fully Developed Inlet Conditions
Fully developed velocity and TKE profiles were imposed in the simulation by UDF codes. Fully developed velocity distribution is shown as follows [20]:
where D is the duct inlet height and is the air mean velocity. Besides, the fully developed TKE distribution can be computed by [20]
A nonslip condition was adopted on the walls for the fluid phase. A pressure outlet was employed at the duct outlet. For the particle phase, it was assumed that particles would deposit on wall surfaces if they touched the walls, which was consistent with Tian [20]. Particles would leave from the duct outlet in the present simulation [20]. The RANS equation was solved by the finite volume method, while the particle motion equation was solved by the Runge–Kutta approach.
3. Computational Cases and Grid Independence Test
This section describes the computational cases and the grid independence test. The computational geometry and case description are given in Section 3.1. The structural grid and the grid independence test are described in Section 3.2.
3.1. Computational Geometry
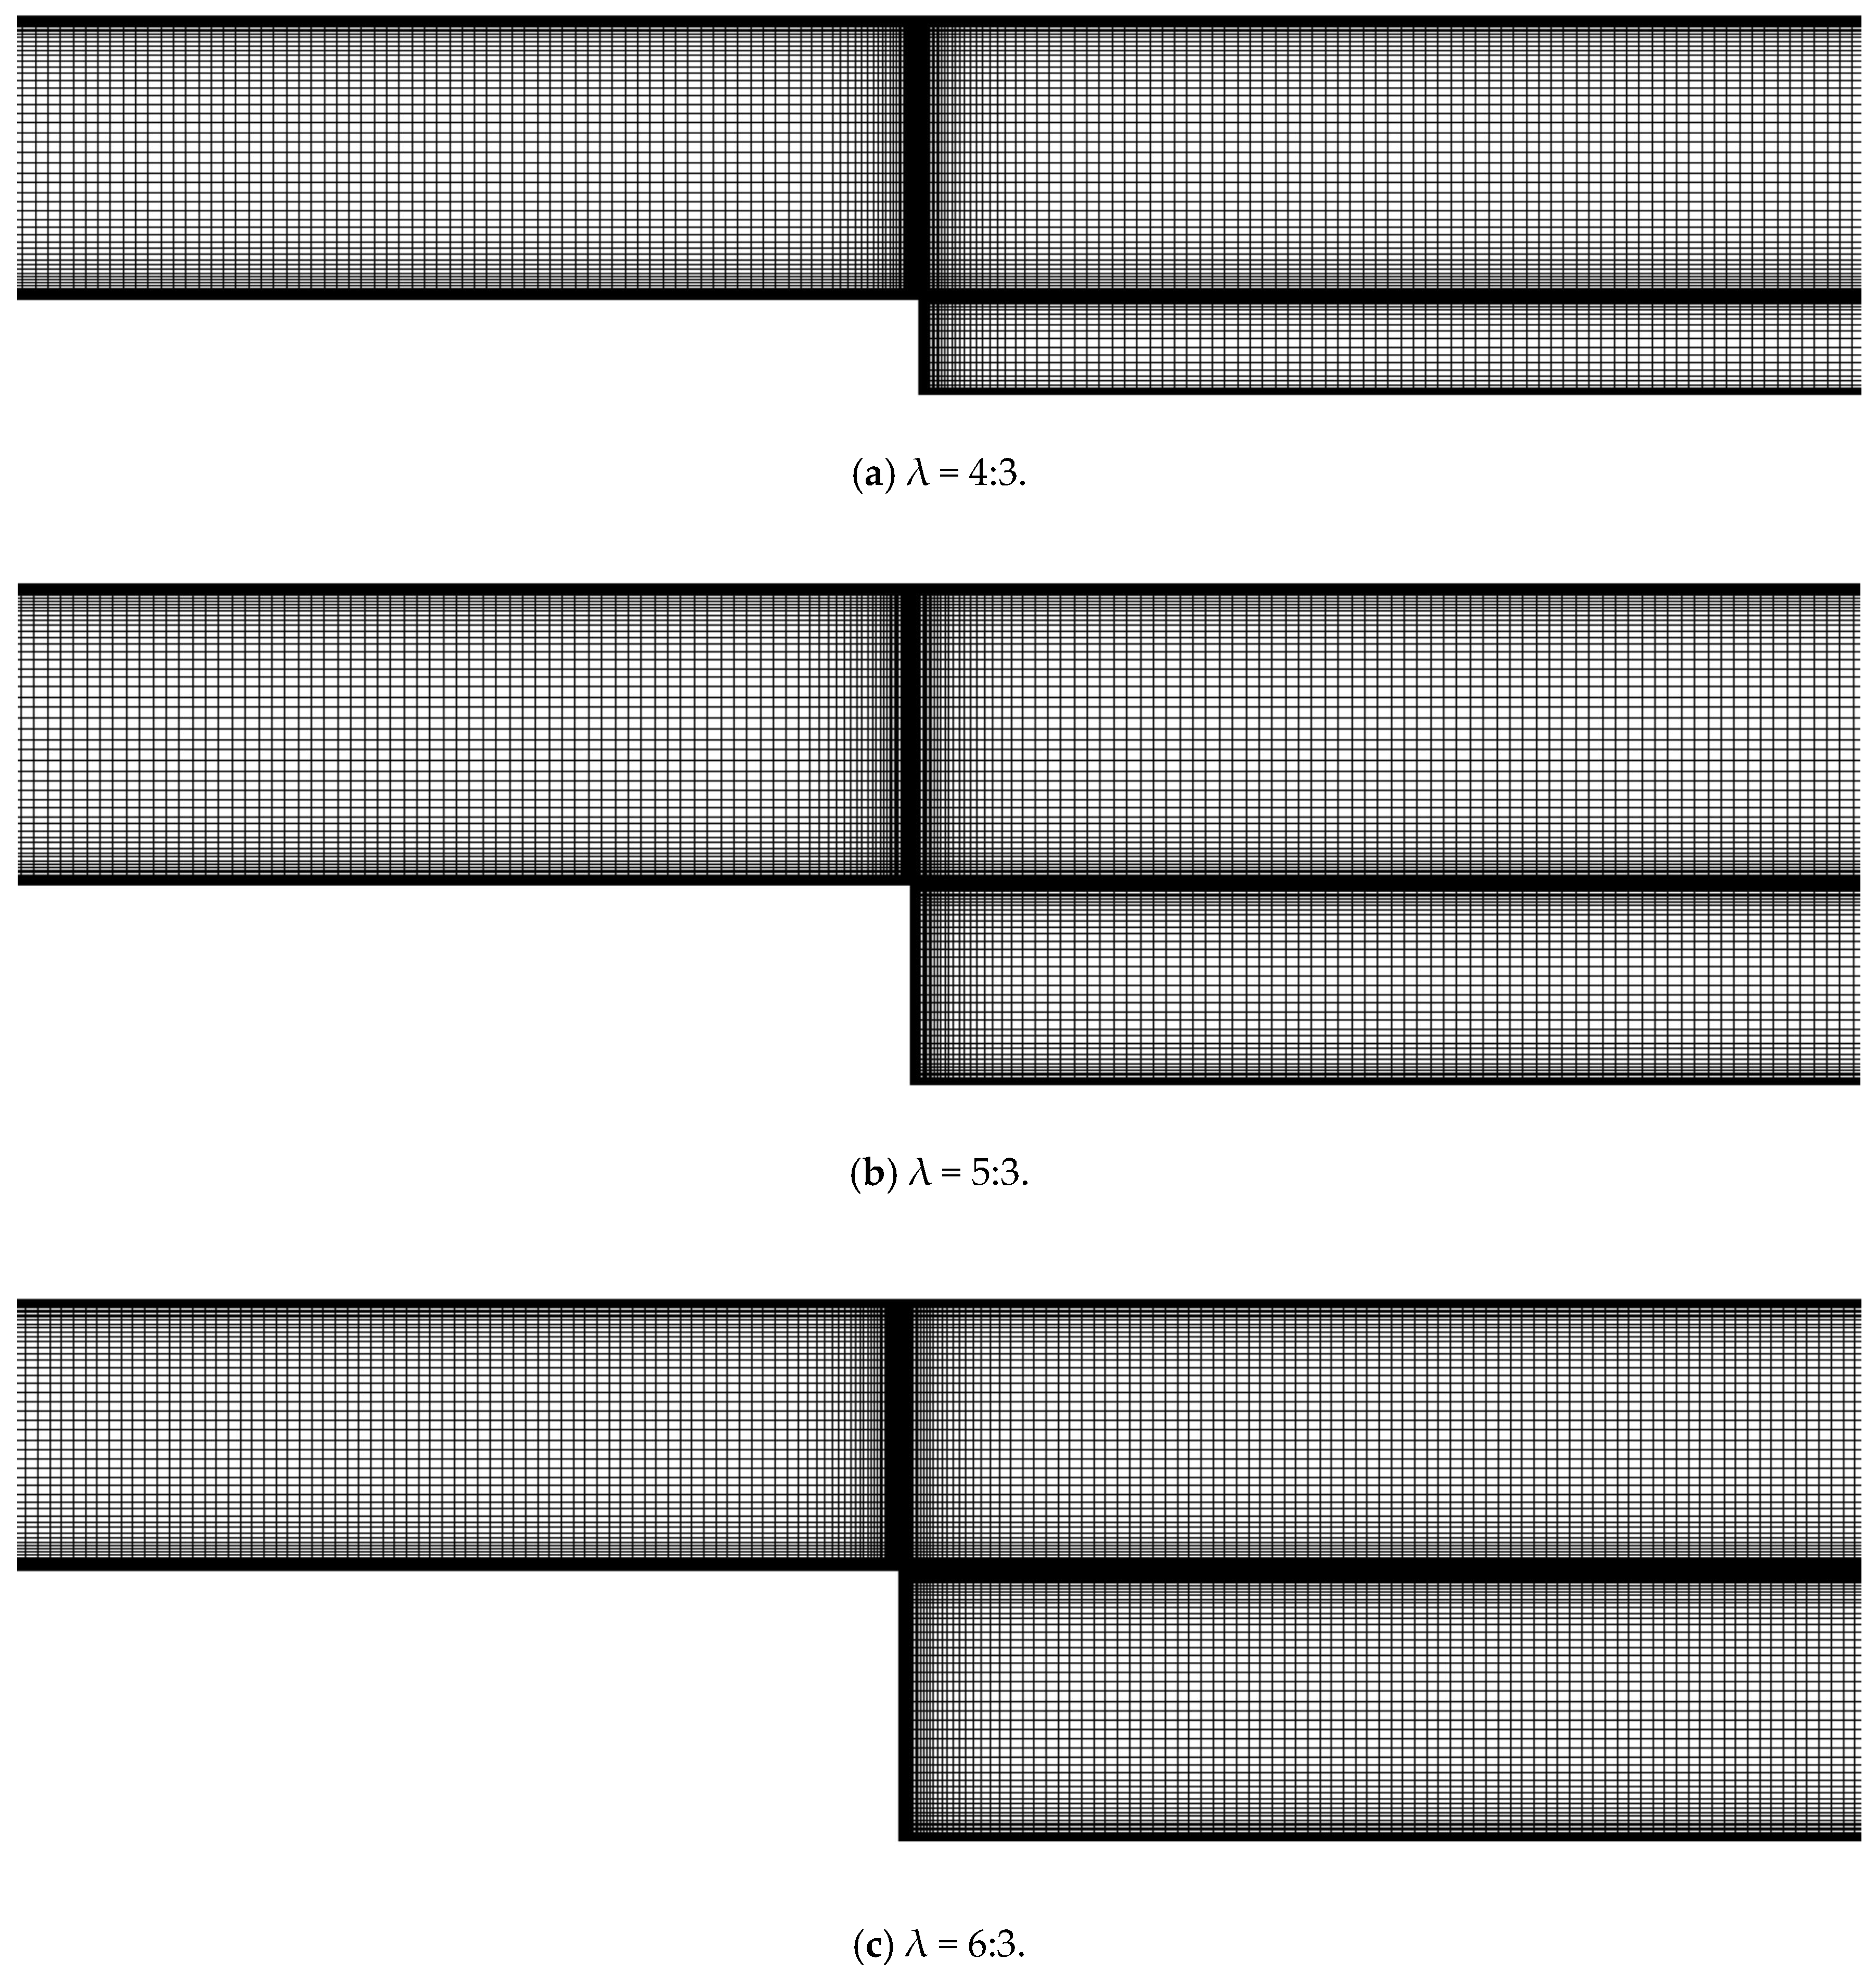
The length of 2D uniform and BFS ducts was 0.4 m and the width of uniform and BFS duct inlets was 0.02 m, as displayed in Figure 1. The length of 2D uniform duct Lu was 0.4 m and the width of uniform duct Du was 0.02 m, as shown in Figure 1a. For the BFS duct, the first half-length of the duct Lb1 was 0.2 m, while the second half-length of the duct Lb2 was also 0.2 m. The expansion ratios of BFS duct λ = Db/Hb were 4:3, 5:3, and 6:3, respectively, as shown in Figure 1b. Db was 0.02 m. Inlet air flow velocities were 5.5 and 8 m/s. The corresponding Reynolds numbers were 7534 and 10,959 based on the inlet flow velocity and duct height, respectively. The dynamic viscosity of the air μ was 1.789 × 10⁻⁵ kg·s/m and the air density was 1.225 kg/m3. After the air flow fields converged and stabilized, 30,000 particles were injected from the duct inlet and the particle velocity was initially equal to the inlet mean air velocity. The density of the particle material was 2000 kg/m3 and particle sizes were 1, 2, 3, 5, 10, 20, 30, and 50 µm in the simulation.
3.2. Structural Mesh
Structured mesh was developed for the BFS duct with different expansion ratios, as shown in Figure 2. A grid independence study was conducted on the particle deposition velocity in the uniform duct. The difference between medium and fine mesh cases was not very large, as displayed in Figure 3. However, as the computational cost was not quite large, the fine mesh was adopted to obtain potentially more accurate results. The first grid interval was 0.05 mm and the increased mesh ratio was 1:2. The mesh numbers were 36,527, 41,547, and 45,312 for BFS ducts of the expansion ratios 4:3, 5:3, and 6:3, respectively.
4. Results and Discussions
4.1. Numerical Validation
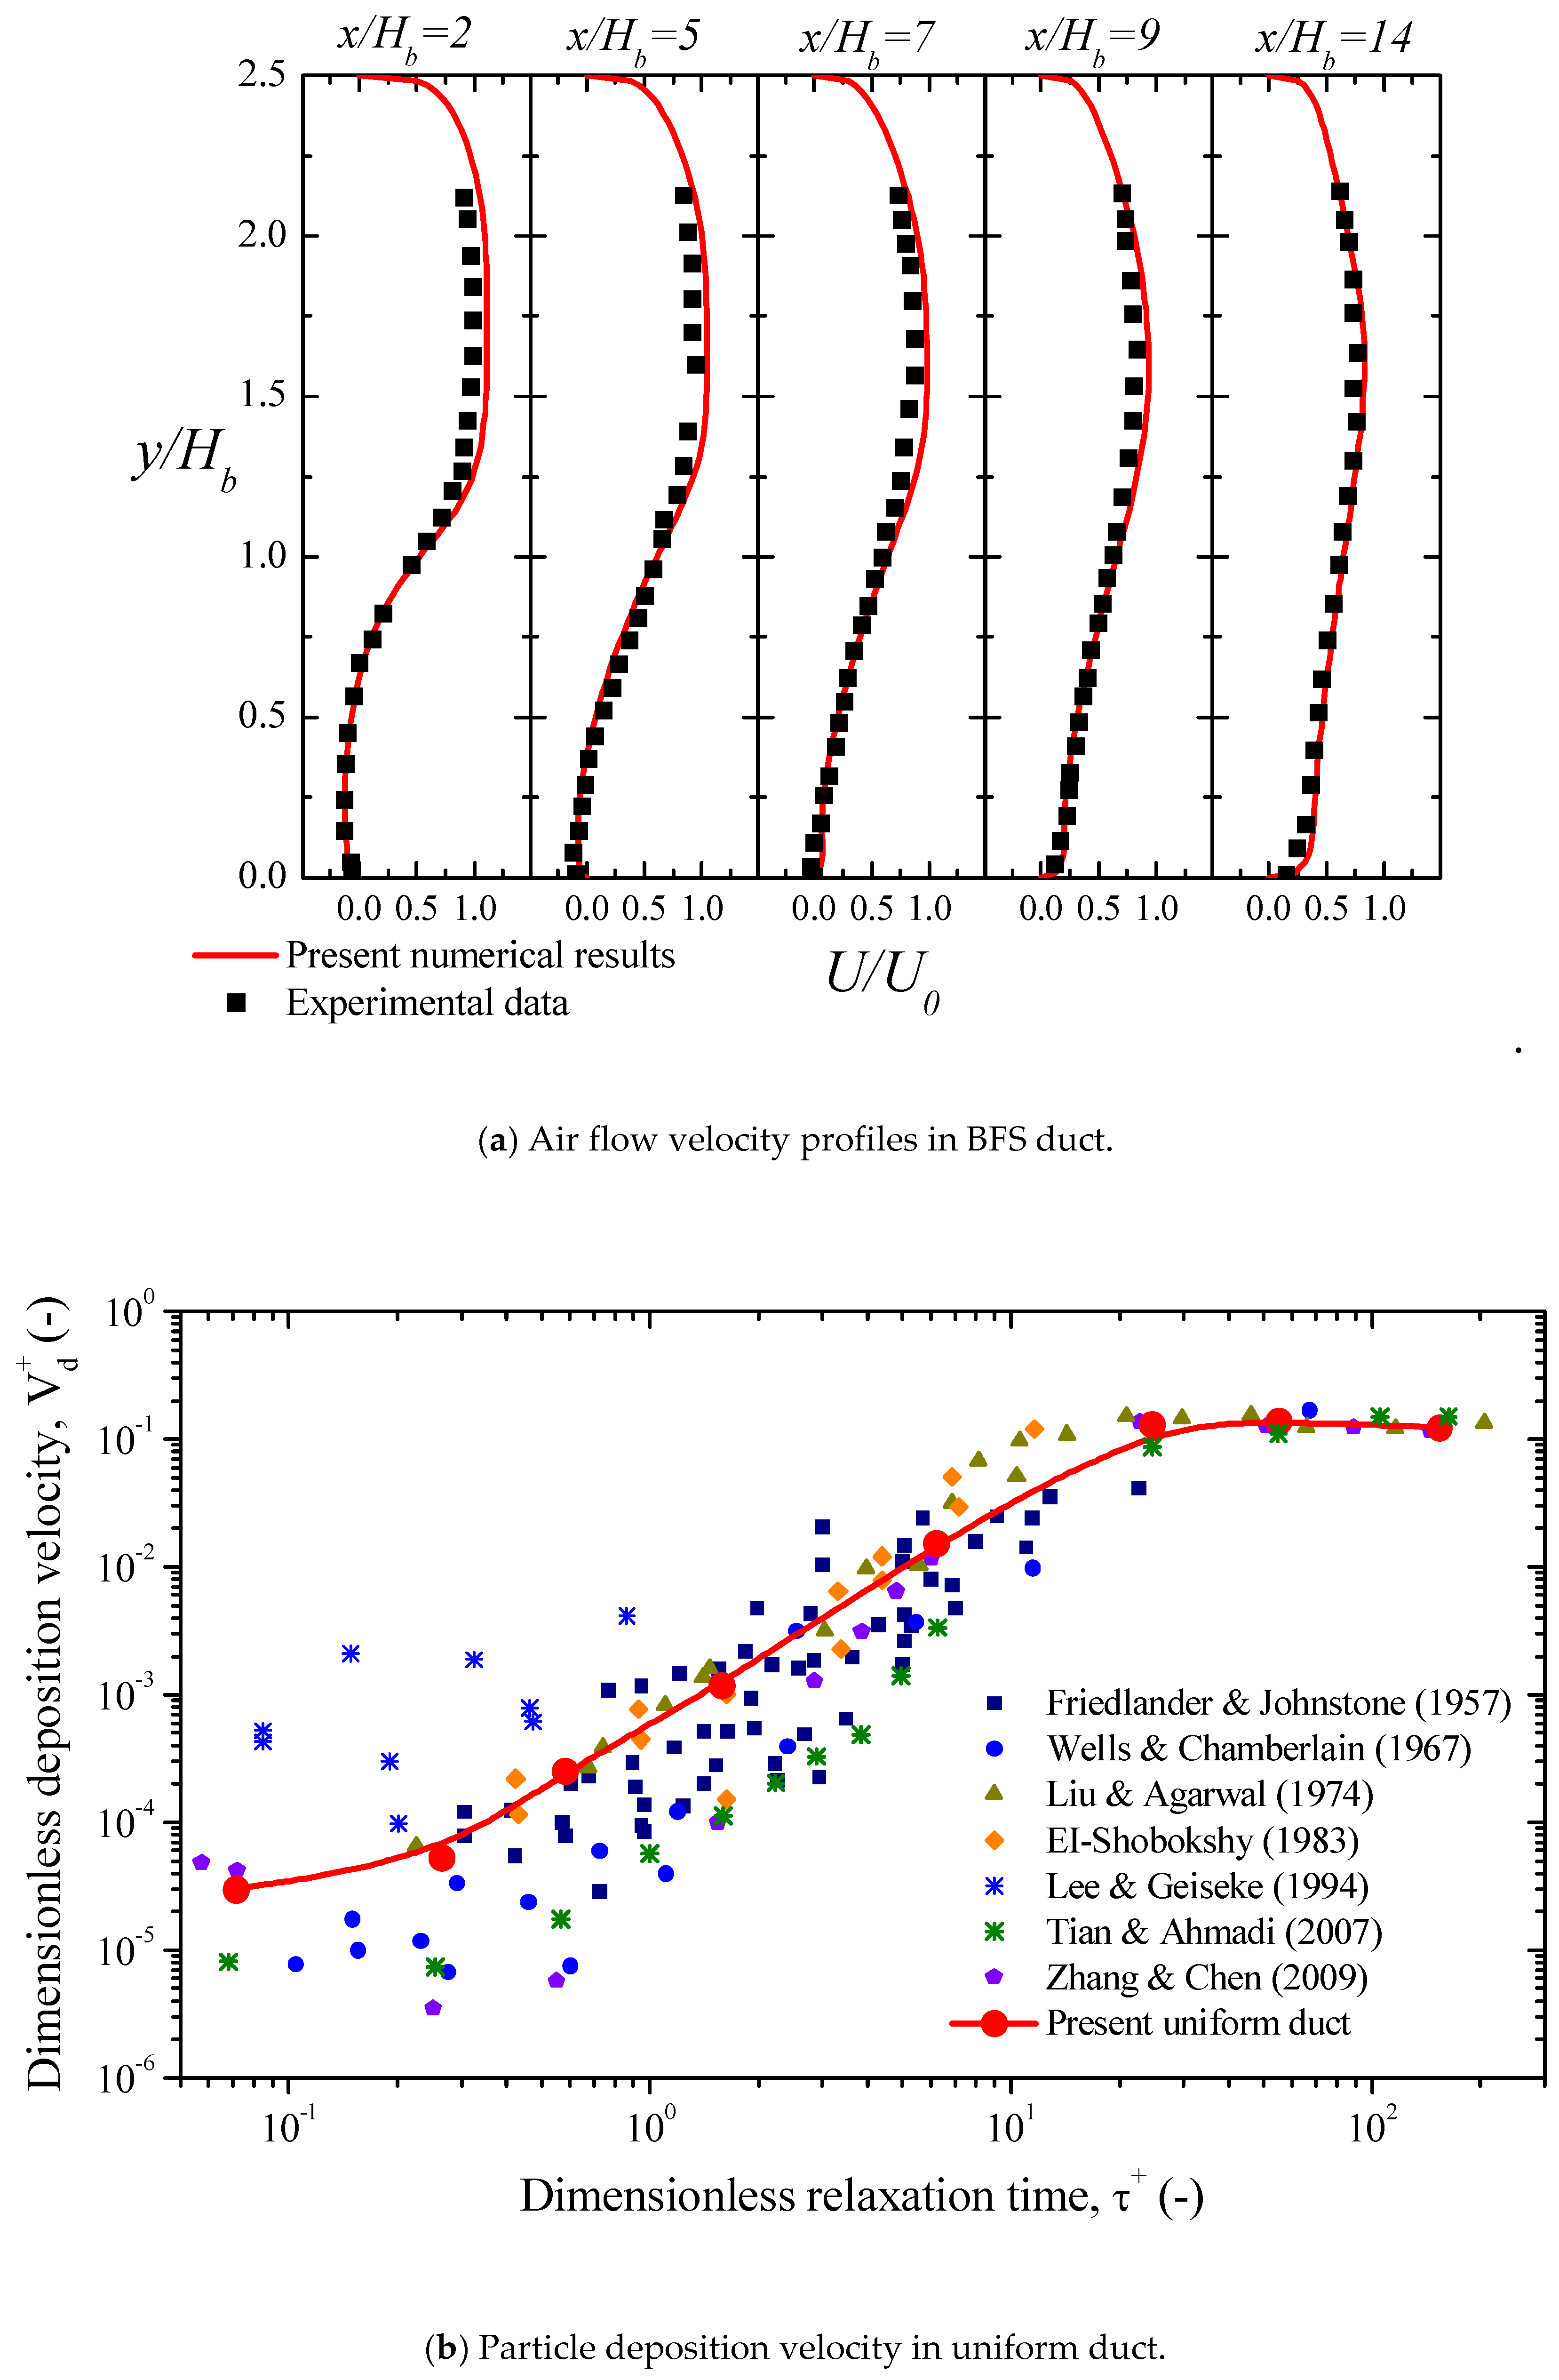
To validate the present air flow and particle motion models, the air velocity distributions in BFS duct flow and particle deposition velocity profile in a uniform duct were obtained and compared with experimental and numerical data. Figure 4a shows five air velocity distributions behind the BFS verifying the experimental measurement [35]. The step height of the BFS duct was 26.7 mm in the experiments. The expansion ratio was 5:3, which was consistent with the present CFD simulation. The Reynolds number based on the air flow velocity and step height was 18,400. This was also the same with the present validated case. The air velocity was measured by using laser Doppler anemometry (LDA). It can be seen that present air velocities agreed well with the literature results. Thus, the present numerical model could simulate BFS flow accurately. The particle deposition velocity distribution for the uniform duct case is shown in Figure 4b. In the present particle size range, flow vortex capture and inertia were the dominant factors determining deposition behaviors. The present deposition velocity distribution agreed well with the related experimental and numerical results from the literature [19,20,36,37,38,39,40,41,42]. Therefore, the present method can well predict particle deposition in duct flow and the present air-particle flow model is reliable and correct.
4.2. Particle Deposition Velocity in BFS Flow
Particle deposition velocity in the BFS duct is illustrated in Figure 5. Different BFS expansion ratios were considered in the study. The curved shapes of the deposition velocity in the BFS duct were dramatically modified compared with the uniform duct case. Deposition velocity in the uniform duct firstly increased significantly and then became invariable when the particle diameter increased. However, the deposition velocity in the BFS duct monotonically increased when the particle diameter increased. This indicated that the deposition characteristics were dramatically changed. Moreover, a cross point can be seen between the deposition profiles of the uniform duct and BFS duct cases. The particle diameter of the cross point was 6, 10, or 11 μm for the duct expansion ratio of 4:3, 5:3, or 6:3, respectively. If the particle diameter was smaller than the cross point, the deposition velocity in the BFS duct was higher than that in the uniform duct. Nevertheless, the deposition velocity in the BFS duct was lower than that in the uniform duct when particle size was larger than the cross point. Moreover, the expansion ratio had an obvious effect on deposition behaviors, as displayed in Figure 5. Deposition velocities can be enhanced by a smaller BFS expansion ratio, as deposition distance increases with an increase of the expansion ratio. However, the curved shape of the deposition velocity did not change with the expansion ratio of the duct. This indicated that the particle deposition mechanisms did not change in the BFS duct for different expansion ratios.
For small particles, turbulent vortex had a significant effect on particle deposition behaviors. A separation eddy was induced by the BFS geometry, which could greatly enhance TKE. Moreover, a large number of particles were captured by turbulent eddies and then transported to deposit on wall surfaces. The mechanism was effective for small particle because of their low inertia. However, for large particles, the mass inertia was the main mechanism for deposition behaviors. Thus, the deposition velocity of large particles decreased in the BFS duct because the deposition distance increased compared with the uniform duct. Moreover, the decreasing tendency of particle deposition velocity increased with an increase of the duct expansion ratio for the BFS duct cases. Therefore, deposition velocity increased by BFS for small particles.
Furthermore, the effect of air velocity on deposition behaviors was investigated and the results are displayed in Figure 6. The air velocities are 5.5 and 8 m/s. Expansion ratio of the duct was 5:3. From Figure 6, higher air velocity can slightly increase particle deposition in BFS duct. Nevertheless, deposition velocity keeps monotonically increasing when air velocity changes.
4.3. Particle Deposition Efficiency in BFS Flow
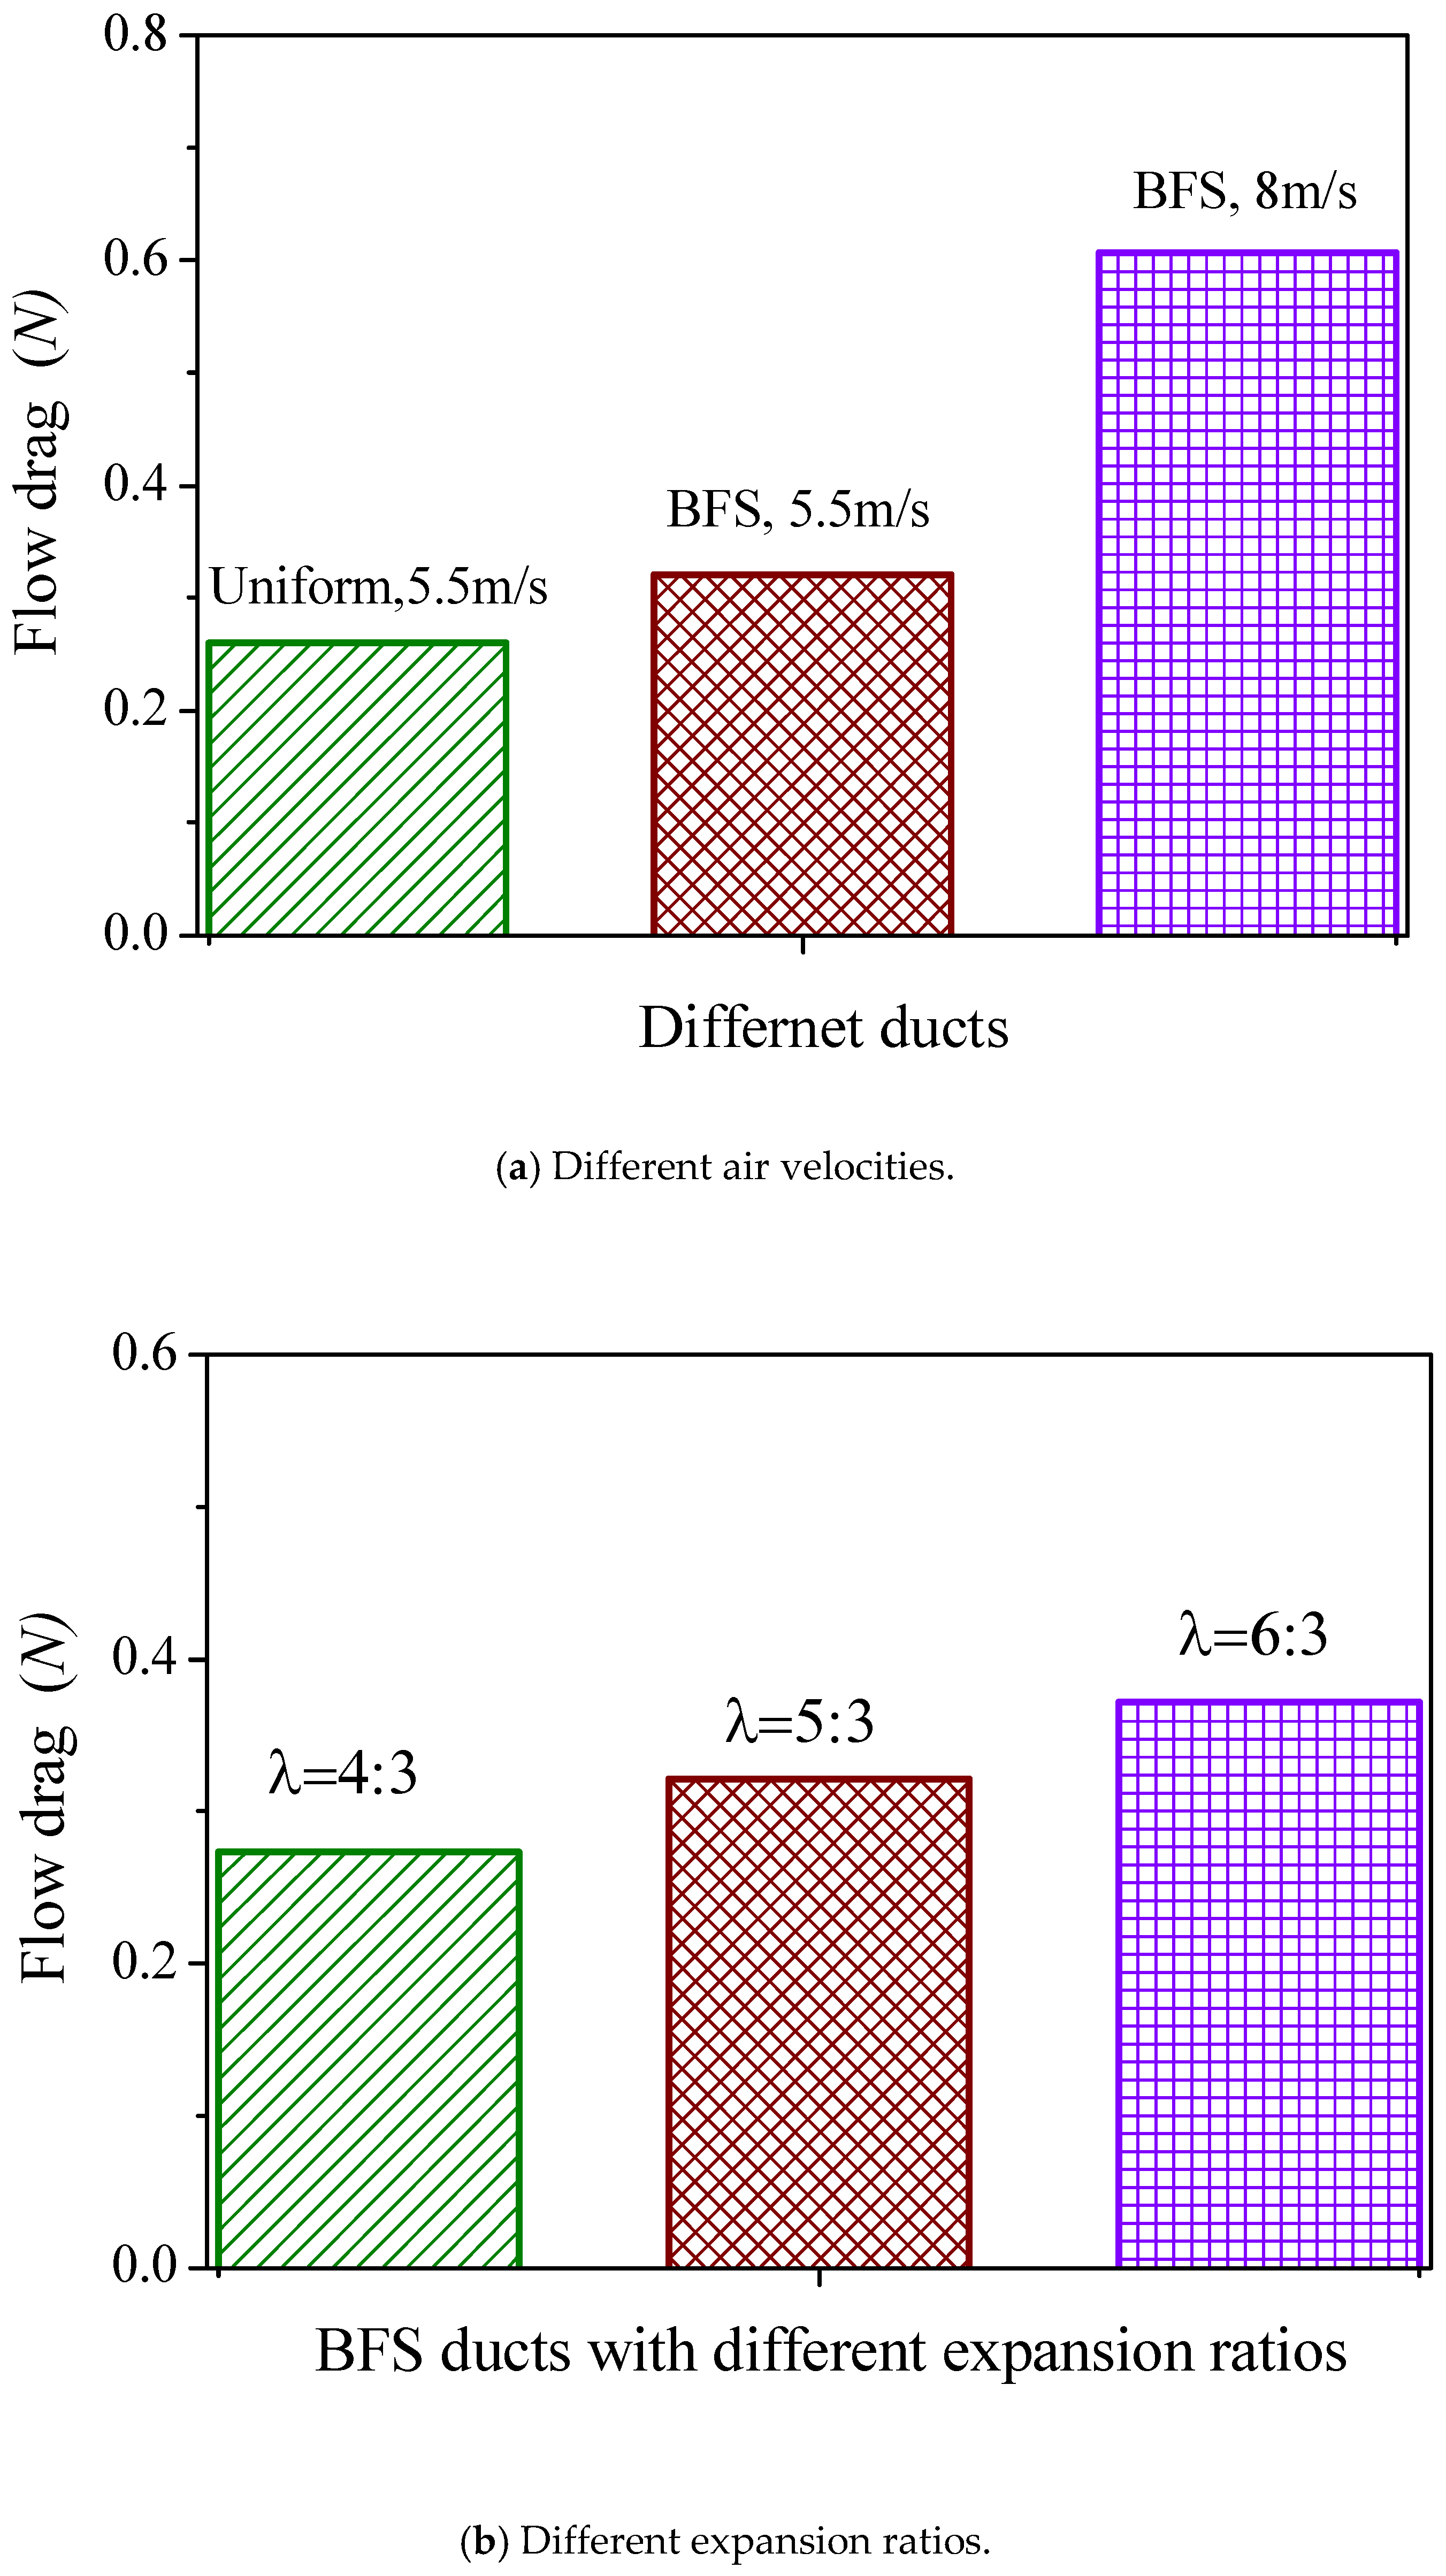
As discussed in the previous section, deposition velocities of small particles can be significantly enhanced by BFS compared with a uniform duct. Thus, the BFS can be a possible alternative to improve particulate removal efficiency in air cleaning devices. However, the flow drag of a BFS duct also needs to be considered to comprehensively evaluate the particle deposition efficiency of BFS. Therefore, the flow drags of uniform and BFS ducts are illustrated in Figure 7. Figure 7a shows that the flow drag for the uniform duct was 0.26 N, while the flow drag increased to 0.32 N for the BFS duct when the air flow velocity was 5.5 m/s. The increased air velocity could induce higher flow drag. The flow drag of the BFS duct could reach 0.61 N when the air flow velocity was 8 m/s. Moreover, the expansion ratio of the BFS duct had an obvious influence on the flow drag, as shown in Figure 7b. The flow drag of the BFS duct was 0.27, 0.32, or 0.37 N for an expansion ratio of 4:3, 5:3, or 6:3, respectively. Thus, the flow drag of the BFS duct increased as the expansion ratio increased, as more form drag was produced by BFS with a higher expansion ratio.
Deposition efficiency profiles of BFS ducts with different expansion ratios are shown in Figure 8. The deposition efficiency of the BFS duct first decreased and then increased with increasing particle size. The deposition efficiency of the BFS duct was larger than 1 for small-size particles while lower than or close to 1 for large-size particles. The critical particle size was 10, 9, or 5 μm when the expansion ratio of the BFS duct was 4:3, 5:3, or 6:3, respectively. This indicates that a wider range of particles can be effectively deposited by BFS with a smaller expansion ratio. Moreover, particle deposition efficiency was modified by different expansion ratios of the BFS duct, as displayed in Figure 8. Generally, the deposition efficiency in the BFS duct was higher if the expansion ratio was lower. The maximum deposition efficiency could reach 33.6 for 1-μm particles when the BFS expansion ratio was 4:3. Therefore, the BFS duct with a small expansion ratio had higher efficiency for particle deposition, especially for PM2.5. Thus, it can be useful in improving particle deposition efficiency in many related gas-particle devices.
Moreover, the effect of air velocity on the deposition efficiency of the BFS duct was investigated, the results of which are shown in Figure 9. The expansion ratio of the BFS duct is 5:3 and the air velocities are 5.5 and 8 m/s in the figure. Deposition efficiency was slightly enhanced when air velocity increased because the turbulent kinetic energy was more intense for the higher flow velocity case. Moreover, different air velocities did not modify the deposition efficiency characteristics. The maximum deposition efficiency still appeared for 1-μm particles for both air velocities.
4.4. Particle Deposition Mechanisms in BFS Flow
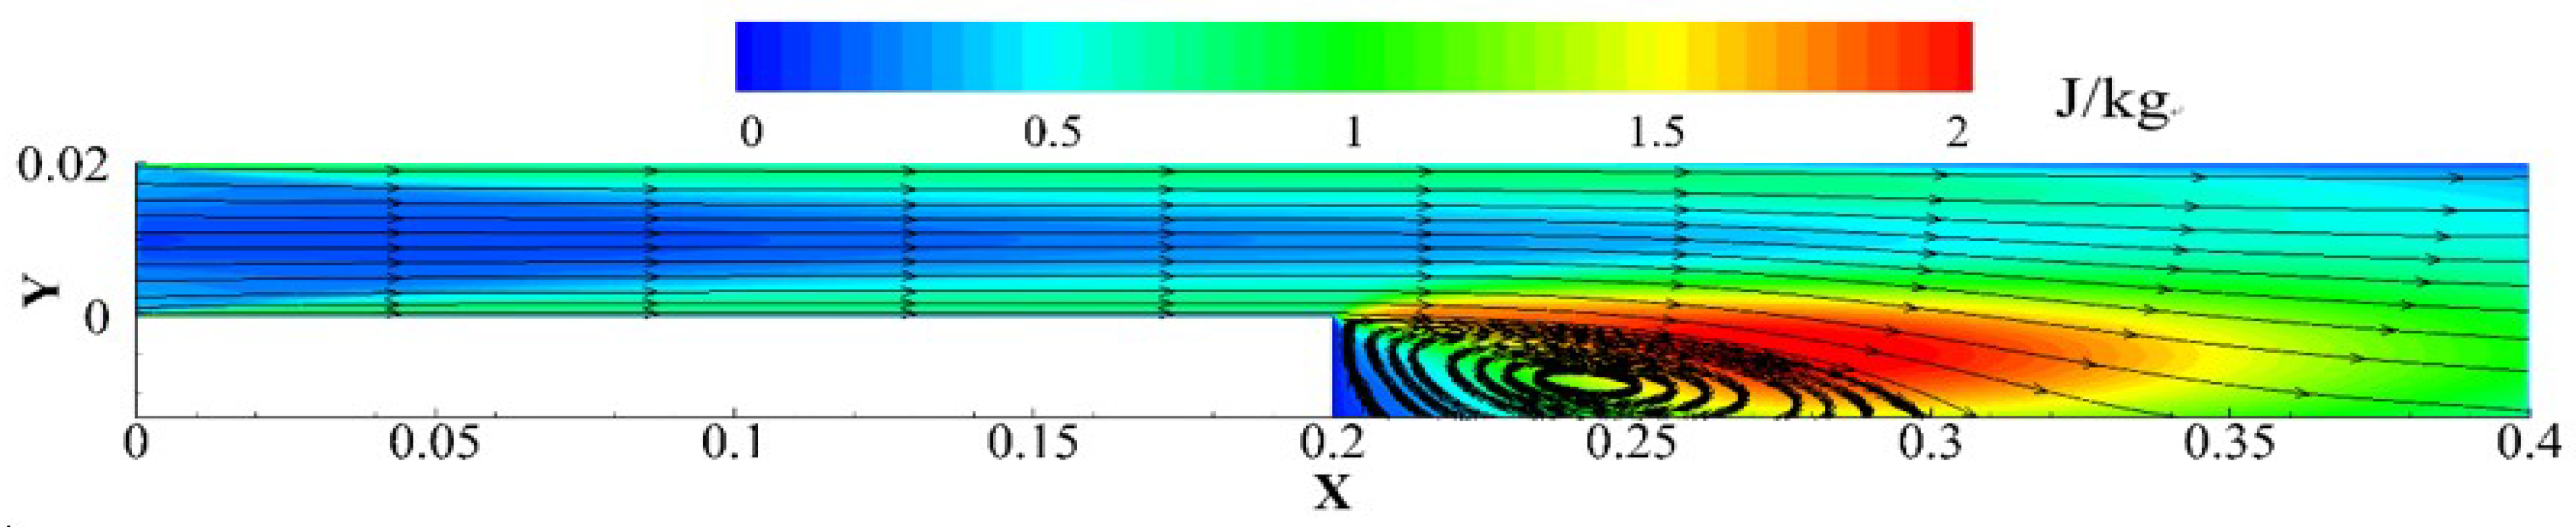
The TKE distribution and particle trajectories with different sizes in the BFS duct are shown in Figure 10 and Figure 11. The expanding ratios are 4:3 and 6:3 in Figure 10 and Figure 11, respectively. Fifty random trajectories were selected in the figures. The flow streamlines in Figure 10a and Figure 11a are expansive because of the BFS structure. The deposition distance of the particles increased as the expansion ratio increased. Thus, the deposition rate in the BFS duct was reduced for large particles. However, a separation eddy was induced by BFS and the TKE values were quite high in the turbulent eddy regions. The large-scale vortex and high-value TKE were beneficial for small-diameter particle deposition. Thus, BFS can increase the deposition efficiency of small particles.
Moreover, Figure 10 and Figure 11 illustrate particle trajectories of 1, 10, and 50 μm in BFS ducts. When particle diameters were 1 and 10 μm, numerous trajectories crossed with each other, as displayed in Figure 10b,c and Figure 11b,c, because small-size particles were likely to alter the movement directions by the turbulent vortex. Nevertheless, as shown in Figure 10d and Figure 11d, particle motions were nearly unchanged due to the large inertia. Besides, particle trajectories of 1 and 10 μm could fill in all the air fields of the BFS duct. However, there were no particle trajectories of 50 μm behind the BFS, which was the “particle free zone” [29]. The particle free zone reduced the deposition area of large particles. Moreover, it was enlarged when the duct expansion ratio increased, as shown in Figure 11d.
The critical particle diameters of the particle free zone for different expansion ratios in BFS flow can be seen in Figure 12. The critical particle diameters were 27, 24, and 21 μm for expansion ratios of 4:3, 5:3, and 6:3 from Figure 3 and Figure 4, respectively. The critical particle diameter decreased with the increasing expansion ratio. When the expansion ratio of the BFS duct was small, it was quite difficult to form the particle free zone, as even large particles could fill the whole BFS duct. However, with the increase of the expansion ratio, only small particles could fill the whole BFS duct due to the larger following property. The particle free zone could easily form for large particles because of the large particle inertia. The regimes above the critical line were the particle free zones, while the no particle free zone formed below the critical line.
4.5. Limitations of the Study
In this study, the air velocity distributions were validated with the related experimental data behind the BFS. Moreover, the validation for particle deposition velocity was conducted in a uniform duct. From the above validation, it can be found that the present model can at least accurately predict particle deposition behaviors in a uniform duct. Moreover, the present CFD model can also accurately simulate the air flow velocity profiles in a BFS duct. The present particle deposition velocity in the BFS duct was used to validate the related experimental measurement. However, the related experimental data of particle deposition velocity in a BFS duct could not be found in the literature. Nevertheless, the present CFD model proved capable of predicting particle deposition velocities and characteristics in many complicated geometries. For example, Gao and Niu [3] and Zhang and Chen [21] used the same CFD model to predict particle deposition in a complicated indoor environment. Sun et al. [16] and Li et al. [26] used the same CFD model to successfully predict particle deposition in duct bends and an obstructed duct flow, respectively. Therefore, these studies can indirectly prove that the present CFD model can correctly simulate particle deposition in a BFS duct. Moreover, direct validation of particle deposition velocity in a BFS duct needs to be conducted in a future work. The related experimental measurement of particle deposition velocity in a BFS duct is strongly recommended.
5. Conclusions
Dry deposition in BFS ducts with different air velocities and expansion ratios were investigated by the Eulerian–Lagranian method. Particle deposition velocity, deposition efficiency, and deposition mechanism were obtained and analyzed. The following conclusions can be drawn:
- Deposition velocity in a BFS duct monotonically increases when the particle diameter increases. Deposition velocity in a BFS duct is higher for small particles but lower for large particles, compared with a uniform duct. Moreover, deposition velocity decreases as the expansion ratio increases. Deposition rates in BFS ducts are enhanced by higher air velocity, but deposition characteristics are not altered by different flow velocities.
- The deposition efficiency of a BFS duct first decreases and then increases as the particle size increases. Compared with a uniform duct, the deposition efficiency of a BFS duct is higher for small particles but lower for large particles. Higher particle deposition efficiency can be obtained by BFS with a smaller expansion ratio. The maximum deposition efficiency can reach 33.6 for 1-μm particles when the BFS expansion ratio is 4:3.
- Compared with a uniform duct, the deposition rates of large particles in a BFS duct are reduced because of the increased deposition distance. However, BFS could increase the deposition efficiency of small particles because a separation vortex is produced by BFS and the TKE is much more intense in the turbulent eddy areas. The trajectories of small particles can fill in whole flow fields of a BFS duct. However, the particle free zone occurs for 50-μm particles in a BFS duct, and the particle free zone is enlarged when the duct expansion ratio increases.
Author Contributions
H.L. conducted the numerical simulation and wrote the original draft preparation; L.Z. revised the paper.
Funding
The authors appreciate the financial support provided by the National Key Research and Development Program (No. 2016YFB0901404). This work was also supported by the ”Xinghua Scholar Talents Plan”of South China University of Technology (K5183300); the Science and Technology Planning Project of Guangdong Province: Guangdong-Hong Kong Technology Cooperation Funding Scheme (TCFS) (No. 2017B050506005) and the National Science Fund for Distinguished Young Scholars (No. 51425601).
Conflicts of Interest
The authors declare no conflict of interest.
References
- Huang, J.; Zhang, L. Numerical simulation of micro-particle deposition in a realistic human upper respiratory tract model during transient breathing cycle. Particuology 2011, 9, 424–431. [Google Scholar] [CrossRef]
- Zhu, C.; Wang, D.; Lin, C.H. Jet dispersion and deposition of charged particles in confined chambers. Particuology 2010, 8, 28–36. [Google Scholar] [CrossRef]
- Gao, N.P.; Niu, J.L. Modeling particle dispersion and deposition in indoor environments. Atmos. Environ. 2007, 41, 3862–3876. [Google Scholar] [CrossRef]
- Lu, H.; Lu, L. Investigation of particle deposition efficiency enhancement in turbulent duct air flow by surface ribs with hybrid-size ribs. Indoor Built Environ. 2017, 26, 608–620. [Google Scholar]
- Lu, H.; Lu, L.; Jiang, Y. Numerical simulation of particle deposition in duct air flows with uniform, expanding or contracting cross-section. Energy Build. 2016, 128, 867–875. [Google Scholar] [CrossRef]
- Zhou, B.; Zhao, B.; Tan, Z.C. How particle resuspension from inner surfaces of ventilation ducts affects indoor air quality-a modeling analysis. Aerosol Sci. Technol. 2011, 45, 996–1009. [Google Scholar] [CrossRef]
- Jin, H.H.; Fan, J.R.; Zeng, M.J.; Cen, K.F. Large eddy simulation of inhaled particle deposition within the human upper respiratory tract. J. Aerosol Sci. 2007, 38, 257–268. [Google Scholar] [CrossRef]
- Sajjadi, H.; Salmanzadeh, M.; Ahmadi, G.; Jafari, S. Lattice Boltzmann method and RANS approach for simulation of turbulent flows and particle transport and deposition. Particuology 2017, 30, 62–72. [Google Scholar] [CrossRef]
- Piskunov, V.N. Parameterization of Aerosol Dry Deposition Velocities onto Smooth and Rough Surfaces. J. Aerosol Sci. 2009, 40, 664–679. [Google Scholar] [CrossRef]
- Jin, H.H.; He, C.; Lu, L.; Fan, J.R. Numerical Investigation of the Wall Effect on Airborne Particle Dispersion in a Test Chamber. Aerosol Air Qual. Res. 2013, 13, 786–794. [Google Scholar] [CrossRef]
- Tu, J.Y.; Yeoh, G.H.; Morsi, Y.S.; Yang, W. A study of particle rebounding characteristics of a gas–particle flow over a curved wall surface. Aerosol Sci. Technol. 2004, 38, 739–755. [Google Scholar] [CrossRef]
- Guha, A. A Unified Eulerian Theory of Turbulent Deposition to Smooth and Rough Surface. J. Aerosol Sci. 1997, 28, 1517–1537. [Google Scholar] [CrossRef]
- Hussein, T.; Smolik, J.; Kerminen, V.; Kulmala, M. Modeling Dry Deposition of Aerosol Particles onto Rough Surfaces. Aerosol Sci. Technol. 2012, 46, 44–59. [Google Scholar] [CrossRef] [Green Version]
- Sippola, M.R.; Nazaroff, W.W. Experiment measuring particle deposition from fully developed turbulent flow in ventilation ducts. Aerosol Sci. Technol. 2004, 38, 914–925. [Google Scholar] [CrossRef]
- Lai, A.C.K.; Nazaroff, W.W. Modelling Indoor Particle Deposition from Turbulent Flow onto Smooth Surfaces. J. Aerosol Sci. 2000, 31, 463–476. [Google Scholar] [CrossRef]
- Sun, K.; Lu, L.; Jiang, H. A numerical study of bend-induced particle deposition in and behind duct bends. Build. Environ. 2012, 52, 77–87. [Google Scholar] [CrossRef]
- Zhang, J.; Li, A. Study on particle deposition in vertical square ventilation duct flows by different models. Energy Convers. Manag. 2008, 49, 1008–1018. [Google Scholar] [CrossRef]
- Zhao, B.; Wu, J. Modeling Particle Deposition from Fully Developed Turbulent Flow in Ventilation Duct. Atmos. Environ. 2006, 40, 457–466. [Google Scholar] [CrossRef]
- Yao, J.; Fairweather, M. Particle deposition in turbulent duct flows. Chem. Eng. Sci. 2012, 84, 781–800. [Google Scholar] [CrossRef]
- Zhao, B.; Chen, J.J. Numerical analysis of particle deposition in ventilation duct. Build. Environ. 2006, 41, 710–718. [Google Scholar] [CrossRef]
- Zhang, Z.; Chen, Q. Prediction of particle deposition onto indoor surfaces by CFD with a modified Lagrangian method. Atmos. Environ. 2009, 43, 319–328. [Google Scholar] [CrossRef] [Green Version]
- Tian, L.; Ahmadi, G. Particle deposition in turbulent duct flows-comparisons of different model predictions. J. Aerosol Sci. 2007, 38, 377–397. [Google Scholar] [CrossRef]
- Gao, N.P.; Niu, J.L.; He, Q.B.; Zhu, T.; Wu, J.Z. Using RANS turbulence models and Lagrangian approach to predict particle deposition in turbulent channel flows. Build. Environ. 2012, 48, 206–214. [Google Scholar] [CrossRef]
- Haber, S.; Yitzhak, D.; Tsuda, A. Characteristics of particle transport in an expanding or contracting alveolated tube. J. Appl. Physiol. 2003, 95, 657–671. [Google Scholar] [CrossRef] [PubMed]
- Lee, D.Y.; Lee, J.W. Characteristics of particle transport in an expanding or contracting alveolated tube. J. Aerosol Sci. 2003, 34, 1193–1215. [Google Scholar] [CrossRef]
- Li, A.; Ahmadi, G.; Bayer, R.G.; Gaynes, M.A. Aerosol particle deposition in an obstructed turbulent duct flow. J. Aerosol Sci. 1994, 25, 91–112. [Google Scholar] [CrossRef]
- Iacono, G.I.; Tucker, P.; Reynolds, A. Predictions for particle deposition from LES of ribbed channel flow. Int. J. Heat Fluid Flow 2005, 26, 558–568. [Google Scholar] [CrossRef]
- Benedetto, A.; Russo, P.; Sanchirico, R.; Sarli, V. CFD simulations of turbulent fluid flow and dust dispersion in the 20 L explosion vessel. AIChE J. 2013, 59, 2485–2496. [Google Scholar] [CrossRef]
- Sarli, V.; Russo, P.; Sanchirico, R.; Benedetto, A. CFD simulations of dust dispersion in the 20 L vessel: Effect of nominal dust concentration. J. Loss Prev. Process Ind. 2014, 27, 8–12. [Google Scholar] [CrossRef]
- Sarli, V.; Russo, P.; Sanchirico, R.; Di Benedetto, A. CFD simulations of the effect of dust diameter on the dispersion in the 20 L bomb. Chem. Eng. Trans. 2013, 31, 727–732. [Google Scholar]
- Lu, H.; Lu, L. Effects of rib spacing and height on particle deposition in ribbed duct air flows. Build. Environ. 2015, 92, 317–327. [Google Scholar] [CrossRef]
- Lu, H.; Lu, L. CFD investigation on particle deposition in aligned and staggered ribbed duct air flows. Appl. Therm. Eng. 2016, 93, 697–706. [Google Scholar] [CrossRef]
- Lu, H.; Lu, L. A numerical study of particle deposition in ribbed duct flow with different rib shapes. Build. Environ. 2015, 94, 43–53. [Google Scholar] [CrossRef]
- FLUENT Inc. FLUENT 12.0 User’s Guide; FLUENT Inc.: Lebanon, NH, USA, 2009. [Google Scholar]
- Kim, J.; Moin, P.; Moser, R. Turbulence statistics in fully developed channel flow at low Reynolds number. J. Fluid Mech. 1987, 177, 133–166. [Google Scholar] [CrossRef]
- Lu, H.; Lu, L. Numerical investigation on particle deposition enhancement in duct air flow by ribbed wall. Build. Environ. 2015, 85, 61–72. [Google Scholar] [CrossRef]
- Fessler, J.R.; Eaton, J.K. Turbulence modification by particles in a backward-facing step flow. J. Fluid Mech. 1999, 394, 97–117. [Google Scholar] [CrossRef]
- Wells, A.C.; Chamberlain, A.C. Transport of small particles to vertical surfaces. Br. J. Appl. Phys. 1967, 18, 1793–1799. [Google Scholar] [CrossRef]
- Liu, B.Y.H.; Agarwal, J.K. Experimental observation of aerosol deposition in turbulent flow. J. Aerosol Sci. 1974, 5, 145–155. [Google Scholar] [CrossRef]
- El-Shobokshy, M.S. Experimental measurements of aerosol deposition to smooth and rough surfaces. Atmos. Environ. 1983, 17, 639–644. [Google Scholar] [CrossRef]
- Friedlander, S.K.; Johnstone, H.F. Deposition of suspended particles from turbulent gas streams. Ind. Eng. Chem. 1957, 49, 1151–1156. [Google Scholar] [CrossRef]
- Lee, K.W.; Gieseke, J.A. Deposition of particles in turbulent pipe flows. J. Aerosol Sci. 1994, 25, 699–709. [Google Scholar] [CrossRef]
Figure 1.
Schematic of particle deposition in uniform and BFS duct flows.
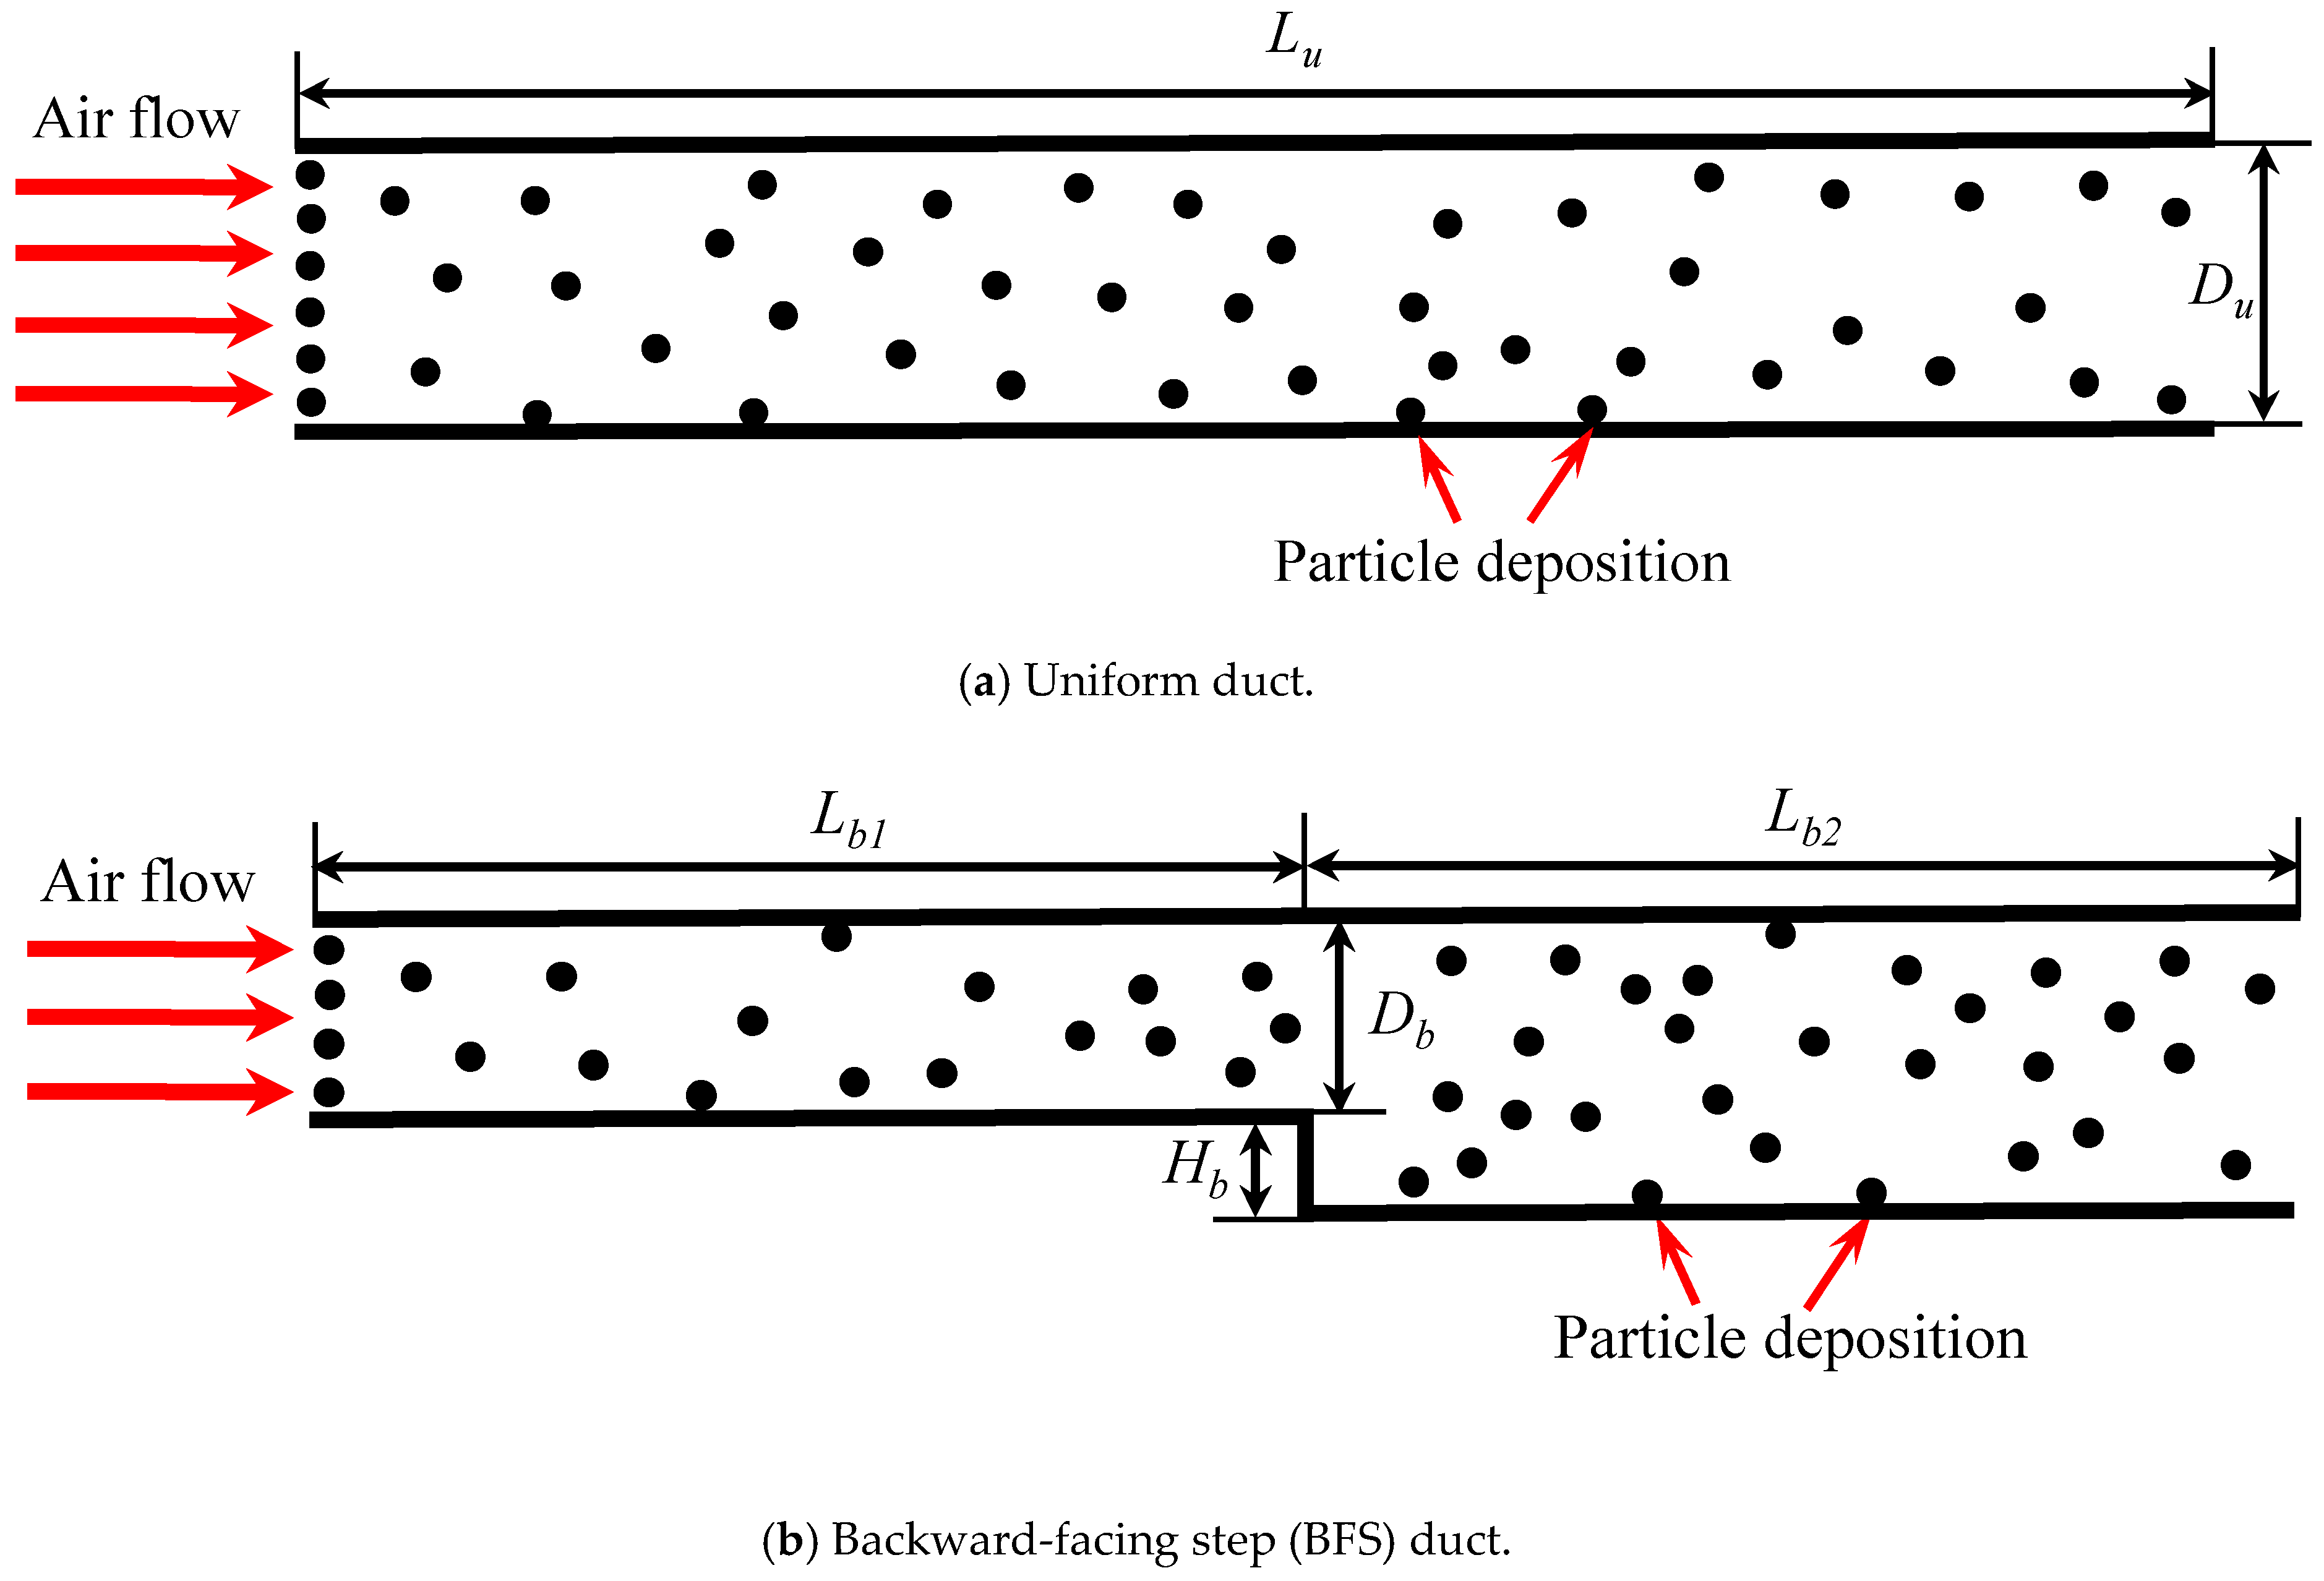
Figure 2.
Computational meshes for BFS duct with different expansion ratios.

Figure 3.
Grid independence test for uniform duct case.
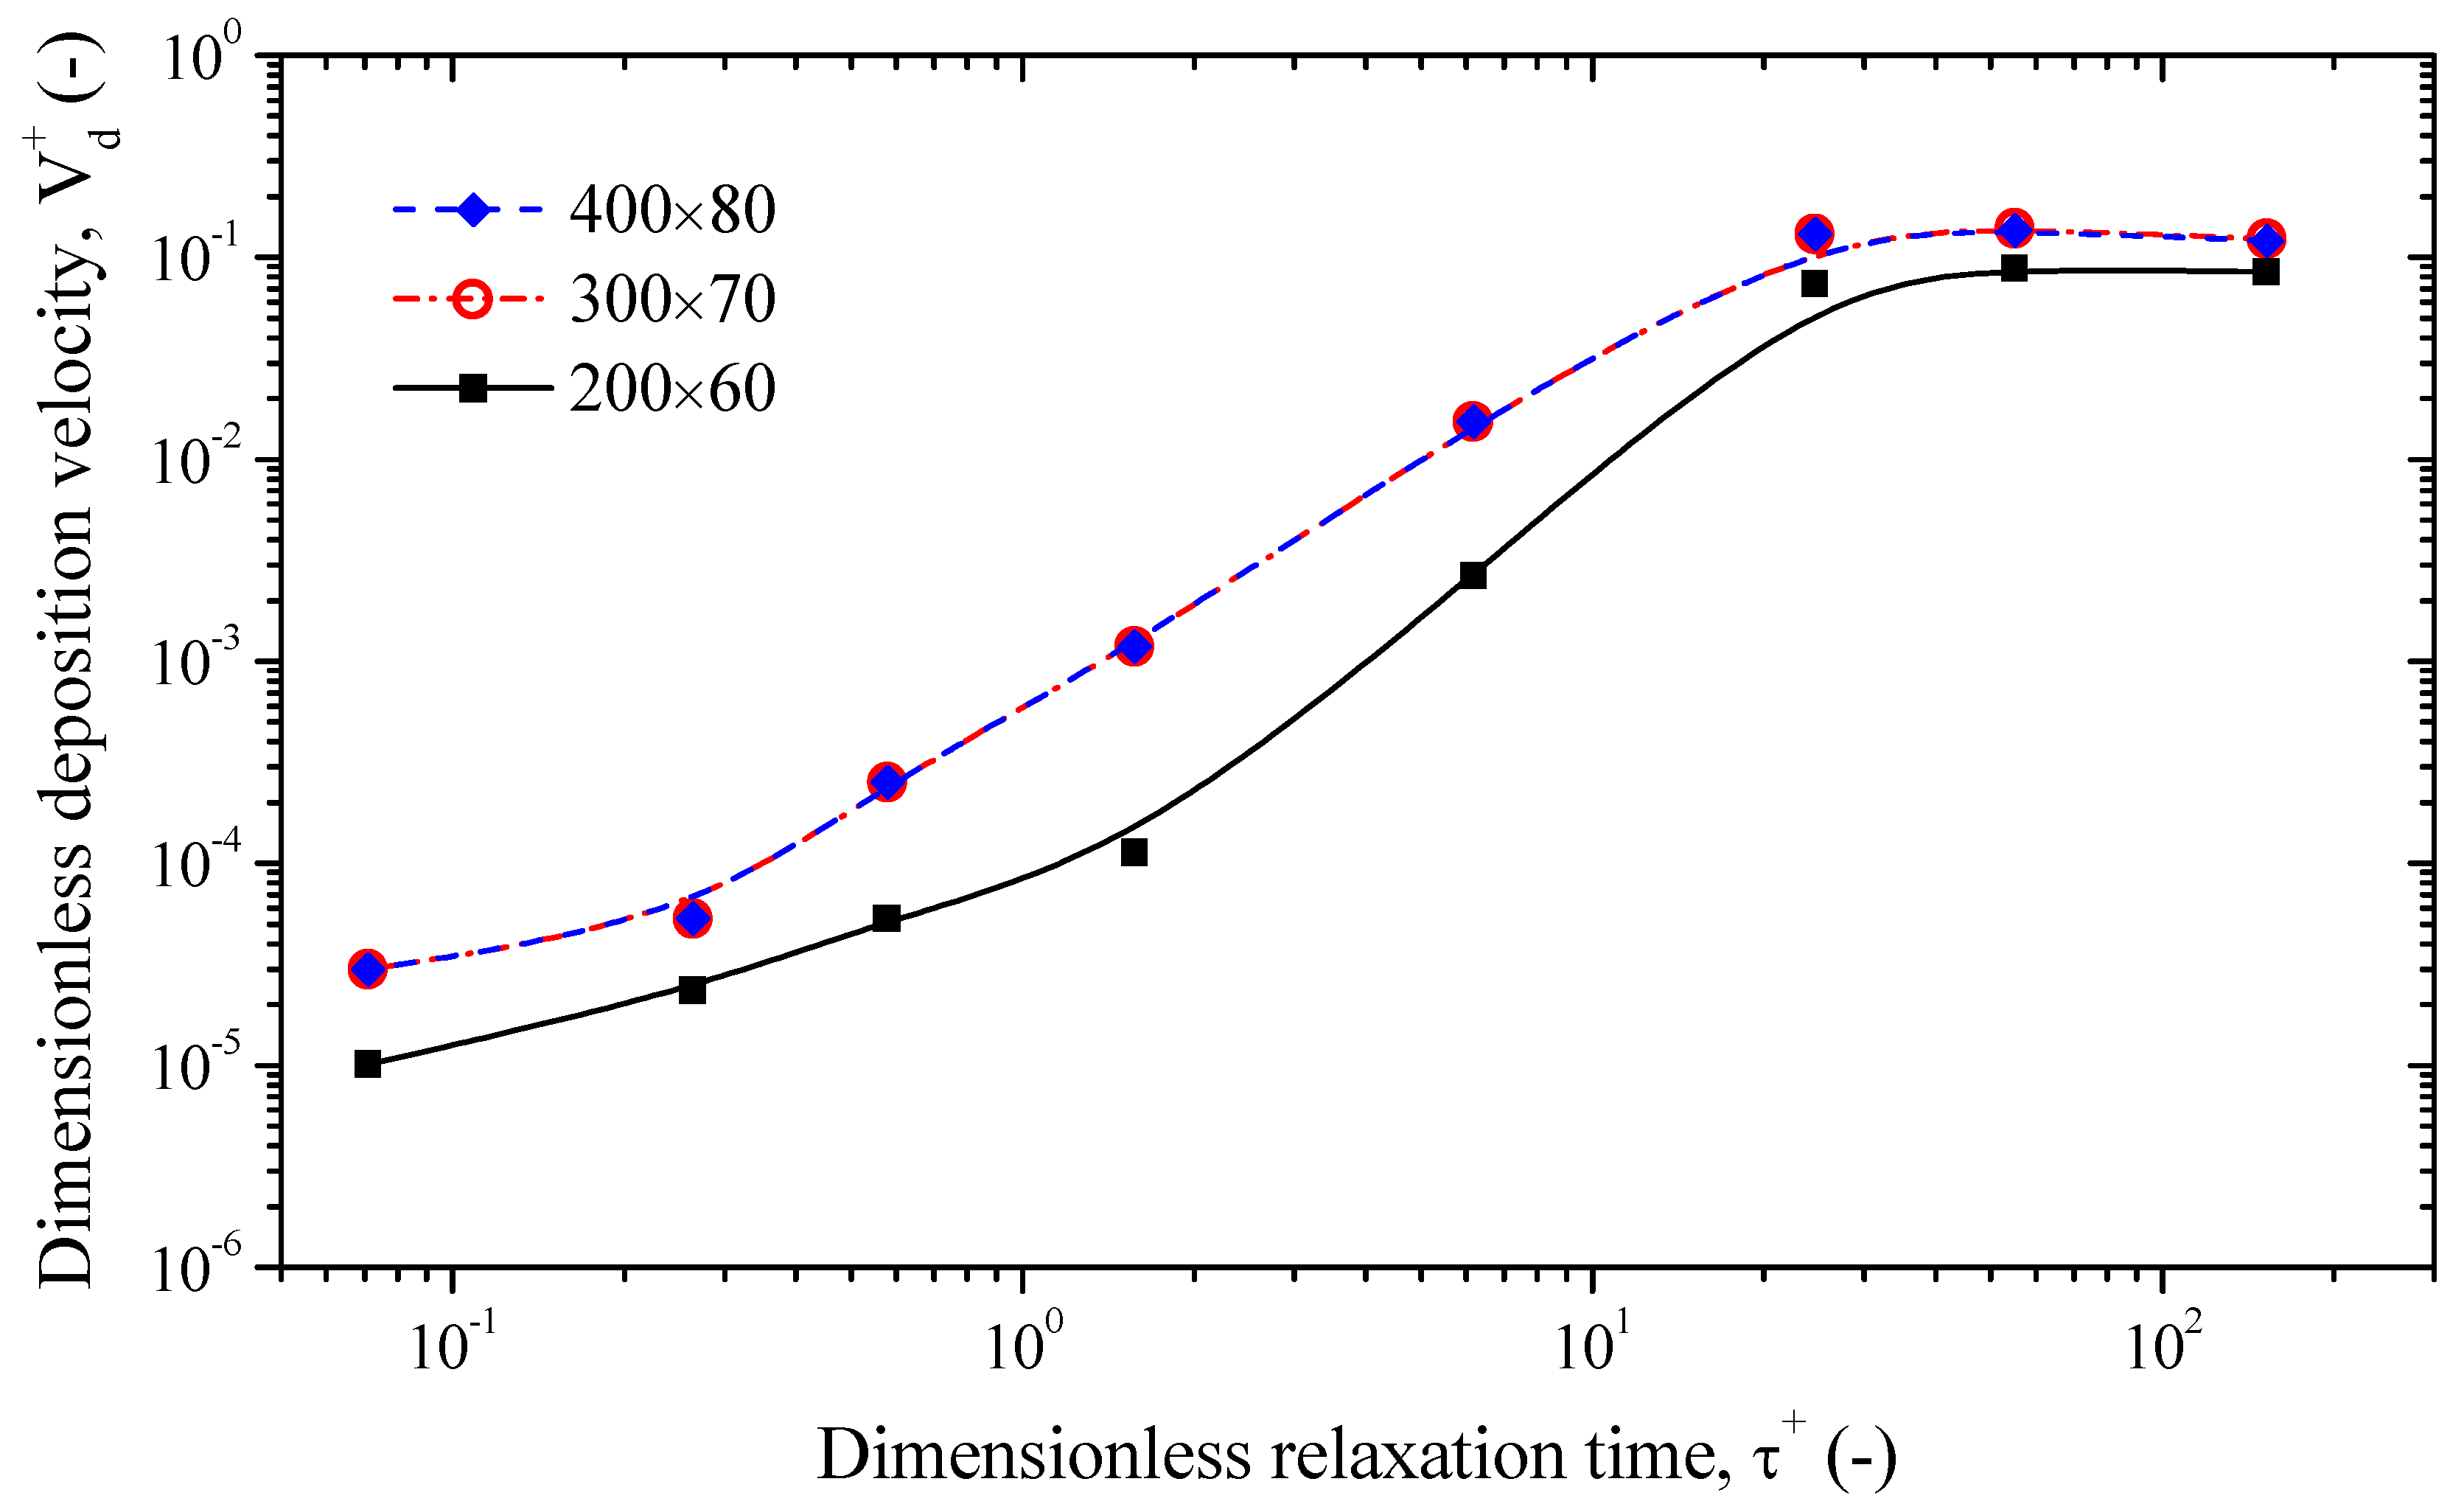
Figure 4.
Numerical verification of air streamwise velocity and particle deposition velocity.

Figure 5.
Effect of expansion ratio on deposition velocity in the BFS duct.
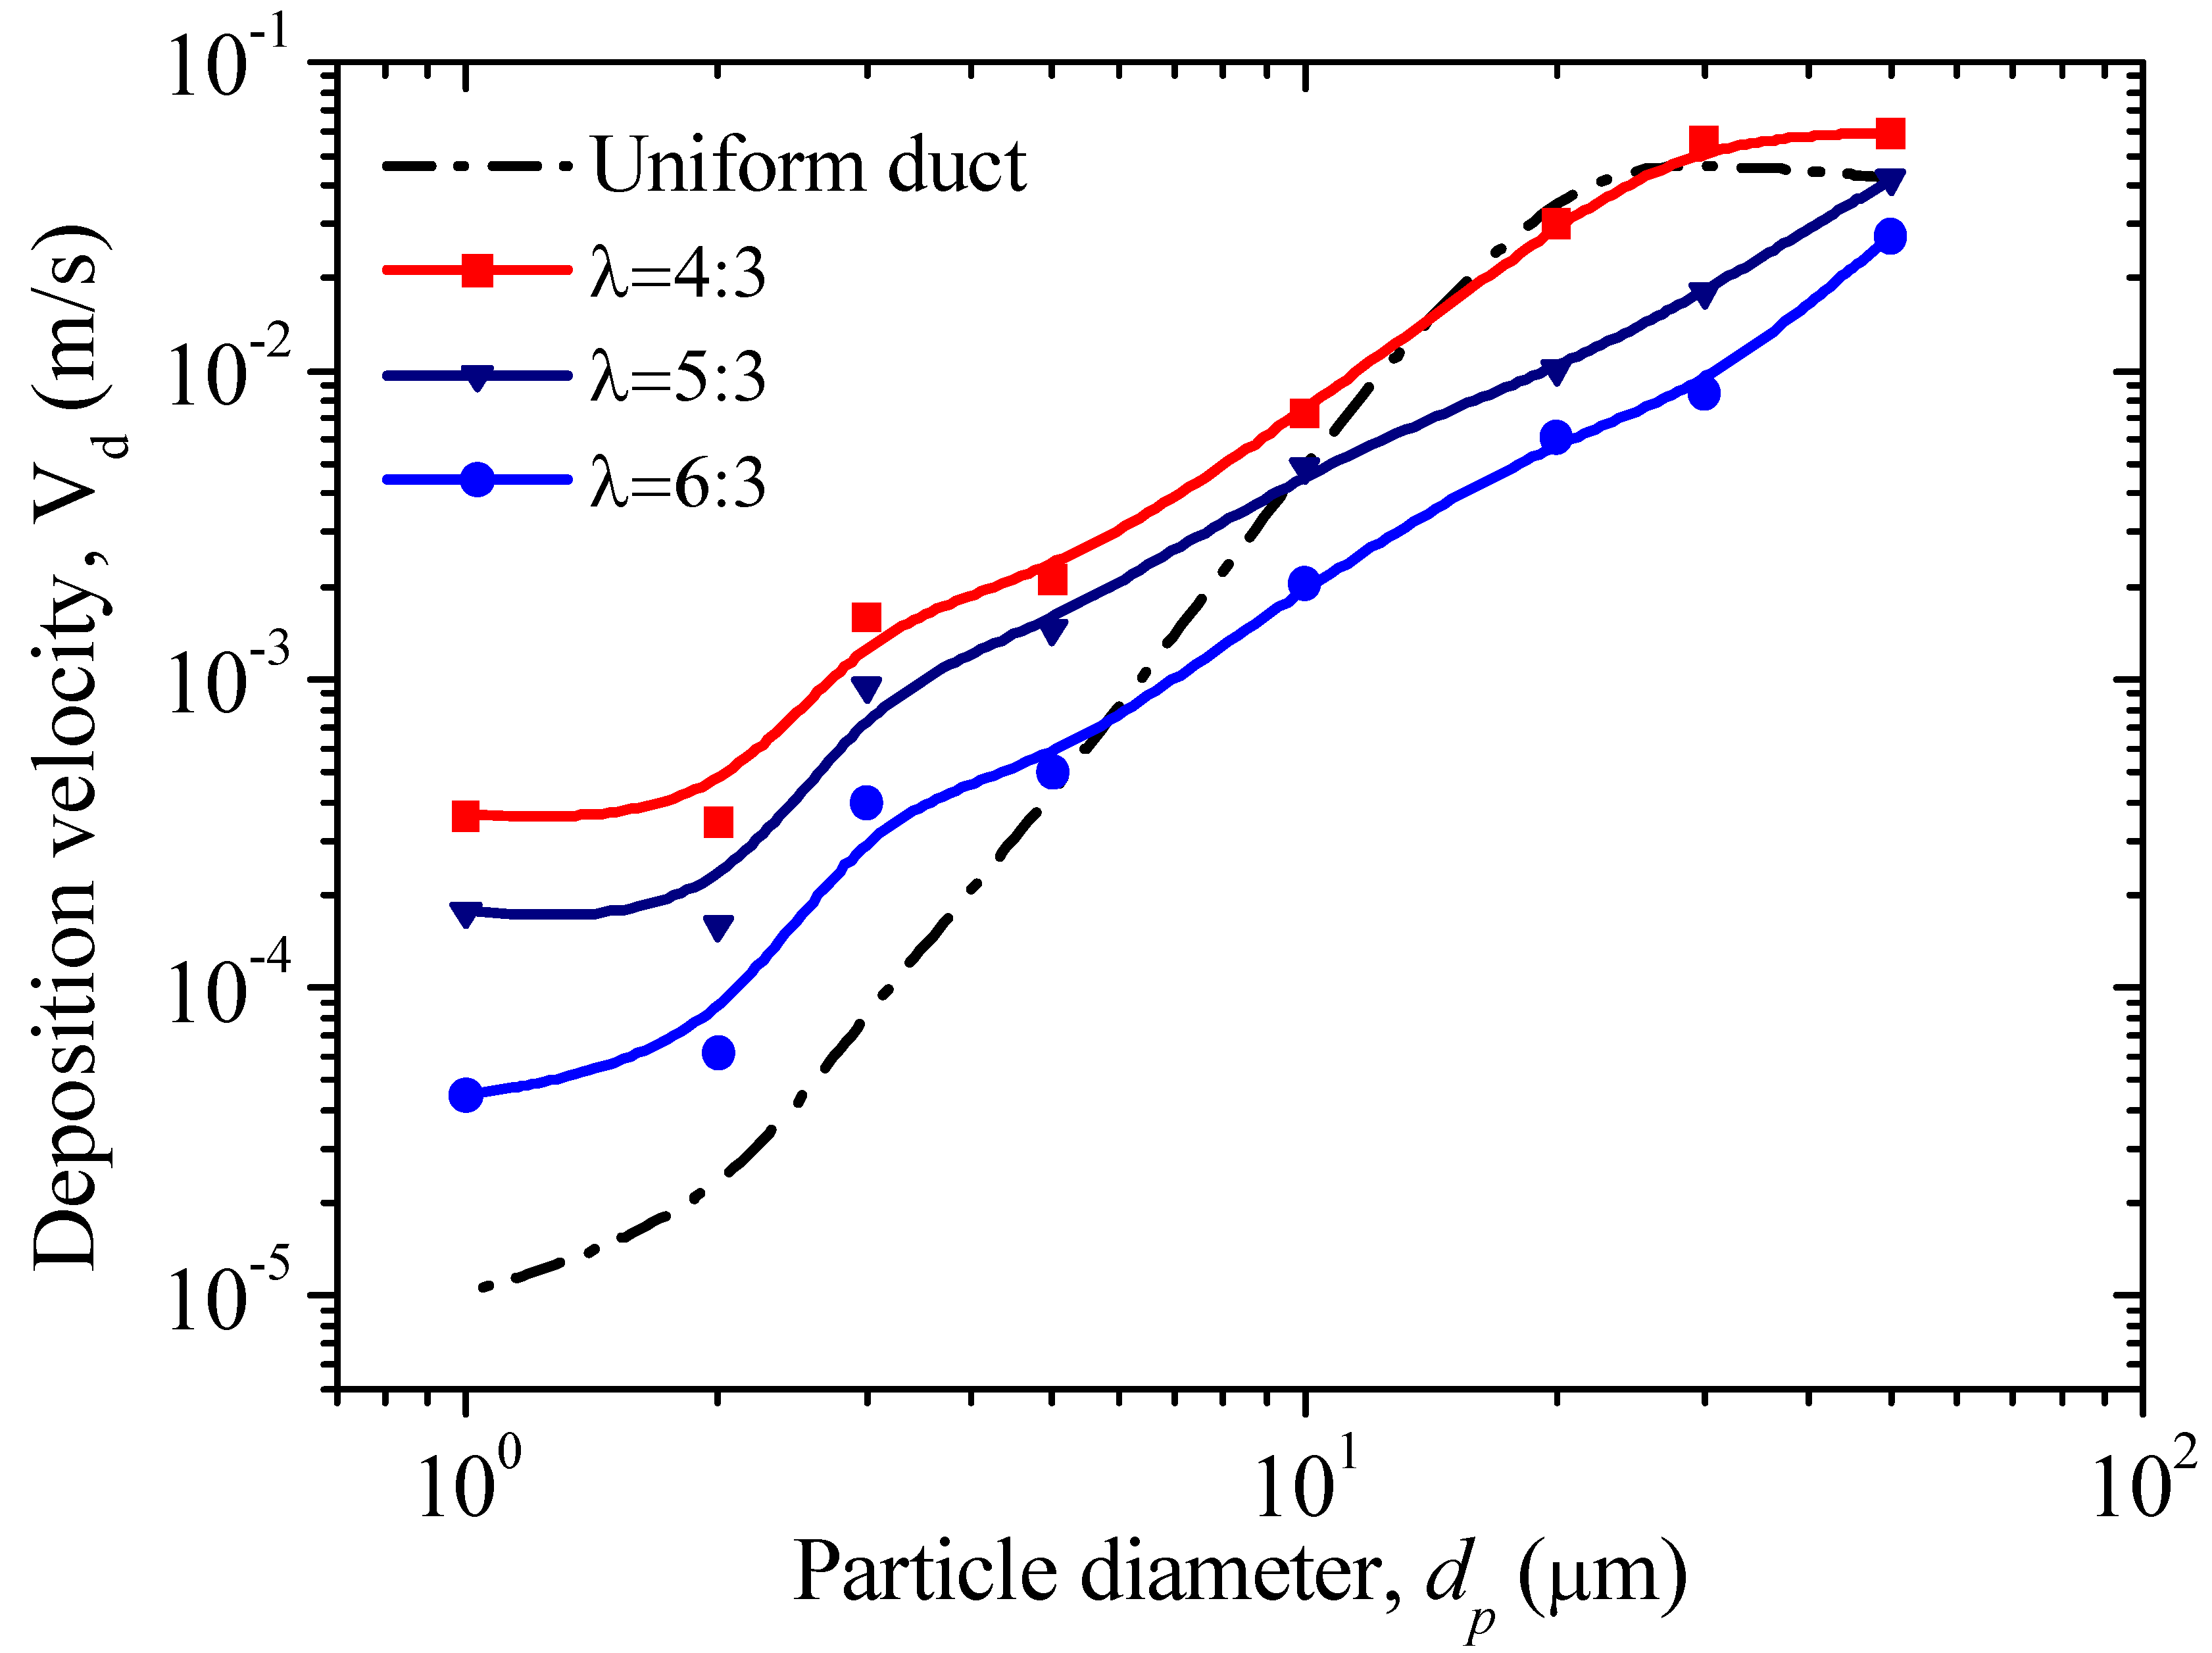
Figure 6.
Effect of air velocity on deposition velocity in BFS dust.
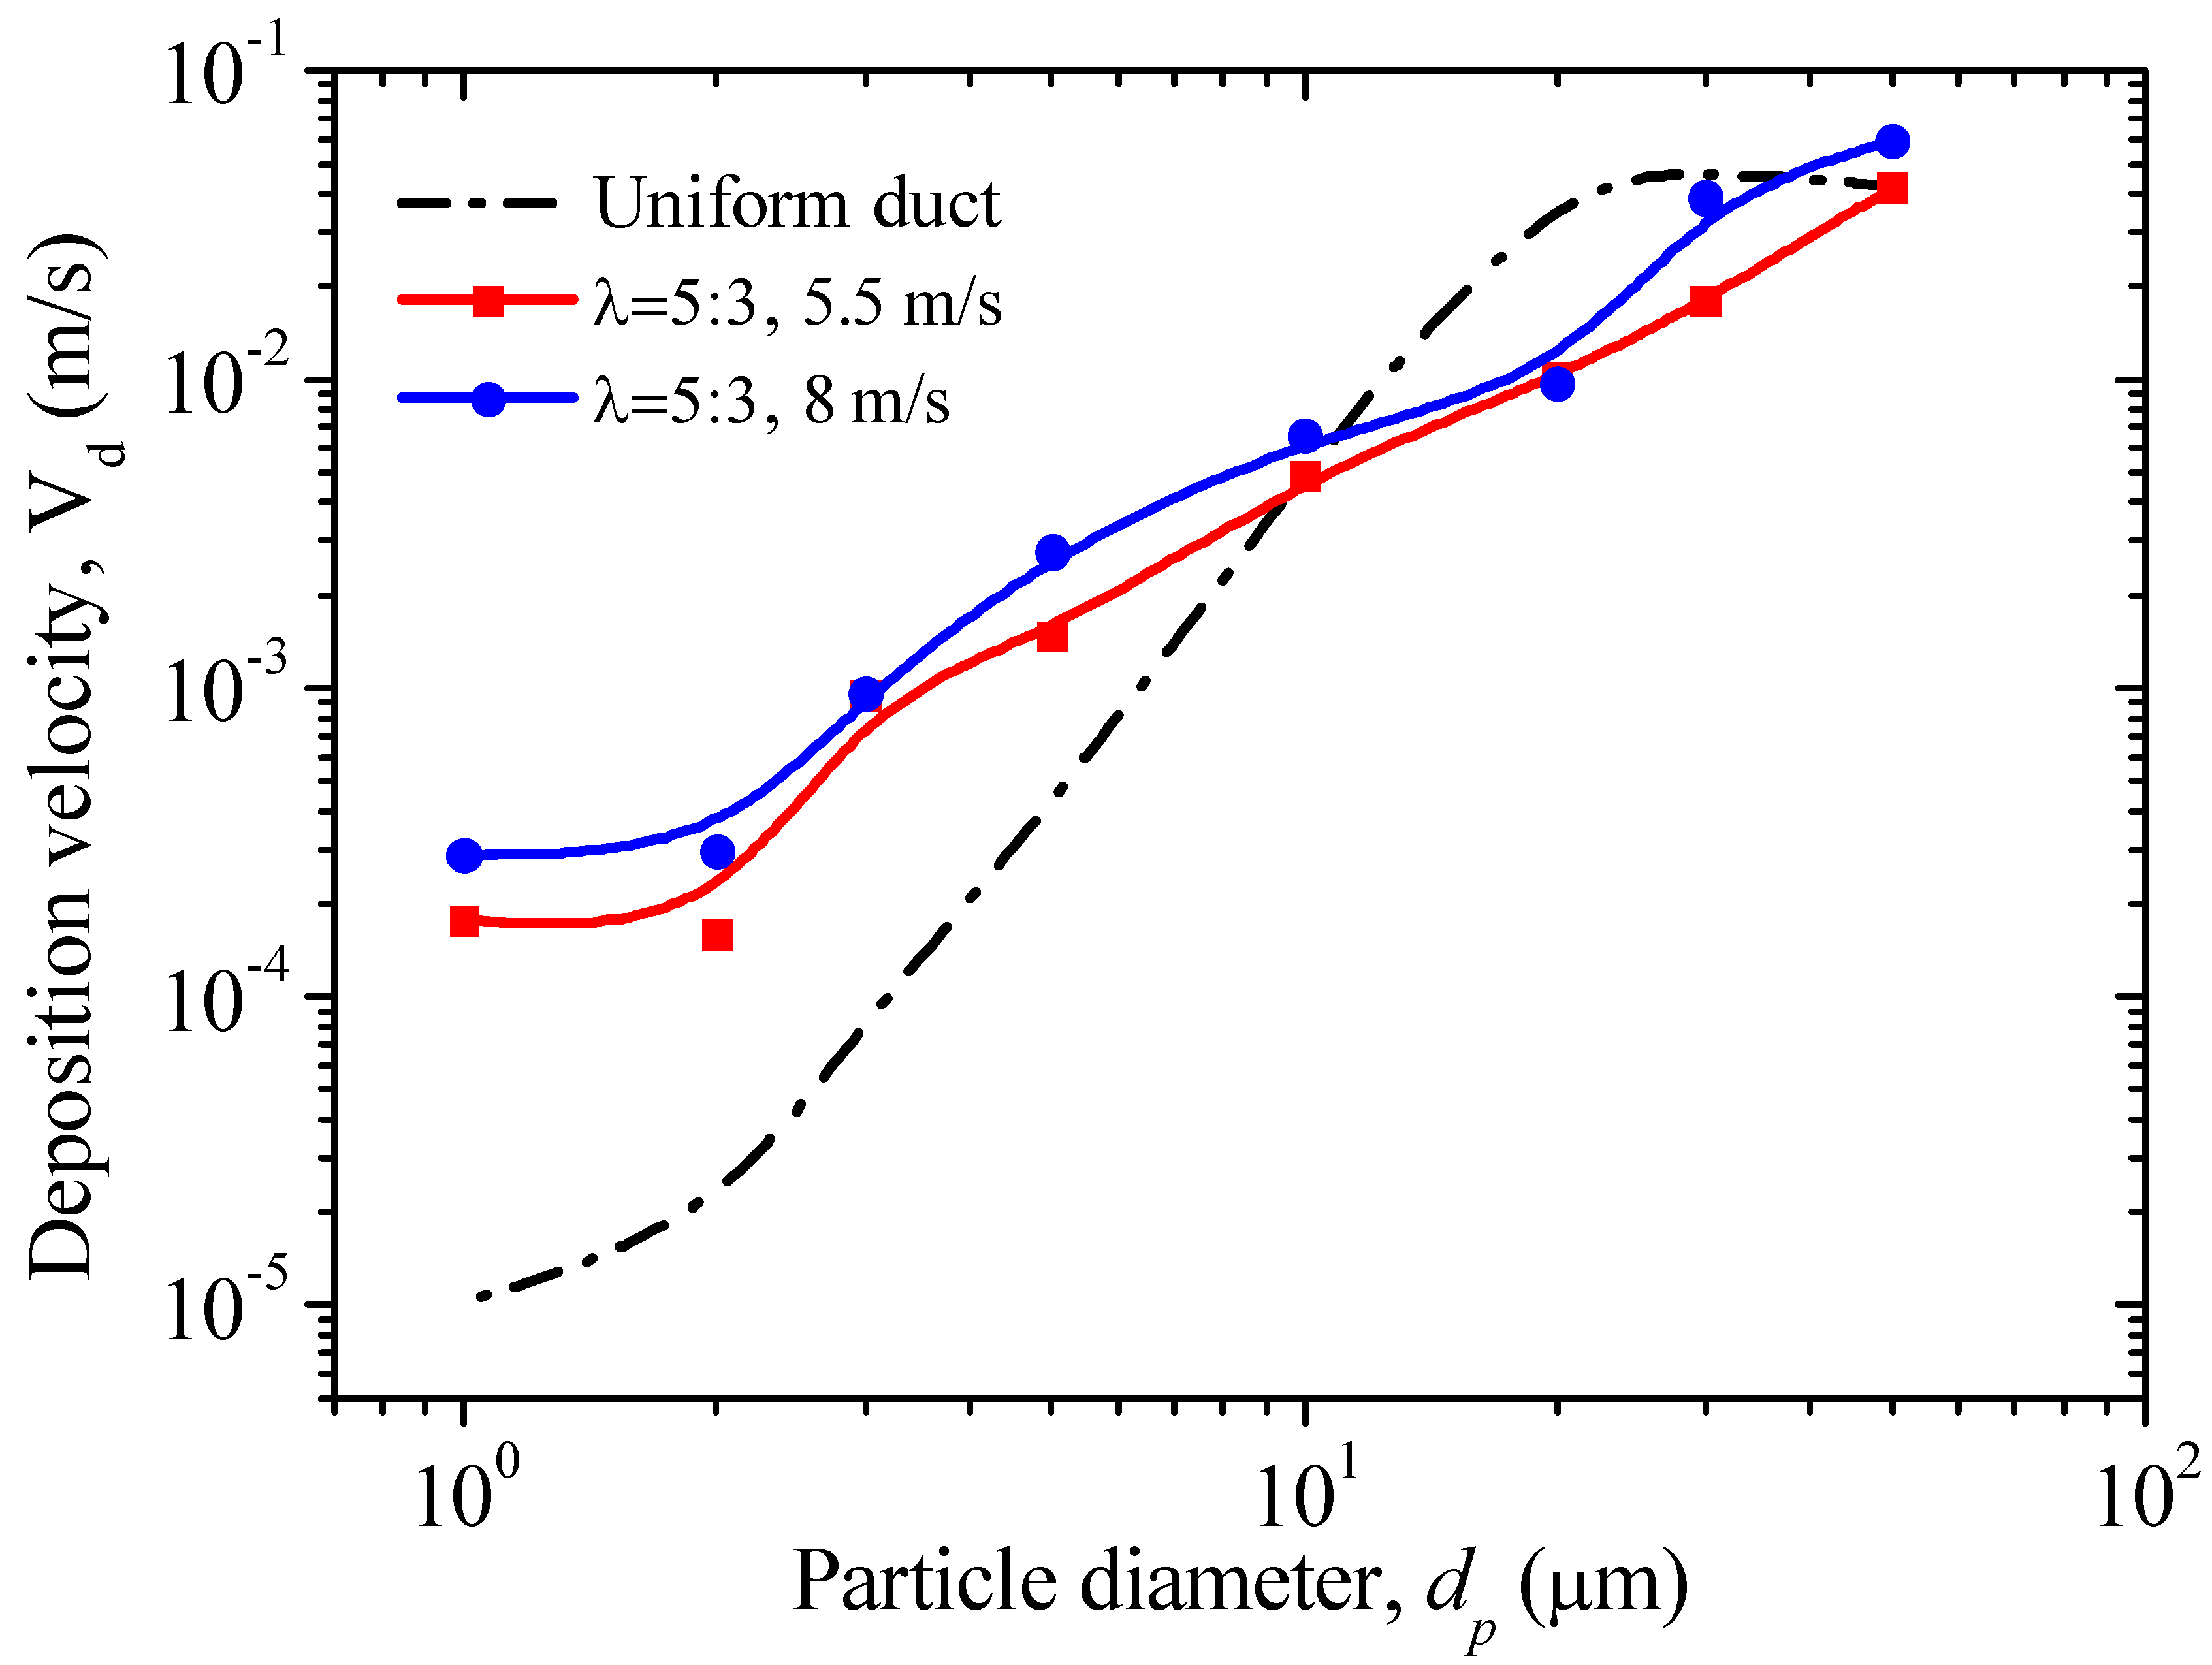
Figure 7.
Flow drags of uniform and BFS ducts.

Figure 8.
Deposition efficiency in BFS ducts with different expansion ratios.
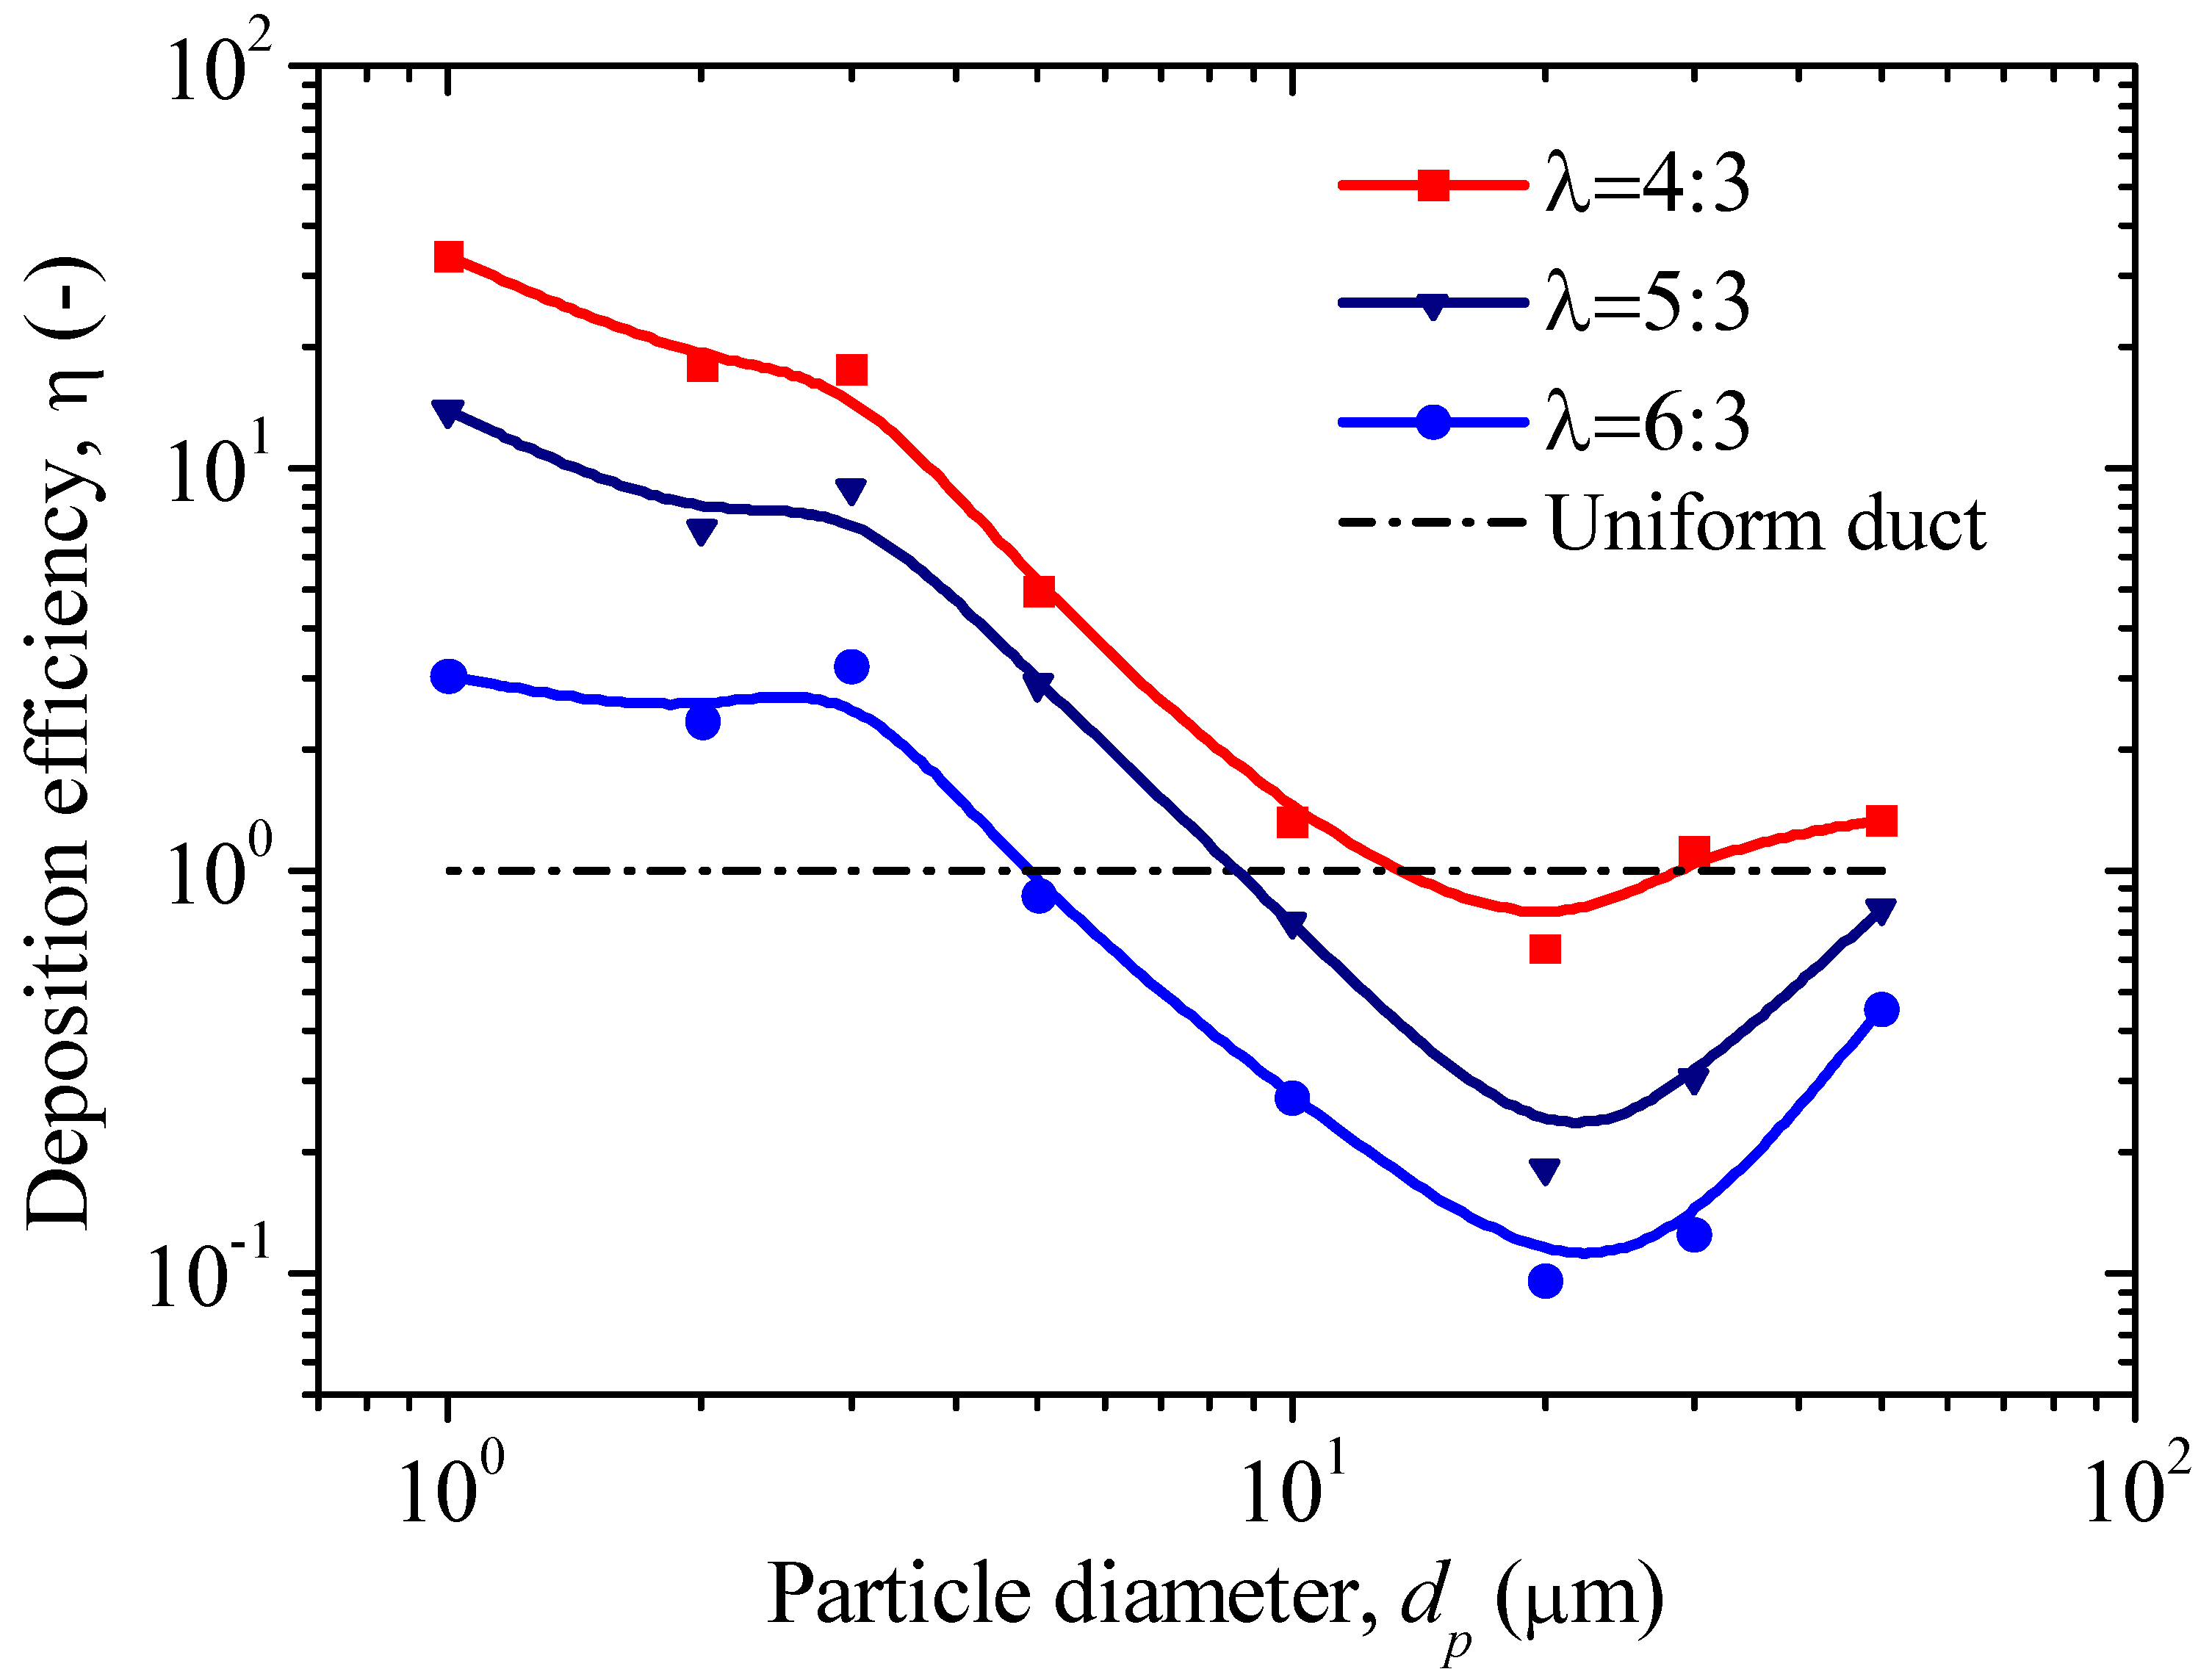
Figure 9.
Deposition efficiency in BFS ducts with different air flow velocities.
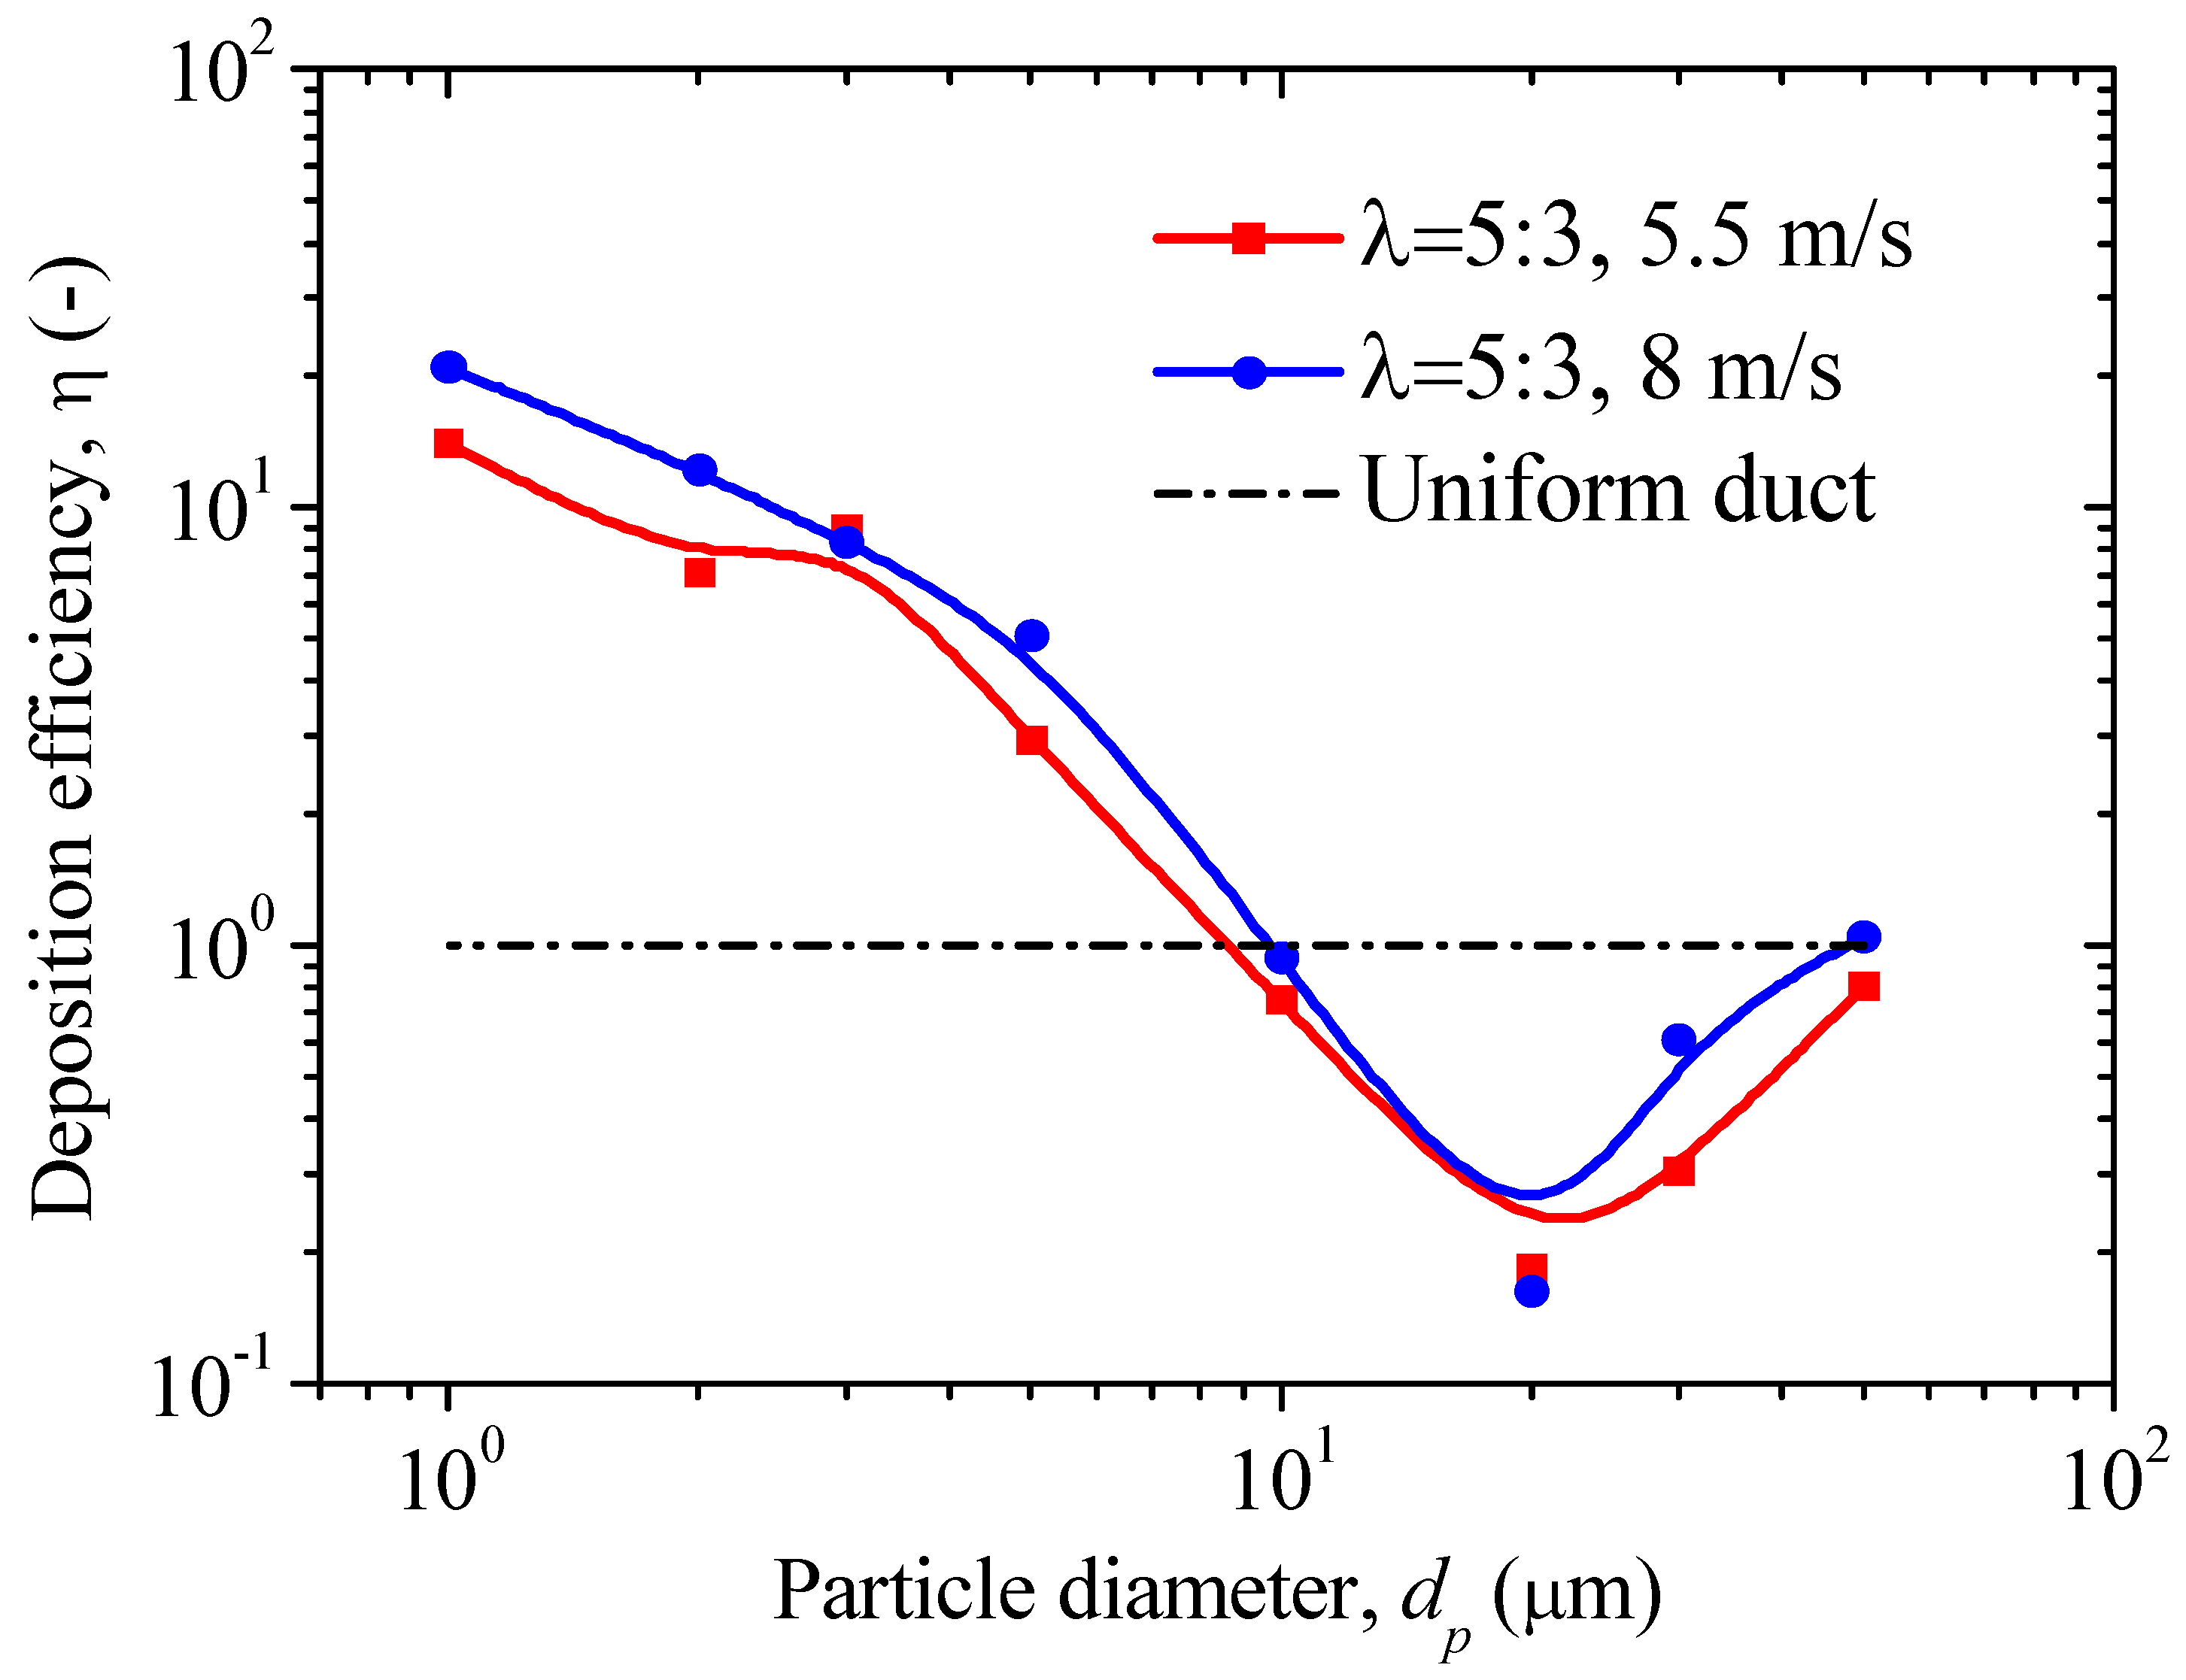
Figure 10.
TKE distribution and particle trajectories in BFS duct of λ = 4:3.
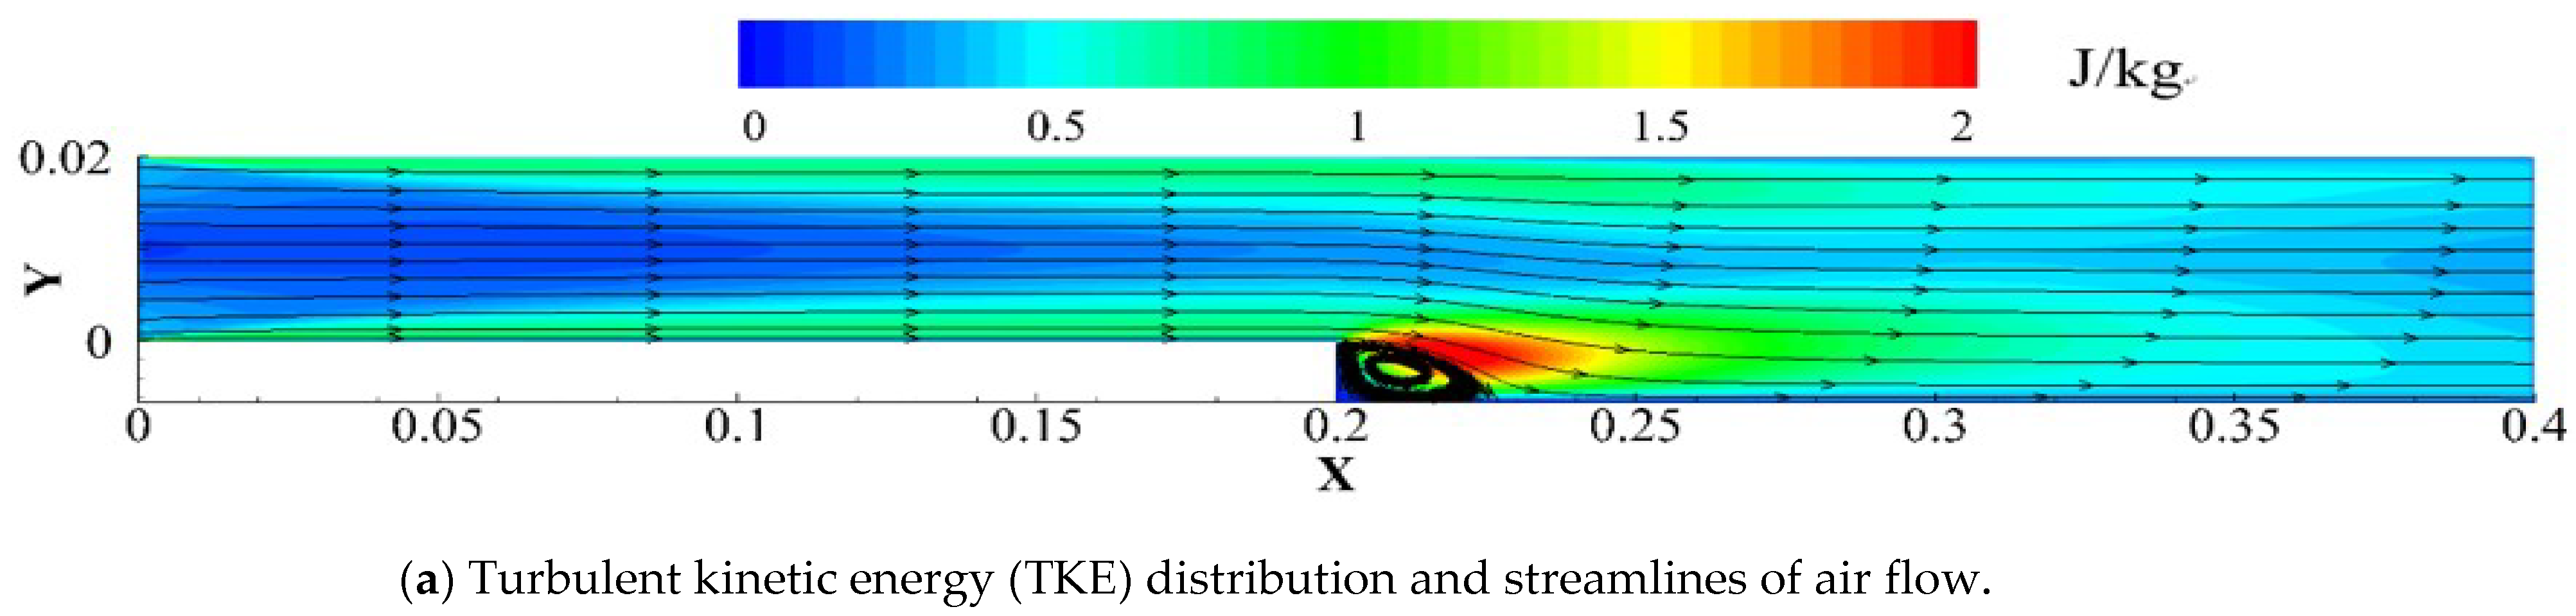
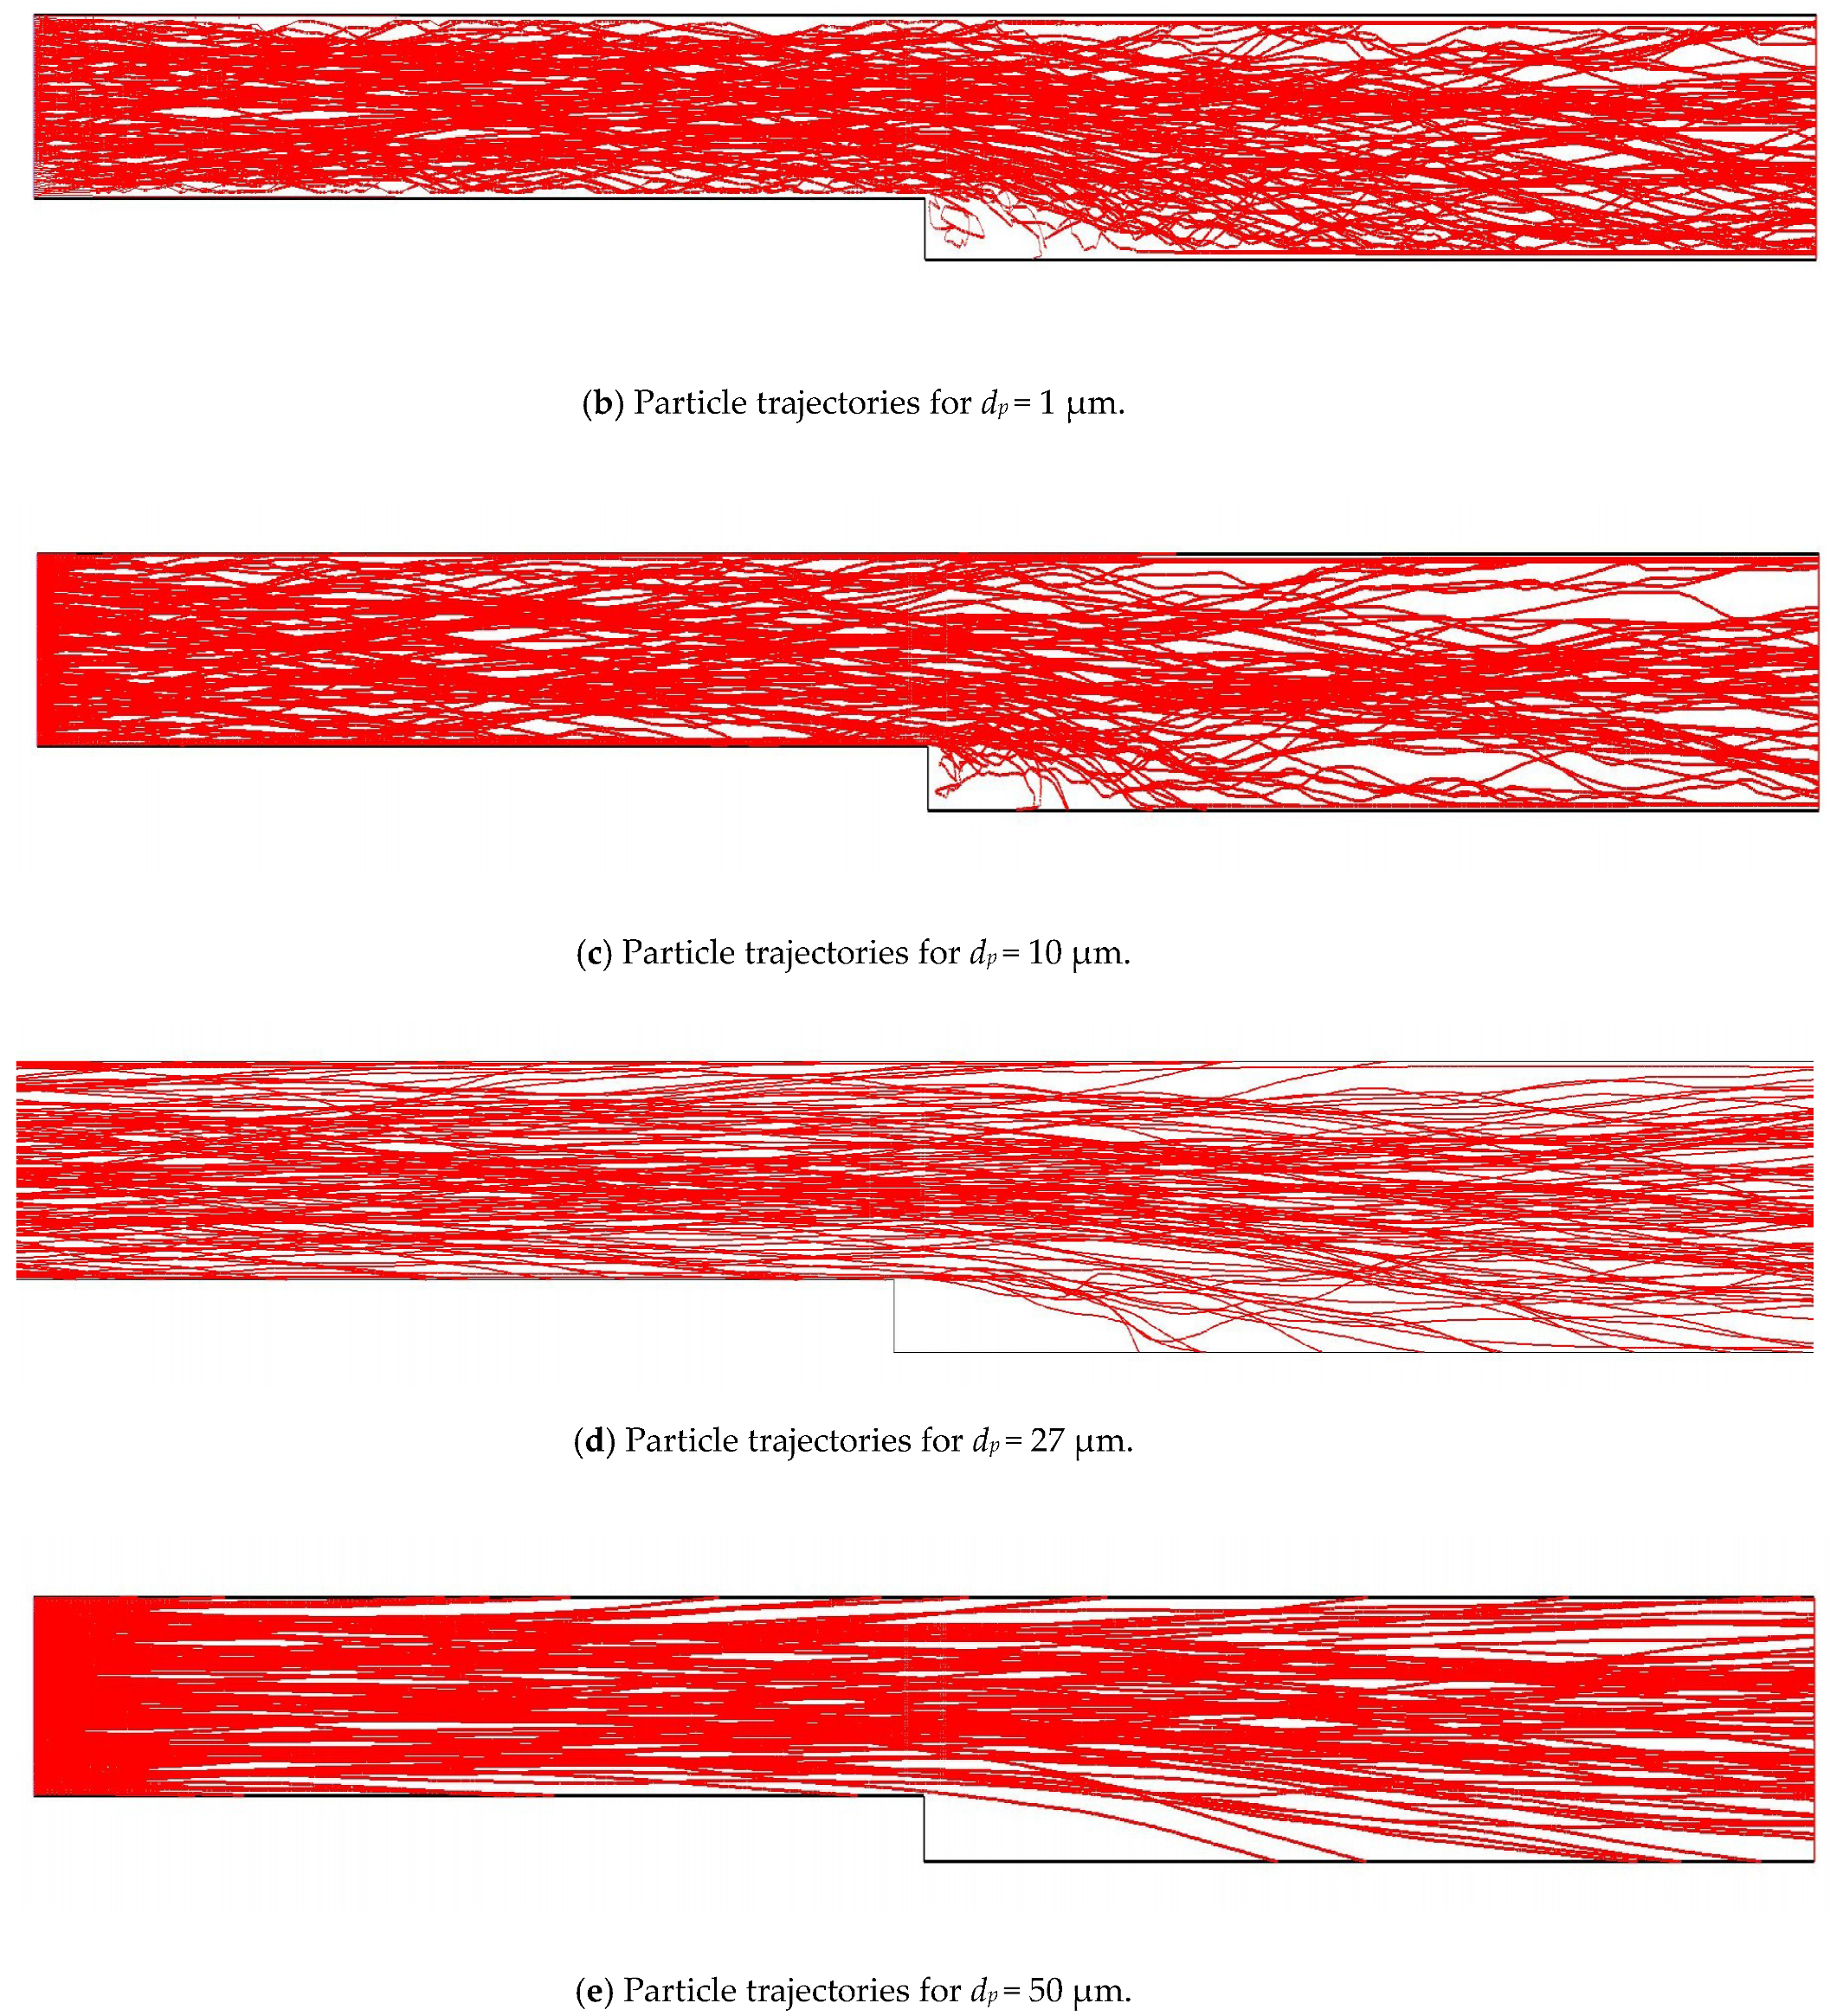
Figure 11.
TKE distribution and particle trajectories in BFS duct of λ = 6:3.

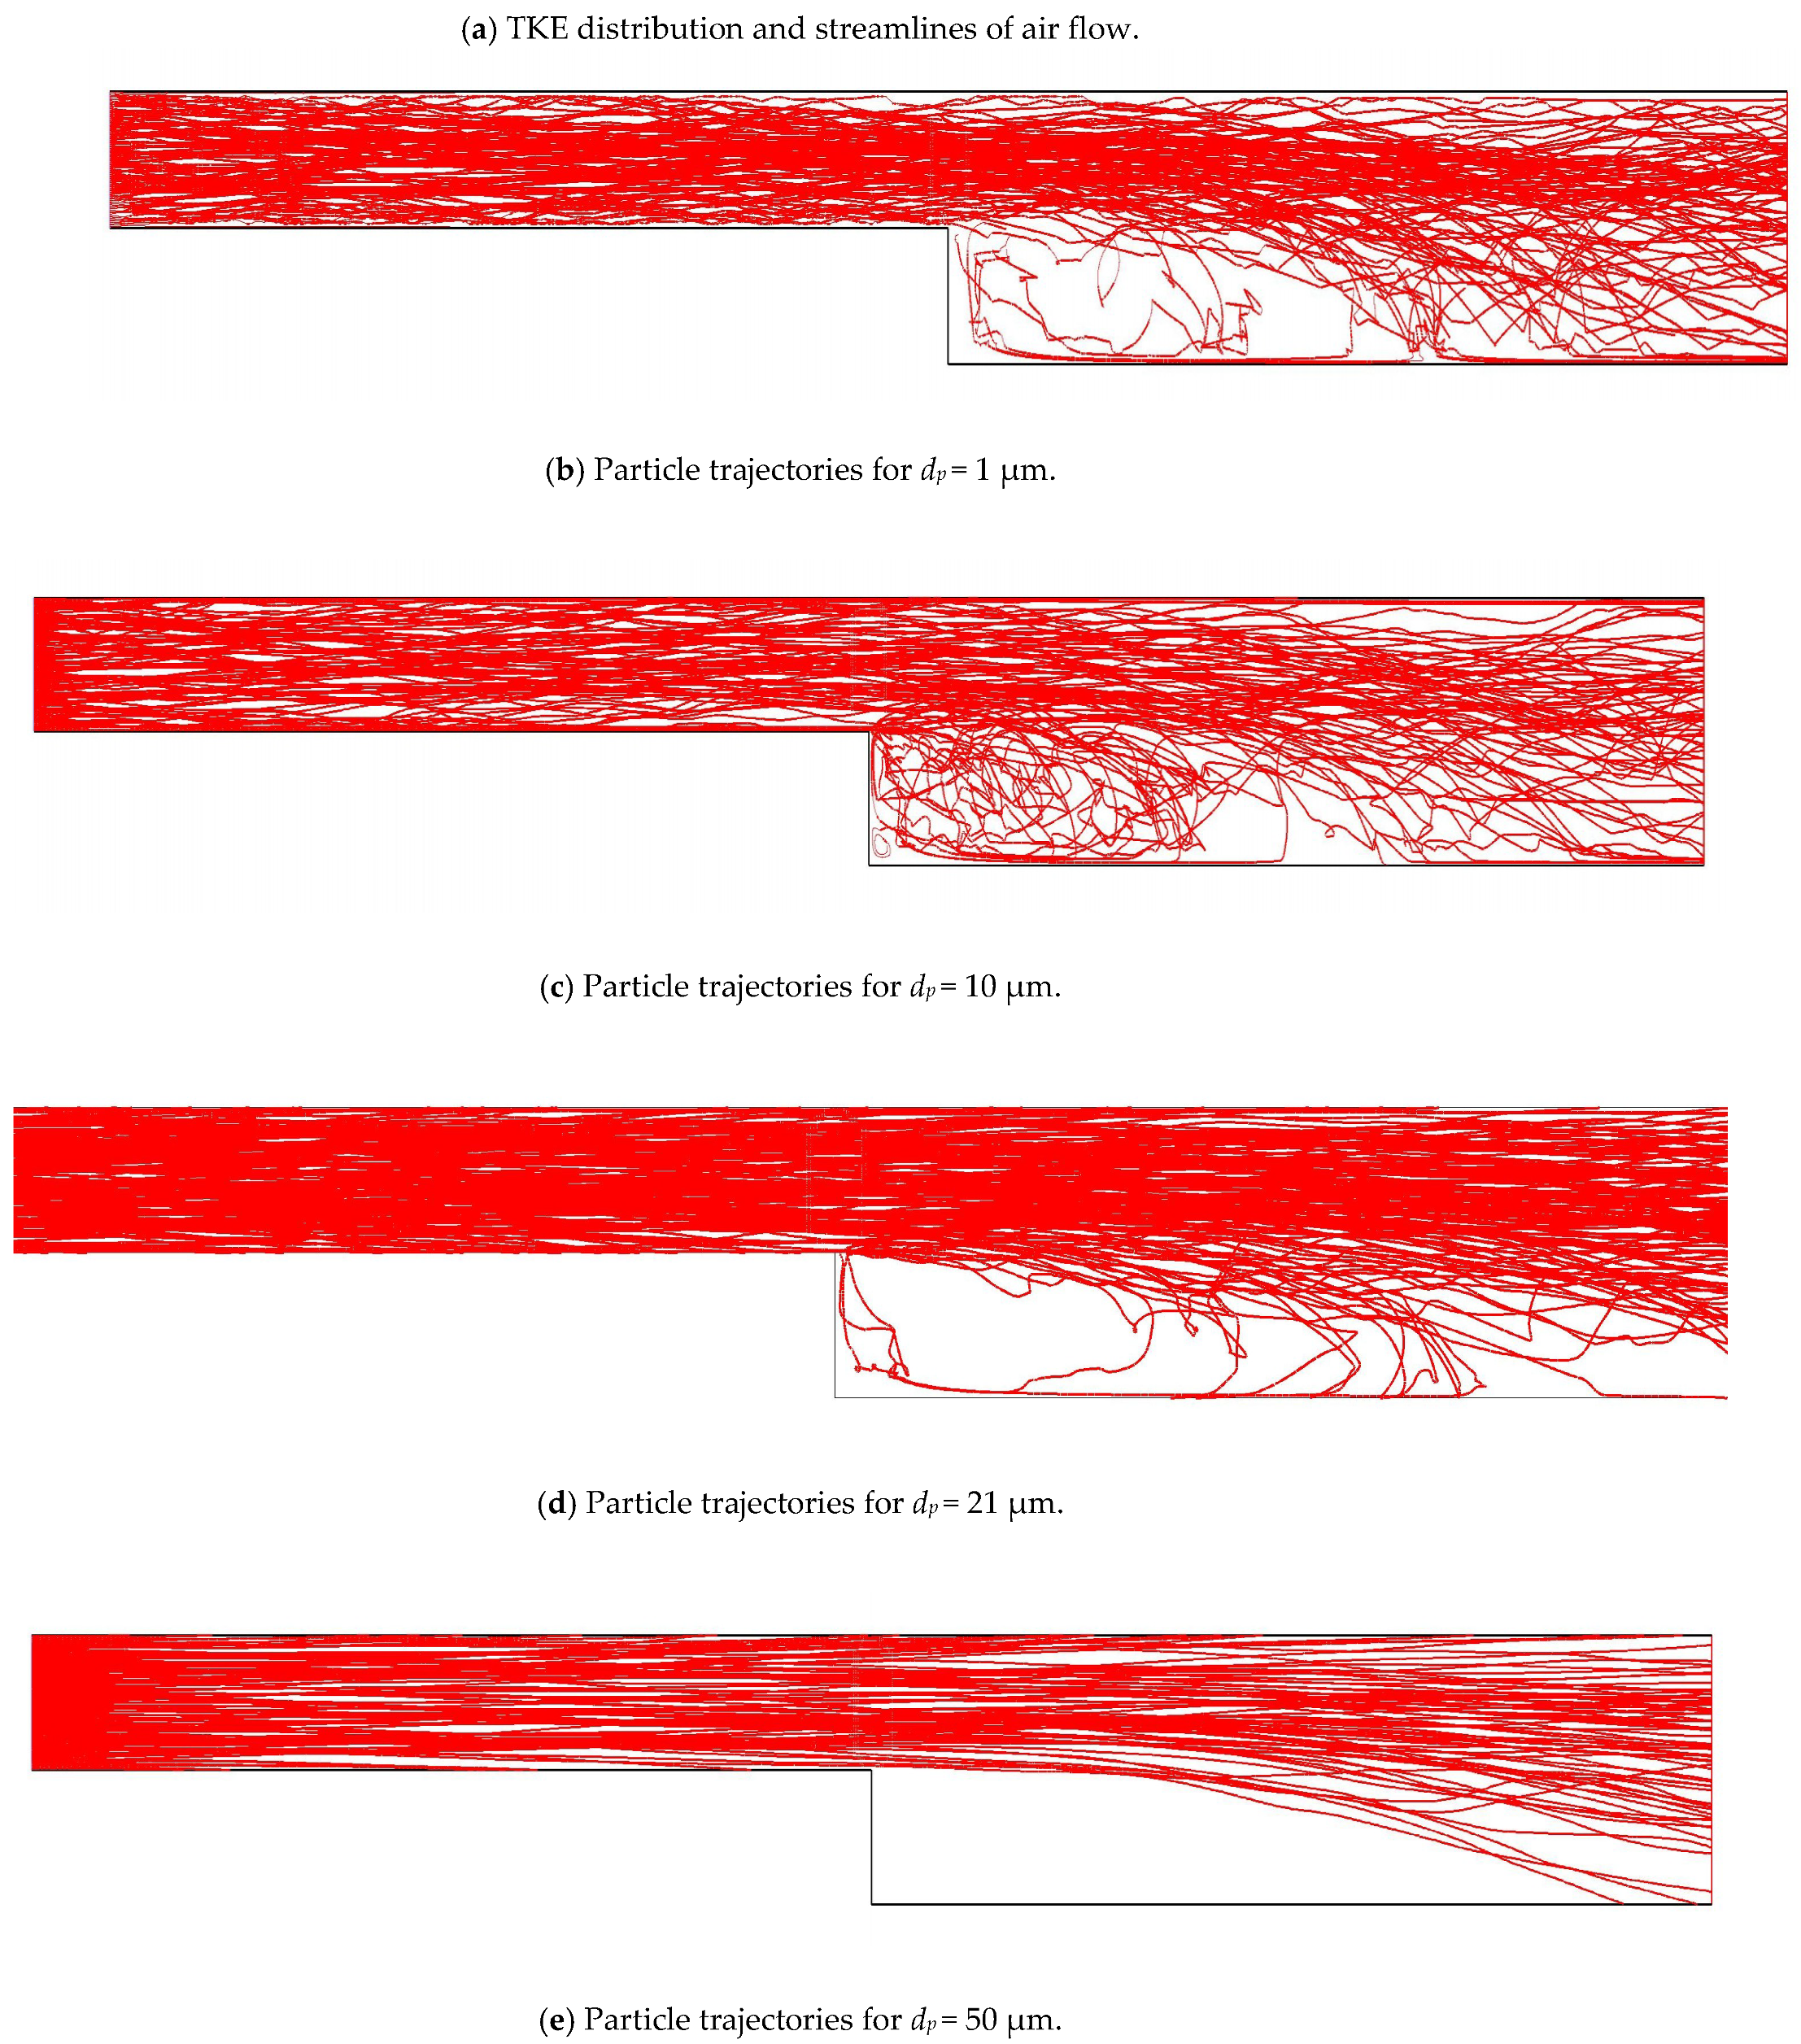
Figure 12.
The critical particle diameters of the “particle free zone” for different λ in BFS flow.

© 2019 by the authors. Licensee MDPI, Basel, Switzerland. This article is an open access article distributed under the terms and conditions of the Creative Commons Attribution (CC BY) license (http://creativecommons.org/licenses/by/4.0/).
Share and Cite
MDPI and ACS Style
Lu, H.; Zhang, L.-z. Particle Deposition Characteristics and Efficiency in Duct Air Flow over a Backward-Facing Step: Analysis of Influencing Factors. Sustainability 2019, 11, 751. https://doi.org/10.3390/su11030751
AMA Style
Lu H, Zhang L-z. Particle Deposition Characteristics and Efficiency in Duct Air Flow over a Backward-Facing Step: Analysis of Influencing Factors. Sustainability. 2019; 11(3):751. https://doi.org/10.3390/su11030751
Chicago/Turabian StyleLu, Hao, and Li-zhi Zhang. 2019. "Particle Deposition Characteristics and Efficiency in Duct Air Flow over a Backward-Facing Step: Analysis of Influencing Factors" Sustainability 11, no. 3: 751. https://doi.org/10.3390/su11030751
Note that from the first issue of 2016, this journal uses article numbers instead of page numbers. See further details here.