Systemic Functions Evaluation based Technological Innovation System for the Sustainability of IoT in the Manufacturing Industry


1
Department of Technology Management for Innovation, The University of Tokyo, 7-3-1 Hongo, Bunkyo-ku, Tokyo 113-8656, Japan
2
Department of Industrial Education, National Taiwan Normal University, Taipei 106, Taiwan
*
Author to whom correspondence should be addressed.
Sustainability 2019, 11(8), 2342; https://doi.org/10.3390/su11082342
Submission received: 17 March 2019
/
Revised: 5 April 2019
/
Accepted: 8 April 2019
/
Published: 18 April 2019
(This article belongs to the Special Issue Methodologies and Applications of Multiple Criteria Decision Making for Sustainable Development)
Abstract
:Technological innovations are regarded as the tools that can stimulate economic growth and the sustainable development of technology. In recent years, as technologies based on the internet of things (IoT) have rapidly developed, a number of applications based on IoT innovations have emerged and have been widely adopted by various public and private sectors. Applications of IoT in the manufacturing industry, such as manufacturing intelligence, not only play a significant role in the enhancement of industrial competitiveness and sustainability, but also influence the diffusion of innovative applications that are based on IoT innovations. It is crucial for policy makers to understand these potential reasons for stimulating IoT industrial sustainability, as they can facilitate industrial competitiveness and technological innovations using supportive means, such as government procurement and financial incentives. Therefore, there is a need to ascertain different factors that may affect IoT industrial sustainability and further explore the relationship between these factors. However, finding a set of factors that affects IoT industrial sustainability is not easy. Recently, the robustness of a theoretical framework, termed the technological innovation system (TIS), has been verified and has been used to explore and analyze technological and industrial development. Thus, it is suitable for this research to use this theoretical model. In order to find out appropriate factors and accurately analyze the causality among factors that influence IoT industrial sustainability, this research presents a Bayesian rough Multiple Criteria Decision Making (MCDM) model based on TIS functions by integrating random forest (RF), decision making trial and evaluation (DEMATEL), Bayesian theory, and rough interval numbers. The proposed analytical framework is validated by an empirical case of defining the causality between TIS functions to enable the industrial sustainability of IoT in the Taiwanese smart manufacturing industry. Based on the empirical study results, the cause group consists of entrepreneurial activities, knowledge development, market formation, and resource mobilization. The effect group is composed of knowledge diffusion through networks’ guidance of the search, and creation of legitimacy. Moreover, the analytical results also provide several policy suggestions promoting IoT industrial sustainability that can serve as the basis for defining innovation policy tools for Taiwan and late coming economies.
1. Introduction
In the era of cloud computing, Internet applications have ubiquitously influenced our daily lives. By using advanced Internet technology and other combinations of technology, communication between people and machines will become even more diverse. Such features are called the internet of things (IoT), which can be conceptually defined as a dynamic global network infrastructure with self-configuration capabilities [1]. According to IDC, one of the leading market research institutes in the world, the IoT market is expected to reach 1.2 trillion by 2022, with an annual growth rate of 13.6% during 2017 to 2022 [2]. IoT will be the next dominant information technology (IT) that will significantly influence the welfare of human beings in areas, such as healthcare, supply chain management, energy savings, smart control, intelligent buildings, product lifecycle management, and many others.
With the fast-growing development of IoT technology, a variety of technological applications are currently shaping different aspects of industrial development. For example, the realization of unmanned factories relies on the IoT to connect robotics and machine learning. Such IoT-based systems will save lots of resources, such as manpower. From the long-term perspective, industrial IoT development will be sustainable whereas most related technological applications and industries will significantly change. Thus, the sustainable development of the IoT industry has become an indispensable task for advanced countries and emerging economies, as it will be capable of influencing industrial competitiveness and national economic growth. This also implies that national governments of leading and emerging economies must effectively promote IoT development and enable IoT industrial sustainability by supportive means, such as financial incentives. However, prior to defining a set of innovation policies to help novel technology innovation, understanding the key factors that influence IoT industrial sustainability is indispensable. By figuring out the intertwined relationships between factors that influence IoT industrial sustainability, policy makers will be able to clearly design effective innovation policies to solve current challenges in technological and industrial development. Hence, it is necessary to define different factors that may enable industrial sustainability of IoT and to explore the causality between these factors.
Sustainability is defined as the capability to endure and maintain development in terms of environment, economic, and social responsibilities. Activities related to sustainability are seen as transition processes that include sustainable technological transitions, industrial transformation, and socio-technical change [3]. Socio-technical change is stimulated by the mutual facilitation of technical changes and social changes; technological changes always co-evolve with changes in the social system. Technological innovation is a key process of sustainable socio-technical change, which determines industrial sustainability [4]. The technological innovation system (TIS) is an important theoretical framework that plays a critical role in analyzing technological innovation. The TIS is defined as a network of agents interacting in economic or industrial areas under a particular institutional infrastructure that is involved in the generation, diffusion, and utilization of technology [5]. In the TIS theoretical model, seven key factors, termed systemic functions, are necessary for the build-up of a TIS framework [6,7,8,9,10]. These systemic functions not only provide a basis to researchers for analyzing technology innovation, but also provide a foundation for analyzing the sustainability of the technological industry [11,12,13].
Industrial IoT is currently influencing the development of manufacturing industries. In many countries with emerging economies, industrial IoT is at an initial stage of development. This means that significant effort is needed to promote IoT industrial development in order to reach sustainability. Based on past literature, the majority of studies have focused on how TIS can enable technological innovations, while only a few studies aid our understanding of how TIS influences industrial sustainability [10,14,15,16,17]. In order to fill this gap, this research aims to discover and determine appropriate factors from TIS models and to explore the influential relationship between these factors toward IoT industrial sustainability.
An analysis and evaluation of these systemic factors that influence technological innovation and industrial sustainability can generally be recognized as a complex multiple criteria decision making (MCDM) issue involving the effects of feedback and interdependence between factors. Hence, a comprehensive evaluation process is one in which multiple requirements with uncertain conditions are considered simultaneously. According to previous studies, partial information in MCDM issues is provided in the form of linguistic descriptions, in terms of subjective judgments without an objective assessment [18,19,20,21]. Imprecise information derived from experts’ assessment will lead to bias and vagueness in a decision-making process. Thus, many integrated MCDM methods have been developed for treating vague circumstances. The fuzzy and grey theories are representative examples. The incorporation of these two theories into the MCDM model has been used to solve a great number of issues, such as project selection [22], performance evaluation [23], evaluation of renewable energy resources [24], and selection of sustainable recycling partners [25]. Rough interval numbers, which recently have received much more attention, is another effective approach that can be utilized to deal with imprecise numeric values in decision data and subjectively collective judgments without defining membership function. Moreover, the Bayesian model can be used to enhance the precision of evaluation, as this method can be used to obtain a precise result by integrating two different situations into one, based on calculations that do not consider the data set distribution of events. Additionally, the evaluation process in decision analysis is often conducted in a way that neglects prior and posterior conditions of event occurrence that can also contribute to inaccurate assessments. Thus, taking into account the Bayesian concept, the evaluation process can be rational and appropriate.
Based on the above statements, the purpose of this research is to propose an integrated evaluation framework based on the TIS model for exploring the systemic functions that impact IoT industrial sustainability. The proposed integrated model, termed BR-DEMATEL, is constituted by hybridizing the random forest (RF), Bayesian theory, and rough interval number and decision making trial and evaluation (DEMATEL), which not only determines the appropriate systemic functions, but also illustrates the causality given to these systemic functions for facilitating the sustainable development of the IoT industry. In addition, this model is also capable of efficiently treating ambiguity in human judgments. The operation of the proposed integrated model can be split into several steps. First, the feasible systemic functions are extracted from the TIS theoretical model. To determine whether these systemic functions and their systemic criteria are suitable for use in this paper, the RF technique is used to conduct feature selection. RF is an ensemble method that has been extensively applied to regression prediction, classification, and feature selection. After selecting the appropriate systemic functions and criteria, the next step is to define a causal relationship network using the BR-DEMATEL approach that is based on systemic criteria. Finally, empirical results and related policy recommendations are derived. To demonstrate the effectiveness of our proposed framework, an empirical case study based on IoT innovation in the Taiwanese smart manufacturing industry is introduced. Fifteen experts with more than 15 years of related engineering and management experiences are invited to help this investigation.
The paper proceeds as follows. Section 2 reviews the literature on TISs for industrial sustainability. Section 3 outlines the methodologies used for analyzing systematic functions that influence IoT industrial sustainability. Section 4 describes the background of IoT development in Taiwan, data collection, operation procedures, and empirical study results. Section 5 discusses policy implications, and Section 6 concludes the paper with observations, summaries, and recommendations for future studies.
2. Literature Review
The literature review is divided into two parts. In the first part, the authors briefly introduce the literature related to industrial sustainability; in the second part, the authors focus on the review of the literature regarding the TIS model.
2.1. Industrial Sustainability
Sustainability is defined as the capability to endure. Activities related to sustainability are seen as transition processes and include sustainable technological transitions, industrial transformation, and socio-technical change [3]. Socio-technical change is stimulated by the mutual facilitation of technical change and social change, and technological change always co-evolves with changes in the social system. Technological innovation is a key process in sustainable socio-technical change, which determines industrial sustainability [4].
In general, in the context of industry, there are three issues of sustainability that have been extensively discussed: Corporate sustainability, manufacturing sustainability, and industrial sustainability [26]. Corporate sustainability represents the actions of strategies; manufacturing sustainability is associated with the production system; and industrial sustainability refers to the plant level in manufacturing industries that involves various actions comprised of materials, products, process, plants, and production systems [27]. Therefore, industrial sustainability can be seen as a unique form of sustainability that completely incorporates the above-mentioned actions.
To ensure and promote industrial sustainability, certain supportive measures should be performed by government sectors and enterprises. However, defining a set of measures to facilitate industrial sustainability is not easy. Before determining policies to encourage sustainability in the industry, government and industrial sectors need to understand what kind of factors influence industrial sustainability and technology development. Subsequently, policy makers can propose corresponding measures for supporting industrial sustainability.
The process of transitioning from traditional manufacturing to smart IoT manufacturing is faced with many challenges, including insufficient ability to integrate technology and lack of talent. Thus, there is a need to understand the factors that influence IoT industrial sustainability and, further, to propose recommendations for government sectors and policy makers to determine feasible policies for facilitating IoT industrial sustainability. In this research, an evaluation model will be proposed by the authors to explore what kinds of factors influence sustainability of IoT in manufacturing industries and to analyze the interrelationships among these factors.
2.2. Theoretical Framework of TIS
The TIS, derived from many studies of innovation systems based on economic theories, has been broadly applied to a great variety of domains for the analysis of emerging technologies and, based on the analytical results, to design innovation polices to help the sustainable development of specific technologies [6,8,9,28,29,30]. Thus, this TIS approach is often used to explore technology utilization, diffusion, and development in terms of the levels, including nations, regions, and sectors [31].
The primary purpose of the TIS approach is to detect the advantages and weaknesses of an innovation system by drawing on structural and functional analyses. The structural analysis is built up around a specific technology through three structural components of the innovation system: Actors, networks, and institutions [32]. Actors includes universities, research institutes, manufacturing firms, consumers, government sectors, and interest groups from the industry [6]. Networks are built by the production and value chain and by collaboration between universities and industries [6]. Institution stands for formal laws, regulations, rules, standards, culture, and routines [6]. The functional analysis can be seen as a tool for exploring system performance and problems based on structural components. In addition, this analytical method has been successfully used in a broad range of academic studies where either the current situation is novel technological sustainable development or historical dynamics of technological innovations [28,30,33]. In general, TIS analysis relies on seven pivotal systemic functions: Entrepreneurial activities, knowledge development, knowledge diffusion through networks, guidance of search, market formation, resource mobilization, and creation of legitimacy [6,17].
The usefulness of the TIS framework in studies of technological and sustainability innovations has been demonstrated. For example, Suurs and Hekkert [34] analyzed the interactions between biofuel innovation development and systemic functions in the Netherlands based on historical events. According to this analysis, they found that the TIS framework is able to identify cumulative causation within biofuel innovation systems. Reichardt, Negro, Rogge, and Hekkert [16] studied emerging technologies, such as wind technologies, in the domain of sustainability transitions by the TIS model. The potential system barriers that harm the development of innovation systems were first identified in their research, and related policy recommendations were then derived from the perspective of actors and the historical literature. Edsand [35] evaluated the systemic functions of TIS and landscape factors and relied on the viewpoints of experts and historical event data in order to explore the reasons for the diffusion of wind power in Colombia. Based on the results of their analysis, policy suggestions were presented to solve possible barriers among systemic functions. Haley [36] proposed an extended model using a validation case regarding renewable electricity in Canada that integrated TIS and structural tensions to understand how the evolution of a focal technology induces technological complementarities and creates a need to continuously re-design policy. These empirical analyses offer a basis to academic scholars who can use such TIS frameworks to study emerging innovative technologies and their sustainable development. In the following section, several systemic functions and related criteria are introduced.
2.2.1. Entrepreneurial Experiment
Entrepreneurs are important for a well-functioning innovation system [9]. Their role is to transform the potential of new knowledge, networks, and markets into concrete actions comprised of business experiments and entrepreneurial ventures [16]. By doing so, more and more business opportunities can be found. To support entrepreneurial experiments, several indicators can be taken into account, including experimentation of technological applications, launching pilot projects, entry of firms into markets, and incubation systems [6,16,17,31,37].
2.2.2. Knowledge Development
This function is represented by several elements consisting of knowledge creation, knowledge exchange, and knowledge facilitation. Knowledge development often has a dominant influence in the early development process of a specific technology [6]. Knowledge can be turned into applicable technologies in practical or commercial environments through two important learning types: Learning by searching and learning by doing [38]. In addition, knowledge development and promotion can be affected by different types of knowledge; e.g., scientific technological, production, market, logistics and design, and sources of knowledge, such as R&D. In general, knowledge development can give rise to several indicators to understand the degree of knowledge development in a specific industry or technology, including assessment criteria, conducting feasibility studies, technology market research and assessment, development of complementary technology and network of technology, and research cooperation [6,16,17,31,37].
2.2.3. Knowledge Diffusion through a Network
Compared to knowledge development, knowledge diffusion represents the facilitation and diffusion of knowledge by networks in which stakeholders are involved and provide information and knowledge to each other. The diffusion of knowledge often takes place in the formation of partnerships or in meetings, such as workshops and conferences [7]. Based on knowledge diffusion through networks, related technological innovations and technology commercialization can be effectively developed [39]. According to past TIS studies, assessment criteria, including training professionals, conducting promotion campaigns, organizing meeting and seminars, and demonstrations and exhibitions, can be used to evaluate knowledge diffusion through the network function [4,6,17,31,34,37].
2.2.4. Guidance of Search
Guidance of search is defined as incentives or pressures for organizations to enter technological fields influenced by different actors ‘ visions and expectations [29]. For example, government sectors provide a set of innovation policies to influence the direction of technological innovation. Given this action by public sectors, companies and firms will be pushed to aggressively develop technological innovations accordingly. Therefore, guidance of search plays a significant role in TIS with respect to the support of emerging technologies or specific technological innovations. The function of guidance of search gives rise to several criteria, including setting a collective development goal, design of favorable rules and regulations, publicizing expectations (disseminating expectations), and providing directional development [6,11,31,34].
2.2.5. Market Formation
Emerging technologies and novel innovations need to be motivated by supportive means, such as regulatory reform, technical standards, providing subsidies, and government procurement programs. This is because such new technologies usually cannot compete with incumbent technologies [29]. Thus, using policy actions to create favorable environments (niche markets) for the development of emerging technologies and innovations is indispensable. Moreover, the support of niche market formation for emerging technology not only represents that a new market is established. Instead, emerging technologies and innovations can develop in the near future and therefore can form a unique market [8]. The formation of markets can be assessed in terms of several criteria, such as the provision of subsidies, government procurement, regulatory reform, and technology standards [4,6,17,31,34,37].
2.2.6. Resource Mobilization
Financial, human, and physical resources are necessary basic inputs for technological innovations in the system of innovation development [9]. Whether the allocation of sufficient resources can be accomplished will affect novel technology development and innovation. Examples of resources mobilization include funding scaling up on technology projects, human resources mobilization, and education programs of specific technologies. In short, without these useful resources to promote technology development, the innovation system will be hampered. The resource mobilization function is composed of several criteria, including providing a R&D budget, financial grants and loans, education program design, mobilizing human resources, and funding scaling up on various projects [6,11,31,34].
2.2.7. Creation of Legitimacy
A certain level of legitimacy is required for actors to commit to a new technology and commit investments and take adoptive decisions [9]. This function also means that whether the development of innovative technology can be accomplished depends on the relationship between the advocacy coalition and policy makers [7]. Political tools, including lobbyists and interest groups, have significantly impacted public expectations of government sectors. Therefore, the creation of legitimacy can be seen as a unique form of the guidance of search function [7]. The function of the creation of legitimacy can be split into several criteria, including the strength of lobbying actions, growth of interest groups, and social acceptability [6,16,17,31,37].
2.3. Industrial Sustainability and TIS
Based on previous studies, industrial sustainability has verified the relationship between socio-technology transition and industrial transformation. Technological innovation has also played an important role in influencing organizational change, industrial upgrading, market formation, and policy formation. Researchers have implemented many empirical studies to demonstrate the significance between technological innovation and sustainability. In manufacturing industries, sustainable development has become an indispensable trend. To facilitate industrial sustainability, government sectors and policy makers should conduct activities and utilize policy tools to support industrial development and transition.
Thus, there is a need for government sectors and policy makers to understand the challenges that firms are facing and what kinds of factors influence industrial development and its sustainability. In this sense, the TIS framework is suitable for analyzing industrial sustainability. This is because the TIS framework has been extensively used to analyze innovation policy formulation, technology and industrial transition, and the sustainability of industries [6,8,9,28,29,30].
2.4. Research Gaps
Based on the above literature review results, several research gaps can be identified. First, past studies have discussed the applications of TIS theory in different contexts [9,14,15,16,17]. However, the causal relationships between the functions of the TIS were seldom discussed. In the real world, such relationships between functions are dependent. Thus, a derivation of the causal relationships will be essential to cross the research gap. Further, policy recommendations can be derived accordingly.
Second, analytical frameworks which can help policy makers facilitate the development of technological innovation and industrial sustainability based on the theory of TIS and systemic innovation policy instruments were rare [10,14,15,16,17]. This research aims to cross the research gap by defining an analytical framework and process for policy makers to facilitate the development of technological innovation and industrial sustainability based on the theory of TIS and systemic innovation policy instruments.
Third, most of the past works of TIS are mainly based on qualitative analysis. Although popular, traditional qualitative approaches could be subjective and misleading [40]. An analytic framework based on quantitative methods can cross the research gap.
Finally, in recent years, applications of the TIS theory to the analysis of IoT based manufacturing industries are still scarce. To face the trend of digital transformation in manufacturing industries of most catching-up economies (e.g., Taiwan), the introduction of artificial intelligence (AI) and IoT technologies to stimulate such a digital transformation or industrial upgrading is urgent. Hence, identifying the factors influencing the introduction and sustainable development of the IoT in manufacturing industries is important to cross the research gap. The proposed TIS framework can be adopted here as the theoretic basis for exploring and analyzing factors to develop systemic innovation and policy instruments, which can enhance the sustainability of IoT in manufacturing industries.
3. Proposed Hybrid Framework for Systemic Factor Evaluation
The promotion of technological innovation development always associates with a wide variety of factors that can possibly influence the assessment of policy makers. In this research, a novel method is proposed that integrates Bayesian theory, interval rough number, and DEMATEL. The proposed model can effectively solve the imprecise information generated from subjective judgment and further derive the visualization graph of causality among factors. The operation process of the proposed model will be in the following.
This study first uses the synthetic minority over-sampling technique (SMOTE), a re-sampling method, to address imbalanced data sets. An imbalanced data set means that the categories (including universities, industries, research institutes, and government sectors) in the collected data have an imbalanced distribution. For example, the sample collected from the industry is the majority compared to other categories. Therefore, it is necessary to address such situations, called re-sample, for use in subsequent analyses. Then, the settled data set is fed into classification models to understand whether the re-sampled data set can facilitate the model. Subsequently, the RF is used to derive essential criteria. The combined approach of BR-DEMATEL is then used to construct a causal relationship network based on obtained criteria that affect sustainable IoT development. In short, the proposed interactive evaluation model is used to identify vital factors that will influence sustainable IoT development and provides valuable suggestions for policy makers so that they can understand which influential variable needs more attention and analyze the interrelationships among influential variables. The procedure is described in Figure 1 and the following sections illustrate the methods of the proposed model.
3.1. SMOTE
The over-sampling method is always used to solve class imbalance problems in data sets. The primary concept of this method is to randomly replicate the minor classes of the data set and add these replicated samples into the data set to balance the number of samples in each class. However, the over-sampling technique does not effectively enhance classification accuracy in the imbalance class data, which may lead to over-fitting in classification. To solve these aforementioned problems, the SMOTE was proposed by Chawla et al. [40]. The SMOTE algorithm aims to enlarge the region of the minority class, which indicates the , by generating synthetic instances in the feature space. More specifically, the nearest neighbors will be considered for each sample, , in terms of the minority class data set, . To generate new data for the imbalanced data set towards the minority class data, the nearest neighbors will be determined for each minority class data. Then, the difference between the minority class sample and the nearest neighbors of the selected sample is obtained. Finally, the difference multiplies a vector with a random number from [0,1] and adds the [40]. In general, the SMOTE equation can be shown below, based on Han et al. [41]: , where is the minority class data and is data randomly selected from the k-nearest neighbors towards the data set of ; represents a vector with random values from 0 to 1. By repeating the above equation, the desired value of synthetic data can be created.
3.2. The RF Technique
The RF is an ensemble learning algorithm for classification, regression, and related tasks. In machine learning, RF is regarded as a powerful tool for dealing with various issues of predictions. The feature of the RF technique is to aggregate results from several trained predictors or classifiers [42]. In general, the RF algorithm is performed as follows:
If is the number of instances in a data set, then a random sample with a replacement of instances from the original data is determined. The obtained bootstrap sample is the training set used for developing the tree. In order to demonstrate the prediction performance of the RF, a random part of the data from the bootstrap sample, called observation (or the so called out-of-bag (OOB)) data, is used for testing the model in terms of the cross-validation mechanism.
If M is the number of features in a data set, then a number, m (m < M), is specified. At each node of the tree, the feature with the best value among m is used to split the node. In this step, the best split that minimizes the objective function is selected. As for the problem of classification, suppose the class is 1, …, L, the Gini index of the child nodes stands for the cost parameter. The Gini index of a node, t, is defined as: , where is the probability of observing the class, c, in the node, t. Each tree is fully developed and not pruned. The new data is predicted by aggregating the predictions of the n trees (i.e., the majority votes for classification and average for regression). The RF operation process is shown in Figure 2.
The building of the RF method depends on the best split among all predictor features at each node when developing an unpruned tree for each bootstrap sample. Although there is no specific rule for randomly determining predictors, the predictive performance of the RF method is based on past experience that shows its superiority over other benchmark models, including the support vector machine (SVM), logistic regression (LR), and gradient boosting (GB) techniques. Additionally, RF has several strengths. RF is a non-parametric approach, which means the values of variables without the limitation of any statistical distribution. Additionally, this method is able to prevent overfitting and has a significant advantage in terms of computation speed for large data sets [43].
3.3. BR-DEMATEL
The decision making trial and evaluation laboratory (DEMATEL) approach is based on matrix derivation and graph theory and was developed by the Geneva Research Centre of the Battelle Memorial Institute. This method not only can reflect the degree of relation or the strength of influence, but can also obtain the relationships between the causality of the criteria in a network map. Thus, DEMATEL can be seen as an MCDM approach.
Although this approach was used to explain the causal relationship among factors and to derive enhancement suggestions for decision makers, it may lack a mechanism for manipulating subjective and vague evaluations of factor interactions [44]. Based on this problem, some famous theories, such as fuzzy and grey numbers, were introduced and incorporated into the DEMATEL. Indeed, these extended DEMATEL models are able to address the vagueness and imprecision in many research issues. However, when determining a proper membership function for fuzzy sets and defining an appropriate interval number for grey functions, subjectivity will influence the final decision and so particular attention needs to be paid to it [20]. Apart from the fuzzy and grey theories, the rough set theory, proposed by Pawlak [45], is another instrument for overcoming uncertainty. Recent studies have proved that the extension models with rough interval numbers can effectively address complex human behaviors without a definition of the membership function. Although the rough set theory is successful for treating uncertainties, it still needs more attention to achieve further improvements. The purpose of Bayesian theory is to revise the initial information by introducing new information, which stands for the original message and can be modified so that it will be closer to the real situation. Given such an advantage, imprecision problems can be handled. The combination of both rough set and Bayesian theories can be a relatively good way to effectively address uncertainty problems in collective decision making.
In this research, a novel hybrid MCDM model is developed by incorporating Bayesian theory and the rough interval number to form the DEMATEL (BR-DEMATEL) method, which will be used to evaluate the factors that influence the definition of innovation policy in a vague environment. Based on the previous literature [19,46,47], the following process shows the steps of operating the BR-DEMATEL:
Step 1: Construct the initial group direct matrix, , which contains the direct influences provided by experts.
For the construction of matrices, including the prior matrix of (previous information in technology development) and the conditional matrix of (current information in technology development), experts are first asked to identify the level of influence from function to function , as indicated by , where:
using an integer scale from 0 to 4 (0—no influence, 1—low influence, 2—medium influence, 3—high influence, and 4—very high influence). Then, the non-negative matrix, , based on the opinions provided by the kth expert’s evaluation is constructed, as illustrated below:
Here, represents kth opinions provided by experts; p and c indicate the prior and condition matrix, respectively. Thus, the group initial direct matrix of can be defined as:
Step 2: Determination of the rough group direct-influence matrix, .
Assume that is a vector consisting of the opinions provided by the experts (see matrix), where the opinions are ordered as . is the universe that includes all the objects and is an arbitrary object that is a subset of . The lower approximation of and the upper approximation of can be defined as follows:
Next, both the lower approximation, , and the upper approximation, , are defined by using the lower and upper limits, which is defined as follows:
When , the approximation matrix is considered as the prior matrix, . When , the approximation matrix is considered as the conditional matrix, . is the lower approximation for and is the upper approximation for . and represent the number of objects included in the lower approximation, , and upper approximation, , respectively.
Subsequently, all collected expert opinions are filled into the matrices. Each of the matrices is transformed into a rough interval number using Equations (4) to (7), as follows:
where the lower and upper limits are represented as and , respectively, in . Moreover, these two limits depict the level of vagueness. The prior and conditional rough sequences, and , are derived as follows:
The mean rough interval numbers of the prior and conditional rough sequences are defined as and , respectively. The two means are generated using the rough derivation equations defined in Equations (11) to (16), as follows:
where:
where:
The rough interval number, , represents the prior situation, where and represent the lower and upper limits of the sequence, respectively. In the conditional situation of , and represent the lower and upper limits of the rough interval number, . Based on the above calculations, the prior and conditional rough group direct influence matrices, and , are defined as follows:
Step 3: Calculation of the normalized matrix.
Matrix is derived from the normalized group direct influence matrix, . During the calculation of matrix , each element in matrix is designated a value between zero and one. The matrix, including and , is acquired when each element, , of matrix is divided by the maximum value of every rough interval number, as illustrated in Equations (19) to (22):
where and are calculated based on the following equations:
Step 4: Establishing the total influence matrix, .
Based on Equation (23), the total influence matrix, , consisting of , can be derived, where denotes the identity matrix of the rank. The total influence matrix based on the prior situation can be denoted as . Similarly, using the condition situation, the total influence matrix is depicted as
After the calculation of the total influence matrix, the next step is to convert these matrices into the posterior matrix utilizing Equations (24) to (26). The posterior matrix is derived as shown below:
where and represent the probability matrices that are being normalized from the total influence matrices, and is a parameter acquired through the sum of posterior probability matrices. is used for transforming the posterior probability matrices into the posterior total influence matrix. The posterior rough total influence matrix of is shown below:
To examine the reliability of the collected data, the inconsistency rate is calculated using Equation (28):
where , is the average influence of factor on . denotes the number of samples. An inconsistency rate that is less than 5% represents the reliability of the collected samples.
Using Equations (29) and (30), row sums and column sums are respectively defined as ( and are the lower limit and upper limit) and ( and are the lower limit and upper limit) within the posterior rough total influence matrix, :
Then, a de-roughness approach is used to convert the interval rough numbers into crisp values. By the method of Opricovic and Tzeng [48], vague numbers can be effectively transformed into crisp values. The de-roughness algorithm is described in the following several steps:
Normalization:
where and , are the normalized scores. After that, the total normalized crisp values and final crisp values can be computed by Equations (35) to (38), respectively:
where and are the final transformed crisp values and .
Using the calculation that obtains crisp values, the causal network can be acquired by mapping the ordered pairs of . The horizontal axis , named “Prominence”, is derived by adding to . The vertical axis , named “Relation”, is derived by subtracting from . In the causal network, the horizontal axis, “Prominence”, indicates the strength of the total influences given and received by some specific criterion and reveals the importance of the criterion. The vertical axis, “Relation”, divides the criteria into cause and effect groups. When the value is positive, the criterion belongs to the cause group where the criterion, , affects other criteria. If the value is negative, the criterion belongs to the effect group, where criterion is influenced by other criteria. Thus, the cause-effect diagram visualizes the complicated interrelationship between criteria into a visible structural network and provides valuable information for problem solving. Furthermore, the causal network map is suitable for use by decision makers to examine the difference between cause and effect factors to determine useful strategies and policies.
4. Empirical Study of Evaluating Systemic Factors That Influence IoT Sustainable Development
In this section, the background of an empirical case and problem description is first briefly illustrated. Then, the data collection is introduced. Finally, empirical results generated by the proposed model are presented.
4.1. Background and Problem Description
TIS analysis and systemic function evaluation play key roles in the sustainable development of an emerging technology and industry. The IoT is regarded as a dominant emerging technology that will influence the next generation of technology in a variety of fields. Thus, many countries desire to develop IoT technology and applications in order to enhance their economic growth and industrial competitiveness.
In certain developed economies, national governments have already defined innovation policies to achieve sustainable development of the IoT. For example, members of the European Union, such as German and Finland, have implemented a program of smart factories for the support of industrial upgrades and production platforms of SMEs. However, for emerging economies, including China, Taiwan, India, Malaysia, Indonesia, Thailand, and South Korea [49], the technology life cycle of IoT applications are still in the early stages. Taiwan is an example. Although the Taiwan government adopted industrial policies to help develop the IoT industry (‘Asian Silicon Valley’ project), significant innovation policy gaps still exist. For example, Taiwan is well-known for manufacturing and production. However, manufacturing industries in Taiwan are facing a problem in which traditional SMEs and parts of large companies have to upgrade existing production infrastructure, such as the use of robotic equipment for human-machine cooperation. Under such situations, the government needs to propose a useful solution that will help industries to upgrade. Moreover, digital data in the era of industry 4.0 consist of production and manufacturing related information. If these data can be properly used and analyzed, production and operation will be more efficient. However, business intelligence, dataset integration, and machine learning systems have not yet fully been introduced into the SMEs. This implies that the government needs to put more effort into IoT industrial transformation.
Therefore, understanding possible reasons and exploring feasible factors that influence sustainable development of the IoT is important in order to help define related innovation policies that can be used as supportive tools to enhance industrial competitiveness. Through the theoretical framework of TIS, which has been extensively used to analyze industrial and technology innovation development, an integrated MCDM framework is proposed for analyzing the systemic factors that influence Taiwanese IoT development. Furthermore, based on the interrelationships among systemic factors derived by the proposed framework, policy makers can easily understand how to promote IoT industrial sustainability in smart manufacturing.
4.2. Data Collection
Raw data were mainly collected from questionnaires (refer to Appendix A) answered by Taiwanese experts over a three-month period, from August to October 2017. To construct the questionnaire, the evaluation criteria (features) and functions (dimensions) were collected from literature on TIS [6,9,10,50]. Seven important functions were introduced: (1) Entrepreneurial activities (F1); (2) knowledge development (F2); (3) knowledge diffusion through network (F3); (4) guidance of the search (F4); (5) market formation (F5); (6) resource mobilization (F6); and (7) creation of legitimacy (F7). Moreover, based on the literature review results, 28 possible criteria that may influence the definition of innovation policy were also included in the seven functions. Table 1 illustrates the feasible systemic functions and criteria.
Second, the survey was conducted for feature selection in terms of investigating various units from the government sector, industry, universities, and research institutes. Some of these units mainly participated in the technology-oriented IoT research and development, and the government units were from a related IoT development sector. The rest of the other units, which are vendors of IoT devices, focus on the production of intelligent machines. The questionnaire was placed on the website where these units were invited to answer how important the evaluation criteria are to this research issue using a 5-point Likert measure. A total of 150 responses were received and 106 of the surveys were usable, for a valid response rate of 70.67%. Once valid surveys were confirmed, a tree-based method was used to select appropriate factors for subsequent analysis. The detailed process is presented in the following sub-section.
Based on the result of the feature selection, the pair-wise comparison questionnaire (refer to Appendix B) that was used in this work was designed. In this research, based on the snowball sampling method [51], 15 potential participants with more than 15 years of experiences in IoT related jobs were invited to provide opinions. Background information on the experts is shown in Appendix C. These experts included top management as well as R&D and technology managers from Taiwanese IoT-related firms. A list of potential interviewees was planned and the questionnaire survey was implemented from February 2018 to November 2018. Each questionnaire survey was conducted either in-person or in an online meeting and took 45 to 60 min.
As for the interview, experts were asked to discuss current and future difficulties that need to be solved by the Taiwanese government and businesses, and what sort of systemic problems will hinder IoT development that need to be addressed by policies. Additionally, these experts were asked to assess IoT innovation policies based on criteria and systemic problems for the construction of a non-additive hybrid rough decision framework.
4.3. Data Pre-Processing and Feature Selection
Although variables were identified in the TIS literature, the suitability of these variables needs to be confirmed to be used in this research. Also, each TIS issue has its own specific situation, which means that IoT industrial sustainability will be different from industrial sustainability of other technologies. Thus, there is a need to determine a set of applicable variables for this research. A description of data pre-processing and feature selection is detailed below.
First, in the collected data set, 106 samples belonging to four different categories were introduced to uncover knowledge by an ensemble algorithm in the classification task. Each category has information that can facilitate the prediction of new samples. Regarding the data set in this research, the industry category accounts for a proportion of the total samples. In general, an imbalanced data set, which means that the majority category exceeds the number of the minority class, will result in poor performance that will bias the new sample prediction. Thus, such a problem has to be solved. According to previous studies, the re-sampling technique can be used to solve this problem. From past experience, an effective approach, called SMOTE, which can both enhance the number of samples in the minority class and avoid the drawback of over-fitting [40], is very suitable for pre-processing an imbalanced data set in this research. After processing the data set, the original imbalanced classes (72 for industry, 17 for university, 8 for government sector, and 9 for research institute) were re-sampled as 72 for industry, 72 for university, 72 for government sector, and 9 for research institute. This will benefit the classification task.
Second, random sampling is used to split the data into three subsets: Training set, testing set, and validation set, with respective proportions of 60%, 20%, and 20%. Hence, the number of data points in the training set, testing set, and validation set were 135, 45, and 45, respectively. To compare the predictions between the original data set and the re-sampled data set, several algorithms were used, including RF, logistic regression (LR), linear support vector machine (LS-SVM), radial basis function kernel SVM (RBF-SVM), and gradient boosting (GB). Table 2 presents the results of this classification task. As shown in Table 2, the re-sampled classification result is better than the original classification data set. In addition, for the prediction task, the RF method was also verified for robustness relative to other algorithms in Table 2. Next, the RF method was used as a feature selection instrument for filtering useful features.
Finally, in the process of feature selection, the variables were determined by RF with five rounds, where each round implemented five 5-fold cross-validations in different sizes of data sets comprised of a training set and testing set for 90/10, 80/20, 70/30, 60/40, and 50/50, respectively. In RF, the estimator was set to be 10 and the minimum number of leaves in the samples was 1, and ‘gini’ was used as a criterion for evaluating the features. The results show that the following were excluded from the evaluation criteria: Launching pilot IoT projects (e2), IoT market research and assessment (k2), network of technology and research cooperation (k4), conducting promotion campaigns (kd2), and providing financial grants and loans (r2). It turns out there are 23 criteria that will be used as assessment indicators for influencing IoT sustainable development and innovation policy definition (see Table 3).
4.4. The Derivation of the Causal Network via the Bayesian Rough DEMATEL Method
On the basis of the responses from the 15 experts (see Appendix C), causal relationships were identified in terms of influential relationships. The expert panel consists of one of each of the following: Executive director, senior technical support engineer, sales manager, R&D director, senior engineer, product manager, and technical integration manager. The expert panel also contained eight R&D managers. In order to understand the factors that impact IoT industrial sustainability and to help IoT policy formulation, these experts were asked to answer a two-part questionnaire (refer to Appendix A and Appendix B). The group direct-influence matrix that relies on the opinions of experts was established using the following scale: 4, 3, 2, 1, and 0 (4—very high influence, 3—high influence, 2—low influence, 1—very low influence, 0—no influence). In Table 4, the scores on the left side are denoted as the values of prior situations (matrix) and the scores on the right side represent the values of current conditions (matrix). Based on the rough theory and the above-mentioned Equations (2) to (19), the initial values of the group direct-influence matrix were transformed into rough numbers. Each initial matrix was comprised of 23 criteria that included 15 elements.
Likewise, the rest of the rough interval numbers can be obtained utilizing the above computing principles. Thus, the group rough direct influence matrices, and (see Table 5 and Table 6), are constituted. Next, the normalized rough matrices, including and , are derived by Equations (19) and (20), as depicted in Table 7 and Table 8.
Once the average rough matrix is constructed, the rough total influence matrices, and (see Table 9 and Table 10), can be derived using Equations (21) to (23). The network relationship map can be derived accordingly. In this step, Bayesian theory is also taken into consideration. The posterior rough total influence matrix, , can then be derived based on Equations (24) to (26). Based on Equation (28), the reliability of the collected data can be derived. The inconsistency ratio is 3.75% (<5%), which means our collected samples are reliable.
In matrix (see Table 11), by summing each row and column, and can be derived using Equations (29) and (30). The influential network relationship map and the causal relationships towards criteria can thus be illustrated.
The next step to deriving the causal relationship is to convert the rough values into the crisp value based on Equations (37) and (38). Crisp values, and , are eventually obtained and are shown in Table 12. The total influence relation matrix, the prominence, and relationships of the systemic function are demonstrated in Table 13. Finally, the causal network can be illustrated by mapping the crisp values of and (refer to Figure 3). Based on this causal network, policy makers can understand complex influence relationships among factors, which enhances the priority of the innovation policy formulation that can then be planned accordingly.
5. Discussion and Implications
It is essential to identify the appropriate functions and criteria that influence innovation policy configuration. An effective design of innovation policy will contribute to the development of a particular technology, thereby enhancing a country’s economic growth and industrial competitiveness. Consequently, this research represents an integrated model in terms of the function of technological innovation to explore the relationship between systemic functions that affect the sustainability of IoT in smart manufacturing. Based on the empirical analysis by the Bayesian rough DEMATEL method, policy implications and the advancement of MCDM methods are elaborated in the following sections.
5.1. Implications of the Analytical Results
To discuss the policy implications of the empirical analysis, the function and criterion levels are illustrated below. At first, the analytical results of the functions as well as the causal networks will be discussed in the following Section 5.1.1. Then, the results corresponding to the criteria will be discussed in Section 5.1.2.
5.1.1. Function Level
According to the analytical results and the causal relationship network (see Figure 3), the functions of the TIS can be divided into two groups based on the values of . The cause group consists of the functions with positive values. The cause group consists of entrepreneurial activities (F1), knowledge development (F2), market formation (F5), and resource mobilization (F6), while the effect group is composed of knowledge diffusion through networks (F3), guidance of the search (F4), and creation of legitimacy (F7). Among all the cause group functions, the prominence () of the entrepreneurial activities (F1) function is the largest, which is 2.312. Therefore, entrepreneurial activities (F1) are recognized as the most significant function affecting the sustainability of IoT in smart manufacturing. The function of entrepreneurial activities (F1) also has the largest value, which implies that this function has more influence on the entire TIS.
Faced with the uncertainties of the development of new technology, the introduction of different new enterprises to promote new technological applications can be one way of expanding the entire learning process of new technology [6]. In recent years, enterprises and government have often emphasized how to leverage smart manufacturing to enhance the industrial competitiveness of Taiwan. However, it still lacks practical methods to realize such issues. Although Taiwan has a primary advantage in IC design, semiconductor, and other manufacturing industries, if firms cannot aggressively facilitate IoT development and enhance the technology capability in smart manufacturing, industrial development will fall behind other industrialized countries. Thus, by providing proper incentives and policies, the government should play a role in encouraging different enterprises and technological applications to enter the market.
A prominent and influential function is the knowledge development function (F2). The second largest and values, which were 2.202 and 0.078, respectively, demonstrate the high dominance and strong influence of the knowledge development function on others [52]. In the real world, technological research and facilitation always needs powerful policy support and investment from enterprises and government sectors [28,50]. Thus, governments should conduct feasible IoT studies through associated agencies and institutions and provide incentives to firms and technological institutions to develop complementary technology [36]. For the functions belonging to the effect group, the creation of the legitimacy function (F7) has the lowest value (−0.107), which means the function is mainly influenced by others [53].
The other functions are prioritized as follows: Guidance of the search (F4) with an r − c value of −0.063 and knowledge diffusion through networks (F3) with an value of −0.012. Regarding the function of the creation of legitimacy (F7), the lobbying power and growth of interest groups is essential for technology promotion [17]. Based on the analytical results of this research, firms and related agencies should cooperate with each other, and this will help promote competitiveness between firms in IoT sustainable development.
In addition, based on the causal diagram demonstrated in Figure 3, major influential relationships can be discussed. For the relationship between entrepreneurial activities (F1) and knowledge development (F2), this relationship demonstrates that entrepreneurial activities (F1) can directly influence knowledge development (F2). This causal result is consistent with the research by Zahra [54], who found that enterprise activities can facilitate knowledge creation and development.
5.1.2. Criterion Level
Concerning the criterion level, Table 12 reveals that experimenting with new applications of IoT (e1), conducting feasible studies (k1), demonstrations and exhibitions (kd4), providing direction of development (g4), standardizations (m4), funding scaling up on IoT projects (r5), and social acceptability (c3) have the greatest influence on other criteria within the relevant functions. In contrast, experimenting with new applications of IoT (e1), developing complementary technologies (k2), demonstrations and exhibitions (kd4), providing direction of development (g4), standardizations (m4), funding scaling up on IoT projects (r5), and strength of lobby actions (c1) with the highest values of are the major criteria that influence other criteria within the observed functions. From the causal diagram, these results serve as a solid foundation for making profound decisions. In the following sub-sections, detailed discussions of the influential network relationships toward the criteria within each function are presented.
The Function of Entrepreneurial Activities
At first, by referring to the IRM demonstrated in Figure 3, for the function of entrepreneurial activities, experimenting new applications of IoT (e1) has direct influences on both systems for innovation and incubation (e4) and entry of firms to the IoT market (e3). The innovation and incubation (e4) also has a direct influence on the entry of firms into the IoT market (e3). These path relations are consistent with the research of Hekkert, Suurs, Negro, Kuhlmann, and Smits [17], who stated that the promotion of potential technology and innovation applications may ultimately turn into new business opportunities for entrepreneurs. Implementing various new applications will lead to a situation in which new firms and incumbent companies will enter into the market to search for new possibilities. Currently, many applications of IoT in the smart manufacturing industry have been verified and successfully launched. Remote monitoring is an example. The malfunction of IoT devices may influence the productivity and profitability of firms. An IoT-based monitoring system can connect all devices to the cloud. Malfunctions and potential risks can be detected and the problems can be identified and solved without delay.
In Taiwan, firms have a strong background in high-technology manufacturing and have powerful technology capabilities to produce products in specific domains, such as semiconductors and panels. However, software development and innovation applications that combine with hard devices are quite insufficient. Under such situations, the role of the government in IoT policy formulation is to examine related issues and provide subsidies to support entrepreneurial activities [6]. From the systemic point of view, policy makers and top management in firms recognize the importance of prioritizing the implementation of IoT applications. Through such encouragement, innovative firms and incumbent companies will continue to emerge and eventually the IoT market will flourish.
The Function of Knowledge Development
As depicted in Figure 3, the analytical results of this research indicate that the conduction of feasible studies directly affects the development of complementary technologies. Gans and Stern [55] argued that the development of feasible studies is a fundamental driver that influences industrial development and can reinforce the value of existing technologies, as well as foster the development of complementary technologies. According to previous studies, successful technological innovation primarily comes from the combination of different technologies instead of coming from similar technologies [56]. This implies that the development of complementary technology may create considerable profit for firms and facilitate technology applications. Hence, conducting viable studies is important for the promotion of developing complementary technologies. From the systemic view of point, it is essential that the task of conducting feasible studies should be focused upon first. Such action may enable firms to combine different technologies for IoT applications in smart manufacturing fields.
The Function of Market Formation
The empirical study shows that government procurement is influenced by the provision of subsidies, regulatory reform, and technology standards. Based on the network relationship map (Figure 3), both subsidy provisions and regulatory reform mediate the influences of technology’s standard definition on government procurement. The establishment of causal relationships between standards and government procurement programs requires the mediation of these two factors. Generally, emerging innovative technologies cannot compete with incumbent technologies. Hence, the creation of specific markets is needed. Whether the emerging market can be favorably built up, a set of factors must always be considered, including financial support, government procurement, construction of new standards, and provision of a friendly environment for the development of emerging technologies [6,7,17].
Based on the point of view of market formation in the IoT policy definition, government sectors should emphasize the coordination of cooperation between firms and research institutes and should aggressively promote the construction of technology standards. Due to the lack of unit standards for the integration of various technologies and platforms, many applications and technologies relevant to IoT cannot effectively cooperate and communicate with each other. The Taiwanese government and public research institutes (e.g., Industrial Technology Research Institute, ITRI) should define related standards, develop technologies, and accelerate the development of innovation systems by regulation re-definition. Further, subsidies should be provided for smart manufacturing. Such actions will assist firms to develop and utilize services and applications of smart manufacturing.
The Function of Resource Mobilization
From the aspect of resource mobilization, funding the scaling up of IoT projects (r5) has a direct impact on all criteria, consisting of mobilizing human resources (r4), providing R&D budgets (r1), and launching IoT related education programs (r3). From a systemic perspective, the means of funding the scaling up of IoT projects should receive much attention. This implies that the government needs to raise funds for firms to conduct internal R&D projects. In budget planning for R&D, public sectors will also invest more budget in IoT development. After receiving financial support from the government, firms can develop technological innovation applications of IoT.
At the same time, as the demand for human resources increases, more IoT-related educational programs are required. The Taiwanese government recently proposed a major project (Asia Silicon Valley Development Plan) for the promotion of IoT-based smart manufacturing. This policy aims to improve conditions for the development of an IoT innovation ecosystem. This important policy encourages firms to introduce novel innovations from overseas, develop unique applications in IoT in manufacturing, and enhance the efficiency of the supply chain of smart manufacturing industries. In addition, by initiating various IoT projects, IoT-related educational programs on smart manufacturing will also attract attention. The IoT-related education program will also cause significant levels of human resources to mobilize.
The Function of Knowledge Diffusion through Networks
From the aspect of knowledge diffusion in Figure 3, demonstrations and exhibitions (kd4) affect the organization of conferences, workshops, seminars, and meetings (kd3), as well as the training of professionals (kd1). To accelerate IoT development in smart manufacturing, the government should provide additional locations that can be used as demonstration fields for IoT activities by firms so that they can experiment with IoT applications.
For example, the Taiwanese government has invested 40 million New Taiwan dollars in the creation of demonstration fields for smart manufacturing. This investment will help promote IoT applications. The construction of smart manufacturing fields can be attributed to certain reasons. First, most Taiwanese firms are small and medium enterprises (SMEs) that are focused on traditional manufacturing. Facing pressure from traditional manufacturing to transform to smart production, core competences in platformization and integration are essential. The shortage of core manufacturing capabilities of key platformization, financial support, and talent are always obstacles for IoT development.
These demonstration fields will be a benefit measure that can help firms develop and transfer technologies as well as eventually realizing smart manufacturing. Moreover, many conferences and workshops have been held by the government and associated firms for discussing and sharing IoT applications and trends. In summary, the support of the government within the function of knowledge diffusion through networks is considered an essential force behind the IoT innovation system.
The Function of the Guidance of the Search
From the aspect of the guidance of the search in Figure 3, setting collective goals for IoT development (g1) is influenced by the design of favorable rules and regulations (g2), publicizing expectation (g3), as well as providing directions of development (g4). The sequence list for enhancing the function guidance of the search can be illustrated as follows: Provision of directions of development (g4), publicizing expectation (g3), design of favorable rules and regulations (g2), and setting collective goals for IoT development (g1).
This array implies that the provision of directions of development by the government should be prioritized. This result is compatible with the research of Planko, Cramer, Hekkert, and Chappin [14], who argued that clear government guidance will facilitate new technology development. Then, positive publicizing of expectations needs to be strengthened and the favorable rules for new technology development should also be designed [6,17], respectively. Finally, the collective goals for IoT development will be realized.
To enhance the innovative IoT developing ecosystem, the Taiwanese government should focus on R&D innovations that can be commercialized for end markets. For example, the government may hold conferences and meetings related to IoT development and define the national research direction, which will make firms become involved in IoT development and will strengthen the linkage of technology collaboration between domestic and international firms and institutes. By implementing such a policy, considerable progress in the setting of technology standards and sustainable technology development will be achieved.
The Function of the Creation of Legitimacy
From the aspect of legitimacy creation, social acceptability (c3) has strong influences on the strengthening of lobby actions (c1) as well as the rise and growth of interest groups (c2). These path relationships imply that IoT technology should first be accepted by society. Then, lobby actions will be initiated. Further, the number of advocacy coalitions will increase. To develop the TIS, advocacy coalitions and political lobby forces should be strong enough to effectively influence policy formulation [7]. That is, with the increase of IoT development, the alliance of firms and interest groups can serve as a useful power that can influence policy formation.
5.2. Policy Implications for Sustainability of IoT in Smart Manufacturing
This research evaluated and analyzed the systemic functions of IoT industrial sustainability based on TIS. The effectiveness of the proposed novel hybrid method was not only verified for analyzing the functions that influence IoT industrial sustainability, but it also provides an understanding as to how the various systemic functions and criteria influence each other based on causal relationships. For policy makers, precise knowledge of the causal relationships between functions and criteria may suggest ways to define innovation policies and enhance the competitiveness of the IoT industry. In brief, such modeling techniques allow policymakers to consider these systemic functions as a causal diagram to help define IoT innovation policies.
The systemic functions and criteria were labeled as groups of causes and effects according to the findings. The priority sequence (refer to Table 14) of enhancement derived from this research is needed to define appropriate innovation policy and thus promote the sustainability of the IoT industry. Based on Figure 3, some suggestions behind the policy formulation of motivating IoT development are illustrated as follows: (1) Based on the point of view of functions in the policy formulation system, the government should preferentially consider how to increase entrepreneurial activities (F1) and promote knowledge development (F2). Additionally, the government should construct a favorable market environment for smart manufacturing of IoT and effectively facilitate the mobilization of human capital and financial resource allocation. Such measures will encourage companies and firms to develop smart manufacturing. (2) Concerning the systemic perspective in the function of entrepreneurial activities, the government should assist with innovation experiments of IoT applications. In addition, launching policy that promotes developmental incubation centers will stimulate and encourage more start-ups and transformation enterprises to enter the market. (3) Government sectors should have strong support from the systemic function of knowledge development to motivate cooperation between related research institutes, SMEs, and universities. Such measures will facilitate a growing number of potential studies and technological development, such as complementary technologies. (4) From the systemic perspective of the function of market formation, the development of standards is the most important task prior to other systemic criteria. This step will influence the reforms of regulations. Therefore, government sectors should encourage and help the formulation of standards for smart manufacturing. In addition, government sectors should also continuously provide subsidies for enterprises to develop IoT applications.
Regarding the function of resource mobilization, government sectors should first raise funds depending on the scale of projects and programs. Previous studies have shown that human capital is a crucial factor in enterprise performance [57]. Cultivating talent and attracting professionals to related IoT industries is indispensable work for the development of smart manufacturing. Thus, government sectors should facilitate the mobilization of human capital, such as education training and talent cultivation.
5.3. Advances in Research Methods
An empirical case was validated for the integrated evaluation model presented by this research. By implementing the rough interval number and Bayesian theory, the proposed approach successfully developed the DEMATEL method, effectively avoiding unclear and inaccurate human judgment views. The robustness of the rough interval number for effectively dealing with imprecise information produced by human judgments has been demonstrated [19,58,59]. The main advantage of Bayesian theory is that it simultaneously considers the prior possibility and conditional possibility of an event for deriving the final result. Combining Bayesian theory and the rough interval number into the DEMATEL method can not only address imprecise opinions, but can also provide a real analytical result.
In addition, according to the proposed model, the authors attempted to adopt the RF to select a set of systemic criteria as the evaluation indicators for use in subsequent evaluation analyses. Before conducting systemic criteria selection, the authors found that the collected data have imbalanced categories. For example, the category of firms makes up the majority of the data set. If we directly use the data for empirical analysis, the research outcome may generate bias. Therefore, we adopted the SMOTE technique to deal with imbalanced categories in data sets. The criteria selection in traditional MCDM primarily relies on the Delphi method. The Delphi method does not consider the imbalanced categories in a data set. Meanwhile, the decision being determined is merely based on experts’ consensus, which will lead to judging bias. The RF is a machine learning technique that has superior classification ability in prior practical cases as compared to other algorithms [60]. At the same time, RF also has the ability to determine suitable variables in terms of the data set and classification results. In order to effectively deal with criteria selection, this research attempted to adopt the SMOTE and RF method for criteria selection.
In this research, the authors successfully verified the effectiveness of the proposed integrated model. Therefore, the proposed model contributes to the MCDM fields. In the future, researchers can expand the proposed model or use this model for their studies. Other group decision-making methods which can deal with subjective judgments [61] can also be adopted. These methods include the consensus cost model [62], the group decision-making model by incorporating social network concepts [63], the decision-making model by integrating heterogeneous information [64], and the fuzzy inference method [65]. Additionally, the proposed model can be used for fields of innovation policy and TIS.
6. Conclusions
To help define innovation policy, the present research proposed a systemic evaluation framework for policymakers. By incorporating the RF-based SMOTE technique, Bayesian theory, rough interval number, and DEMATEL methods, this hybridization system identified the influential relationships between systemic functions and criteria that can enable the TIS and can therefore form the basis for policymakers to formulate appropriate innovation policies. By adopting a theoretical perspective with empirical validation, this research also explored the interrelationships among pivotal systemic functions. In the modeling process, the RF-based SMOTE technique was utilized to select 23 criteria from the raw data with 28 criteria. Then, based on the selected criteria, causal relationships were derived using BR-DEMATEL analysis. Based on the analytical results of this research, from the perspective of systemic functions, entrepreneurial activities directly influence other functions. In other words, such a function needs to be preferentially improved within the policy system. In summary, the proposed method and the empirical findings of this research can help to clarify key functions for the formulation of innovation policy, and thus serve as an effective point of reference for policy makers.
Despite the contributions of this research, there are still several limitations. First, the findings and discussions on perceived causal relationships among systemic criteria and functions were based on samples collected from the smart manufacturing industry in Taiwan, whereas other countries might have different characteristics. Thus, the generalization of these findings needs to be validated. Second, this research uses systemic functions from the literature to explore causal relations in the TIS. Future research can use other theoretical frameworks to conduct an analysis of policy systems. Furthermore, future research can be performed using other methodologies, such as machine learning techniques or other MCDM methods, for comparison. In summary, this research provides a robust causal analysis technique that may result in a more effective policy evaluation system. The results of this research demonstrate that the BR-DEMATEL method, which uses flexible rough intervals to treat the vague and imprecise nature of human judgments, is a useful tool. Additionally, the proposed method can also classify systemic factors into cause and effect groups and generate a causal network. The derived causal diagram enables policy makers to easily determine an enhanced plan for complex problems.
Author Contributions
Y.-S.K. designed, performed research, analyzed the data, and wrote the paper. K.N. advised on the research methods. C.-Y.H. advised on the research methods, re-wrote and proof-read the whole article.
Funding
This article was subsidized by the Taiwan Normal University (NTNU), Taiwan.
Conflicts of Interest
The authors declare no conflicts of interests.
Appendix A
Please check “√” for an appropriate answer.

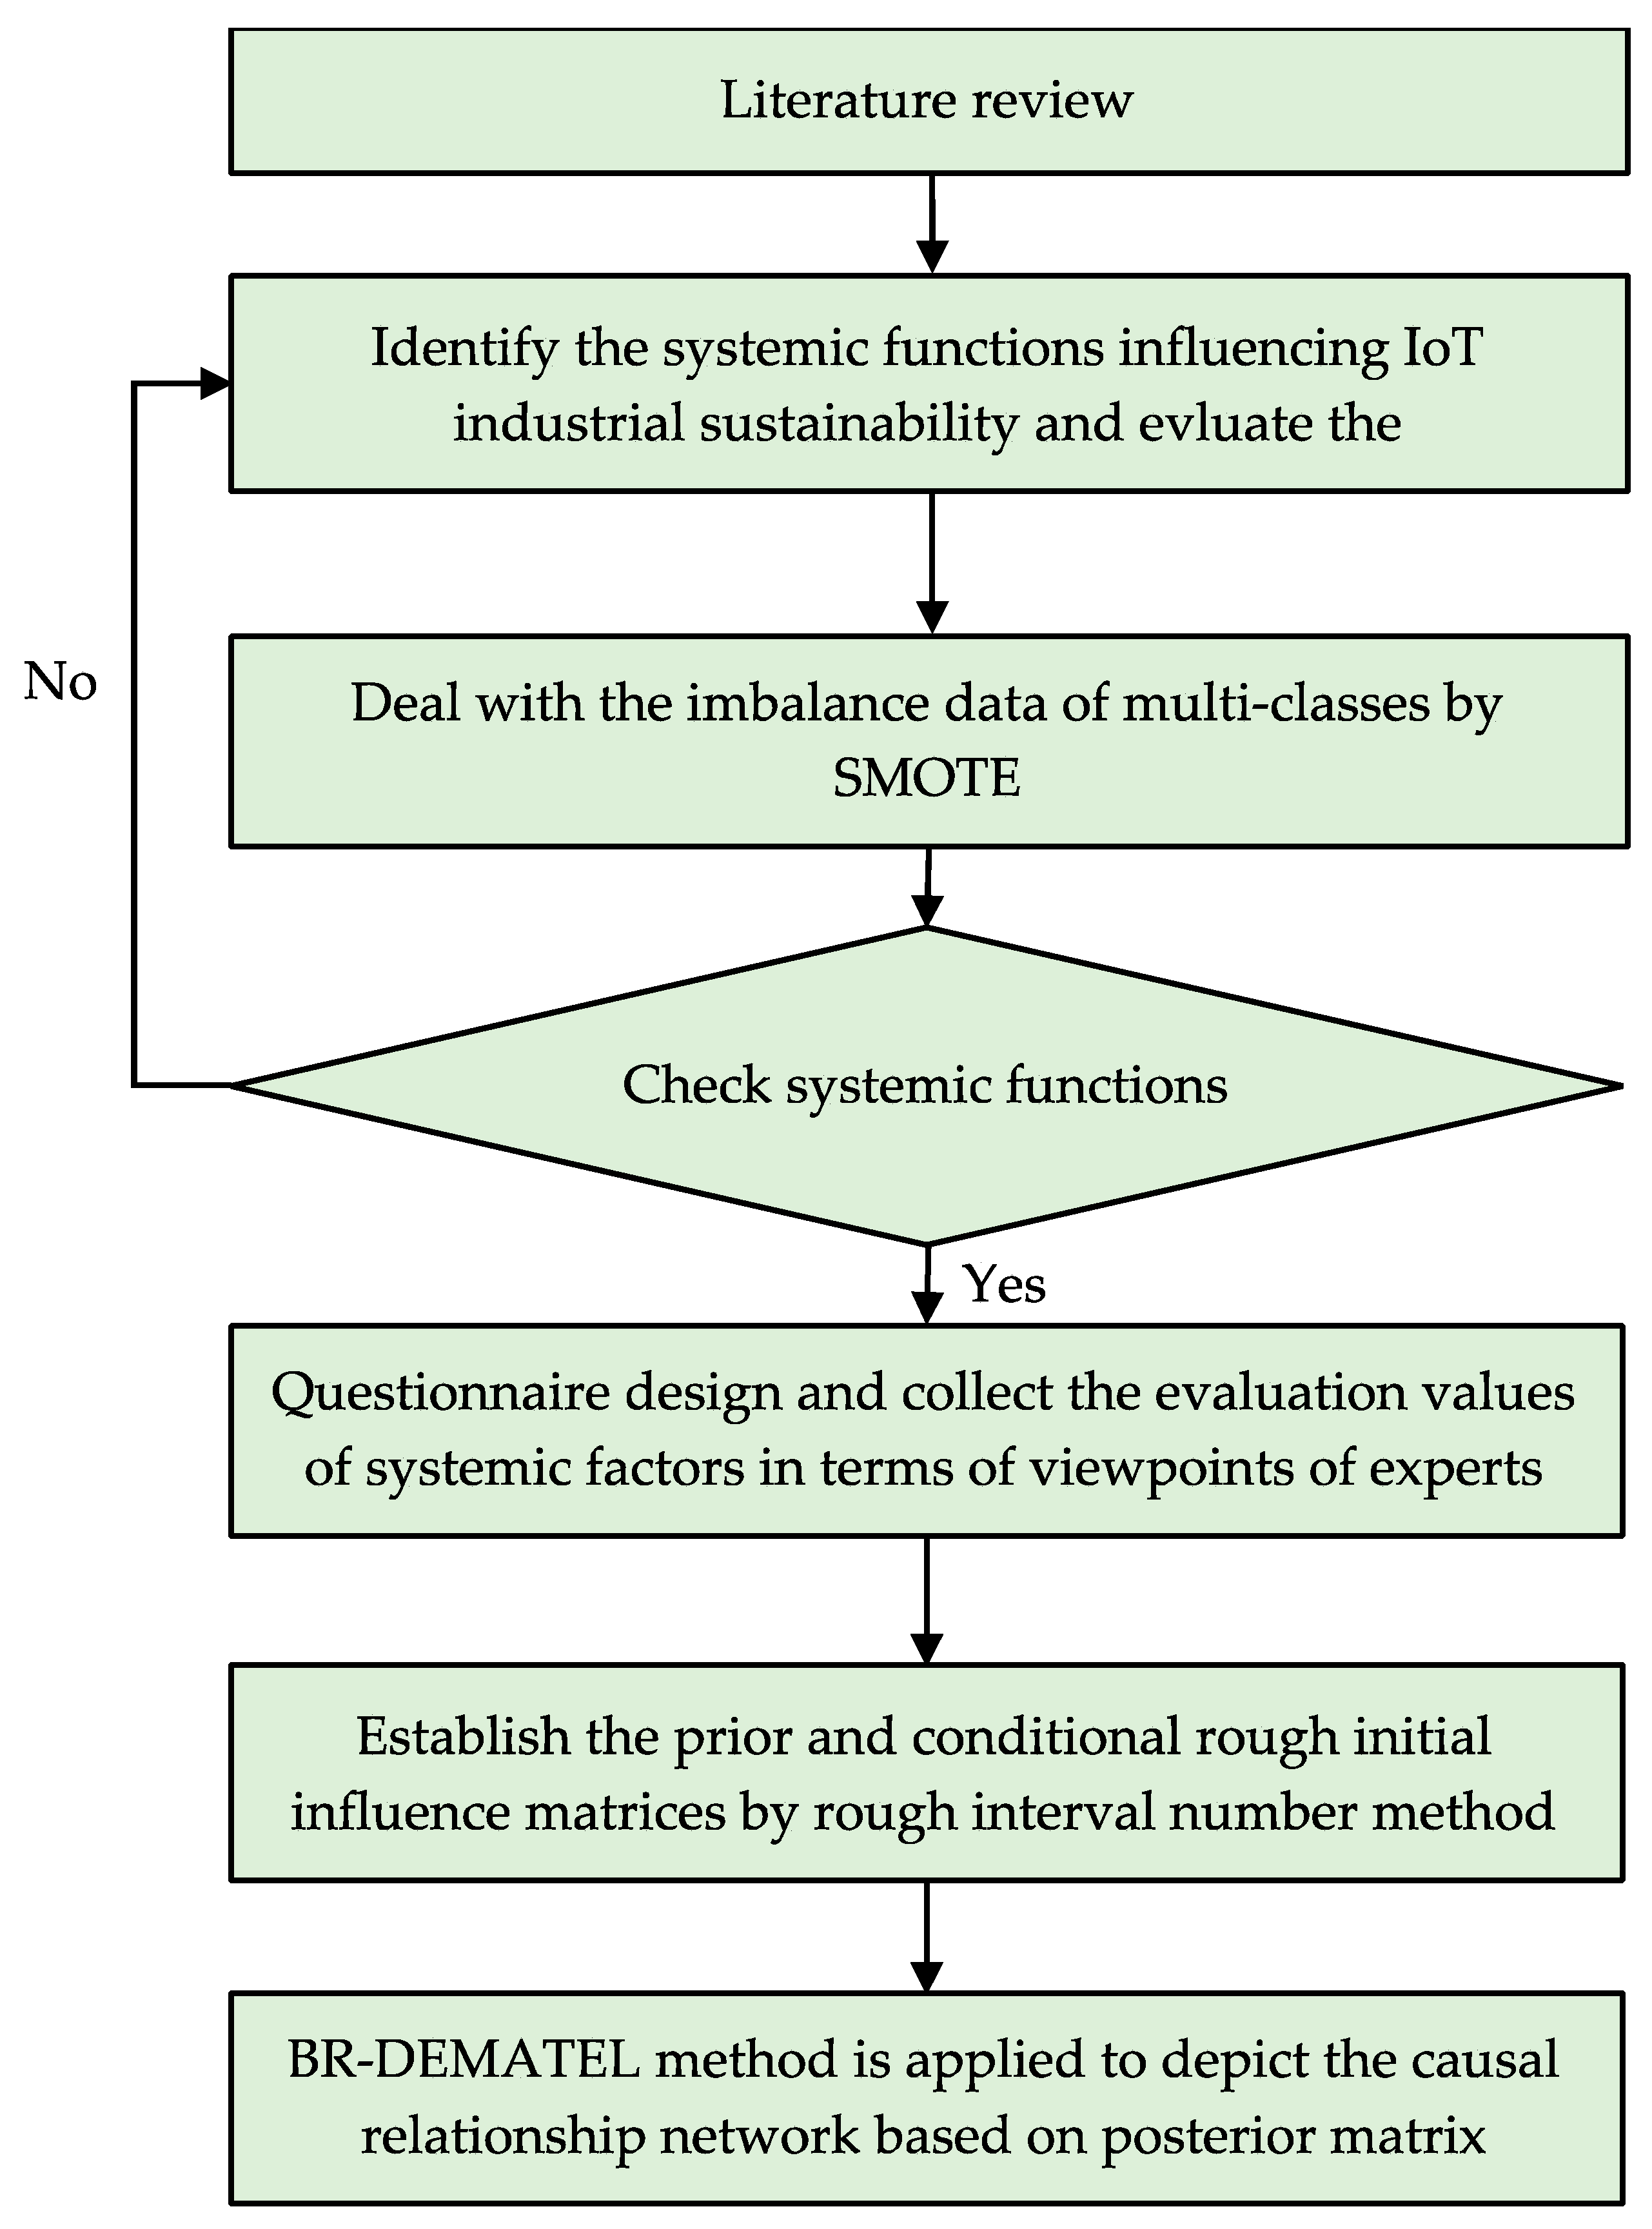
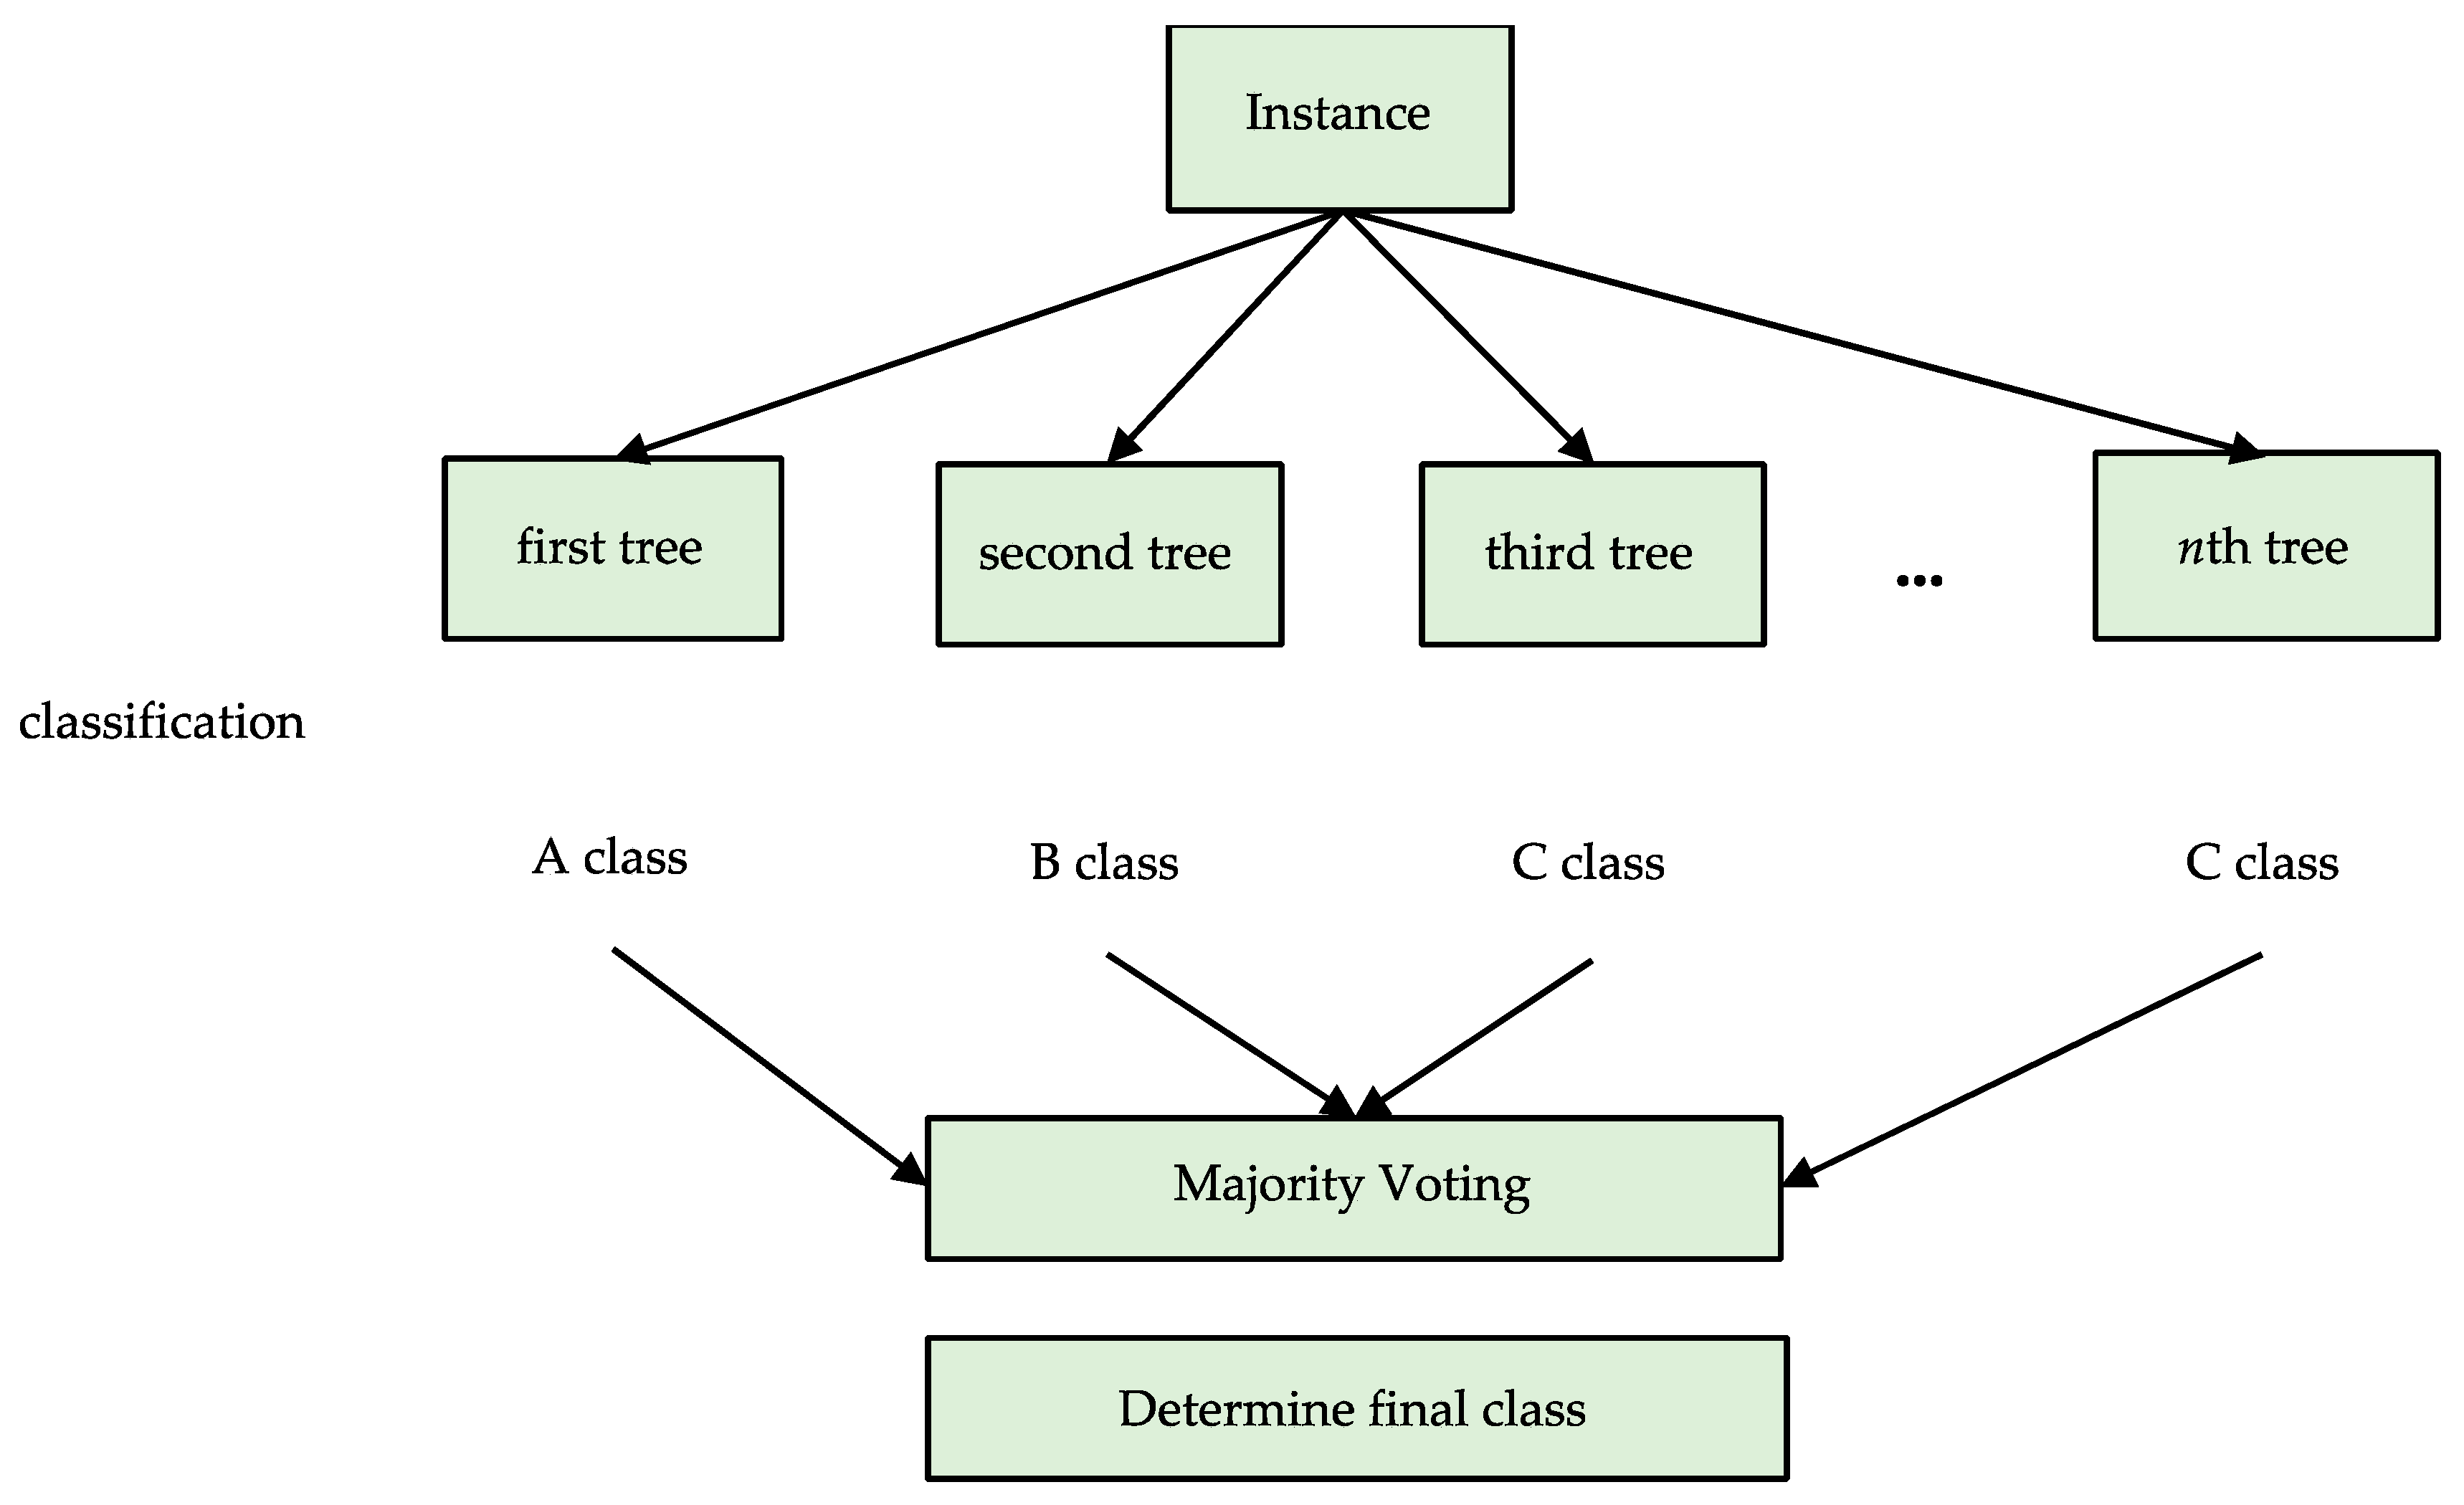
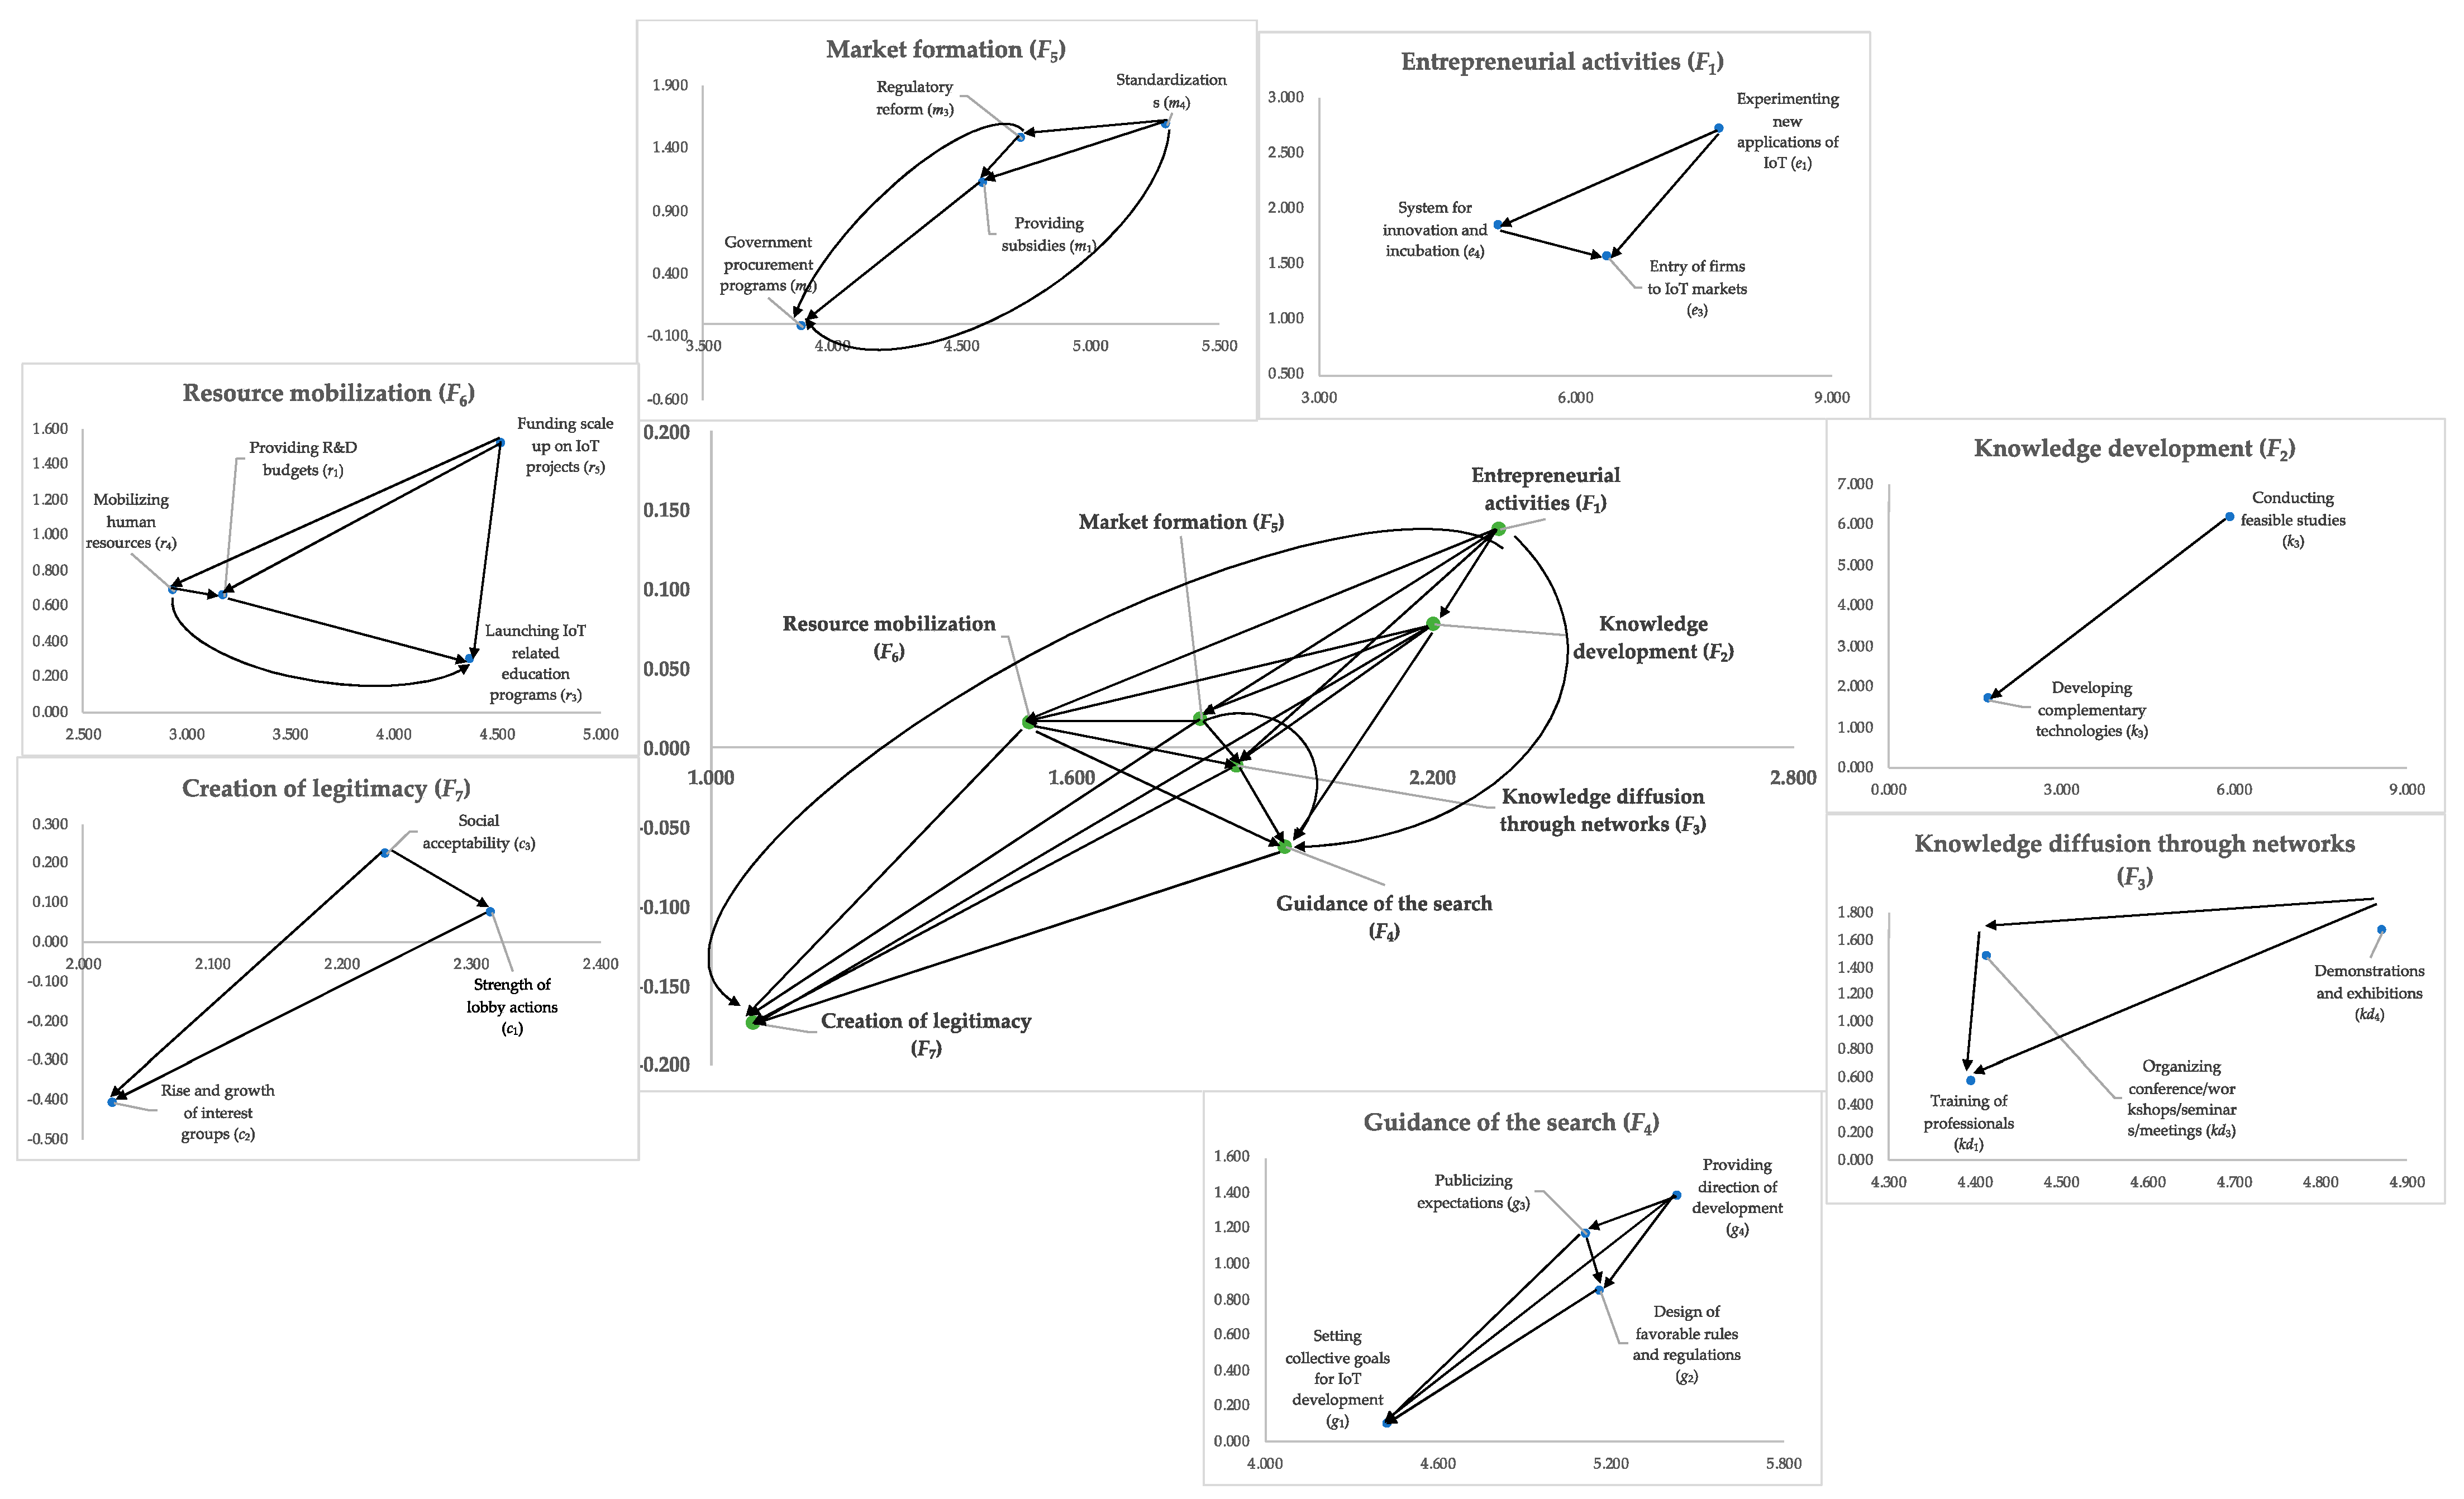
Table A1.
Questionnaires for Evaluating the Importance of Each Criterion.
| Criteria | Symbol | Very High Influence | High Influence | Low Influence | Very Low Importance | No Influence |
|---|---|---|---|---|---|---|
| Experimenting new applications of IoT | e1 | |||||
| Launching pilot IoT projects | e2 | |||||
| Entry of firms to IoT markets | e3 | |||||
| System for innovation and incubation | e4 | |||||
| Conducting feasible studies | k1 | |||||
| IoT market research and assessment | k2 | |||||
| Developing complementary technologies | k3 | |||||
| Network of technology and research cooperation | k4 | |||||
| Training of professionals | d1 | |||||
| Conducting promotion campaigns | d2 | |||||
| Organizing conference/workshops/seminars/meetings | d3 | |||||
| Demonstrations and exhibitions | d4 | |||||
| Setting collective goals for IoT development | g1 | |||||
| Design of favorable rules and regulations | g2 | |||||
| Publicizing expectations | g3 | |||||
| Providing direction of development | g4 | |||||
| Providing subsidies | m1 | |||||
| Government procurement programs | m2 | |||||
| Regulatory reform | m3 | |||||
| Standardizations | m4 | |||||
| Providing R&D budgets | r1 | |||||
| Providing financial grants and loans | r2 | |||||
| Launching IoT related education programs | r3 | |||||
| Mobilizing human resources | r4 | |||||
| Funding scale up on IoT projects | r5 | |||||
| Strength of lobby actions | c1 | |||||
| Rise and growth of interest groups | c2 | |||||
| Social acceptability | c3 |
Appendix B
Please fill the influences of the criteria in the left hand side on the criteria being identified on the top of each column, where a “0” means no influence, a “1” means low influence, a “2” for medium influence, a “3” for high influence, and a “4” for very high influence.
Table A2.
Questionnaires for the Influence from One Criterion to Another Criterion.
| Criteria/Symbol | e1 | e3 | e4 | k1 | k3 | d1 | d3 | d4 | g1 | g2 | g3 | g4 | m1 | m2 | m3 | m4 | r1 | r3 | r4 | r5 | c1 | c2 | c3 | |
|---|---|---|---|---|---|---|---|---|---|---|---|---|---|---|---|---|---|---|---|---|---|---|---|---|
| Experimenting new applications of IoT | e1 | |||||||||||||||||||||||
| Entry of firms to IoT markets | e3 | |||||||||||||||||||||||
| System for innovation and incubation | e4 | |||||||||||||||||||||||
| Conducting feasible studies | k1 | |||||||||||||||||||||||
| Developing complementary technologies | d1 | |||||||||||||||||||||||
| Training of professionals | d4 | |||||||||||||||||||||||
| Organizing conference/workshops/seminars/meetings | g2 | |||||||||||||||||||||||
| Demonstrations and exhibitions | g3 | |||||||||||||||||||||||
| Setting collective goals for IoT development | g4 | |||||||||||||||||||||||
| Design of favorable rules and regulations | m1 | |||||||||||||||||||||||
| Publicizing expectations | m2 | |||||||||||||||||||||||
| Providing direction of development | m3 | |||||||||||||||||||||||
| Providing subsidies | m4 | |||||||||||||||||||||||
| Government procurement programs | r1 | |||||||||||||||||||||||
| Regulatory reform | r3 | |||||||||||||||||||||||
| Standardizations | r4 | |||||||||||||||||||||||
| Providing R&D budgets | r5 | |||||||||||||||||||||||
| Launching IoT related education programs | c2 | |||||||||||||||||||||||
| Mobilizing human resources | c3 | |||||||||||||||||||||||
| Funding scale up on IoT projects | e3 | |||||||||||||||||||||||
| Strength of lobby actions | e4 | |||||||||||||||||||||||
| Rise and growth of interest groups | k1 | |||||||||||||||||||||||
| Social acceptability | k3 |
Appendix C
Table A3.
The Background Information of Experts.
| No. | Industry | Position | No. | Industry | Position |
|---|---|---|---|---|---|
| 1 | Robot Automation Mfg. | Executive director | 9 | Designing and Mfg. | Product Manager |
| 2 | Robot Automation Mfg. | Senior Tech. Engineer | 10 | Smart System Mfg. | R&D Manager |
| 3 | Robot Automation Mfg. | Sales Manager | 11 | Industrial IoT Mfg. | R&D Manager |
| 4 | Industrial Computer and IoT | R&D Assistant Manager | 12 | Industrial IoT Mfg. | R&D Manager |
| 5 | Industrial Computer and IoT | Senior Engineer | 13 | Industrial IoT Mfg. | R&D Manager |
| 6 | Designing and Mfg. | R&D Manager | 14 | Industrial IoT Mfg. | R&D Manager |
| 7 | Designing and Mfg. | R&D Manager | 15 | Industrial IoT Mfg. | R&D Manager |
| 8 | Designing and Mfg. | Tech. Integration Manager |
Remark: “mfg.” is the abbreviation for “manufacturing.”; “tech.” is the abbreviation for “technical”.
References
- Sundmaeker, H.; Guillemin, P.; Friess, P.; Woelfflé, S. Vision and challenges for realising the Internet of Things. Cluster of European Research Projects on the Internet of Things; European Commision: Brussels, Belgium, 2010.
- International Data Corporation. IDC Forecasts Worldwide Technology Spending on the Internet of Things to Reach $1.2 Trillion in 2022; International Data Corporation (IDC): Framingham, MA, USA, 2018. [Google Scholar]
- Geels, F.W. Technological transitions as evolutionary reconfiguration processes: A multi-level perspective and a case-study. Res. Policy 2002, 31, 1257–1274. [Google Scholar] [CrossRef]
- Hekkert, M.P.; Negro, S.O. Functions of innovation systems as a framework to understand sustainable technological change: Empirical evidence for earlier claims. Technol. Forecast. Soc. Chang. 2009, 76, 584–594. [Google Scholar] [CrossRef]
- Carlsson, B.; Jacobsson, S.; Holmén, M.; Rickne, A. Innovation systems: Analytical and methodological issues. Res. Policy 2002, 31, 233–245. [Google Scholar] [CrossRef]
- Bergek, A.; Jacobsson, S.; Carlsson, B.; Lindmark, S.; Rickne, A. Analyzing the functional dynamics of technological innovation systems: A scheme of analysis. Res. Policy 2008, 37, 407–429. [Google Scholar] [CrossRef]
- Breukers, S.; Hisschemöller, M.; Cuppen, E.; Suurs, R. Analysing the past and exploring the future of sustainable biomass. Participatory stakeholder dialogue and technological innovation systems research. Technol. Forecast. Soc. Chang. 2014, 81, 227–235. [Google Scholar] [CrossRef]
- Kebede, K.Y.; Mitsufuji, T. Technological innovation system building for diffusion of renewable energy technology: A case of solar PV systems in Ethiopia. Technol. Forecast. Soc. Chang. 2017, 114, 242–253. [Google Scholar] [CrossRef]
- Wieczorek, A.J.; Hekkert, M.P. Systemic instruments for systemic innovation problems: A framework for policy makers and innovation scholars. Sci. Pub. Policy 2012, 39, 74–87. [Google Scholar] [CrossRef]
- Wieczorek, A.J.; Hekkert, M.P.; Coenen, L.; Harmsen, R. Broadening the national focus in technological innovation system analysis: The case of offshore wind. Environ. Innov. Soc. Trans. 2015, 14, 128–148. [Google Scholar] [CrossRef]
- Liu, G.; Gao, P.; Chen, F.; Yu, J.; Zhang, Y. Technological innovation systems and IT industry sustainability in China: A case study of mobile system innovation. Telemat. Inform. 2018, 35, 1144–1165. [Google Scholar] [CrossRef]
- Wang, J.-H. From technological catch-up to innovation-based economic growth: South Korea and Taiwan compared. J. Dev. Stud. 2007, 43, 1084–1104. [Google Scholar] [CrossRef]
- Chang, P.-L.; Shih, H.-Y. The innovation systems of Taiwan and China: A comparative analysis. Technovation 2004, 24, 529–539. [Google Scholar] [CrossRef]
- Planko, J.; Cramer, J.; Hekkert, M.P.; Chappin, M.M. Combining the technological innovation systems framework with the entrepreneurs’ perspective on innovation. Technol. Anal. Strateg. Manag. 2017, 29, 614–625. [Google Scholar] [CrossRef]
- Kieft, A.; Harmsen, R.; Hekkert, M.P. Interactions between systemic problems in innovation systems: The case of energy-efficient houses in the Netherlands. Environ. Innov. Soc. Trans. 2017, 24, 32–44. [Google Scholar] [CrossRef]
- Reichardt, K.; Negro, S.O.; Rogge, K.S.; Hekkert, M.P. Analyzing interdependencies between policy mixes and technological innovation systems: The case of offshore wind in Germany. Technol. Forecast. Soc. Chang. 2016, 106, 11–21. [Google Scholar] [CrossRef]
- Hekkert, M.P.; Suurs, R.A.; Negro, S.O.; Kuhlmann, S.; Smits, R.E. Functions of innovation systems: A new approach for analysing technological change. Technol. Forecast. Soc. Chang. 2007, 74, 413–432. [Google Scholar] [CrossRef]
- Chatterjee, K.; Pamucar, D.; Zavadskas, E.K. Evaluating the performance of suppliers based on using the R’AMATEL-MAIRCA method for green supply chain implementation in electronics industry. J. Clean. Prod. 2018, 184, 101–129. [Google Scholar] [CrossRef]
- Song, W.; Cao, J. A rough DEMATEL-based approach for evaluating interaction between requirements of product-service system. Comput. Ind. Eng. 2017, 110, 353–363. [Google Scholar] [CrossRef]
- Pamučar, D.; Mihajlović, M.; Obradović, R.; Atanasković, P. Novel approach to group multi-criteria decision making based on interval rough numbers: Hybrid DEMATEL-ANP-MAIRCA model. Exp. Syst. Appl. 2017, 88, 58–80. [Google Scholar] [CrossRef]
- Zhu, G.-N.; Hu, J.; Qi, J.; Gu, C.-C.; Peng, Y.-H. An integrated AHP and VIKOR for design concept evaluation based on rough number. Adv. Eng. Inform. 2015, 29, 408–418. [Google Scholar] [CrossRef]
- Cheng, C.-H.; Liou, J.J.; Chiu, C.-Y. A Consistent Fuzzy Preference Relations Based ANP Model for R&D Project Selection. Sustainability 2017, 9, 1352. [Google Scholar]
- Dong, J.; Huo, H.; Liu, D.; Li, R. Evaluating the Comprehensive Performance of Demand Response for Commercial Customers by Applying Combination Weighting Techniques and Fuzzy VIKOR Approach. Sustainability 2017, 9, 1332. [Google Scholar] [CrossRef]
- Büyüközkan, G.; Güleryüz, S. Evaluation of Renewable Energy Resources in Turkey using an integrated MCDM approach with linguistic interval fuzzy preference relations. Energy 2017, 123, 149–163. [Google Scholar] [CrossRef]
- Zhou, F.; Wang, X.; Lim, M.K.; He, Y.; Li, L. Sustainable recycling partner selection using fuzzy DEMATEL-AEW-FVIKOR: A case study in small-and-medium enterprises (SMEs). J. Clean. Prod. 2018, 196, 489–504. [Google Scholar] [CrossRef]
- Neri, A.; Cagno, E.; Di Sebastiano, G.; Trianni, A. Industrial sustainability: Modelling drivers and mechanisms with barriers. J. Clean. Prod. 2018, 194, 452–472. [Google Scholar] [CrossRef]
- Trianni, A.; Cagno, E.; Neri, A. Modelling barriers to the adoption of industrial sustainability measures. J. Clean. Prod. 2017, 168, 1482–1504. [Google Scholar] [CrossRef]
- Tigabu, A.D.; Berkhout, F.; van Beukering, P. Technology innovation systems and technology diffusion: Adoption of bio-digestion in an emerging innovation system in Rwanda. Technol. Forecast. Soc. Chang. 2015, 90, 318–330. [Google Scholar] [CrossRef]
- Jacobsson, S.; Bergek, A. Innovation system analyses and sustainability transitions: Contributions and suggestions for research. Environ. Innov. Soc. Trans. 2011, 1, 41–57. [Google Scholar] [CrossRef]
- Negro, S.O.; Suurs, R.A.; Hekkert, M.P. The bumpy road of biomass gasification in the Netherlands: Explaining the rise and fall of an emerging innovation system. Technol. Forecast. Soc. Chang. 2008, 75, 57–77. [Google Scholar] [CrossRef]
- Bergek, A.; Hekkert, M.; Jacobsson, S.; Markard, J.; Sandén, B.; Truffer, B. Technological innovation systems in contexts: Conceptualizing contextual structures and interaction dynamics. Environ. Innov. Soc. Trans. 2015, 16, 51–64. [Google Scholar] [CrossRef]
- Edquist, C. Systems of innovation perspectives and challenges. Afr. J. Sci. Technol. Innov. Dev. 2010, 2, 14–45. [Google Scholar]
- Negro, S.O.; Hekkert, M.P.; Smits, R.E. Explaining the failure of the Dutch innovation system for biomass digestion—A functional analysis. Energy Policy 2007, 35, 925–938. [Google Scholar] [CrossRef]
- Suurs, R.A.; Hekkert, M.P. Cumulative causation in the formation of a technological innovation system: The case of biofuels in the Netherlands. Technol. Forecast. Soc. Chang. 2009, 76, 1003–1020. [Google Scholar] [CrossRef]
- Edsand, H.-E. Identifying barriers to wind energy diffusion in Colombia: A function analysis of the technological innovation system and the wider context. Technol. Soc. 2017, 49, 1–15. [Google Scholar] [CrossRef]
- Haley, B. Integrating structural tensions into technological innovation systems analysis: Application to the case of transmission interconnections and renewable electricity in Nova Scotia, Canada. Res. Policy 2018, 47, 1147–1160. [Google Scholar] [CrossRef]
- Tigabu, A.; Berkhout, F.; van Beukering, P. Development aid and the diffusion of technology: Improved cookstoves in Kenya and Rwanda. Energy Policy 2017, 102, 593–601. [Google Scholar] [CrossRef]
- Sagar, A.D.; Van der Zwaan, B. Technological innovation in the energy sector: R&D, deployment, and learning-by-doing. Energy Policy 2006, 34, 2601–2608. [Google Scholar]
- Mohr, J.J.; Sengupta, S.; Slater, S.F. Marketing of High-Technology Products and Innovations; Pearson Prentice Hall: New Jersey, NJ, USA, 2010. [Google Scholar]
- Chawla, N.V.; Bowyer, K.W.; Hall, L.O.; Kegelmeyer, W.P. SMOTE: Synthetic minority over-sampling technique. J. Artif. Intell. Res. 2002, 16, 321–357. [Google Scholar] [CrossRef]
- Han, H.; Wang, W.-Y.; Mao, B.-H. Borderline-SMOTE: A New Over-Sampling Method in Imbalanced Data Sets Learning; Springer: Berlin/Heidelberg, Germany, 2005; pp. 878–887. [Google Scholar]
- Assouline, D.; Mohajeri, N.; Scartezzini, J.-L. Large-scale rooftop solar photovoltaic technical potential estimation using Random Forests. Appl. Energy 2018, 217, 189–211. [Google Scholar] [CrossRef]
- Breiman, L. Bagging predictors. Mach. Learn. 1996, 24, 123–140. [Google Scholar] [CrossRef]
- Tzeng, G.-H.; Shen, K.-Y. New Concepts and Trends of Hybrid Multiple Criteria Decision Making; CRC Press: New York, NY, USA, 2017. [Google Scholar]
- Pawlak, Z. Rough sets. Int. J. Comput. Inform. Sci. 1982, 11, 341–356. [Google Scholar] [CrossRef]
- Tzeng, G.-H.; Huang, J.-J. Multiple Attribute Decision Making: Methods and Applications; CRC Press: New York, NY, USA, 2011. [Google Scholar]
- Huang, C.-Y.; Shyu, J.Z.; Tzeng, G.-H. Reconfiguring the innovation policy portfolios for Taiwan’s SIP Mall industry. Technovation 2007, 27, 744–765. [Google Scholar] [CrossRef]
- Opricovic, S.; Tzeng, G.-H. Defuzzification within a multicriteria decision model. Int. J. Uncertain. Fuzziness Knowl. Based Syst. 2003, 11, 635–652. [Google Scholar] [CrossRef]
- Geng, R.; Mansouri, S.A.; Aktas, E.; Yen, D.A. The role of Guanxi in green supply chain management in Asia’s emerging economies: A conceptual framework. Ind. Mark. Manag. 2017, 63, 1–17. [Google Scholar] [CrossRef]
- Sixt, G.N.; Klerkx, L.; Griffin, T.S. Transitions in water harvesting practices in Jordan’s rainfed agricultural systems: Systemic problems and blocking mechanisms in an emerging technological innovation system. Environ. Sci. Policy 2017, 84, 235–249. [Google Scholar] [CrossRef]
- Biernacki, P.; Waldorf, D. Snowball sampling: Problems and techniques of chain referral sampling. Sociol. Methods Res. 1981, 10, 141–163. [Google Scholar] [CrossRef]
- Stephan, A.; Schmidt, T.S.; Bening, C.R.; Hoffmann, V.H. The sectoral configuration of technological innovation systems: Patterns of knowledge development and diffusion in the lithium-ion battery technology in Japan. Res. Policy 2017, 46, 709–723. [Google Scholar] [CrossRef]
- Van Oers, L.M.; Boon, W.; Moors, E.H. The creation of legitimacy in grassroots organisations. A study of Dutch community supported agriculture. Environ. Innov. Soc. Trans. 2018, 29, 55–67. [Google Scholar] [CrossRef]
- Zahra, S.A. Corporate entrepreneurship as knowledge creation and conversion: The role of entrepreneurial hubs. Small Bus. Econ. 2015, 44, 727–735. [Google Scholar] [CrossRef]
- Gans, J.S.; Stern, S. The product market and the market for “ideas”: Commercialization strategies for technology entrepreneurs. Res. Policy 2003, 32, 333–350. [Google Scholar] [CrossRef]
- Choi, J.; Yeniyurt, S. Contingency distance factors and international research and development (R&D), marketing, and manufacturing alliance formations. Int. Bus. Rev. 2015, 24, 1061–1071. [Google Scholar]
- Chatterji, A.; Patro, A. Dynamic capabilities and managing human capital. Acad. Manag. Perspect. 2014, 28, 395–408. [Google Scholar] [CrossRef]
- Song, W.; Ming, X.; Liu, H.-C. Identifying critical risk factors of sustainable supply chain management: A rough strength-relation analysis method. J. Clean. Prod. 2017, 143, 100–115. [Google Scholar] [CrossRef]
- Zhai, L.-Y.; Khoo, L.-P.; Zhong, Z.-W. A rough set based QFD approach to the management of imprecise design information in product development. Adv. Eng. Inform. 2009, 23, 222–228. [Google Scholar] [CrossRef]
- Belgiu, M.; Drăguţ, L. Random forest in remote sensing: A review of applications and future directions. ISPRS 2016, 114, 24–31. [Google Scholar] [CrossRef]
- Kou, G.; Ergu, D.; Lin, C.; Chen, Y. Pairwise comparison matrix in multiple criteria decision making. Technol. Econ. Dev. Econ. 2016, 22, 738–765. [Google Scholar] [CrossRef]
- Zhang, H.; Kou, G.; Peng, Y. Soft consensus cost models for group decision making and economic interpretations. Eur. J. Oper. Res. 2019. In Press. [Google Scholar] [CrossRef]
- Dong, Y.; Zha, Q.; Zhang, H.; Kou, G.; Fujita, H.; Chiclana, F.; Herrera-Viedma, E. Consensus reaching in social network group decision making: Research paradigms and challenges. Knowl. Based Syst. 2018, 162, 3–13. [Google Scholar] [CrossRef]
- Li, G.; Kou, G.; Peng, Y. A group decision making model for integrating heterogeneous information. IEEE Trans. Syst. Man Cybern. Syst. 2018, 48, 982–992. [Google Scholar] [CrossRef]
- Moradi, S.; Rafiei, F.M. A dynamic credit risk assessment model with data mining techniques: Evidence from Iranian banks. Financ. Innov. 2019, 5, 15. [Google Scholar] [CrossRef]
Figure 1.
Analytical procedure of the proposed hybrid model.

Figure 2.
RF operation process.

Figure 3.
The IRM.

Table 1.
Description of crucial systemic analytical factors of TIS.
| Functions | Symbol | Features/Criteria |
|---|---|---|
| Entrepreneurial activities (F1) | e1 | Experimenting new applications of IoT |
| e2 | Launching pilot IoT projects | |
| e3 | Entry of firms to IoT markets | |
| e4 | System for innovation and incubation | |
| Knowledge development (F2) | k1 | Conducting feasible studies |
| k2 | IoT market research and assessment | |
| k3 | Developing complementary technologies | |
| k4 | Network of technology and research cooperation | |
| Knowledge diffusion through networks (F3) | d1 | Training of professionals |
| d2 | Conducting promotion campaigns | |
| d3 | Organizing conference/workshops/seminars/meetings | |
| d4 | Demonstrations and exhibitions | |
| Guidance of the search (F4) | g1 | Setting collective goals for IoT development |
| g2 | Design of favorable rules and regulations | |
| g3 | Publicizing expectations | |
| g4 | Providing direction of development | |
| Market formation (F5) | m1 | Providing subsidies |
| m2 | Government procurement programs | |
| m3 | Regulatory reform | |
| m4 | Standardizations | |
| Resource mobilization (F6) | r1 | Providing R&D budgets |
| r2 | Providing financial grants and loans | |
| r3 | Launching IoT related education programs | |
| r4 | Mobilizing human resources | |
| r5 | Funding scale up on IoT projects | |
| Creation of legitimacy (F7) | c1 | Strength of lobby actions |
| c2 | Rise and growth of interest groups | |
| c3 | Social acceptability |
Table 2.
The accuracy of classification between re-sampled data and original data.
| Algorithms | Re-Sampled Data | Original Data | ||||
|---|---|---|---|---|---|---|
| Training | Testing | Validation | Training | Testing | Validation | |
| RF | 0.756 | 0.822 | 0.756 | 0.699 | 0.667 | 0.682 |
| LR | 0.698 | 0.667 | 0.689 | 0.573 | 0.714 | 0.636 |
| LS-SVM | 0.683 | 0.689 | 0.667 | 0.463 | 0.619 | 0.727 |
| RBF-SVM | 0.750 | 0.711 | 0.644 | 0.699 | 0.667 | 0.636 |
| GB | 0.712 | 0.889 | 0.733 | 0.601 | 0.714 | 0.596 |
Table 3.
Derived criteria within six systemic functions.
| Entrepreneurial activities (F1) | e1, e3, e4 |
| Knowledge development (F2) | k1, k3 |
| Knowledge diffusion through networks (F3) | kd1, kd3, kd4 |
| Guidance of the search (F4) | g1, g2, g3, g4 |
| Market formation (F5) | m1, m2, m3, m4 |
| Resource mobilization (F6) | r1, r3, r4, r5 |
| Creation of legitimacy (F7) | c1, c2, c3 |
Table 4.
The initial influence matrices by decision makers.
| DM1 | |||||||||||
| e1 | e3 | e4 | k1 | k3 | kd1 | … | r5 | c1 | c2 | c3 | |
| e1 | (0;0), | (4;0) | (4;4) | (4;4) | (4;4) | (4;4) | … | (4;4) | (4;4) | (4;4) | (4;4) |
| e3 | (4;4) | (0;0) | (4;4) | (4;4) | (4;4) | (4;4) | … | (4;4) | (4;4) | (4;4) | (4;4) |
| e4 | (3;3) | (2;2) | (0;0) | (3;3) | (2;2) | (3;3) | … | (4;3) | (2;3) | (2;3) | (2;2) |
| k1 | (4;3) | (4;3) | (4;4) | (0;0) | (4;4) | (4;4) | … | (4;3) | (4;2) | (4;2) | (4;2) |
| k3 | (4;4) | (4;4) | (4;4) | (3;3) | (0;0) | (3;3) | … | (3;2) | (3;2) | (3;2) | (3;2) |
| kd1 | (4;4) | (4;4) | (3;3) | (3;3) | (2;2) | (0;0) | … | (2;4) | (3;4) | (2;4) | (2;4) |
| … | … | … | … | … | … | … | … | … | … | … | … |
| r5 | (4;4) | (4;4) | (4;4) | (4;4) | (4;4) | (4;4) | … | (0;0) | (1;1) | (1;1) | (2;1) |
| c1 | (1;2) | (1;3) | (1;2) | (1;2) | (3;3) | (2;2) | … | (2;2) | (0;0) | (4;3) | (2;2) |
| c2 | (1;2) | (1;3) | (1;2) | (1;2) | (3;2) | (1;1) | … | (1;1) | (4;2) | (0;0) | (2;2) |
| c3 | (3;3) | (4;4) | (2;2) | (3;3) | (2;2) | (2;2) | … | (1;1) | (4;3) | (4;3) | (0;0) |
| ⋮ | |||||||||||
| DM15 | |||||||||||
| e1 | e3 | e4 | k1 | k3 | kd1 | … | r5 | c1 | c2 | c3 | |
| e1 | (0;0) | (4;4) | (4;4) | (4;4) | (4;4) | (4;4) | … | (3;4) | (2;4) | (2;4) | (2;4) |
| e3 | (4;3) | (0;0) | (4;4) | (4;4) | (4;4) | (4;4) | … | (4;1) | (4;1) | (4;3) | (4;2) |
| e4 | (2;4) | (2;4) | (0;0) | (2;4) | (2;4) | (4;4) | … | (4;3) | (4;3) | (4;3) | (4;2) |
| k1 | (4;4) | (4;4) | (2;4) | (0;0) | (4;4) | (4;4) | … | (3;3) | (2;2) | (2;2) | (2;2) |
| k3 | (4;4) | (4;4) | (4;4) | (3;4) | (0;0) | (4;4) | … | (2;2) | (2;2) | (2;2) | (2;2) |
| kd1 | (4;4) | (4;4) | (3;3) | (4;4) | (4;3) | (0;0) | … | (1;1) | (1;1) | (1;1) | (1;1) |
| … | … | … | … | … | … | … | … | … | … | … | … |
| r5 | (4;4) | (4;4) | (3;2) | (4;4) | (4;4) | (4;4) | … | (0;0) | (1;1) | (1;1) | (2;1) |
| c1 | (3;2) | (3;3) | (3;2) | (3;2) | (3;3) | (1;2) | … | (2;2) | (0;0) | (4;3) | (2;3) |
| c2 | (1;2) | (1;3) | (1;4) | (1;2) | (1;2) | (1;3) | … | (1;3) | (4;3) | (0;0) | (2;3) |
| c3 | (4;2) | (4;3) | (3;2) | (4;4) | (2;2) | (1;2) | … | (3;1) | (3;4) | (4;4) | (0;0) |
Table 5.
The rough direct influence relation matrix, .
| e1 | e3 | e4 | … | c2 | c3 | |
| e1 | [0.000, 0.000] | [4.000, 4.000] | [4.000, 4.000] | … | [2.251, 3.229] | [2.073, 3.135] |
| e3 | [3.125, 3.793] | [0.000, 0.000] | [1.026, 2.970] | … | [2.293, 3.322] | [2.167, 3.306] |
| e4 | [2.926, 3.470] | [2.142, 2.924] | [0.000, 0.000] | … | [2.074, 2.760] | [1.898, 2.509] |
| k1 | [3.360, 3.840] | [3.284, 3.782] | [3.742, 3.991] | … | [2.467, 3.404] | [1.547, 3.042] |
| k3 | [3.640, 3.960] | [4.000, 4.000] | [3.640, 3.960] | … | [2.218, 2.716] | [1.435, 2.173] |
| kd1 | [3.640, 3.960] | [3.871, 3.996] | [3.004, 3.129] | … | [1.857, 2.963] | [1.367, 2.421] |
| … | … | … | … | … | … | … |
| r5 | [3.871, 3.996] | [3.871, 3.996] | [3.125, 3.793] | … | [1.018, 1.249] | [1.542, 2.328] |
| c1 | [0.808, 2.280] | [0.681, 2.098] | [0.817, 2.132] | … | [3.360, 3.840] | [1.747, 2.640] |
| c2 | [0.538, 1.138] | [0.637, 1.233] | [0.638, 1.071] | … | [0.000, 0.000] | [1.650, 2.350] |
| c3 | [2.542, 3.547] | [3.253, 3.947] | [1.996, 2.816] | … | [2.381, 3.674] | [0.000, 0.000] |
Table 6.
The rough direct influence relation matrix, .
| e1 | e3 | e4 | … | c2 | c3 | |
| e1 | [0.000, 0.000] | [3.278, 3.973] | [3.871, 3.996] | … | [3.593, 3.982] | [3.502, 3.964] |
| e3 | [3.125, 3.793] | [0.000, 0.000] | [2.059, 3.607] | … | [2.639, 3.617] | [2.771, 3.749] |
| e4 | [2.360, 3.253] | [1.997, 2.945] | [0.000, 0.000] | … | [2.360, 3.253] | [2.080, 2.720] |
| k1 | [2.495, 3.463] | [2.781, 3.466] | [2.799, 3.714] | … | [1.769, 2.363] | [2.160, 2.640] |
| k3 | [3.593, 3.982] | [3.751, 3.982] | [2.128, 3.304] | … | [2.036, 2.498] | [2.036, 2.498] |
| kd1 | [2.840, 3.874] | [2.840, 3.874] | [2.502, 2.964] | … | [1.333, 2.667] | [1.519, 3.151] |
| … | … | … | … | … | … | … |
| r5 | [3.871, 3.996] | [3.871, 3.996] | [1.969, 2.951] | … | [1.000, 1.000] | [1.004, 1.129] |
| c1 | [2.354, 3.386] | [3.007, 3.651] | [2.000, 2.000] | … | [3.000, 3.000] | [2.751, 2.982] |
| c2 | [2.320, 3.280] | [2.349, 3.130] | [2.273, 2.938] | … | [0.000, 0.000] | [2.751, 2.982] |
| c3 | [2.672, 3.458] | [2.273, 3.308] | [2.166, 3.053] | … | [3.198, 3.850] | [0.000, 0.000] |
Table 7.
The normalized rough direct influence relation matrix, .
| e1 | e3 | e4 | … | c2 | c3 | |
| e1 | [0.000, 0.000] | [0.049, 0.049] | [0.049, 0.049] | … | [0.027, 0.039] | [0.025, 0.038] |
| e3 | [0.038, 0.046] | [0.000, 0.000] | [0.012, 0.036] | … | [0.028, 0.040] | [0.026, 0.040] |
| e4 | [0.036, 0.042] | [0.026, 0.036] | [0.000, 0.000] | … | [0.025, 0.034] | [0.023, 0.030] |
| k1 | [0.041, 0.047] | [0.040, 0.046] | [0.045, 0.048] | … | [0.030, 0.041] | [0.019, 0.037] |
| k3 | [0.041, 0.048] | [0.049, 0.049] | [0.044, 0.048] | … | [0.027, 0.033] | [0.017, 0.026] |
| kd1 | [0.044, 0.048] | [0.047, 0.049] | [0.036, 0.038] | … | [0.023, 0.036] | [0.017, 0.029] |
| … | … | … | … | … | … | … |
| r5 | [0.047, 0.049] | [0.047, 0.049] | [0.038, 0.046] | … | [0.012, 0.015] | [0.019, 0.028] |
| c1 | [0.010, 0.028] | [0.008, 0.025] | [0.010, 0.026] | … | [0.041, 0.047] | [0.021, 0.032] |
| c2 | [0.007, 0.014] | [0.008, 0.015] | [0.008, 0.013] | … | [0.000, 0.000] | [0.020, 0.029] |
| c3 | [0.031, 0.043] | [0.040, 0.048] | [0.024, 0.034] | … | [0.029, 0.045] | [0.000, 0.000] |
Table 8.
The normalized rough direct influence relation matrix, .
| e1 | e3 | e4 | … | c2 | c3 | |
| e1 | [0.000, 0.000] | [0.038, 0.046] | [0.044, 0.046] | … | [0.041, 0.046] | [0.040, 0.045] |
| e3 | [0.036, 0.044] | [0.000, 0.000] | [0.024, 0.041] | … | [0.030, 0.042] | [0.032, 0.043] |
| e4 | [0.027, 0.037] | [0.023, 0.034] | [0.000, 0.000] | … | [0.027, 0.037] | [0.024, 0.031] |
| k1 | [0.029, 0.040] | [0.032, 0.040] | [0.032, 0.043] | … | [0.020, 0.027] | [0.025, 0.030] |
| k3 | [0.041, 0.046] | [0.043, 0.046] | [0.024, 0.038] | … | [0.023, 0.029] | [0.023, 0.029] |
| kd1 | [0.033, 0.044] | [0.033, 0.044] | [0.029, 0.034] | … | [0.015, 0.031] | [0.017, 0.036] |
| … | … | … | … | … | … | … |
| r5 | [0.044, 0.046] | [0.044, 0.046] | [0.023, 0.034] | … | [0.011, 0.011] | [0.012, 0.013] |
| c1 | [0.027, 0.039] | [0.035, 0.042] | [0.023, 0.023] | … | [0.034, 0.034] | [0.032, 0.034] |
| c2 | [0.027, 0.038] | [0.027, 0.036] | [0.026, 0.034] | … | [0.000, 0.000] | [0.032, 0.034] |
| c3 | [0.031, 0.040] | [0.026, 0.038] | [0.025, 0.035] | … | [0.037, 0.044] | [0.000, 0.000] |
Table 9.
The rough total influence relation matrix, .
| e1 | e3 | e4 | … | c2 | c3 | |
| e1 | [0.082, 0.240] | [0.128, 0.281] | [0.114, 0.257] | … | [0.083, 0.222] | [0.071, 0.218] |
| e3 | [0.106, 0.280] | [0.069, 0.232] | [0.070, 0.243] | … | [0.074, 0.221] | [0.065, 0.217] |
| e4 | [0.106, 0.263] | [0.097, 0.252] | [0.060, 0.196] | … | [0.074, 0.203] | [0.064, 0.197] |
| k1 | [0.111, 0.275] | [0.111, 0.270] | [0.103, 0.249] | … | [0.078, 0.217] | [0.059, 0.210] |
| k3 | [0.111, 0.260] | [0.115, 0.257] | [0.099, 0.235] | … | [0.073, 0.197] | [0.056, 0.188] |
| kd1 | [0.110, 0.239] | [0.103, 0.236] | [0.083, 0.206] | … | [0.062, 0.184] | [0.049, 0.175] |
| … | … | … | … | … | … | … |
| r5 | [0.011, 0.254] | [0.111, 0.251] | [0.092, 0.228] | … | [0.058, 0.175] | [0.056, 0.184] |
| c1 | [0.044, 0.174] | [0.043, 0.170] | [0.038, 0.155] | … | [0.064, 0.159] | [0.040, 0.143] |
| c2 | [0.034, 0.115] | [0.035, 0.114] | [0.031, 0.102] | … | [0.020, 0.079] | [0.036, 0.104] |
| c3 | [0.068, 0.187] | [0.076, 0.189] | [0.055, 0.162] | … | [0.056, 0.157] | [0.022, 0.111] |
Table 10.
The rough total influence relation matrix, .
| e1 | e3 | e4 | … | c2 | c3 | |
| e1 | [0.087, 0.170] | [0.120, 0.209] | [0.111, 0.191] | … | [0.100, 0.167] | [0.099, 0.164] |
| e3 | [0.095, 0.200] | [0.058, 0.154] | [0.071, 0.177] | … | [0.072, 0.155] | [0.074, 0.154] |
| e4 | [0.087, 0.181] | [0.080, 0.173] | [0.047, 0.125] | … | [0.068, 0.141] | [0.065, 0.133] |
| k1 | [0.098, 0.184] | [0.098, 0.180] | [0.086, 0.167] | … | [0.068, 0.132] | [0.073, 0.133] |
| k3 | [0.117, 0.200] | [0.115, 0.196] | [0.084, 0.172] | … | [0.076, 0.141] | [0.076, 0.139] |
| kd1 | [0.078, 0.184] | [0.076, 0.180] | [0.065, 0.155] | … | [0.047, 0.132] | [0.050, 0.135] |
| … | … | … | … | … | … | … |
| r5 | [0.110, 0.173] | [0.107, 0.169] | [0.075, 0.145] | … | [0.058, 0.105] | [0.058, 0.105] |
| c1 | [0.077, 0.140] | [0.082, 0.140] | [0.063, 0.112] | … | [0.068, 0.108] | [0.066, 0.106] |
| c2 | [0.076, 0.142] | [0.074, 0.137] | [0.065, 0.124] | … | [0.035, 0.077] | [0.066, 0.109] |
| c3 | [0.077, 0.142] | [0.071, 0.138] | [0.062, 0.124] | … | [0.069, 0.119] | [0.034, 0.075] |
Table 11.
The rough total influence relation matrix, .
| e1 | e3 | e4 | … | c2 | c3 | |
| e1 | [0.089, 0.232] | [0.191, 0.335] | [0.158, 0.280] | … | [0.103, 0.211] | [0.088, 0.204] |
| e3 | [0.126, 0.319] | [0.050, 0.203] | [0.062, 0.244] | … | [0.066, 0.194] | [0.059, 0.190] |
| e4 | [0.115, 0.270] | [0.098, 0.249] | [0.035, 0.139] | … | [0.062, 0.163] | [0.052, 0.149] |
| k1 | [0.137, 0.288] | [0.136, 0.277] | [0.111, 0.237] | … | [0.066, 0.163] | [0.054, 0.159] |
| k3 | [0.161, 0.297] | [0.165, 0.286] | [0.104, 0.230] | … | [0.069, 0.159] | [0.053, 0.149] |
| kd1 | [0.097, 0.250] | [0.098, 0.241] | [0.067, 0.182] | … | [0.037, 0.138] | [0.030, 0.134] |
| … | … | … | … | … | … | … |
| r5 | [0.152, 0.250] | [0.149, 0.242] | [0.086, 0.187] | … | [0.042, 0.105] | [0.040, 0.110] |
| c1 | [0.042, 0.140] | [0.044, 0.136] | [0.030, 0.099] | … | [0.054, 0.098] | [0.033, 0.086] |
| c2 | [0.032, 0.093] | [0.033, 0.089] | [0.025, 0.072] | … | [0.009, 0.035] | [0.029, 0.065] |
| c3 | [0.065, 0.151] | [0.067, 0.148] | [0.043, 0.114] | … | [0.048, 0.106] | [0.009, 0.047] |
Table 12.
The rough and de-roughness values of r + c and r − c for the systemic criteria.
| e1 | [3.334, 6.174] | [2.505, 5.335] | 5.208 | 2.505 | 7.713 | 2.702 |
| e3 | [1.957, 5.668] | [2.417, 5.115] | 3.971 | 2.417 | 6.388 | 1.554 |
| e4 | [2.051, 4.872] | [1.648, 4.096] | 3.476 | 1.648 | 5.124 | 1.828 |
| k1 | [2.373, 5.101] | [2.016, 4.847] | 3.842 | 2.106 | 5.948 | 1.737 |
| k3 | [2.470, 5.097] | [2.228, 4.796] | 3.901 | 2.228 | 6.129 | 1.674 |
| kd1 | [1.294, 4.146] | [1.916, 4.696] | 2.481 | 1.916 | 4.397 | 0.566 |
| kd3 | [1.694, 4.429] | [1.472, 4.338] | 2.943 | 1.472 | 4.415 | 1.471 |
| kd4 | [1.743, 4.869] | [1.606, 4.358] | 3.265 | 1.606 | 4.871 | 1.660 |
| g1 | [1.353, 3.700] | [2.615, 4.661] | 2.260 | 2.165 | 4.425 | 0.095 |
| g2 | [1.987, 4.209] | [2.161, 4.527] | 3.005 | 2.161 | 5.166 | 0.845 |
| g3 | [2.022, 4.386] | [1.975, 4.155] | 3.140 | 1.975 | 5.114 | 1.165 |
| g4 | [2.315, 4.506] | [2.023, 4.251] | 3.408 | 2.023 | 5.431 | 1.385 |
| m1 | [1.964, 3.981] | [1.733, 3.947] | 2.853 | 1.733 | 4.586 | 1.120 |
| m2 | [1.388, 3.039] | [1.951, 4.215] | 1.935 | 1.951 | 3.886 | −0.016 |
| m3 | [1.793, 4.577] | [1.628, 3.623] | 3.106 | 1.628 | 4.733 | 1.478 |
| m4 | [2.175, 4.705] | [1.853, 4.096] | 3.447 | 1.853 | 5.300 | 1.594 |
| r1 | [1.109, 3.409] | [1.267, 3.283] | 1.917 | 1.267 | 3.184 | 0.650 |
| r3 | [1.698, 3.376] | [2.041, 4.240] | 2.331 | 2.041 | 4.372 | 0.291 |
| r4 | [1.426, 2.711] | [1.125, 2.791] | 1.813 | 1.125 | 2.938 | 0.689 |
| r5 | [2.117, 4.094] | [1.506, 3.239] | 3.022 | 1.506 | 4.528 | 1.517 |
| c1 | [0.846, 2.322] | [1.120, 2.746] | 1.196 | 1.120 | 2.316 | 0.077 |
| c2 | [0.666, 1.627] | [1.215, 3.024] | 0.808 | 1.215 | 2.024 | −0.407 |
| c3 | [0.885, 2.330] | [1.004, 2.895] | 1.231 | 1.004 | 2.235 | 0.227 |
Table 13.
The total influence relation matrix and sum of the systemic function effect.
| F1 | F2 | F3 | F4 | F5 | F6 | F7 | |||||
| F1 | 0.178 | 0.203 | 0.181 | 0.200 | 0.184 | 0.153 | 0.127 | 1.225 | 1.087 | 2.312 | 0.138 |
| F2 | 0.202 | 0.159 | 0.173 | 0.194 | 0.166 | 0.139 | 0.107 | 1.140 | 1.062 | 2.202 | 0.078 |
| F3 | 0.165 | 0.156 | 0.121 | 0.147 | 0.132 | 0.111 | 0.099 | 0.932 | 0.944 | 1.875 | −0.012 |
| F4 | 0.161 | 0.167 | 0.147 | 0.139 | 0.134 | 0.113 | 0.085 | 0.947 | 1.010 | 1.956 | −0.063 |
| F5 | 0.165 | 0.162 | 0.137 | 0.141 | 0.116 | 0.107 | 0.088 | 0.917 | 0.899 | 1.816 | 0.018 |
| F6 | 0.138 | 0.137 | 0.122 | 0.125 | 0.103 | 0.083 | 0.065 | 0.773 | 0.757 | 1.530 | 0.016 |
| F7 | 0.079 | 0.078 | 0.062 | 0.063 | 0.065 | 0.050 | 0.051 | 0.449 | 0.623 | 1.072 | −0.174 |
Table 14.
The priority sequence for the enhancement of the innovation policy definition.
| Schemes | Sequence of Enhancement Priorities |
|---|---|
| Influential causal diagram of systemic functions | (F1), (F2), (F5), (F6), (F3), (F4), (F7) |
| Influential causal diagram of systemic criteria | (F1): (e1), (e4), (e3) |
| (F2): (k1), (k3) | |
| (F3): (kd4), (kd3), (kd1) | |
| (F4): (g4), (g3), (g2), (g1) | |
| (F5): (m4), (m3), (m1), (m2) | |
| (F6): (r5), (r4), (r1), (r3) | |
| (F7): (c3), (c1), (c2) |
© 2019 by the authors. Licensee MDPI, Basel, Switzerland. This article is an open access article distributed under the terms and conditions of the Creative Commons Attribution (CC BY) license (http://creativecommons.org/licenses/by/4.0/).
Share and Cite
MDPI and ACS Style
Kao, Y.-S.; Nawata, K.; Huang, C.-Y. Systemic Functions Evaluation based Technological Innovation System for the Sustainability of IoT in the Manufacturing Industry. Sustainability 2019, 11, 2342. https://doi.org/10.3390/su11082342
AMA Style
Kao Y-S, Nawata K, Huang C-Y. Systemic Functions Evaluation based Technological Innovation System for the Sustainability of IoT in the Manufacturing Industry. Sustainability. 2019; 11(8):2342. https://doi.org/10.3390/su11082342
Chicago/Turabian StyleKao, Yu-Sheng, Kazumitsu Nawata, and Chi-Yo Huang. 2019. "Systemic Functions Evaluation based Technological Innovation System for the Sustainability of IoT in the Manufacturing Industry" Sustainability 11, no. 8: 2342. https://doi.org/10.3390/su11082342
Note that from the first issue of 2016, this journal uses article numbers instead of page numbers. See further details here.