Article

Environmental Assessment in Neotropical Watersheds: A Multi-Factorial Approach

by
Elaine F. Celestino
1,*,
Leandro F. Celestino
1,*,
Jhony F. M. da Silva
1,
Elaine A. L. Kashiwaqui
2,
Maristela C. Makrakis
3 and
Sergio Makrakis
3
1
Programa de Pós-Graduação nível Doutorado em Recursos Pesqueiros e Engenharia de Pesca, Universidade Estadual do Oeste do Paraná, 85903-000 Paraná, Brazil
2
Grupo de Estudos em Ciências Ambientais e Educação, Universidade Estadual de Mato Grosso do Sul, 79980-000 Mato Grosso do Sul, Brazil
3
Programa de Pós-Graduação em Recursos Pesqueiros e Engenharia de Pesca, Universidade Estadual do Oeste do Paraná, 85903-000 Paraná, Brazil
*
Authors to whom correspondence should be addressed.
Sustainability 2019, 11(2), 490; https://doi.org/10.3390/su11020490
Submission received: 2 December 2018 / Revised: 11 January 2019 / Accepted: 13 January 2019 / Published: 18 January 2019
(This article belongs to the Section Environmental Sustainability and Applications)

Abstract

:
This study evaluated the environmental conditions of two watersheds selected on the basis of similarities in land use. The environmental conditions of the watersheds were analyzed using two geoprocessing methods and in situ evaluations by applying the rapid assessment protocol (RAP). Geospatial image processing was used to analyze land use, slope, soil classification, and rainfall, while RAP was used to evaluate the connectivity and size of riparian corridors. The results revealed varied uses of land with the landscape matrix in both watersheds, composed of agriculture, pasture, and urban centers. Urban centers were defined as spots and riparian zones as corridors. The analysis of environmental fragility considering all the geospatial variables, classified both watersheds as having medium fragility. The most fragile sites were the urban centers, which had a high slope and degraded riparian zone. Onsite assessments have shown that corridors do not have the size required by legislation; they are fragmented and unstructured, and they contain exotic species. We also propose that a multi-factorial approach be used to evaluate watersheds, associating geospatial assessments and onsite analyses that consider the limitations pointed out in each protocol. This reduces sampling errors and shows the actual state of conservation in riparian zones.

1. Introduction

Watersheds are recognized as the smallest environmental units for planning management actions [1]. This point of view considers the drainage area, along with biological, hydrological, geomorphological, and ecological factors that are exclusive to each watershed [2].
Geologically, these factors have natural characteristics in the dynamic equilibrium of energy and matter [1]. However, this equilibrium has been altered by many anthropogenic actions such as deforestation, expansion of urban centers, and agricultural activities [3]. It clearly reduces environmental complexity [4] and results in extensively degraded landscapes in the watersheds [3,5].
From the point of view of degradation of natural resources, researchers have tried to broaden the techniques of evaluation of the anthropogenic impacts, and to this end, advancement of the geoprocessing technologies was fundamental [6]. In a technologically limited way, the first Geographic Information Systems (GIS) emerged in Canada. In the 1960s, GIS was part of a government program to inventory natural resources [7]. In the 1970s, the development of commercial software started and created the expression of GIS, with the use of mathematical programs focused on cartography [7]. The 1980s was a period of accelerated growth in the use of this technology, including in Brazil. Currently, geoprocessing contains sets of techniques for collecting, storing, processing, manipulating and integrating geospatial images [8] and it is used in several areas of knowledge such as geography, statistics, health, and the environment.
Due to the ease of obtaining images, several studies used geospatial data to evaluate the environmental conditions [1,3,9]. One of the most used parameters is soil use, which has revealed the reduction of the natural areas and fragmentation of the landscape [3,10]. Thus, geoprocessing techniques associated with several environmental variables such as spatiotemporal information, land use, rainfall, slope, and soil classification [11] are combined with modeling programs [12]. Increasingly robust protocols with multi-factorial methodologies revealed deforestation shapes, climate change [13], hydrogeological mapping [12], areas under erosion risks [4], vulnerability, and environmental fragility [5,14].
The analysis of environmental fragility establishes a hierarchy and aggregated variables into a single approach. This hierarchical transformation a structured way at specific points in the watershed [11], allows to know the environmental impacts, especially when the result of a single variable is insufficient [5]. It provides higher agility and efficiency in planning and territorial management [15] and in the taxonomy assessment of the degree of environmental preservation of watersheds. The results of these studies have revealed degraded, fragmented, and fragile areas [14,16,17]. However, most researchers have only attempted to provide a broad evaluation of these impacted areas, and sometimes, they may not be sensible enough to fine scale disturbances, especially in riparian zones (RZs) [4]. This may be because the images that are free and widely used have low resolution and a pixel error greater than 10 m, which prevents the accuracy of details found in RZs. For example, areas identified as covered area by the reflectance analysis may be covered by exotic species, or 10 m apart, RZ areas may be identified as connected by the GIS where they may not be, caused by the image resolving error.
These uncertainties in the evaluations can be detrimental to the conservation of RZs, which are one of the most important environmental sites [18]. Riparian zones are defined as transitional areas between terrestrial and aquatic ecosystems [19]. The Rzs are considered as one of the most dynamic landscape areas [19,20]. Although their territorial dimension over the terrestrial globe is small, they house ~50% of species richness in the world [21]. In order to consider a RZ as preserved, their characteristics must be maintained as natural as possible [18,22]. Small degraded sections of RZs may alter ecosystem services [23], the allochthon energy supply [24], the hydrological balance, nutrients [25], and change habitat supply and connectivity resulting in the rarity of fauna and low biodiversity [26].
Despite of these degraded sections are in RZs, they are imperceptible by geoprocessing, and measuring their impact is difficult, although necessary in terms of ecology. These fragmentation processes in RZs influence aspects of environmental quality and fragility [11], species composition, richness, and diversity of endemic, sensitive, and specialized species that may migrate to favorable or even extinct areas [18]. According to Zimbres et al. [27], the width, habitat structure, and land use in the landscape directly influence the richness, composition, and functional diversity of mammalian species, with the best population attributes being evidenced in continuous RZs. Due to the ecological complexity of RZs, their classification as preserved areas only through the evaluation of images can generate errors. In this context, this study tries to answer the following questions: i) Are the processed images used to classify areas as preserved reliable? and ii) Which parameters are needed to classify a geographic area as preserved? To answer these questions, we evaluated the conservation status of two neotropical watersheds through the analysis of environmental fragility and connectivity of RZs. Furthermore, we propose the use of factors associated with image processing and onsite environmental analysis with rapid assessment protocol (RAP).

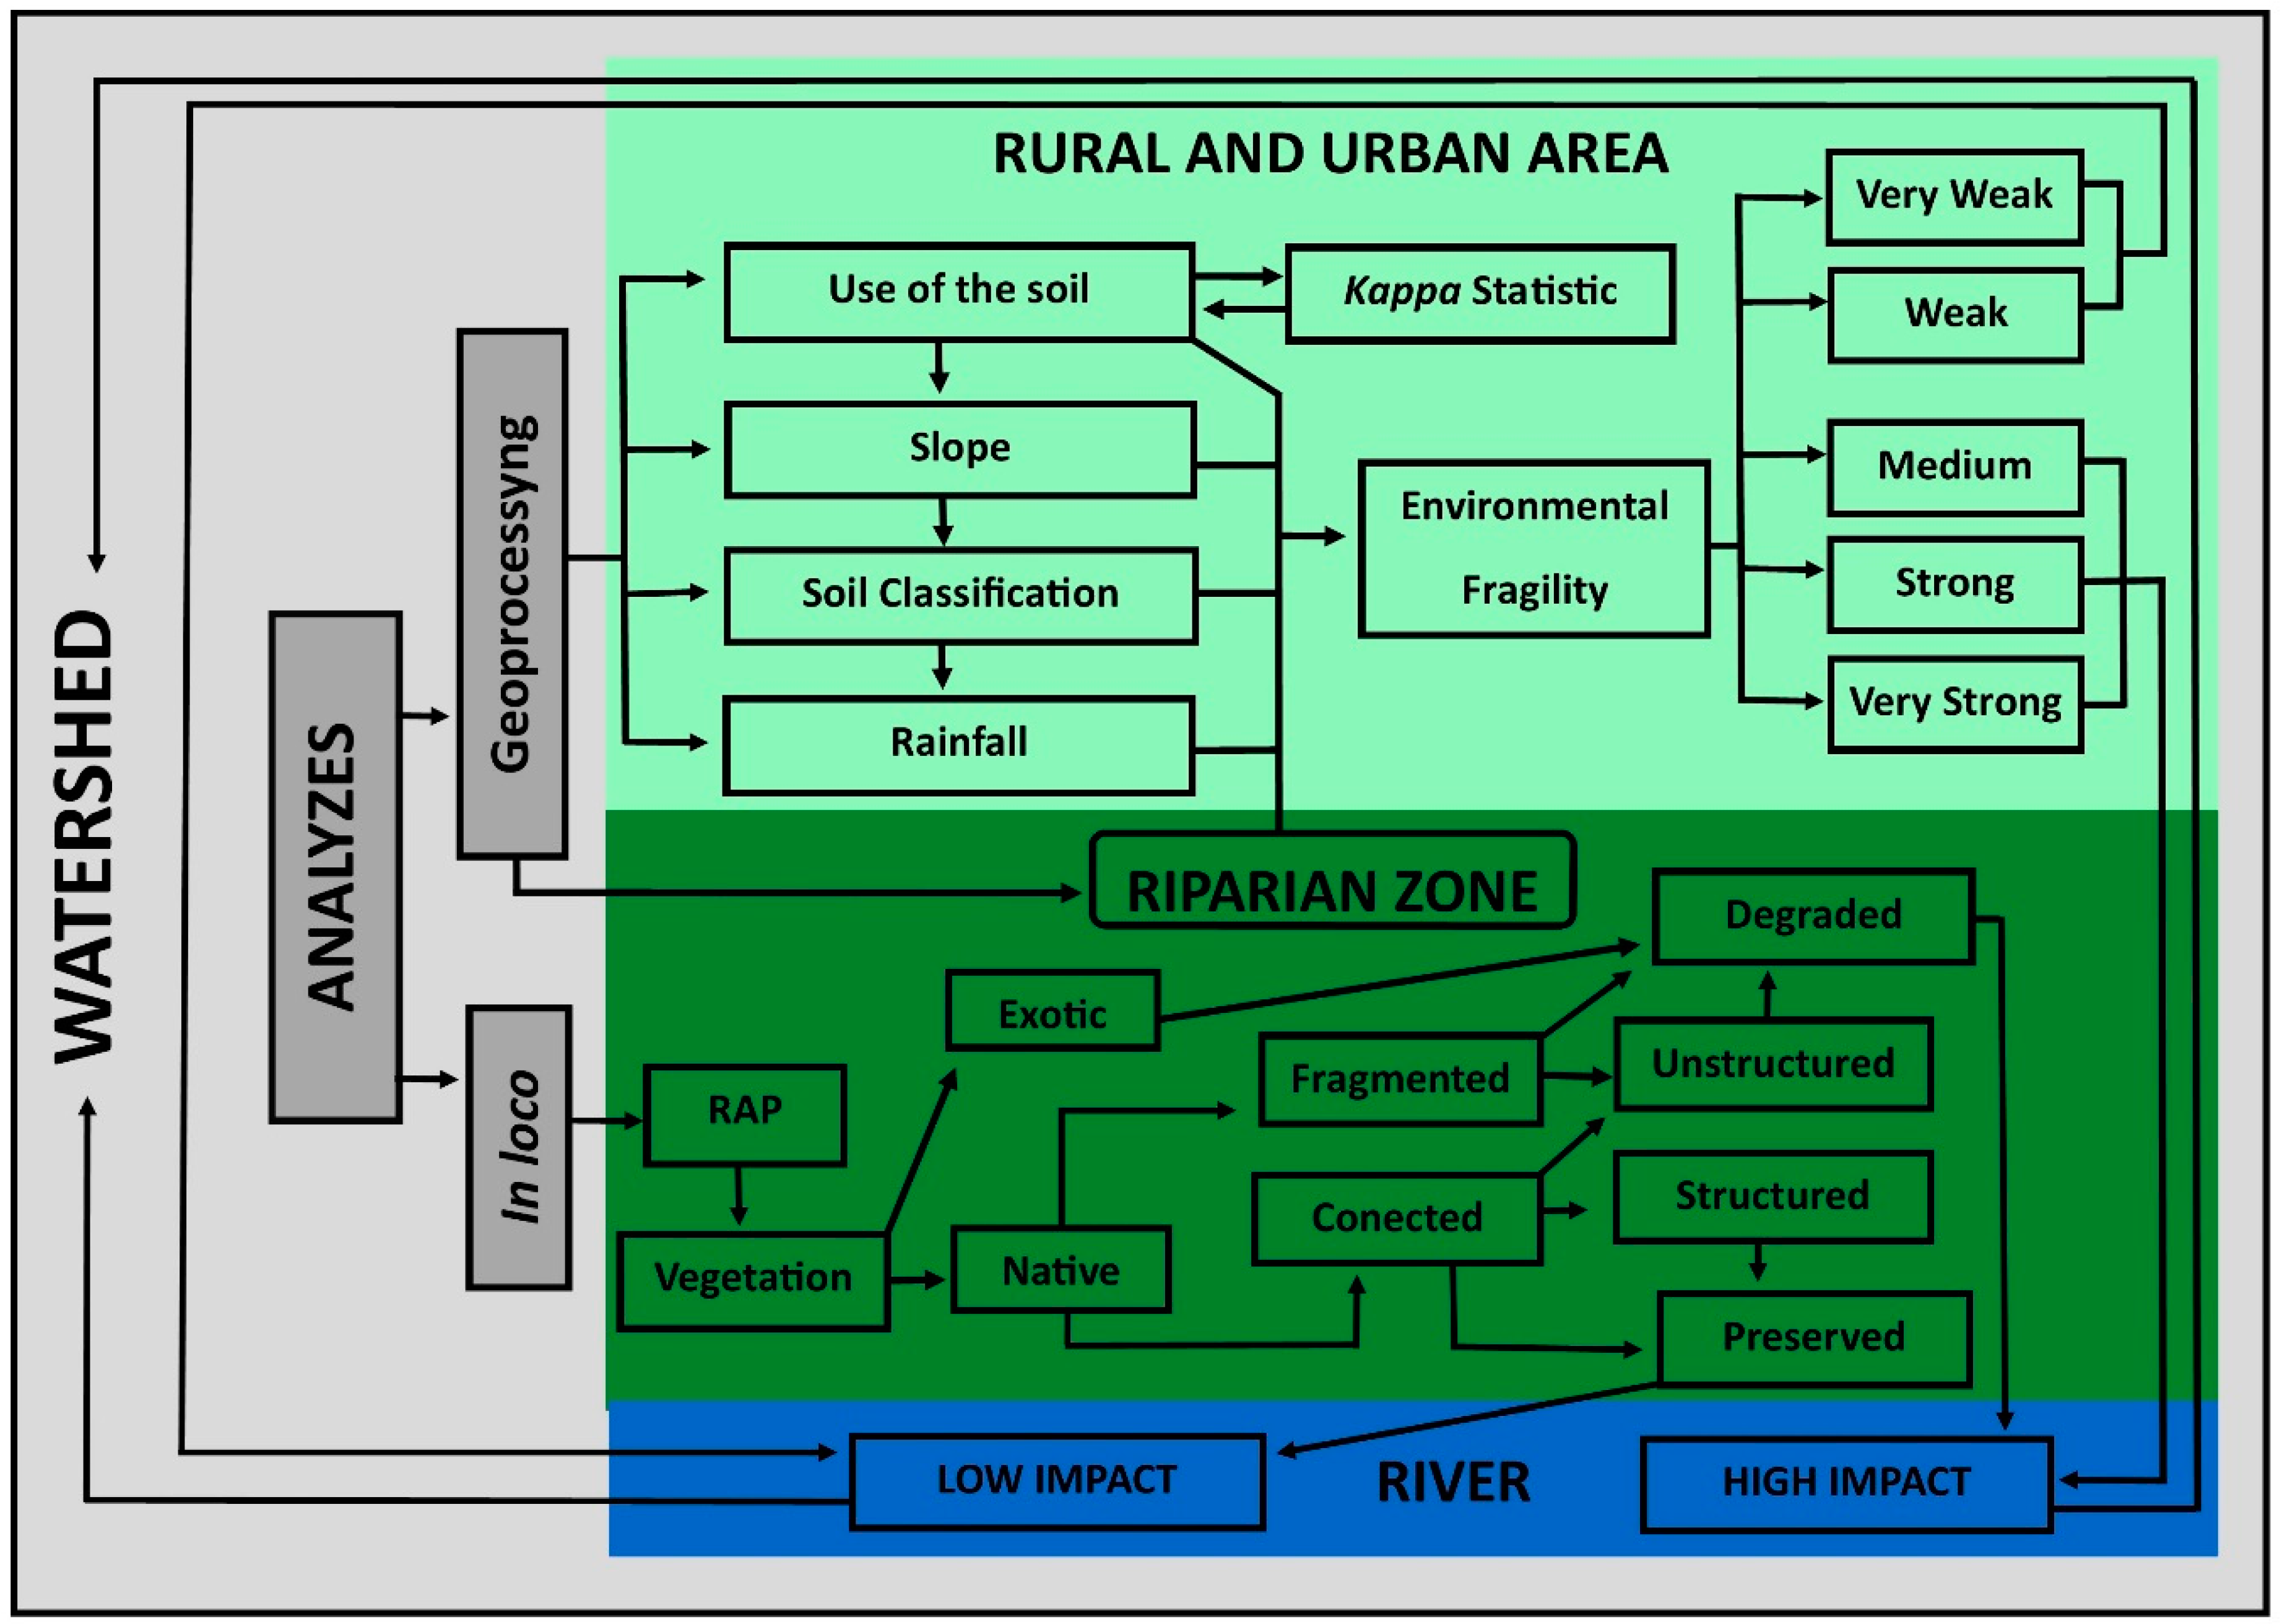
2. Materials and Methods

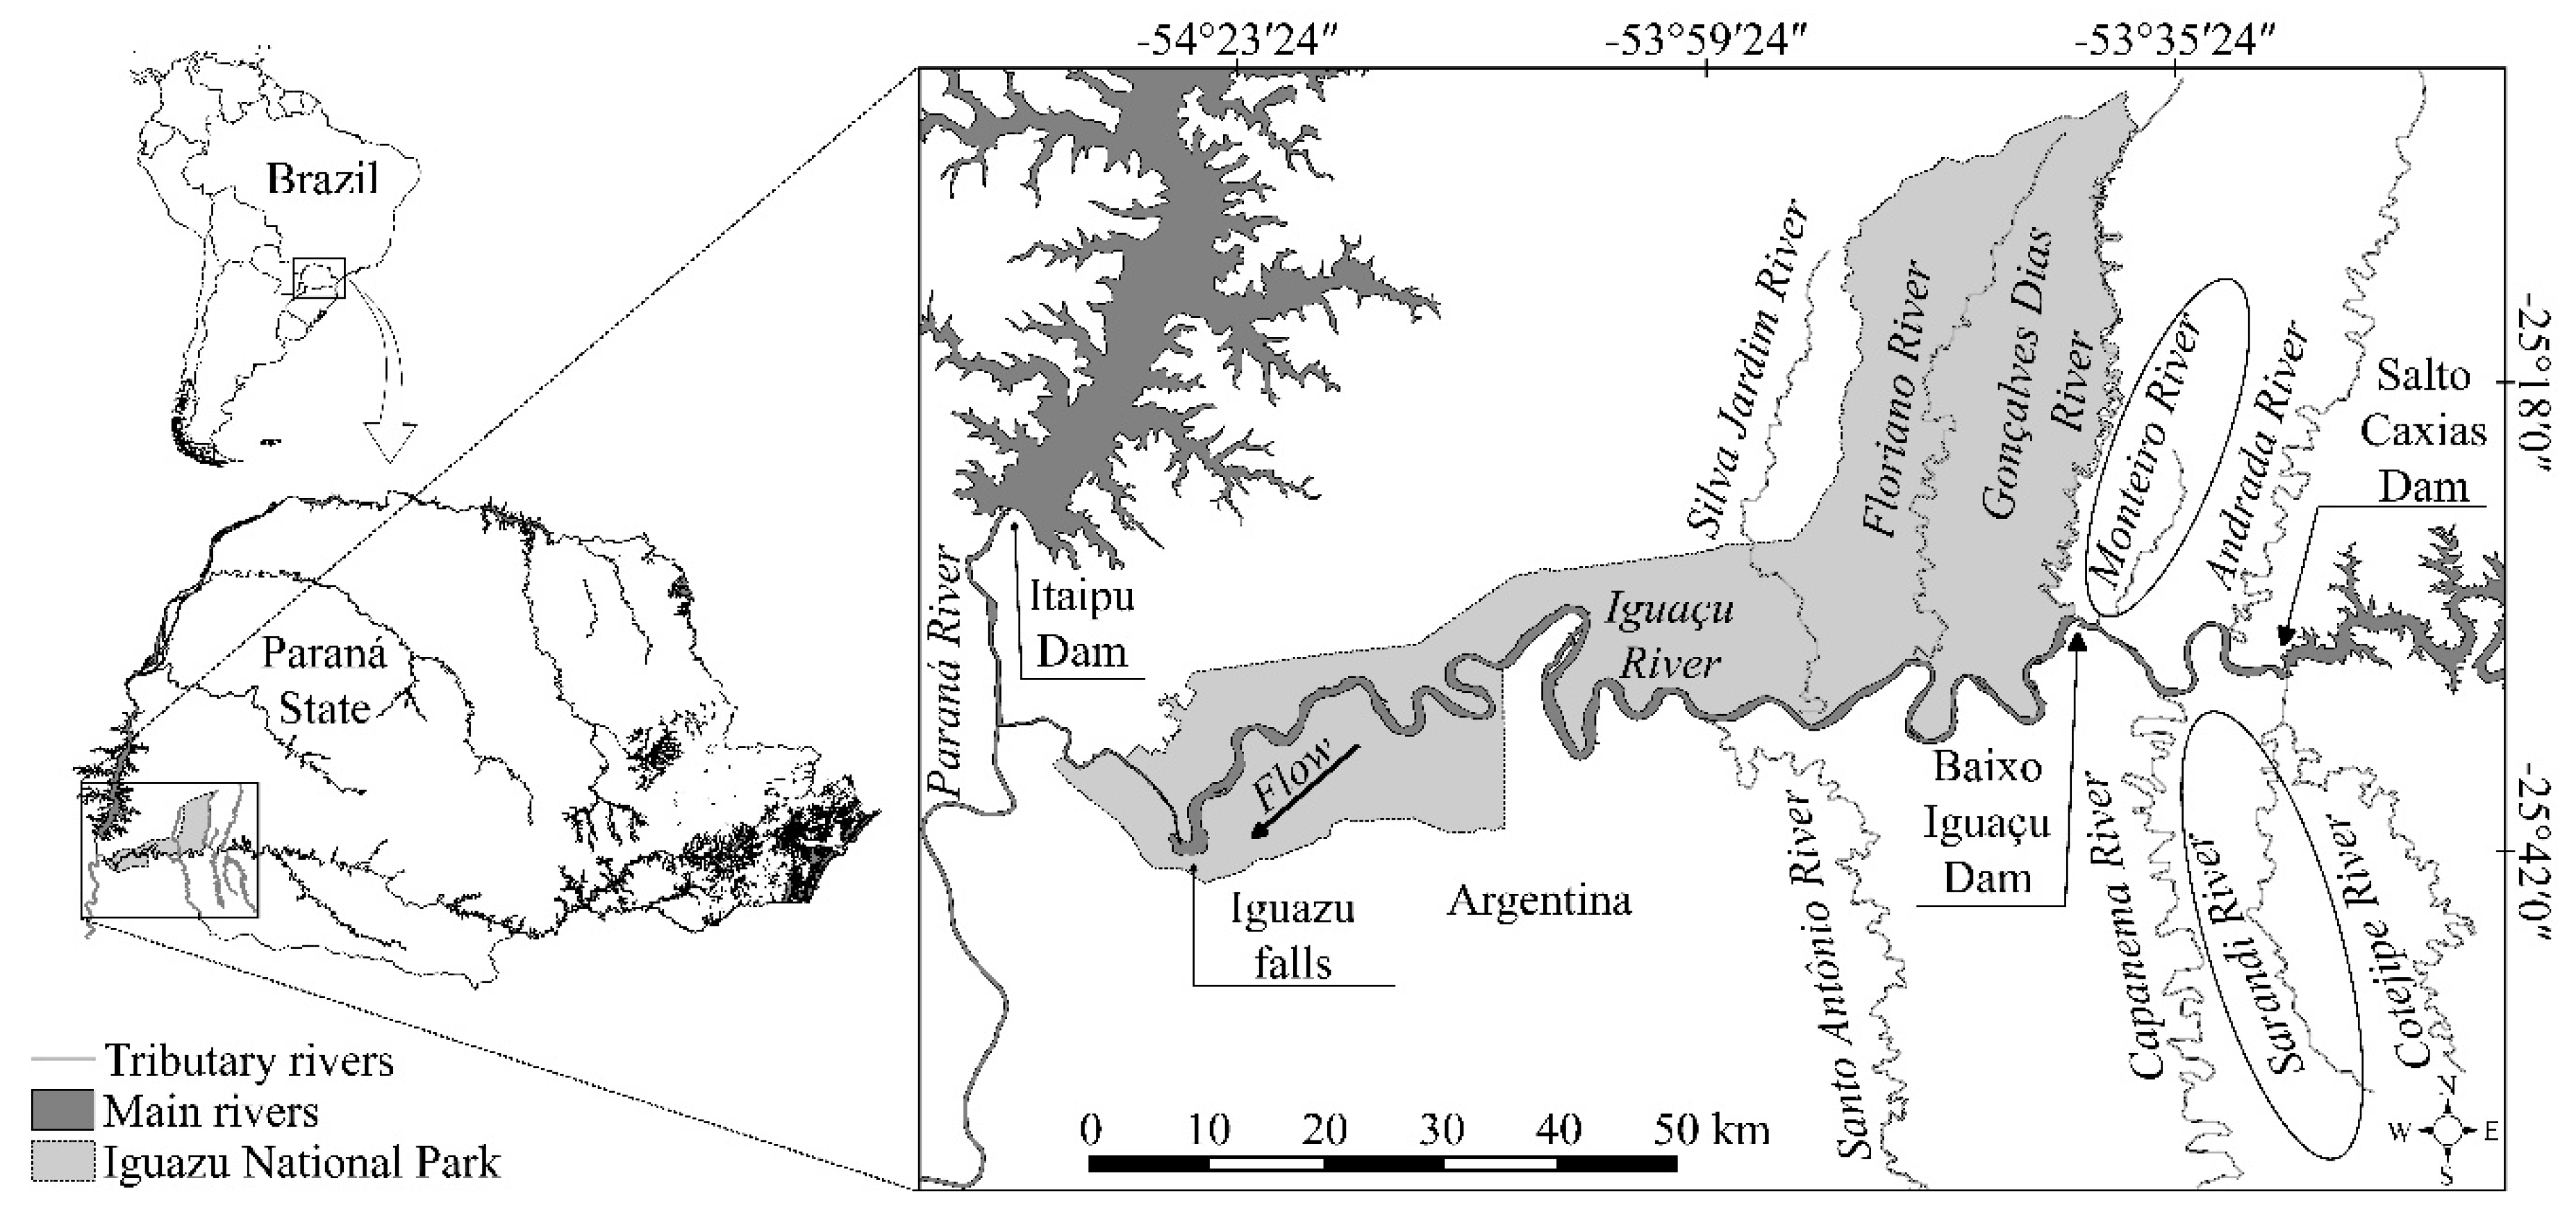
2.1. Selection of the Study Area

The study area is in the Atlantic forest biome (tropical forest), which is Brazil’s most degraded biome. It was originally comprised 12% of the national territory and currently comprises less than 3%, and is made up of an agglomerate of forest fragments, occupying areas not significant in the landscape and subject to varying levels of disturbance [28]. It is located in a phytogeographical region composed of mixed ombrophilous forest and semi-deciduous seasonal forest in Paraná State, Brazil.
The Salto Caxias hydroelectric plant is located in the upstream area, and the Iguaçu hydroelectric plant and the Iguaçu National Park are both located downstream. In these sites, the land use was evaluated for nine watersheds (Monteiro, Sarandi, Silva Jardim, Gonçalves Dias, Cotejipe, Andrada, Floriano, Santo Antônio, and Capanema) (Figure 1).
Processing was done with free images taken by the Sentinel 2 satellite in 2016, with a spatial resolution of 10 m, using the QGIS software version 2.8-Wien [29]. Land use was evaluated using the supervised multispectral classification technique performed with the MultiSpec software version 3.4 [30], and was classified into five categories, as described in Table 1.
For each category of land use, the area in hectares (ha) and percentage (%) was quantified at each watershed (Table 2). To determine the reliability of the results of the classification, the matrices of land use were analyzed using the Kappa coefficient of agreement. Kappa values ranging between 0.80 and 1, represented an almost perfect result [31]. After that, the values of the area (%) of the land use in each watershed were subjected to hierarchical cluster analysis by the unweighted pair group method using the PCORD® software version 6.0 [32]. The similarity of watersheds was defined through Ward’s method using the Euclidean distance, which classified the watersheds into four groups.
The first group consisted of the Monteiro and Sarandi rivers, the second group consisted of the Silva Jardim, Gonçalves Dias, Cotejipe, and Andrada rivers, the third group consisted of the Floriano, and Santo Antônio rivers, and the fourth group consisted of only the Capanema River (Table 2). This analysis aimed at selecting two watersheds for the environmental evaluation and analysis of environmental fragility, and the connectivity of riparian zones in a non-random manner. From the results of the analysis, we selected the Sarandi Watershed (tributary of the left bank of the Iguaçu River) and the Rio Monteiro Watershed (tributary of the right bank).

2.2. Summary of Information for Analysis of Environmental Fragility

Some factors on the susceptibility to environmental impacts in the watershed were used to determine the environmental fragility, as: (1) land use, according to the procedures described above; (2) relief slope, using the methodology described by the Brazilian Agricultural Research Corporation [33]; (3) soil classification, obtained from the database of the Institute of Lands, Cartography, and Geosciences [34]; (4) rainfall, expressed by the annual average (mm) between 1977 and 2006 obtained from the database of the Mineral Resources Research Center (CPRM) of the Geological Survey of Brazil [35].
Subsequently, each variable received a score ranging from 1 to 5, according to the degree of environmental fragility (Table 3) [4,5,11,15]. A data matrix generated with the scores of the variables was analyzed using the analytical hierarchy process (AHP) method according to the methodology proposed by Saaty [36]. This hierarchic method evaluates the variables and orders by importance [36]. From this, a map could be generated with territorial zones indicated by different degrees of environmental fragility.

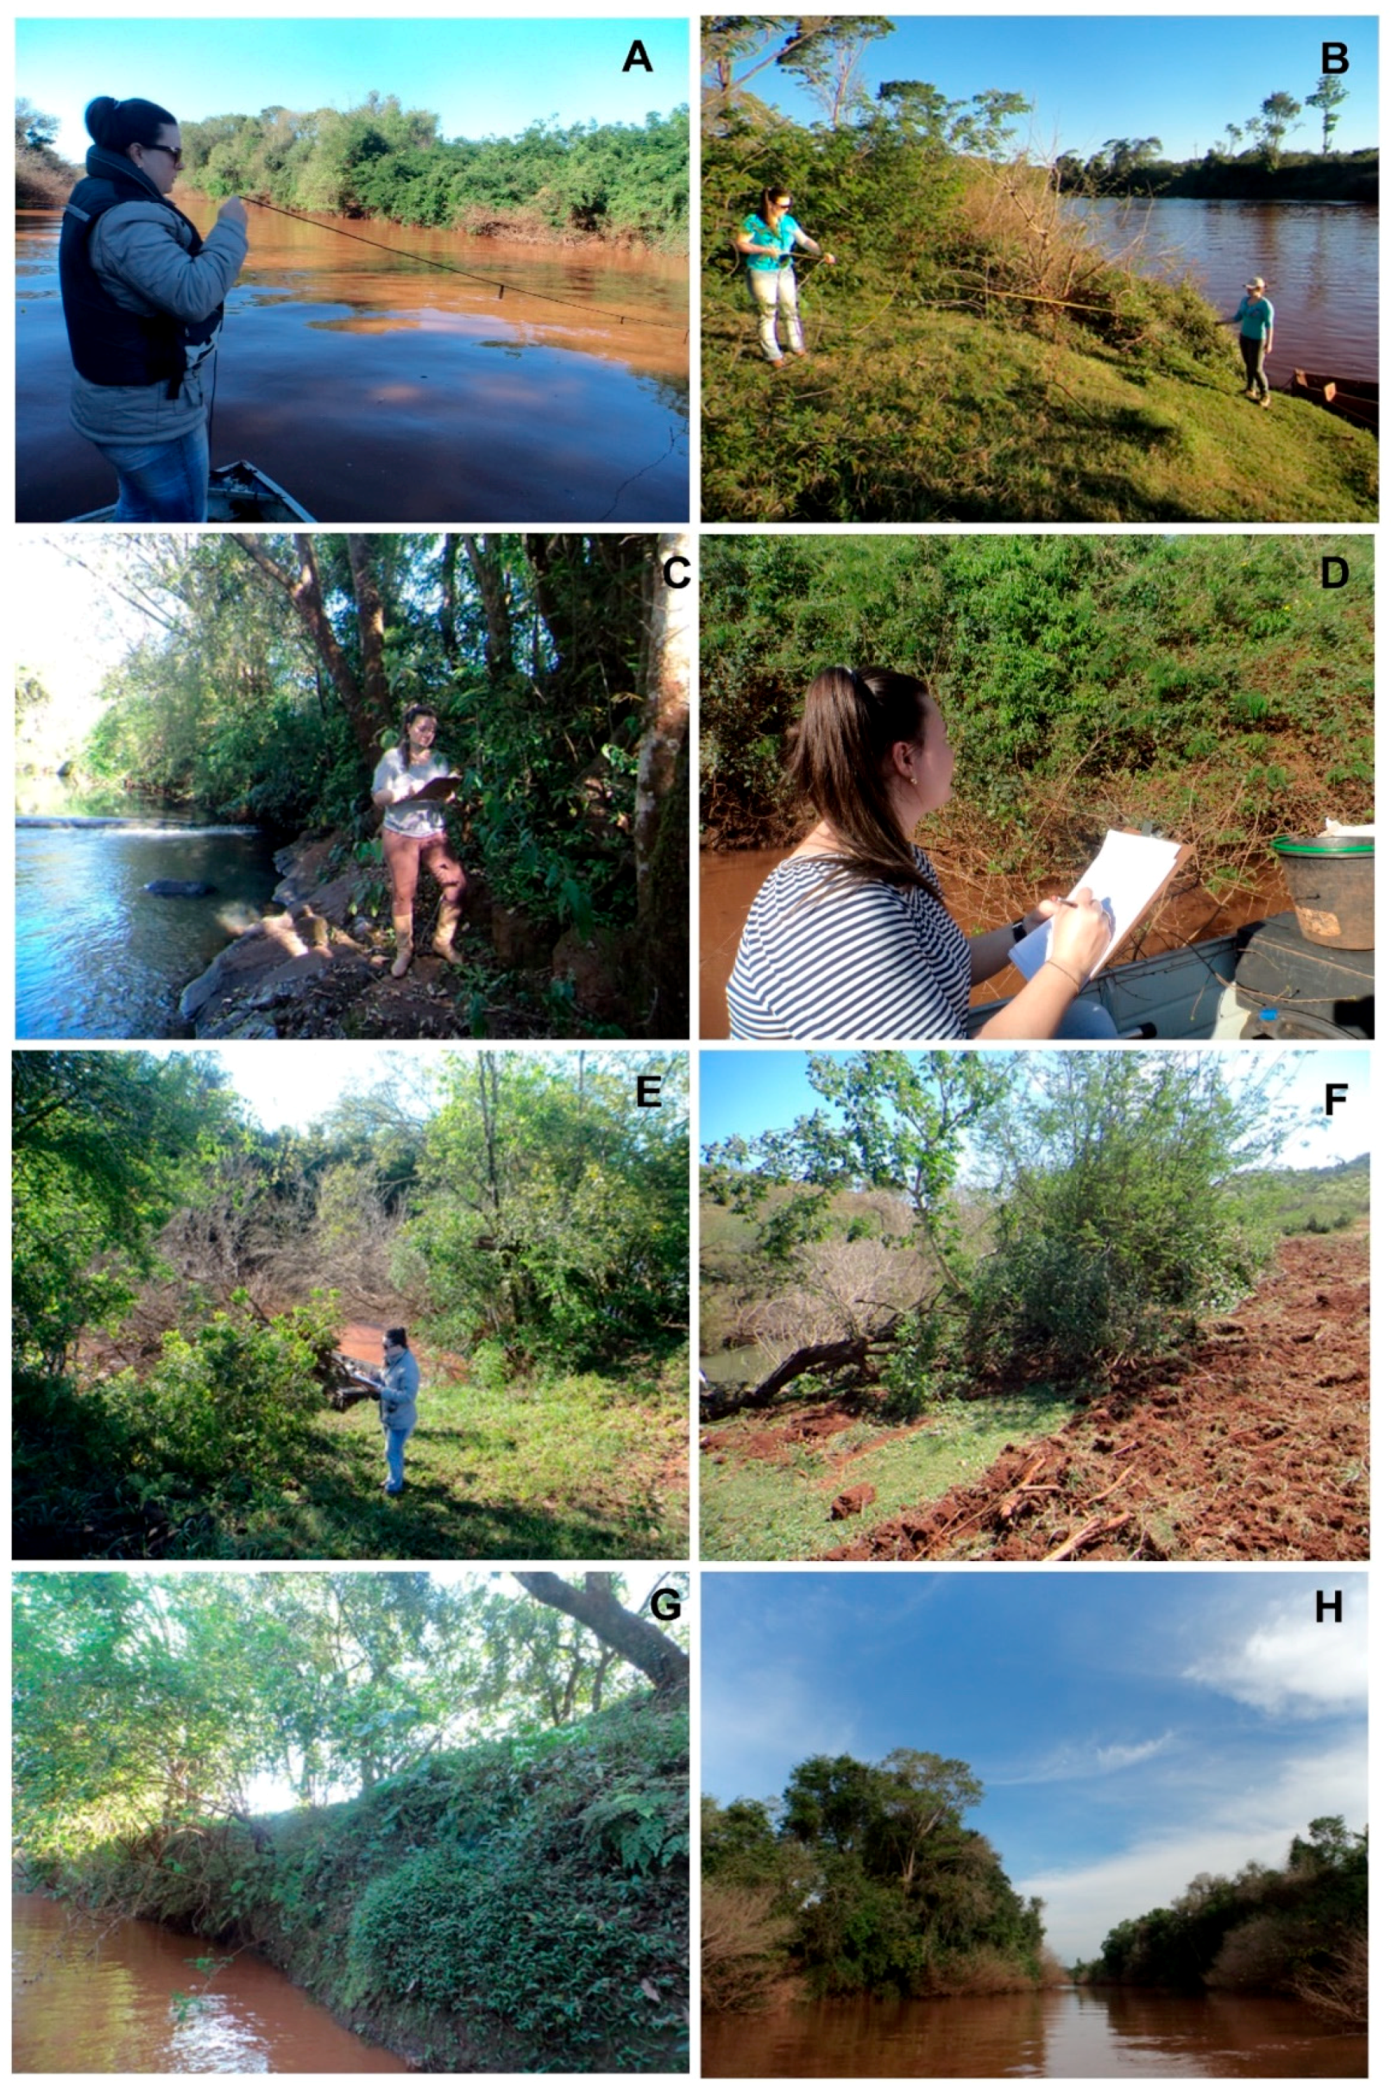
2.3. Rapid Assessment Protocol (RAP) in Riparian Zones

As a complementary tool to geoprocessing we also used a rapid assessment protocol (RAP) aiming to provide more robust results. The RAP was used for its ability to provide quick results, easy application, and low cost. The RAP was adapted from Celestino et al. [37] and was applied (Table A1; Figure A1) to evaluate the state of preservation and connectivity of RZs at ten random points in each river (Monteiro and Sarandi) with 20-m2 plots taken between September and October 2016. As a complementary tool to geoprocessing, we also used an RAP to provide more reliable results.
The protocol was used to evaluate the river width and the vegetation area of RZs along both banks, as established in the Brazilian Forest Code (BFC) Law No. 12.651/2012 [38]. This law establishes that the larger the width of the river, the greater the RZ. To determine whether the dimension of the observed RZ agrees with what was expected by the legislation (50 m), the Chi-Square Test (x2) was used. Moreover, the protocol was used to evaluate the environmental structuring in each plot by measuring the presence of the arboreal, shrub, and herbaceous strata, as well as native and exotic species.
Data from the RAP were ordered using a principal component analysis (PCA) [39,40,41]. The main components, having eigenvalues superior to those randomized by the broken-stick model, were evaluated [42]. For these analyses, the PC-ORD® software version 6 was used [32]. The scores of the significant axes were tested using the analysis of variance (one-way ANOVA) to determine whether the environmental conditions of the RZ of the watersheds were different. For these analyses, Statistica 7.0 from StatSoft [43] was used, assuming a 5% significance level.
The sites considered preserved were those where the RZs had native species in different plant strata in their floristic composition: (1) arboreal: high woody, with a stem diameter at breast height (DBH) in adult individuals greater than 15 cm; (2) shrub: semi-woody or woody, medium-sized, whose stem was branched from the base, with no undivided trunk and a DBH of less than 15 cm, and (3) herbaceous: small to creeping species with stems devoid of lignin. These characteristics should be continuous, cohesive, and dense over time, having RZ dimensions compatible with the river width [38].

3. Results and Discussion

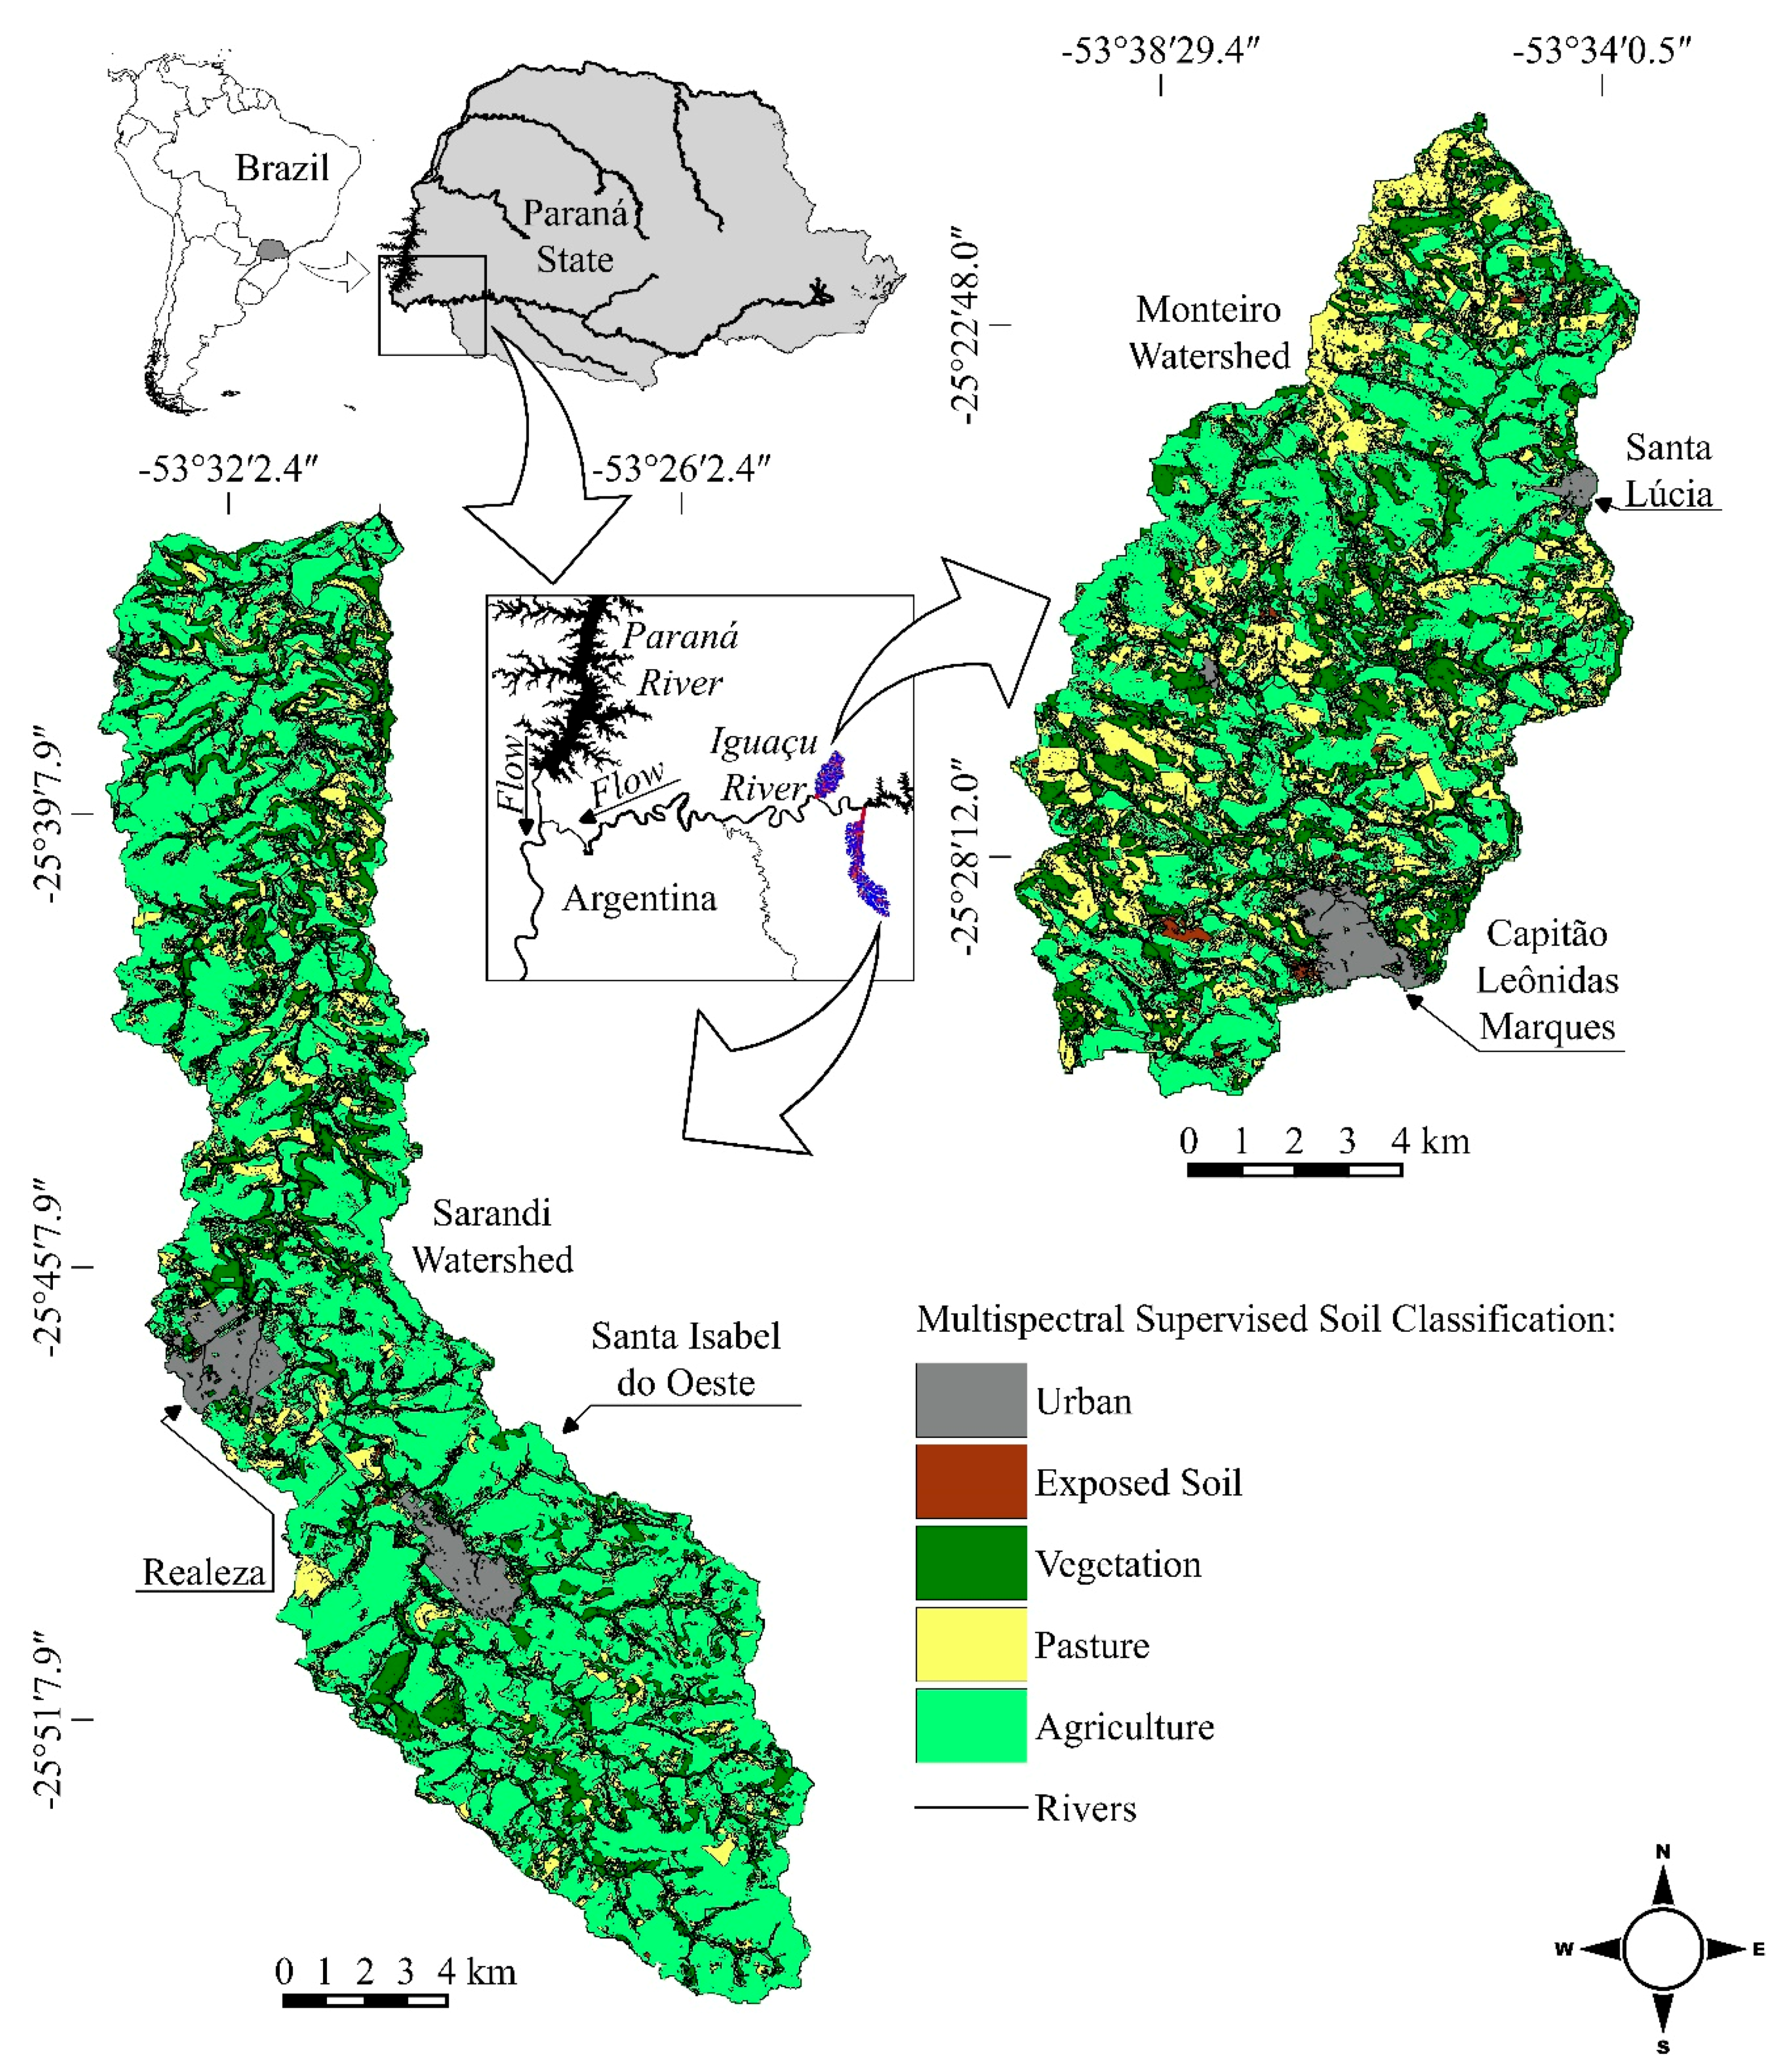
3.1. Landscape Components and Land Use

The Monteiro Watershed has an area of 11,339.08 ha, and the Sarandi Watershed has an area of 22,834.44 ha. Within the concept of landscape ecology, both watersheds follow the same pattern of landscape representation, composed of an agricultural matrix representing 50.92% and 68.81% of the total area of the watersheds, respectively.
The spots, which are defined as spatial units smaller than the matrix and distinguishable from the environment [10], were represented by pasture (27.40% and 13.43%, respectively), urban areas (2.43% and 3.20%, respectively), and exposed soil (0.94% and 0.11%, respectively) (Figure 2). Two small urban centers in each watershed corresponded to the most degraded sites, with soil sealing and degraded RZs, fragmented and occupied by houses. In the Rio Monteiro Watershed, the urban centers have a population of 19,585 [44] and a Human Development Index (HDI) of 0.738 [45]. This index quantifies the degree of economic development and the quality of life offered to the population. In the Sarandi Watershed, the population is 31,357 inhabitants with an HDI of 0.744. All municipalities in the watersheds have a high HDI according to the United Nations Development Program. Despite the high HDI, we noticed a lack of understanding of the inhabitants concerning the preservation of the RZs.
In these municipalities, soil sealing promoted by sidewalks, asphalt on streets, houses, buildings etc., increases surface runoff and damages the watershed. According to Ortega et al. [3], soil sealing is not the only degrading factor in watersheds, despite being considered the major contributor to changes in hydrology. When sealing occurs in 10% of the soil in watersheds, this promotes a marked degradation of the water ecosystems with changes in the geomorphological and biological processes [46], and a possible increase in the environmental fragility of the entire watershed due to its interrelationships. Some studies evaluated anthropic alterations resulting from the acceleration of urbanization processes, such as damage to watersheds and compromised water quality [23,47].
The scarcity of soil in the watersheds (<1%) is a consequence of no-till farming (Figure 2), which promotes an environmental benefit associated with the conservation of lands and rivers. According to Howard [48], no-till farming has grown worldwide. For example, in Brazil and Argentina around 111 million hectares is no-till and account for about 70% of agricultural lands in these two countries [48].
In the corridors, in turn, the sites with legal reserve and RZs account for 18.31% of the Monteiro Watershed and 14.45% of the Sarandi Watershed. As less than 20% of the areas are naturally vegetated, the Monteiro and Sarandi Watersheds are susceptible to environmental impacts. Ferreira et al. [49] suggest that watersheds should have an area greater than 35% of the total land covered by vegetation to minimize environmental impacts. Notedly, in study area, as well as in all Paraná a lack of forest cover in Paraná has been a major problem since 1960 when it reached levels below 30% in the state [50]. This shows that there are few extensive preserved areas and raises the need to preserve the remaining ones.
However, habitat fragmentation resulting from the heterogeneous mosaic of land use in watersheds is common. Thus, it is important to recognize that fragmentation should not occur in riparian corridors. The RZ connects the spots, mitigates habitat loss [18], and promotes ecosystem services by forming a buffer zone between the terrestrial and aquatic environments [3].

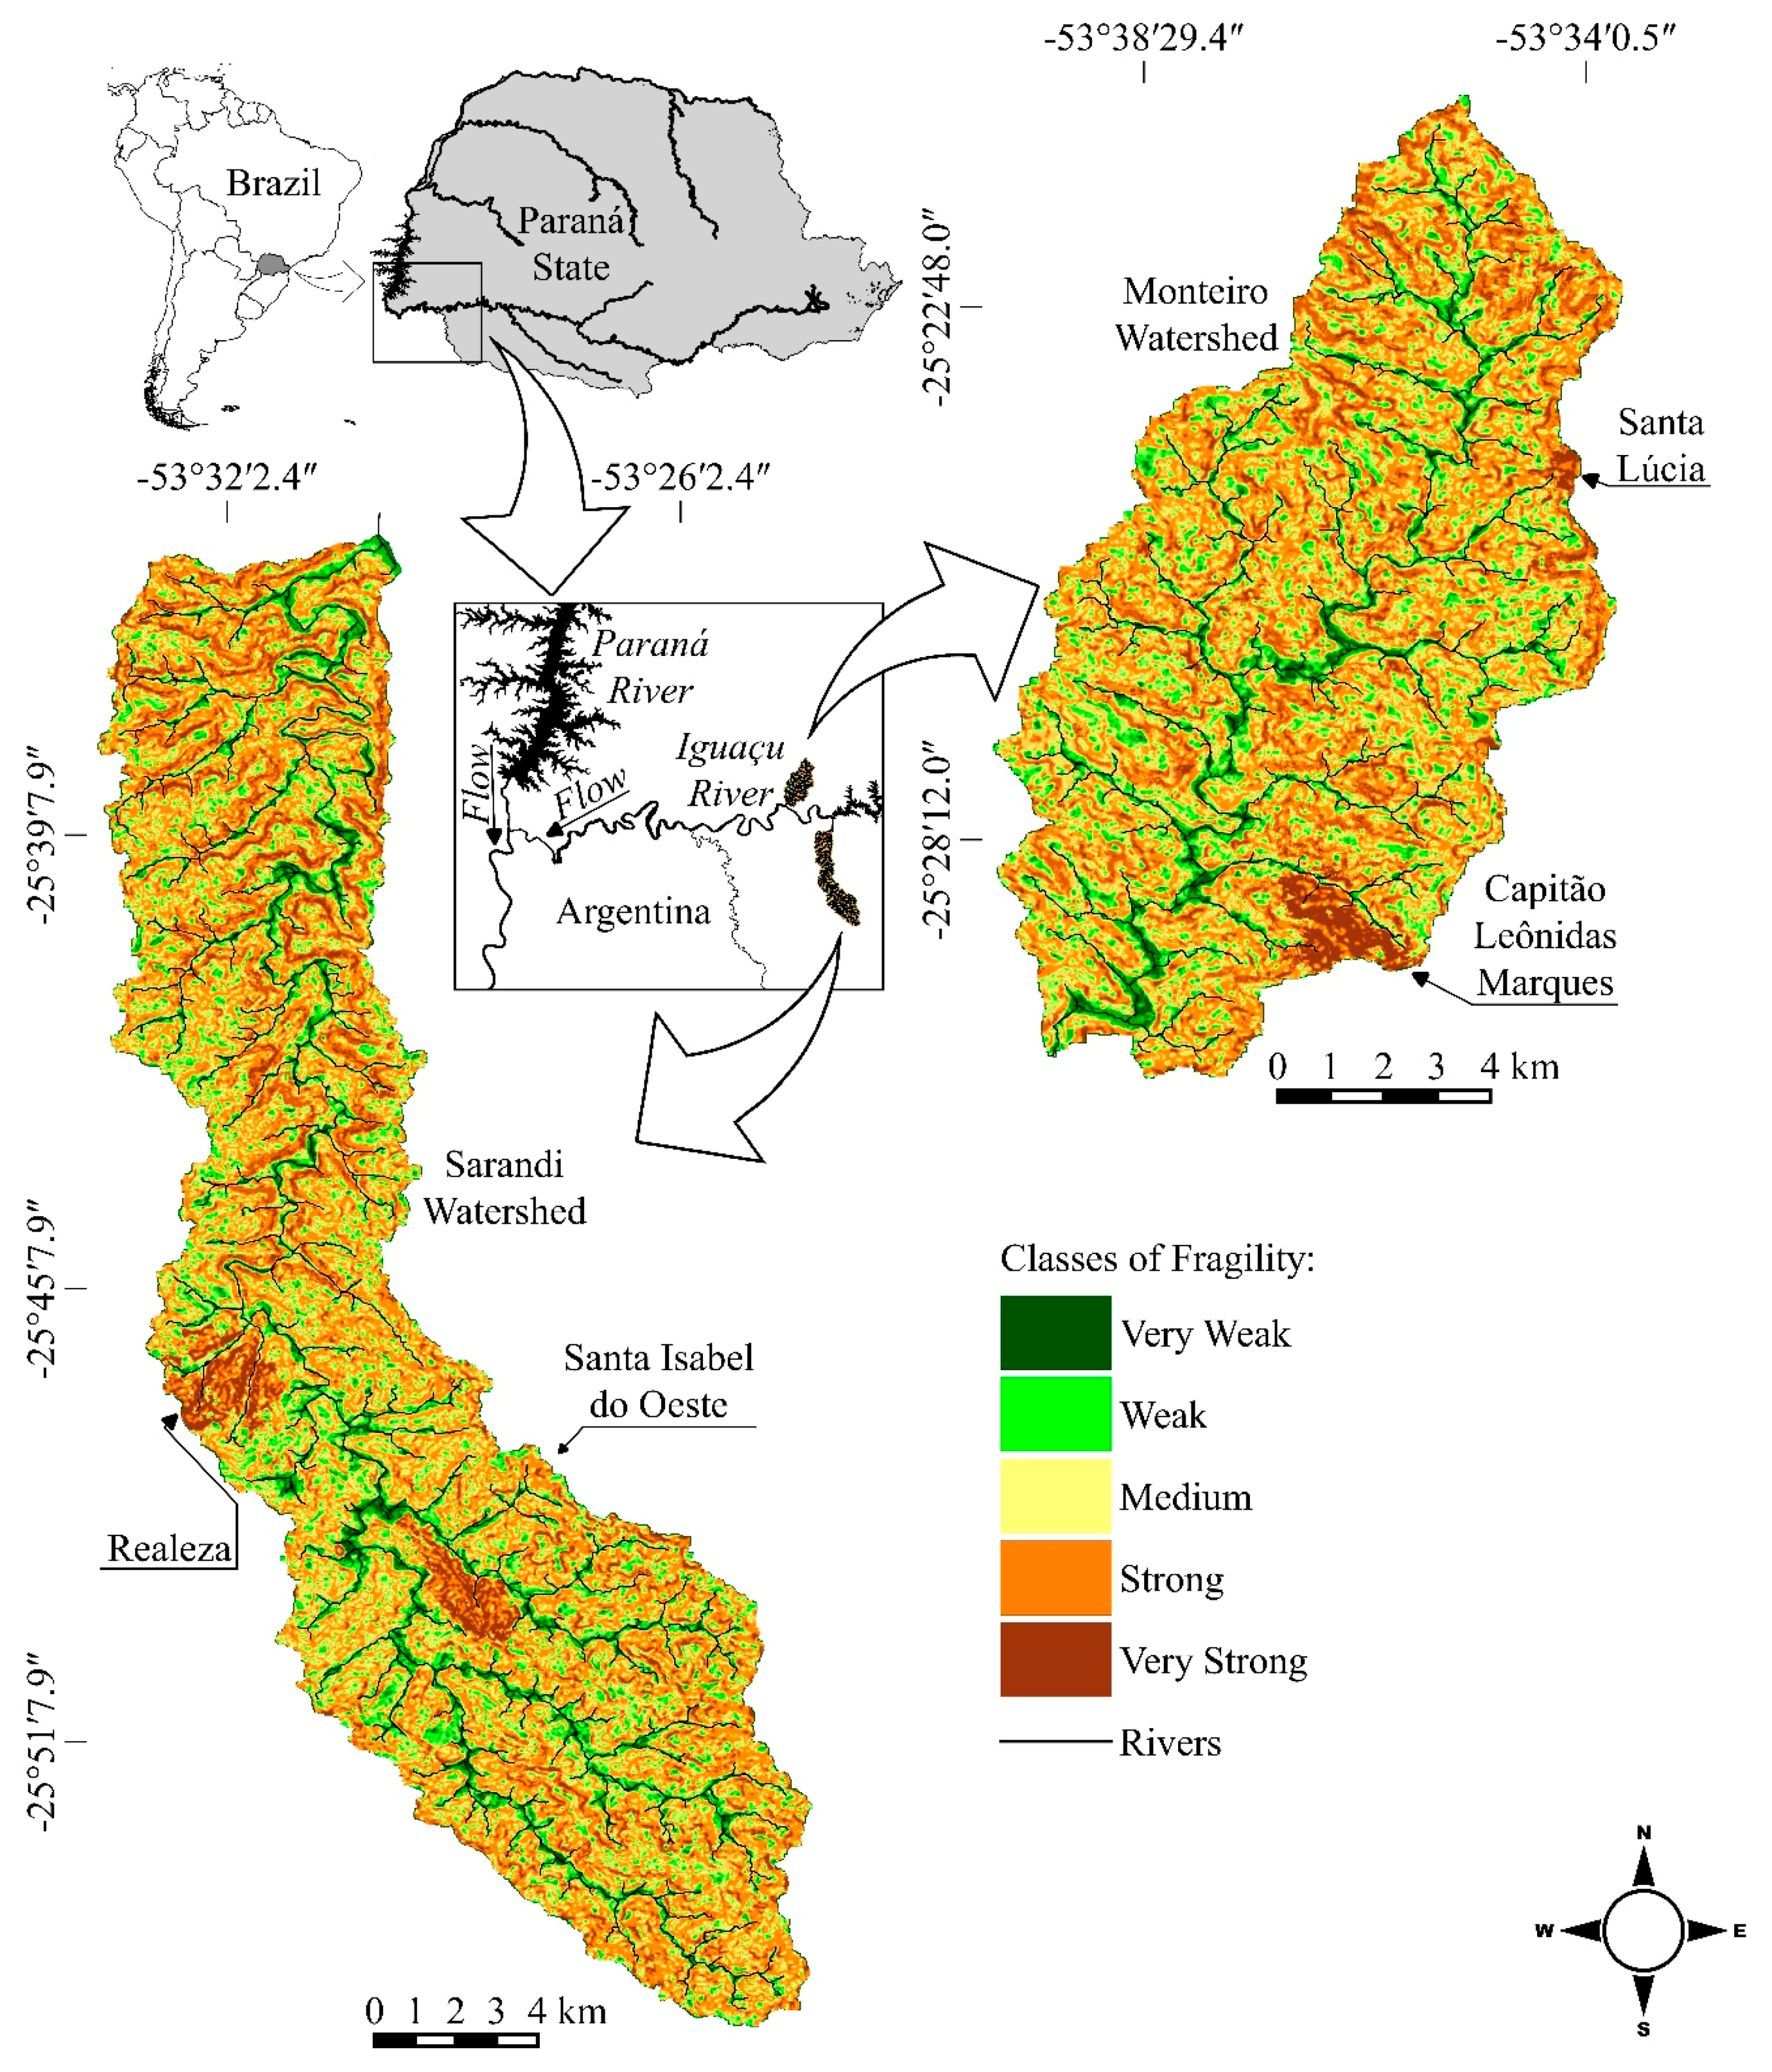
3.2. Environmental Fragility

The environmental fragility presented in Figure 3 demonstrates different degrees with a predominance of medium fragility in both watersheds. The degree of fragility was evaluated at specific points of the watersheds and is associated with the scores from Table 3. The less sensitive areas, with very low and low fragility, were classified because they had lower slope, stable lands, and preserved RZs. Conversely, the sites with greater fragility (very strong) have a greater slope, more urban centers, and degraded RZs (Figure 3).
The urban centers were the most fragile sites in the watersheds. This was due to the presence of simultaneous fragility-enhancing agents, such as soil sealing, RZ removal, and a region with a hilly slope of 8 to 20% [33]. The greater the slope, the greater the damage caused by the volume and velocity of the surface runoff from rainwater, carriage of the fertile land layer and seed banks, and erosion and silting of the rivers [17,51]. Although both watersheds were classified as having medium fragility, the Sarandi Watershed had a greater number of sites with very strong fragility due to the presence of more urban centers.
Studies of landscape evaluation in an olive-growing region of Spain have found that land slope and cover are highly associated with vulnerability, erosion, and ecological fragility of the landscape [4,52]. Thus, knowledge of land use and the impact caused by geomorphological factors in the watersheds is important for implementing public policies and restoration practices, especially in the case of watersheds with rugged terrain that tend to be more fragile and should be prioritized for environmental management.

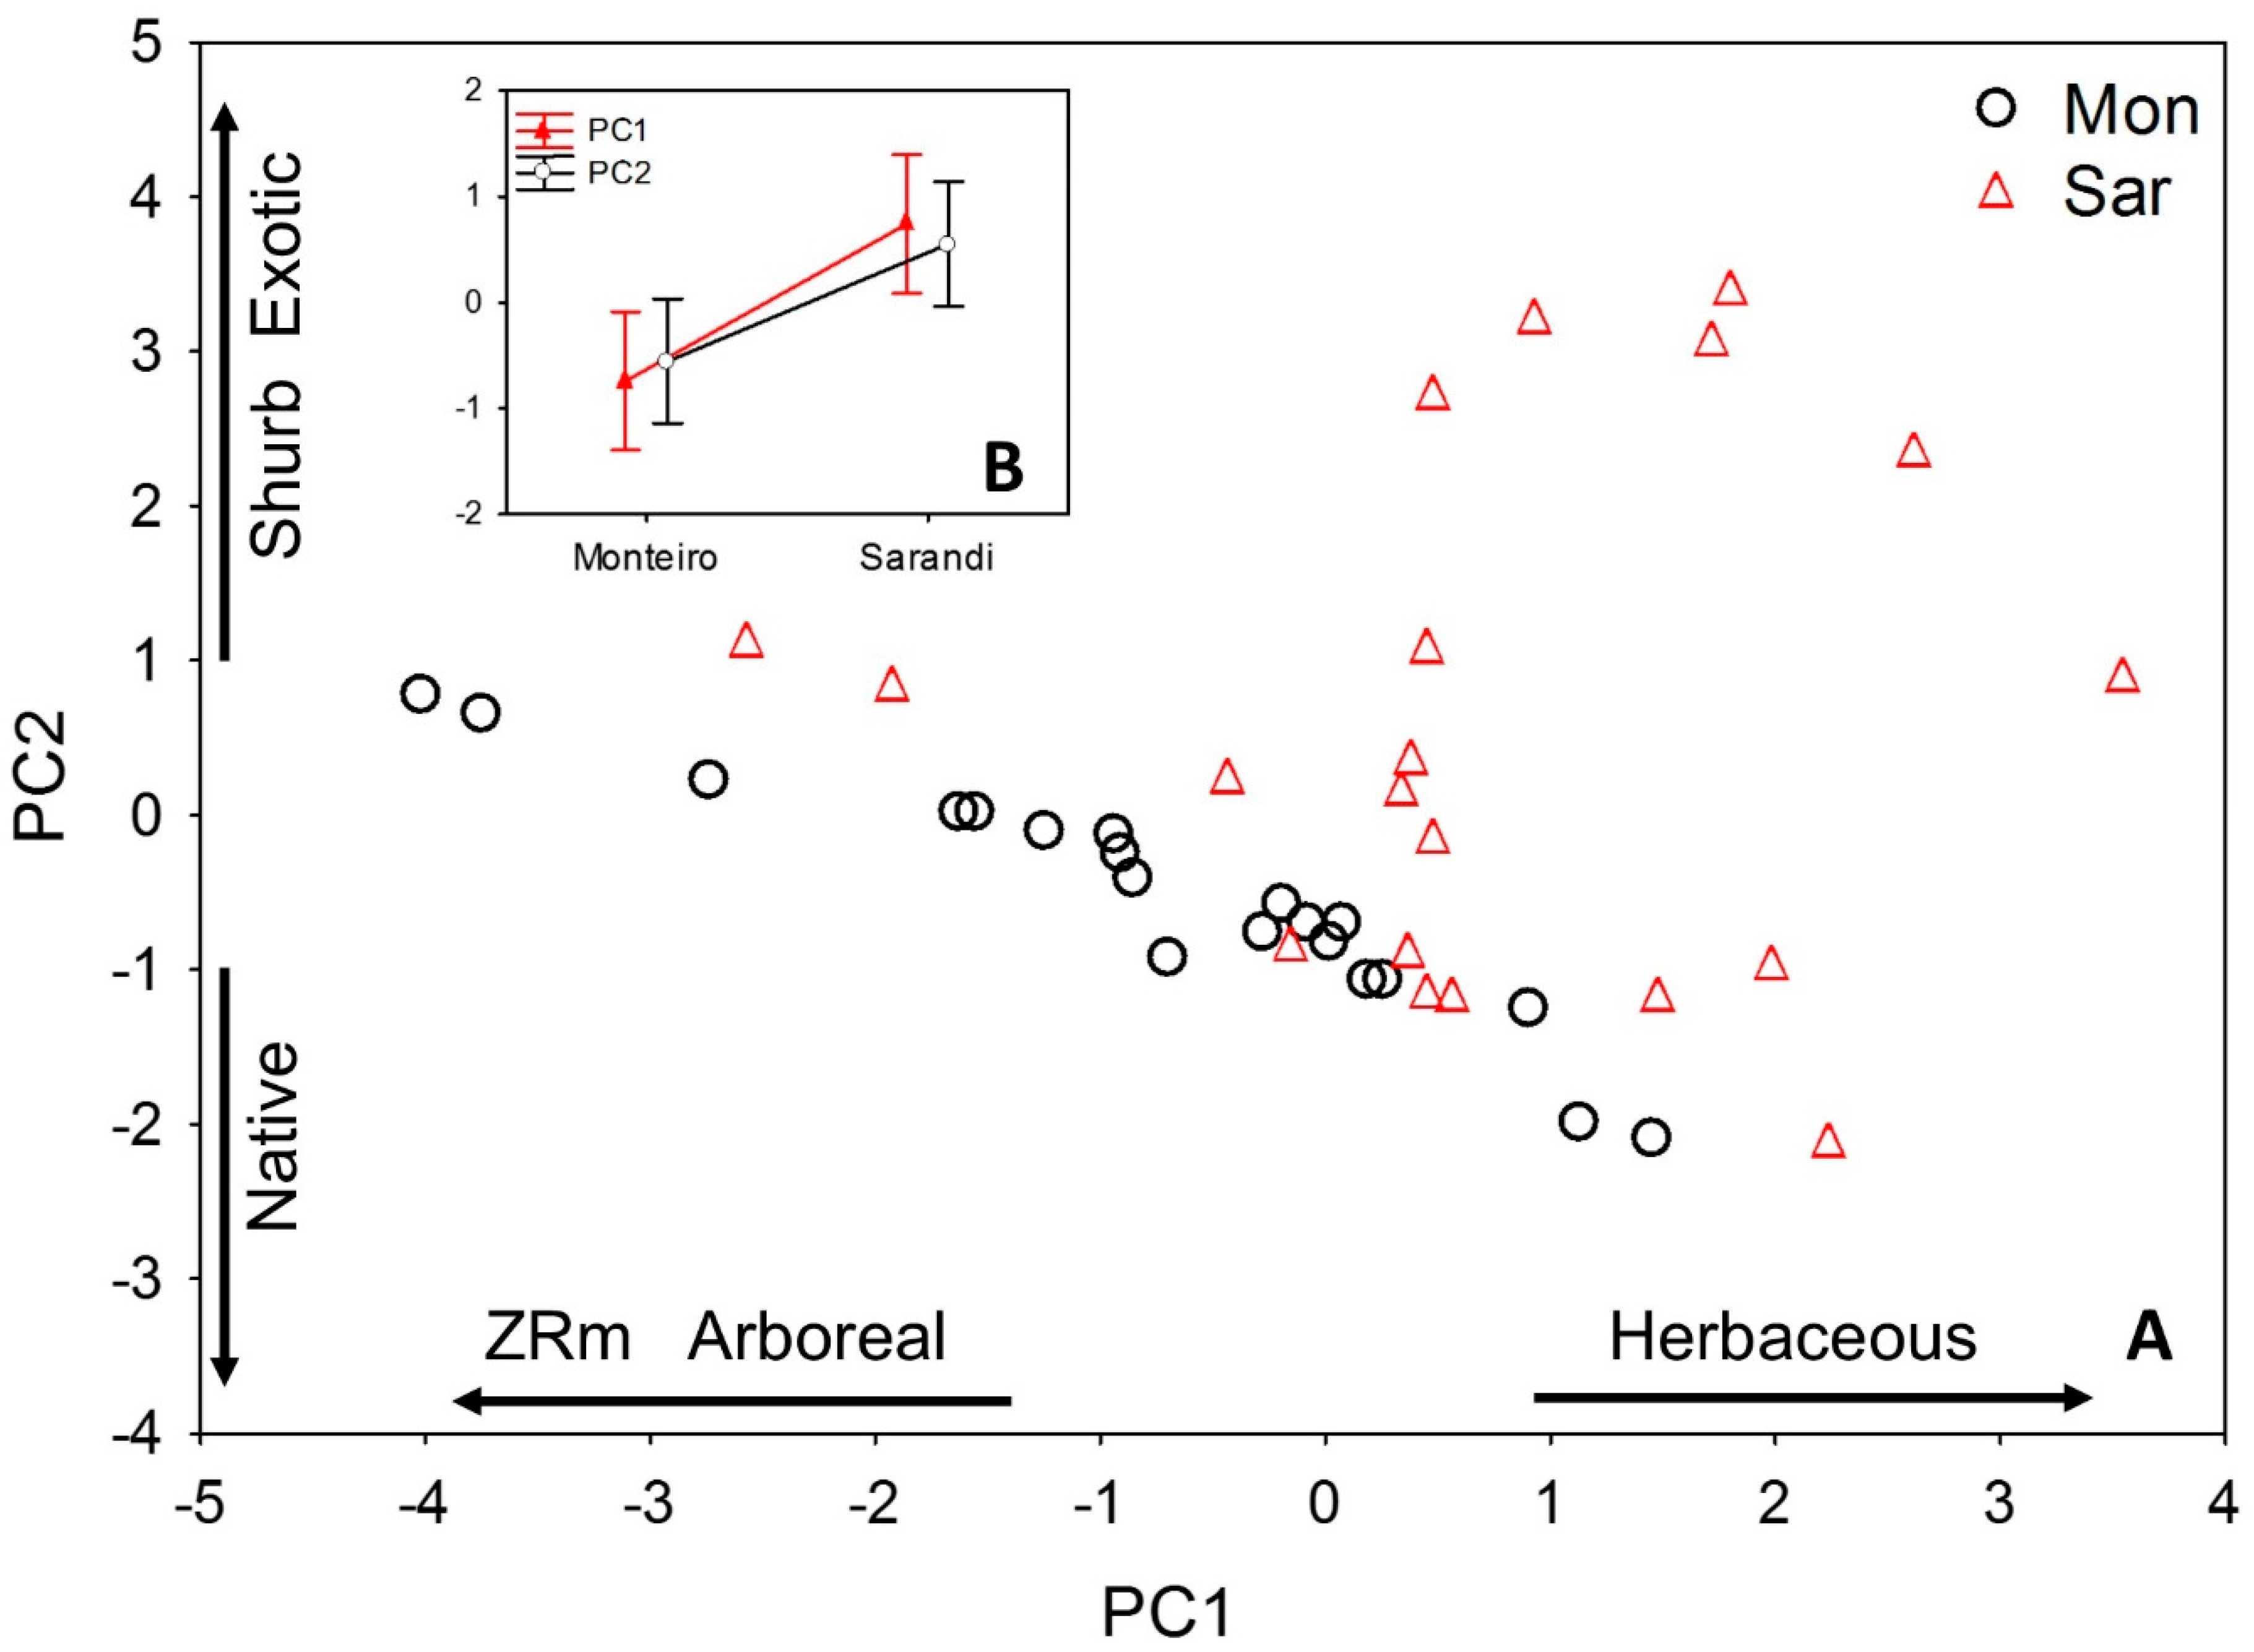
3.3. Onsite Assessment of Conservation Status and RZ Connectivity

It was observed through RAP that the mean width of the Monteiro River was 12.71 m, while the mean width of the Sarandi River was 15.63 m. According to Article 4 of Law No. 12,651/2012 BFC, rivers of this width should have a RZ 50 m wide [38]. In 80% of the points sampled in the Monteiro Watershed and 95% in the Sarandi Watershed, the RZ have significantly smaller dimensions (Monteiro x2 = 144.73, p < 0.01 and Sarandi x2 = 237.57, p < 0.01) than that determined by environmental legislation (BFC).
There is no international consensus on the ideal RZ size, with each country having its own understanding. However, there is a consensus that river width, hydrological regime, landscape, and biome are fundamental variables for determining the RZ size [53]. Although RZ protection is increasingly required by environmental legislation, these sites are currently used as agricultural areas or are occupied by houses [54]. This causes several impacts on ecosystem processes worldwide and are still ignored by owners [55] and surveillance sectors. In arid regions, more than half of the population lives less than 1 km away from a RZ, which causes impacts in these environments and worsens the problem of desertification [56]. In North America and Europe, over 80% of the RZ area has disappeared in the last 200 years [18], and it is estimated that the current RZ area is even smaller.
In addition to the impacts caused by the reduction and fragmentation of the RZ, this study indicated problems in environmental structuring. We observed deforested spots with sparse trees and imbalances among the arboreal, shrub, and herbaceous strata, especially in the Sarandi Watershed (Table 4). The RZ of the Monteiro River had 73.50% of its area composed of arboreal vegetation while the Sarandi River had 14.37% with a predominance of the genus Morus. The shrub stratum in Monteiro RZ was 19.13%, while in the Sarandi Watershed, the stratum was higher than 50%. The high amount of shrub stratum is related to the low number of arboreal species that allows the pioneer trees to develop better than the non-pioneers. The herbaceous stratum in Monteiro was 7.37% and 32.75% in Sarandi.
Two significant axes were identified using the broken-stick model. The first axis (Principal Component 1—PC1) explained 42.30% of the data variation, and the second one (Principal Component 2—PC2) explained 31.80% of the data variation. We found a greater number of herbaceous species in the positive side of PC1, and a higher arboreal stratum, with a greater presence of RZ on the negative side. The positive side of PC2 was representative of the shrub stratum and exotic species, whereas the negative side of PC2 was representative of the native species (Figure 4A).
Scores on the PCA axes tested by one-way ANOVA were significant along the PC1 (F = 10.50, p < 0.01) and PC2 (F = 7.27, p < 0.01) axes, among the RZ of the watersheds (Figure 4B). These results suggest that the Monteiro Watershed is more preserved than the Sarandi Watershed, having a greater and better environmental structuring of the RZ, as demonstrated by the arboreal and native strata. Environments with dense vegetation are less impacted, reducing the edge effect. The agricultural matrix that surrounds the RZ increase the damage related to the edge effect, which facilitates the strangulation and fragmentation of the RZ [57]. This may explain the greater degradation of the RZ of the Monteiro Watershed. The degree of these impacts is still associated with size, distance, and time when the fragments were disconnected [47].
The biggest problem indicated by RAP could not be revealed using geoprocessing. Through the RAP was found the presence of exotic species in the Sarandi Watershed, with 73.35% of the area composed of exotic forest. In the Monteiro Watershed, in turn, the composition of exotic forest was about 1%. Three exotic genera, Eucalyptus, Ricinus, and Morus, were found in the two RZs. The genera Eucalyptus and Ricinus occurred randomly and infrequently in both watersheds. The genus Morus, in turn, was abundant in the Sarandi RZ at several points. The high presence of the genus Morus can be explained by two factors: (1) allelopathy, which hinders the establishment of other plant species [58]; and (2) dispersal facilitated by zoochory and hydrocoral, which allows the direct contact of the exotic propagules in large areas along the river course [59]. When exotic species are established, they can alter the structure of terrestrial and aquatic communities, modifying the availability of resources in the trophic pathways concerning the three key processes of the ecosystem: decomposition, production, and consumption [54,55].
Despite the higher frequency of native and arboreal species in the RZ of the Monteiro Watershed, it is not possible to affirm that this is a preserved RZ, because the species are located in many sparse and fragmented areas. Cattle were observed in the RZ in certain areas, where cattle movement prevented natural regeneration through ecological succession processes and promoted the silting of the river. Moreover, it makes clear the need for assessment of infractions occurring in the RZ by the responsible bodies.

3.4. Multi-Factorial Approach

We propose a model for environmental analysis of watersheds using the methodological approach multi-factorial (land use in the watershed, slope, soil classification, rainfall, presence of arboreal, shrub and herbaceous strata, and native and exotic species) and multi-spatial (hydrographic, RZ, and river). This is a systemic evaluation of the factors that independently influence the environmental quality of watersheds. The proposal of these factors is aimed at generating consistent information for environmental assessment studies on watersheds.
These previous limitations were found to be in this study, since the protocol of geospatial images processing had limitations related to: (1) Resolution: images with high precision are expensive, which makes them inaccessible for research projects with a limited budget. Free images, in turn, still have reduced spatial resolutions, which are not effective for RZ assessment, especially for aquatic bodies spanning less than 10 m and a RZ range of 30 m [38]. (2) Reflectance: the land was classified using reflectance of the visible wavelength [60]. In the RZ, the reflectance produced by the canopy does not permit the identification of whether these areas have herbaceous, shrub, or arboreal species in their environmental structuring, which would facilitate a greater structured environment with greater biodiversity [18,61], especially when the vegetated areas of the RZ are composed of native species. This problem is underestimated and little discussed in Brazil due to its high territorial dimension and reduced inspection structure, which is done only through image monitoring. The limitations of this protocol suppress important information needed in the environmental assessment of watersheds. In this sense, we observed that many studies evaluate the RZ only using the remote sensing protocol, which classifies the RZ as preserved areas or native forest [11,62]. In this study, we observed after the onsite analysis that this is not true for the Sarandi RZ.
Inconsistencies in the onsite rapid assessment protocol (RAP) are associated with: (1) Difficulty in evaluating large areas: it is necessary to define points in a random way which may underestimate some impacts or fail to show details. The results are extrapolated to explain only general patterns. (2) Training and standardization of the collector: using the same researcher in the collections is recommended to standardize the sampling error and decrease the subjectivity as proposed by Hannafordet al. [63]. However, for many points, more than a single collection team is necessary for temporal standardization of the assessment, which is impossible if the collection is performed by the same researcher.
In this study, the application of RAP allowed us to identify inaccurate information or information disguised by remote sensing, in particular, information regarding the levels of environmental structuring and high presence of exotic species. In this way, this methodological proposal indicates that watershed assessments should link protocols with geoprocessing and onsite analysis (such as RAP) to be considered consistent, accounting for the limitations of each protocol. All steps in the methodological procedures are described in Figure 5.
Thus, multi-factorial assessments are an important tool and can accurately determine the impact of inadequate land and water management in watersheds. Studies conducted by Lin et al. [64] and Naiman et al. [18] demonstrate that multi-criteria assessment associated with landscape and hydrodynamic modeling can show the influence of RZs on rivers and environmental performance in the watershed, emphasizing the importance of RZs in the provision of habitat, connectivity, and energy supply to terrestrial and aquatic ecosystems.

4. Conclusions

Some of the most important conclusions derived from this paper are:
  • The two watersheds were environmentally unstructured. The weakest points in the basins were urban centers, high declivity sites, and nonexistent or fragmented RZs. Although similar in terms of soil use and occupation, the RZ of the Sarandi River basin was more degraded than the other river basin considered, with disconnected riparian corridors, successional disturbances of plant species, and high presence of exotic species.
  • The use of GIS, especially with free low-resolution geospatial images, was not accurate enough to identify if a RZ was preserved. The imprecision of the geoprocessing in: (i) details of the real arboreal situation, shrub, and herbaceous strata, (ii) identification of small fragments, and (iii) verification of presence/absence of exotic species in the composition of the RZ, evidenced the inefficiency of the exclusive use of GIS for determination of RZ preservation.
  • Classifying a geographic area as preserved, considering the numerous associated factors, is difficult. It is necessary that the RZ maintains its natural characteristics at maximum. It means that the preserved areas must have a forest cover that resembles as much as possible the intact biome. However, a RZ must be composed of arboreal, shrub, and herbaceous strata, connected in longitudinal scale, without presence of exotic species. In addition, it should respect at least the dimensions laid down by legislation for that biome, so that RZs can exercise their bio-ecological functions. In this way, the current configuration found in the studied areas is far from ideal. The lack of preservation of the RZ and the permanent preserved areas is evident, since the forested area in each of the basins is less than the 20% required by Brazilian legislation.
  • In order to improve the understanding of environmental changes, we suggest that future studies to assess anthropogenic impacts in river basins and RZ preservation include this methodology that contains combined protocols of evaluations with GIS and onsite evaluations.
  • Finally, in order to improve the environmental conditions of the studied watersheds, we suggest the following actions: (i) insertion of contour lines in the agricultural matrix, (ii) increase of permeable areas in urban centers, (iii) increase in awareness by land owners, (iv) concrete actions taken by state agents such as public awareness, oversight, and penalties for non-compliance with current legislation, and (v) the government should promote public policies aimed at reforestation with native species instead of exotic species.

Author Contributions

All authors contributed equally to this work and have approved the submitted manuscript.

Funding

This research received no external funding.

Acknowledgments

We thank the Research Group in Technology in Ecohydraulics and Conservation of Fisheries and Water Resources, GETECH, for technical and laboratory support. Additional thanks go to National Council for Scientific and Technological Development (CNPq) for the Productivity Grant in Technological Development and Innovative Extension (DT) (S. Makrakis), and Coordination for the Improvement of Higher Level Personnel, CAPES for the Doctoral scholarship (L. F. Celestino).

Conflicts of Interest

The authors declare no conflict of interest.

Appendix A

Table A1. Rapid Assessment Protocol (RAP).
RAPID ASSESSMENT PROTOCOL (RAP)
1. IDENTIFICATION
1.1. Watershed:1.2. Location/Stretch:1.3. Coordinate:
1.4. Date: 1.5. Hour:
1.6. Collection Team:
2. RIVER
2.1. Width (m): 2.2. Depth (m):
Habitats
2.3. Backwater (%):2.4. Current (%): 2.5. Rapids (%):
Background Land Type
2.6. Clay (%): 2.7. Silt (%): 2.8. Sand (%):
3. RIPARIAN ZONE
Vegetation
3.1. Dimension/Width of RZ (m):
3.2. Native Species (%): 3.3. Exotic Species (%):
3.4. Arboreal (%): 3.5. Shrub (%): 3.6. Herbaceous (%):
3.7. Preserved (Native vegetation) (%) 3.8. Anthropized I: (Forestry, pasture, or agriculture) (%) 3.9. Anthropized II (Residential, commercial, or industrial) (%)

Appendix B

Figure A1. Onsite sampling – Application of RAP. (A) measurement of river width, (B) measurement of RZ width, (C–E) application of land RAP, (F) degraded RZ, (G) RZ classified as preserved by geoprocessing and observed in the onsite assessment to be degraded as a consequence of the large presence of exotic and sparse species, and (H) preserved RZ.
Sustainability 11 00490 g0a1

References

  1. Reggiani, P.; Hassanizadeh, S.M. Megascale thermodynamics in the presence of a conservative field: The watershed case. Adv. Water Resour. 2016, 97, 73–86. [Google Scholar] [CrossRef]
  2. O’Geen, A.T.; Dahlgren, R.A.; Swarowsky, A.; Tate, K.W.; Lewis, D.J.; Singer, M.J. Research connects soil hydrology and stream water chemistry in California oak woodlands. Calif. Agric. 2010, 64, 78–84. [Google Scholar] [CrossRef]
  3. Ortega, J.A.; Razola, L.; Garzón, G. Recent human impacts and change in dynamics and morphology of ephemeral rivers. Nat. Hazards Earth Syst. Sci. 2014, 14, 713–730. [Google Scholar] [CrossRef] [Green Version]
  4. Nekhay, O.; Arriaza, M. How attractive is upland olive groves landscape? Application of the analytic Hierarchy Process and gis in southern Spain. Sustainability 2016, 8, 1160. [Google Scholar] [CrossRef]
  5. Le Cozannet, G.; Garcin, M.; Bulteau, T.; Mirgon, C.; Yates, M.L.; Méndez, M.; Baills, A.; Idier, D.; Oliveros, C. An AHP-derived method for mapping the physical vulnerability of coastal areas at regional scales. Nat. Hazards Earth Syst. Sci. 2013, 13, 1209–1227. [Google Scholar] [CrossRef] [Green Version]
  6. Likens, G.E. The Ecosystem Approach: Its Use and Abuse; Ecology Institute: Millbrook, NY, USA, 1992; 167p, ISBN 978-3-946729-03-7. [Google Scholar]
  7. Bonham-Carter, G.F. Geographic Information Systems for Geocientists: Modelling with GIS; Pergamon: Ottawa, CA, USA, 1996; ISBN 9780080571805. [Google Scholar]
  8. Star, J.R.; Estes, J. Geographic Information Systems: An Introduction; Prentice Hall: Upper Saddle River, NJ, USA, 1990; ISBN 10:0133511235. [Google Scholar]
  9. Mendoza, M.E.; Granados, E.L.; Geneletti, D.; Pérez-Salicrup, D.R.; Salinas, V. Analysing land cover and land use change process at watershed level: A multitemporal study in the Lake Cuitzeo Watershed, Mexico (1975–2003). Appl. Geogr. 2011, 31, 237–350. [Google Scholar] [CrossRef]
  10. Forman, R.T.T.; Godron, M. Landscape Ecology; John Wiley and Sons: New York, NY, USA, 1986. [Google Scholar]
  11. Manfré, L.A.; Silva, A.M.; Urban, R.C.; Rodgers, J. Environmental fragility evaluation and guidelines for environmental zoning: A study case on Ibiuna (the Southeastern Brazilian region). Environ. Earth Sci. 2013, 69, 947–957. [Google Scholar] [CrossRef]
  12. Elewa, H.H.; Qaddah, A.A. Groundwater potentiality mapping in the Sinai Peninsula, Egypt, using remote sensing and GIS-watershed-based modeling. Hydrogeol. J. 2011, 19, 613–628. [Google Scholar] [CrossRef]
  13. Rodriguez, D.A.; Chou, S.C.; Tomasella, J.; Demaria, E.M.C. Impacts of landscape fragmentation on simulated precipitation fiels in the Amazonian sub-basin of Ji-Paraná usin the Eta model. Theor. Appl. Climatol. 2014, 115, 121–140. [Google Scholar] [CrossRef]
  14. Adami, S.F.; Coelho, R.M.; Chiba, M.K.; Moraes, J.F.L. Environmental fragility and susceptibility mapping using geographic information systems: Applications on Ribeirão do Pinhal watershed (Limeira, State of São Paulo). Acta Sci. Technol. 2012, 34, 433–440. [Google Scholar] [CrossRef]
  15. Spörl, C.; Ross, S.L. Análise comparativa da fragilidade ambiental com aplicação de três modelos. Espaço e Tempo 2004, 15, 39–49. [Google Scholar]
  16. Donha, A.G.; Souza, L.C.P.; Sugamosto, M.L. Determinação da fragilidade ambiental utilizando técnicas de suporte à decisão e SIG. Rev. Bras. Eng. Agrícola e Ambient. 2006, 10, 175–181. [Google Scholar] [CrossRef] [Green Version]
  17. Gonçalves, G.G.G.; Daniel, O.; Comunello, E.; Vitorino, A.C.T.; Arai, F.K. Determinação da Fragilidade Ambiental de Bacias Hidrográficas. Floresta 2011, 41, 797–808. [Google Scholar] [CrossRef]
  18. Naiman, R.J.; Decamps, H.; Pollock, M. The Role of Riparian Corridors in Maintaining Regional Biodiversity. Ecol. Appl. 1993, 3, 209–212. [Google Scholar] [CrossRef] [PubMed] [Green Version]
  19. Gregory, S.V.; Swanson, F.J.; Mckee, W.A.; Cummins, K.W. An ecosystem perspective of Riparian Zones. Bioscience 1991, 41, 540–551. [Google Scholar] [CrossRef]
  20. Hupp, C.R.; Osterkamp, W.R. Riparian vegetation and fluvial geomorphic processes. Geomorphology 1996, 14, 277–295. [Google Scholar] [CrossRef]
  21. Sabo, J.L.; Spomseller, R.; Dixon, M.; Gade, K.; Harms, T.; Heffernan, J.; Jani, A.; Katz, G.; Soykan, C.; Watts, J.; Welter, J. Riparian zones increase regional species richness by harboring different, no more, species. Ecology 2005, 86, 56–62. [Google Scholar] [CrossRef]
  22. Theobald, D.M. Estimating changes in natural landscapes from 1992 to 2030 for the conterminous United States. Landsc. Ecol. 2010, 25, 999–1011. [Google Scholar] [CrossRef]
  23. Kuglerová, L.; Agren, A.; Jansson, R.; Laudon, H. Towards optimizing riparian buffer zones: Ecological and biogeochemical implications for forest management. For. Ecol. Manag. 2014, 334, 74–84. [Google Scholar] [CrossRef]
  24. Vannote, R.L.; Minshall, G.W.; Cummins, K.W.; Sedell, J.R.; Cushing, C.E. The river continuum concept. Can. J. Fish. Aquat. Sci. 1980, 37, 130–137. [Google Scholar] [CrossRef]
  25. Ranalli, A.J.; Macalady, D.L. The importance of the riparian zone and in-stream process in nitrate attenuation in undisturbed and agricultural watersheds- A review of the scientific literature. J. Hydrol. 2010, 389, 406–415. [Google Scholar] [CrossRef]
  26. Fremier, A.K.; Kiparsky, M.; Gmur, S.; Aycrigg, J.; Craig, R.K.; Svancara, L.K.; Goble, D.D.; Cosens, B.; Davis, F.W.; Scott, J.M. A riparian conservation network for ecological resilience. Biol. Conserv. 2015, 191, 29–37. [Google Scholar] [CrossRef] [Green Version]
  27. Zimbres, B.; Peres, C.A.; Bom, R. Terrestrial mammal responses to habitat structure and quality of remmant riparian forests in an Amazonian cattle-ranching landscape. Biol. Conserv. 2017, 206, 283–292. [Google Scholar] [CrossRef]
  28. Barreto, A.P.; Aranha, J.M.R. Assembleia de peixes de um riacho da Floresta Atlântica: Composição e distribuição espacial (Guaraqueçaba, Paraná, Brasil). Acta Sci. Biol. Sci. 2005, 2, 153–160. [Google Scholar] [CrossRef]
  29. QGIS Development Team. QGIS Geographic Information System Developers Manual. 2015. Available online: http://www.qgis.org/ (accessed on 27 January 2015).
  30. Biehl, L.; Landgrebe, D. MultiSpec-a tool for multispectral–hyperspectral image data analysis. Comput. Geosci. 2002, 28, 1153–1159. [Google Scholar] [CrossRef]
  31. Landis, J.R.; Koch, G.G. The measurement of observer agreement for categorical data. Biometrics 1977, 33, 159–174. [Google Scholar] [CrossRef] [PubMed]
  32. McCune, B.; Mefford, M.J. PC-ORD: Multivariate Analysis of Ecological Data, 6th ed.; MjM Software: Gleneden Beach, OR, USA, 2011. [Google Scholar]
  33. Empresa Brasileira de Pesquisa Agropecuária (EMBRAPA). Serviço Nacional de Levantamento e Conservação de Solos (Rio de Janeiro, RJ). Reunião Técnica de Levantamento de Solos. Rio de Janeiro. 1979. Available online: http://library.wur.nl/isric/fulltext/isricu_i00006739_001.pdf (accessed on 10 October 2018).
  34. Instituto de Terras, Cartografia e Geociências- ITCG. Dados e informações geoespaciais temáticos. 2008. Available online: http://www.itcg.pr.gov.br/modules/faq/category.php?categoryid=9# (accessed on 10 October 2018).
  35. Serviço Geológico do Brasil- CPRM. Atlas pluviométrico do Brasil. 2006. Available online: http://www.cprm.gov.br/publique/Hidrologia/MapasePublicacoes/AtlasPluviometrico-do-Brasil-1351.html (accessed on 10 October 2018).
  36. Saaty, T.L. Decision making with the analytic hierarchy process. Int. J. Serv. Sci. 2008, 1, 83–98. [Google Scholar] [CrossRef]
  37. Celestino, E.F.; Makrakis, S.; Kashiwaqui, E.A.L.; Celestino, L.F.; Makrakis, M.C.; Mariano, J.R. Environmental conditions in river segments intercepted by culverts. Braz. J. Biosci. 2013, 11, 423–431. [Google Scholar]
  38. Brasil. Presidência da República. Lei 12.651, de 25 de maio de 2012, Brasília, 2012. Código Florestal. Available online: https://www.planalto.gov.br/ccivil_03/_ato2011-2014/2012/lei/l12651 (accessed on 10 October 2018).
  39. Pearson, K. On lines and planes of closest fit to system of point in space. Philos. Mag. 1901, 2, 550–572. [Google Scholar] [CrossRef]
  40. Humphries, J.M.; Bookstein, F.L.; Chernoff, B.; Smith, G.R.; Elder, R.L.; Poss, S.G. Multivariate discrimination by shape in relation to size. Syst. Zool. 1981, 30, 291–308. [Google Scholar] [CrossRef]
  41. Gauch, H.G., Jr. Multivariate Analysis in Community Ecology, 6th ed.; Cambridge University Press: New York, NY, USA, 1986; ISBN 0-521-28240-3. [Google Scholar]
  42. Jackson, D.A. Stopping rules in principal component analy- sis: A comparison of heuristical and statistical approaches. Ecology 1993, 74, 2204–2214. [Google Scholar] [CrossRef]
  43. STATSOFT, Inc. Statistica: Data Analysis Software System, 7th ed.; STATSOFT, Inc.: Tulsa, OK, USA, 2004. [Google Scholar]
  44. Instituto Brasileiro de Geografia e Estatística (IBGE). Censo Populacional. 2014. Available online: ftp://ftp.ibge.gov.br/Estimativas_de_Populacao/Estimativas_2014/estimativa_dou_2014.pdf (accessed on 10 October 2018).
  45. United Nations Development Programme (UNDP). Atlas do Desenvolvimento Humano, 2000. Available online: http://www.br.undp.org/content/brazil/pt/home/ (accessed on 10 October 2018).
  46. Roni, P.; Hanson, K.; Beechie, T.J.; Pess, G.R.; Pollock, M.M.; Bartley, D.M. Habitat rehabilitation for inland fisheries. In Global Review of Effectiveness and Guidance for Rehabilitation of Freshwater Ecosystems; United Nations Fisheries Biology Technical Paper; FAO: Rome, Italy, 2005. [Google Scholar]
  47. Xu, S.; Zhao, Q.; Ding, S.; Qin, M.; Ning, L.; Ji, X. Improving soil and water conservation of riparian vegetation based on landscape leakiness and optimal vegetation pattern. Sustainability 2018, 10, 1571. [Google Scholar] [CrossRef]
  48. Howard, G.B. Reaping the benefits ofno-tillage farming. Nature 2012, 484, 455. [Google Scholar]
  49. Ferreira, A.; De Paula, F.R.; Ferraz, S.F.B.; Gerhard, P.; Kashiwaqui, E.A.L.; Cyrino, J.E.P.; Martinelli, L.A. Riparian coverage affects diets of characids in neotropical streams. Ecol. Freshw. Fish 2011, 21, 12–22. [Google Scholar] [CrossRef]
  50. Lima, G.C.; Silva, M.L.N.; Oliveira, M.S.; Curi, N.; Silva, M.A.; Oliveira, A.H. Variabilidade de atributos do solo sob pastagens e mata atlântica na escala de microbacia hidrográfica. Rev. Bras. Eng. Agrícola e Ambient. 2014, 18, 517–526. [Google Scholar] [CrossRef] [Green Version]
  51. Walsh, C.J.; Roy, A.H.; Feminella, J.W.; Cottingham, P.D.; Groffman, P.M.; Morgan, R.P., II. The Urban Stream Syndrome: Current knowledge and the search for a cure. J. N. Am. Benthol. Soc. 2005, 24, 706–723. [Google Scholar] [CrossRef]
  52. Nekhay, O.; Arriaza, M.; Boerboom, L. Evaluation of soil erosion risk using Analytic Network Process and GIS: A case study from Spanish mountain olive plantations. J. Environ. Manag. 2009, 90, 3091–3104. [Google Scholar] [CrossRef]
  53. Lazdinis, M.; Angelstam, P. Functionality of riparian forest ecotones in the context of former Soviet Union and Swedish forest management histories. For. Policy Econ. 2005, 7, 321–332. [Google Scholar] [CrossRef]
  54. Valero, E.; Picos, J.; Álvarez, X. Characterization of riparian forest quality of the Umia River for a proposed restoration. Ecol. Eng. 2014, 67, 216–222. [Google Scholar] [CrossRef]
  55. Hladyz, S.; Åbjörnsson, K.; Giller, P.S.; Woodward, G. Impacts of an aggressive riparian invader on community structure and ecosystem functioning in stream food webs. J. Appl. Ecol. 2011, 48, 443–452. [Google Scholar] [CrossRef] [Green Version]
  56. Hoang, L.N.K. The Effect of Riparian Zones on Nitrate Removal by Denitrification at the River Basin Scale; UNESCO-IHE Institute for Water Education: Delft, The Netherlands, 2014; ISBN 9781138024052. [Google Scholar]
  57. Alignier, A.; Deconchat, M. Variability of forest edge effect on vegetation implies reconsideration of its assumed hypothetical pattern. Appl. Veg. Sci. 2011, 14, 67–74. [Google Scholar] [CrossRef]
  58. Możdżeń, K.; Pepka, P. Allelopathic influence of aqueous extracts from the leaves of Morus Alba L. on seed germination and seedling growth of Cucumis sativus L. and Sinapsis alba L. Mod. Phytomorphol. 2014, 5, 93–99. [Google Scholar] [CrossRef]
  59. Cooper, S.D.; Lake, P.S.; Sabater, S.; Melack, J.M.; Sabo, J.L. The effects of land use changes on streams and rivers in mediterranean climates. Hydrobiologia 2013, 719, 383–425. [Google Scholar] [CrossRef]
  60. Suomalainen, J.; Hakala, T.; Peltoniemi, J.; Puttonen, E. Polarised Multiangular Reflectance Measurements Using the Finnish Geodetic Institute Field Goniospectrometer. Sensors 2009, 9, 3891–3907. [Google Scholar] [CrossRef] [PubMed] [Green Version]
  61. Fahrig, L. Effects of habitat fragmentation on biodiversity. Annu. Rev. Ecol. Environ. Syst. 2003, 34, 487–515. [Google Scholar] [CrossRef]
  62. Santos, F.B.; Ferreira, F.C.; Esteves, K.E. Assessing the importance of the riparian zone for stream fish communities in a sugarcane dominated landscape (Piracicaba River Basin, Southeast Brazil). Environ. Biol. Fishes 2015, 98, 1895–1912. [Google Scholar] [CrossRef]
  63. Hannaford, M.J.; Barbour, M.; Resh, V.H. Training reduces observer variability in visual-based assessments of stream habitat. J. N. Am. Benthol. Soc. 1997, 16, 853–860. [Google Scholar] [CrossRef]
  64. Lin, E.; Shaad, K.; Girot, C. Developing river rehabilitation scenarios by integrating landscape and hydrodynamic modeling for the Ciliwung River in Jakarta, Indonesia. Sustain. Cities Soc. 2016, 20, 180–198. [Google Scholar] [CrossRef]
Figure 1. Location map of the nine watersheds in which the land use was analyzed. Circles refer to the two watersheds selected by the similarity cluster method to analyze the environmental fragility and connectivity of riparian zones (RZs).
Sustainability 11 00490 g001
Figure 2. Sarandi and Monteiro rivers watersheds with the drainage areas delimited, land use profile, and landscape items.
Sustainability 11 00490 g002
Figure 3. Analysis of environmental fragility in the Sarandi and Monteiro watersheds, considering the degrees of fragility.
Sustainability 11 00490 g003
Figure 4. Results of the Principal Components Analysis—PCA, and ANOVA One-way about the data from the Rapid Assessment Protocol—RAP. (A) Axis data distribution of principal component analysis (PCA). (B) ANOVA generated from the PCA scores for the RZs of the Sarandi (Sar) and Monteiro (Mon) watersheds.
Sustainability 11 00490 g004
Figure 5. Flowchart describing the multi-factorial approach for environmental assessment of watersheds. Color scales indicate the interactions of the variables along three independent spatial gradients: watershed, riparian zone, and river.
Sustainability 11 00490 g005
Table 1. Categories of land use found in watersheds.
Land Use Description
UrbanPlaces with houses, buildings, and soil sealing.
Exposed landAreas with land disturbance due to management practices.
AgriculturalAreas composed of diverse crops, especially soybean, corn, cassava, and oats, and recently harvested sites.
PastureLand cover composed of herbaceous and grass plants used for animal nutrition.
VegetationVegetation areas along aquatic bodies in riparian zones, legal reserves, and other areas of shrub and tree vegetation in the watersheds.
Table 2. Land use of the nine analyzed watersheds. Area (ha), percentage (%), and Kappa statistics areas. The watershed (MON = Monteiro, SAR = Sarandi, SIL = Silva Jardim, GON = Gonçalves Dias, COT = Cotejipe, AND = Andrada, FLO = Floriano, SAN = Santo Antônio, and CAP = Capanema). The grayscale represents the clustering of watersheds by similarity. The two watersheds selected for this study are highlighted in bold.
AreaMONSARSILGONCOTANDFLOSANCAP
Urbanha275.94731.3468.57245.1432.672,839.1658.621193.94880.03
%2.433.200.120.500.053.400.090.930.45
Exposed soilha106.8022.6548.5613.9328.54405.930.17181.08456.32
%0.940.100.080.030.040.490.000.140.23
Agricultureha5773.4315,713.2221,413.4012,572.3725,809.916283.48251.6747,944.5738,155.33
%50.9268.8137.3925.4340.677.530.3737.4819.39
Pastureha3107.123066.949459.197775.6821,701.1234,449.66157.5329,451.95100,664.02
%27.4013.4316.5215.7334.2041.280.2323.0251.17
Vegetationha2075.793300.2926,283.2928,826.6815,889.5039,472.2867,187.6049,153.9256,582.76
%18.3114.4545.8958.3125.0447.3099.3138.4228.76
Kappa Statistic0.9940.9960.9970.9990.9970.99610.9960.998
Table 3. Relationship between variables and scores used for the analysis of environmental fragility. Adapted from Spörl & Ross [15]; Manfré et al. [11], and Cozannet et al. [5].
VariablesLevels of Environmental Fragility
Very Low LowAverageHighVery High
12345
Slope (%)Flat (0–3)Slightly hilly (3–8) Hilly * (8–20)Strongly hilly (20–45)>45
Soil classification Dystroferric red latosol and clayey and very clayey dystrophic latosolLatosol: red and red-yellow dystrophic medium clayey texture Latosol: red-yellow, Nitosols, Acrisols red-yellow medium clayey texture *Cambisols, Acrisols Red-yellow medium sandy texture Acrisols with gravel, Litholic neosols and Typic Quartzipsamment
Land use Vegetation PastureAgricultural *, Exposed soilUrban
Rainfall (mm/year)>20002000 to 1500 * 1500 to 10001000 to 500<500 or >2500
* Refers to a dominant variable in the Monteiro Watershed. Refers to a dominant variable in the Sarandi Watershed.
Table 4. Location of collection points and mean values of variables analyzed by rapid assessment protocol (RAP). (MP = Monteiro point number) and (SP = Sarandi point number).
PointCoordinatesWidthDimensionNativeExoticArboreousShrubHerbaceous
River (m)RZ (m)RZ (%)RZ (%)RZ (%)RZ (%)RZ (%)
MP125°30′25.79″ S53°39′27.15″ W17.7836.0999.001.0015.0052.5032.50
MP225°29′57.65″ S53°39′15.99″ W14.7512.9399.001.006.5042.5051.00
MP325°29′56.26″ S53°38′59.85″ W13.0734.47100.000.0022.5040.0037.50
MP425°29′58.92″ S53°38′28.50″ W10.7541.2399.500.5075.0012.5012.50
MP525°29′47.26″ S53°38′31.45″ W10.2511.4097.003.005.0015.0080.00
MP625°29′12.75″ S53°38′27.76″ W110632.51100.000.0050.0027.5022.50
MP725°29′4.22″ S53°38′37.49″ W13.2319.3298.002.0025.0032.5042.50
MP825°28′14.60″ S53°38′3.67″ W13.6623.98100.000.0030.0040.0030.00
MP925°28′5.37″ S53°37′49.26″ W10.9823.0099.500.5027.5047.5025.00
MP1025°28′12.51″ S53°37′38.75″ W11.6115.2698.002.0017.5042.5040.00
SP125°35′18.02″ S53°30′14.20″ W14.5916.2132.5067.5025.0035.0040.00
SP225°35′35.31″ S53°30′31.40″ W11.0210.9632.5067.5022.5052.5025.00
SP325°35′44.26″ S53°31′5.78″ W12.8519.7142.5057.5010.5035.0054.50
SP425°36′13.77″ S53°31′13.92″ W19.5725.1180.0020.0037.5040.0022.50
SP525°36′5.90″ S53°30′45.04″ W14.548.5380.0020.0013.5032.5054.00
SP625°36′21.98″ S53°30′25.94″ W21.3614.4387.5012.5012.5052.5035.00
SP725°36′52.19″ S53°30′33.71″ W12.343.6790.0010.000.5022.5077.00
SP825°37′2.05″ S53°30′45.00″ W14.6118.1199.500.5010.0042.5047.50
SP925°37′21.79″ S53°30′22.12″ W18.4114.8299.001.007.5045.0047.50
SP1025°37′36.58″ S53°30′50.24″ W17.0033.0290.0010.0040.0042.5017.50

