Experimental Investigation and Numerical Simulation of CO2–Brine–Rock Interactions during CO2 Sequestration in a Deep Saline Aquifer

1
School of Resources and Geosciences, China University of Mining and Technology, Xuzhou 221116, China
2
BMILP Science and Technology Development Co., Ltd., Beijing 100054, China
*
Author to whom correspondence should be addressed.
Sustainability 2019, 11(2), 317; https://doi.org/10.3390/su11020317
Submission received: 19 November 2018
/
Revised: 10 December 2018
/
Accepted: 31 December 2018
/
Published: 9 January 2019
(This article belongs to the Section Environmental Sustainability and Applications)
Abstract
:CO2 mineralization is a long-term and secure solution for geological CO2 storage that primarily depends on the CO2–brine–rock interaction during CO2 sequestration in subsurface formations. In this study, lab experiments were conducted to investigate the CO2–brine–rock interaction over short timescales, and numerical simulations were performed to reveal dynamic interactions and equilibrium interactions by applying TOUGHREACT and PHREEQC, respectively. In the experiments, the main ions of HCO3− and Ca2+ were detected in the solution, and calcite dissolution and dawsonite precipitation were observed from SEM images. The simulation results showed that the CO2 dissolution and the solution pH were affected by the temperatures, pressures, types of solutions, and solution concentrations and were further influenced by mineral dissolution and precipitation. The results of the equilibrium simulation showed that the dissolved minerals were albite, anhydrite, calcite, Ca-montmorillonite, illite, K-feldspar, and chlorite, and the precipitated minerals were dolomite, kaolinite, and quartz, which led to HCO3−, K+, and Na+ being the main ions in solutions. The results of the dynamic simulation showed that calcite and dolomite dissolved in the early period, while other minerals began to dissolve or precipitate after 100 years. The dissolved minerals were mainly albite, kaolinite, K-feldspar, and chlorite, and precipitated minerals were Ca-montmorillonite, illite, and quartz. Anhydrite and pyrite did not change during the simulation period, and the main ions were HCO3−, Na+, Ca2+, and Mg2+ in the simulation period. This study provides an effective approach for analyzing the CO2–brine–rock interaction at different stages during CO2 storage, and the results are helpful for understanding the CO2 mineralization processes in deep saline aquifers.
1. Introduction
The overuse of fossil fuels in industrial production and human life has caused a continuous and dramatic increase of greenhouse gas emissions. Controlling greenhouse gas emissions and protecting the global climate is currently a major issue [1]. The role of CO2 as a greenhouse gas and its potential effect on the global climate has been well-documented [2,3,4]. Of a variety of CO2 emission reduction methods, CO2 sequestration in geologic formations is undoubtedly the most realistic and effective disposal approach. The three primary candidate formation types suggested for geologic sequestration are oil and gas reservoirs, coalbeds, and deep saline formations, which all contain aqueous phases [5,6,7]. Compared to other types of geologic media, sequestration of CO2 in deep saline aquifers is considered to have the largest potential capacity because of the large pore volumes in sedimentary basins, the high density and solubility of CO2 in deep saline aquifers at high pressures, and the widespread global distribution of deep saline aquifers [8,9,10,11,12].
There are four primary mechanisms by which CO2 can be trapped in a porous medium: structural trapping, residual trapping, dissolution trapping, and mineral trapping [9,13,14]. Structural and residual trapping is also called physical trapping and occurs solely upon the injection of CO2, while mineral and solubility trapping refers to geochemical trapping and usually occurs over a longer time period after the CO2 is injected [15]. Due to the formation of solid immobile carbonates, mineral trapping is the safest and most permanent means of CO2 geological storage, and continues on after solubility trapping because it depends on CO2 dissolution in brine [16]. The process of solubility and mineral trapping essentially involves the interaction among the CO2, brine, and rock.
In recent years, researchers have conducted several studies on the CO2–brine–rock interaction during CO2 geological storage, including lab experiments and numerical simulations. Much of this research has focused on changes in the composition of formation waters, mineral dissolution and precipitation, and modification of the formation porosity and permeability [1,16,17,18,19,20,21,22,23,24,25,26], which are extremely important to CO2 storage safely, effectively and for a long time [27,28,29]. Chemical reactions that are initiated by CO2 dissolution in formation water after CO2 injected into a reservoir result in the modified fluid having a lower pH and higher HCO3 [30]. The aqueous solubility of CO2 is temperature-, pressure-, and ionic strength-dependent and is generally lower at elevated temperature and salinity and greater at elevated pressure [31,32,33]. The acid formed by CO2 dissolution will react with minerals, leading to the dissolution or precipitation of minerals and the change of ion concentrations in the water [34,35,36]. The reactions among CO2, brine, and rock are many and varied, depending on the chemical composition of the fluid and the mineralogy of the rock [37]. Cui et al. [38] conducted a CO2–brine–rock interaction experiment using sandstone and carbonate and reached the conclusion that for sandstone, the presence of CO2 can lead to the dissolution of ankerite and clay minerals and the precipitation of plagioclase, which can result in the increase of Ca2+ and Mg2+ in formation water; for carbonates, CO2 can induce the dissolution of dolomite and the precipitation of ankerite and calcite. Gysi and Stefansson [39] observed that the dissolution of basaltic glass in CO2-rich waters was incongruent with the overall water composition and secondary mineralogy, depending on reaction progress and pH.
However, lab experiments of the CO2–brine–rock interaction only last several months or years at most, and in reality the geochemical reactions occur over a geologic time scales. Therefore, geochemical modeling has been performed to assess long-term effects of CO2–brine–rock interaction during CO2 geological sequestration. PHREEQC is a general geochemical software program that can be applied to most hydrogeochemical environments [40]. Steel et al. [16] performed geochemical modeling to get an indication of how close the experiments were to reaching equilibrium using PHREEQC. Davila et al. [41] calculated the saturation indexes of the injected solutions with PHREEQC. TOUGHREACT is a numerical simulation program for chemically reactive non-isothermal flows of multiphase fluids in porous and fractured media that has been widely used to study CO2 disposal in deep formations [42]. Zhang et al. [14] established a reactive geochemical transport model to identify the multiphase processes, geochemical changes and mineral alteration, and CO2 trapping mechanisms after CO2 injection by applying TOUGHREACT. Tian et al. [43] focused on mineral alterations induced by the invasion of CO2, feedback on medium properties such as porosity, and the self-sealing efficiency of the caprock through TOUGHREACT. In addition, there are some other numerical tools for studying the CO2–brine–rock interaction during CO2 storage in subsurface formations [20,44,45].
Though previous scholars have done a lot of research on the CO2–brine–rock interaction and CO2 mineralizing during CO2 geological storage, simultaneous conduction of lab experiments and numerical simulations, especially for comparing the results by different simulation methods, need to be further studied. To further identity the interaction among CO2, water, and rock at different stages, we designed lab experiments to reveal the interaction over short times in a high-temperature and high-pressure reactor, and we subsequently performed numerical simulations with two types of software to comparatively analyze the balanced and dynamic interactions. These are also the innovative aspects of this paper.
2. Experimental Set-Up
2.1. Experimental Materials
The rock samples used for experiments were taken from the upper layer of the Shahejie Formation, which is located at a depth of 2780 m in a sandstone saline aquifer in the Dongying Depression, China. More detailed information on the sandstone can be found in Liu et al. [28]. The photo of the sandstone handsample and thin section image under 150x magnification are shown in Figure 1. X-ray diffraction (XRD) analysis was conducted to determine the sandstone mineralogy using X’Pert Pro MPD model (D/MAX 2500) in Research Institute of Petroleum Exploration and Development, China. The main mineral compositions and contents of the sandstone are shown in Table 1.
2.2. Experimental Procedure
The experiments were conducted in a static high temperature and high pressure reactor. A schematic diagram of the test system is shown in Figure 2. The sandstone sample was cut into slices of 20 mm × 10 mm × 3 mm, and the slices were washed with deionized water and dried at 105 °C for 48 h. Then, every slice was weighed (with average mass of 1.80 g) before the experiment and loaded into the reactor container. NaCl solutions with different concentrations of 0.02, 0.1, and 0.5 mol/L were prepared to represent brackish water, saltwater, and brine in different reservoirs, respectively. The reaction solutions were purged with pure N2 gas for 10 minutes to remove atmospheric oxygen and were then stored in the brine tank for use. In every experiment, 25 mL of NaCl solution or deionized water was pumped into the reactor container through a liquid metering pump, with a solid–liquid ratio of 1:14 by weight, which could provide sufficient liquid to react with sandrock slices. CO2 was injected by a gas metering pump through the CO2 cylinder to the reactor container. The temperature was maintained at 50 °C by water bath heating throughout the experiments, and pressure was controlled at 2, 5, 8, and 10 MPa by adjusting the CO2 injection amount. During the experiment, temperature, and pressure were monitored with a thermometer and pressure gauge. After experiment, reaction solutions and rock slices were sampled for further analysis to evaluate the influence of the experiment time, NaCl solution concentration, and experiment pressure on the CO2–brine–rock interaction. A set of experiments was conducted, and the parameters of the specific batch experiments are shown in Table 2.
2.3. Analytical Methods
Concentrations of major cations (including K+, Na+, Ca2+, and Mg2+) and anions (mainly HCO3− and SO42−) in the aqueous samples were determined with inductively coupled plasma mass spectrometry (ICP–MS) and ion chromatography (IC), respectively. Before the analysis, nitric acid was added to stabilize the ions in the solutions.
After each experiment, the remaining sandstone sample was retrieved, rinsed repeatedly with distilled water, dried at 50 °C for 24 h, and weighed. The surface morphology of the sample was analyzed with a TESCANVEGAII-LSH tungsten filament scanning electron microscope (SEM) at 20kV in the Education Ministry Key Laboratory of Marine Reservoir Evolution and Hydrocarbon Accumulation Mechanism, China University of Geosciences (Beijing).
2.4. Experimental Results
2.4.1. Effect of Experiment Time on CO2–Brine–Rock Interaction
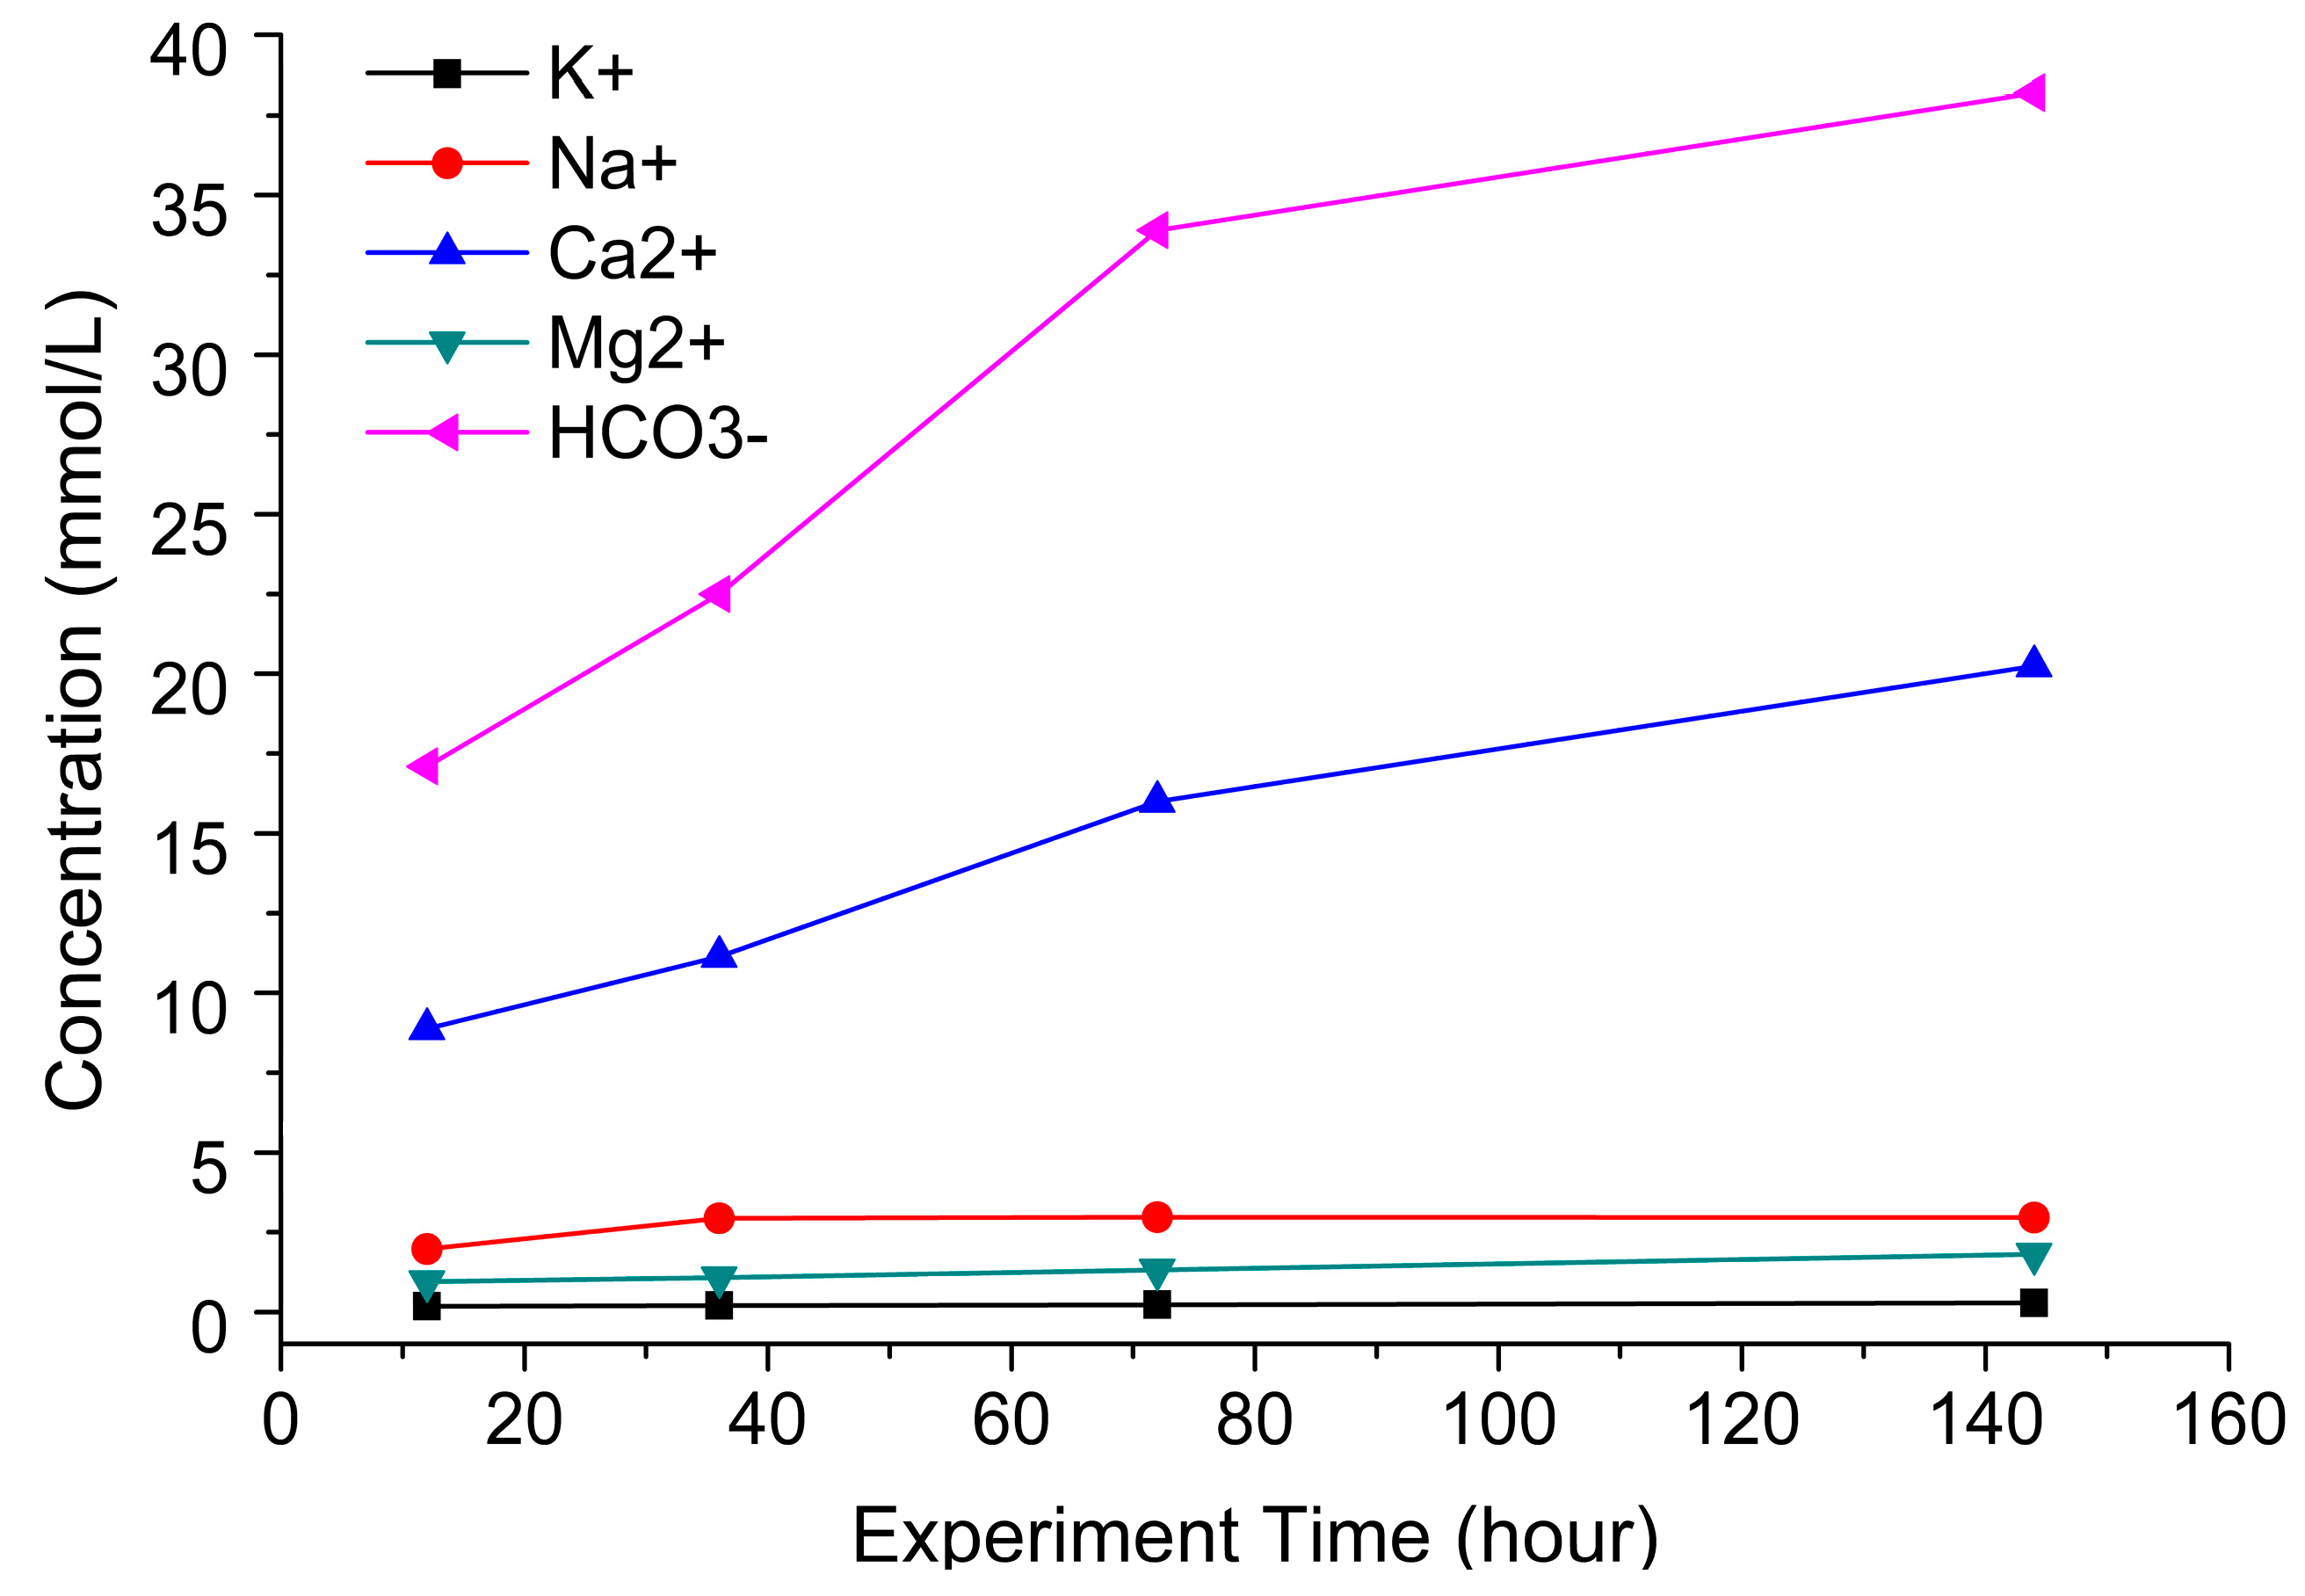
The changes of K+, Na+, Mg2+, Ca2+, and HCO3− concentrations in the solutions at different experiment times during the CO2–brine–rock interaction are shown in Figure 3. Low concentrations of K+, Na+, and Mg2+ were detected in the solution, which are possibly derived from small amounts of K-feldspar, albite, and dolomite dissolved in the sandstone. Comparatively, the concentrations of Ca2+ and HCO3− were large and significantly increased with experiment time, and they may have been generated from the large amount of calcite dissolution from the sandstone. Since the concentrations of the main ions clearly changed at the experiment time of 72 h, the following experiments were conducted for 72 h.
2.4.2. Effect of Experimental Pressure on CO2–Brine–Rock Interaction
The changes of K+, Na+, Ca2+, Mg2+, HCO3−, and SO42− concentrations in the solutions with different experimental pressures during the CO2–brine–rock interaction are shown in Figure 4. With the increased pressure, the concentrations of Na+ and Mg2+ increased slightly, while the concentrations of HCO3− and Ca2+ increased significantly, and the concentrations of K+ and SO42− did not change with increasing pressure.
2.4.3. Effect of NaCl Concentration on CO2–Brine–Rock Interaction
The changes of K+, Na+, Ca2+, Mg2+, HCO3−, and SO42− concentrations in the solutions with different NaCl concentrations during the CO2–fluid–rock interaction are shown in Figure 5. When the concentration of NaCl increased in the solution, the concentrations of K+, Ca2+, Mg2+, HCO3−, and SO42− increased slightly. However, the concentration of Na+ decreased significantly with the increasing NaCl concentration, which indicates that some secondary mineral containing Na was forming due to the CO2–brine–rock interaction.
2.4.4. Effect of CO2–Brine–Rock Interaction on Rock Minerals
To further investigate the changes in the mineral morphology during the CO2–brine–rock interaction, the surfaces of thin sandstone slices were observed using an SEM before and after the reaction (Figure 6). The results showed that the calcite minerals exhibited a nice crystalline form before the CO2–brine–rock interaction (Figure 6a,b), and the crystal surface was smooth and clean. However, the calcite was intensely dissolved during the CO2–brine–rock interaction. As the experiment pressure increased, the calcite corrosion strength also increased. As shown, at the pressure of 2 MPa, the calcite dissolution was not clear (Figure 6c), while at pressures of 5 MPa and 8 MPa, the mineral surface became loose and porous due to the further dissolution of calcite (Figure 6d,e), and at the pressure of 10 MPa, the original morphology of the calcite was unrecognizable, leaving some holes on the surface of sandstone (Figure 6f). The precipitation of new minerals was also observed after the reaction. Some white slender minerals were found on the surface of the sandstone (Figure 6g–i). They were likely dawsonite, which formed by mineral recrystallization, resulting in the large decrease of Na+ in solution after the experiment.
3. Simulation Evaluation
3.1. Balanced Simulation by PHREEQC
The PHREEQC interactive model (Version 2.5, USGS, Reston, Virginia, VI, USA, 2001) was used to analyze the balanced interactions among CO2, brine, and rock under different conditions (including different types of solutions, NaCl concentrations, temperatures, and pressures). In the simulation, the amount of minerals input was listed in Table 1, and the amount of water or solution input was 1.4 L, considering a solid–liquid ratio of 1:14 by weigh similar to the experiment. The results of mineral dissolution or precipitation are shown in Figure 7. Overall, crystals of albite, anhydrite, calcite, Ca-montmorillonite, illite, K-feldspar, and chlorite dissolved; crystals of dolomite, kaolinite, and quartz precipitated; and pyrite changed little for its limited amount. The entire input of albite (25 mmol), Ca-montmorillonite (5 mmol), chlorite (1 mmol), and illite (21 mmol) dissolved, and the dissolution amount did not change with different NaCl solution concentrations, types of solutions, temperatures and pressures. Seven millimolar anhydrite fully dissolved in pure water and NaCl solutions, but the dissolution amount was reduced in CaCl2 and MgCl2 solutions. Only 4.37 mmol of the calcite input dissolved in pure water and NaCl solutions, and the dissolution amount did not change with the NaCl concentrations, temperatures, and pressures; however, the dissolution amount increased significantly (up to 36.6 mmol) in the MgCl2 solution. In contrast, 18.8 mmol of calcite precipitated in the CaCl2 solution. In pure water, the amount of K-feldspar dissolution was clearly affected by temperature and pressure, as it decreased with increasing temperature and increased with increasing pressure. In NaCl solutions, the amount of K-feldspar dissolution increased slightly with increasing concentrations of the NaCl solutions. In CaCl2 and MgCl2 solutions, the amount of K-feldspar dissolution increased compared with the same concentration of the NaCl solution. In pure water, the precipitation amount of kaolinite and quartz were clearly affected by temperature and pressure, decreasing with increasing temperature and increasing with increasing pressure. In addition, the precipitation amount of kaolinite and quartz slightly increased with the increasing concentration of the NaCl solutions, and significantly increased in the CaCl2 and MgCl2 solutions. The precipitation amount of dolomite did not change with different temperatures or pressures in pure water or in NaCl and CaCl2 solutions, but significantly increased in the MgCl2 solution.
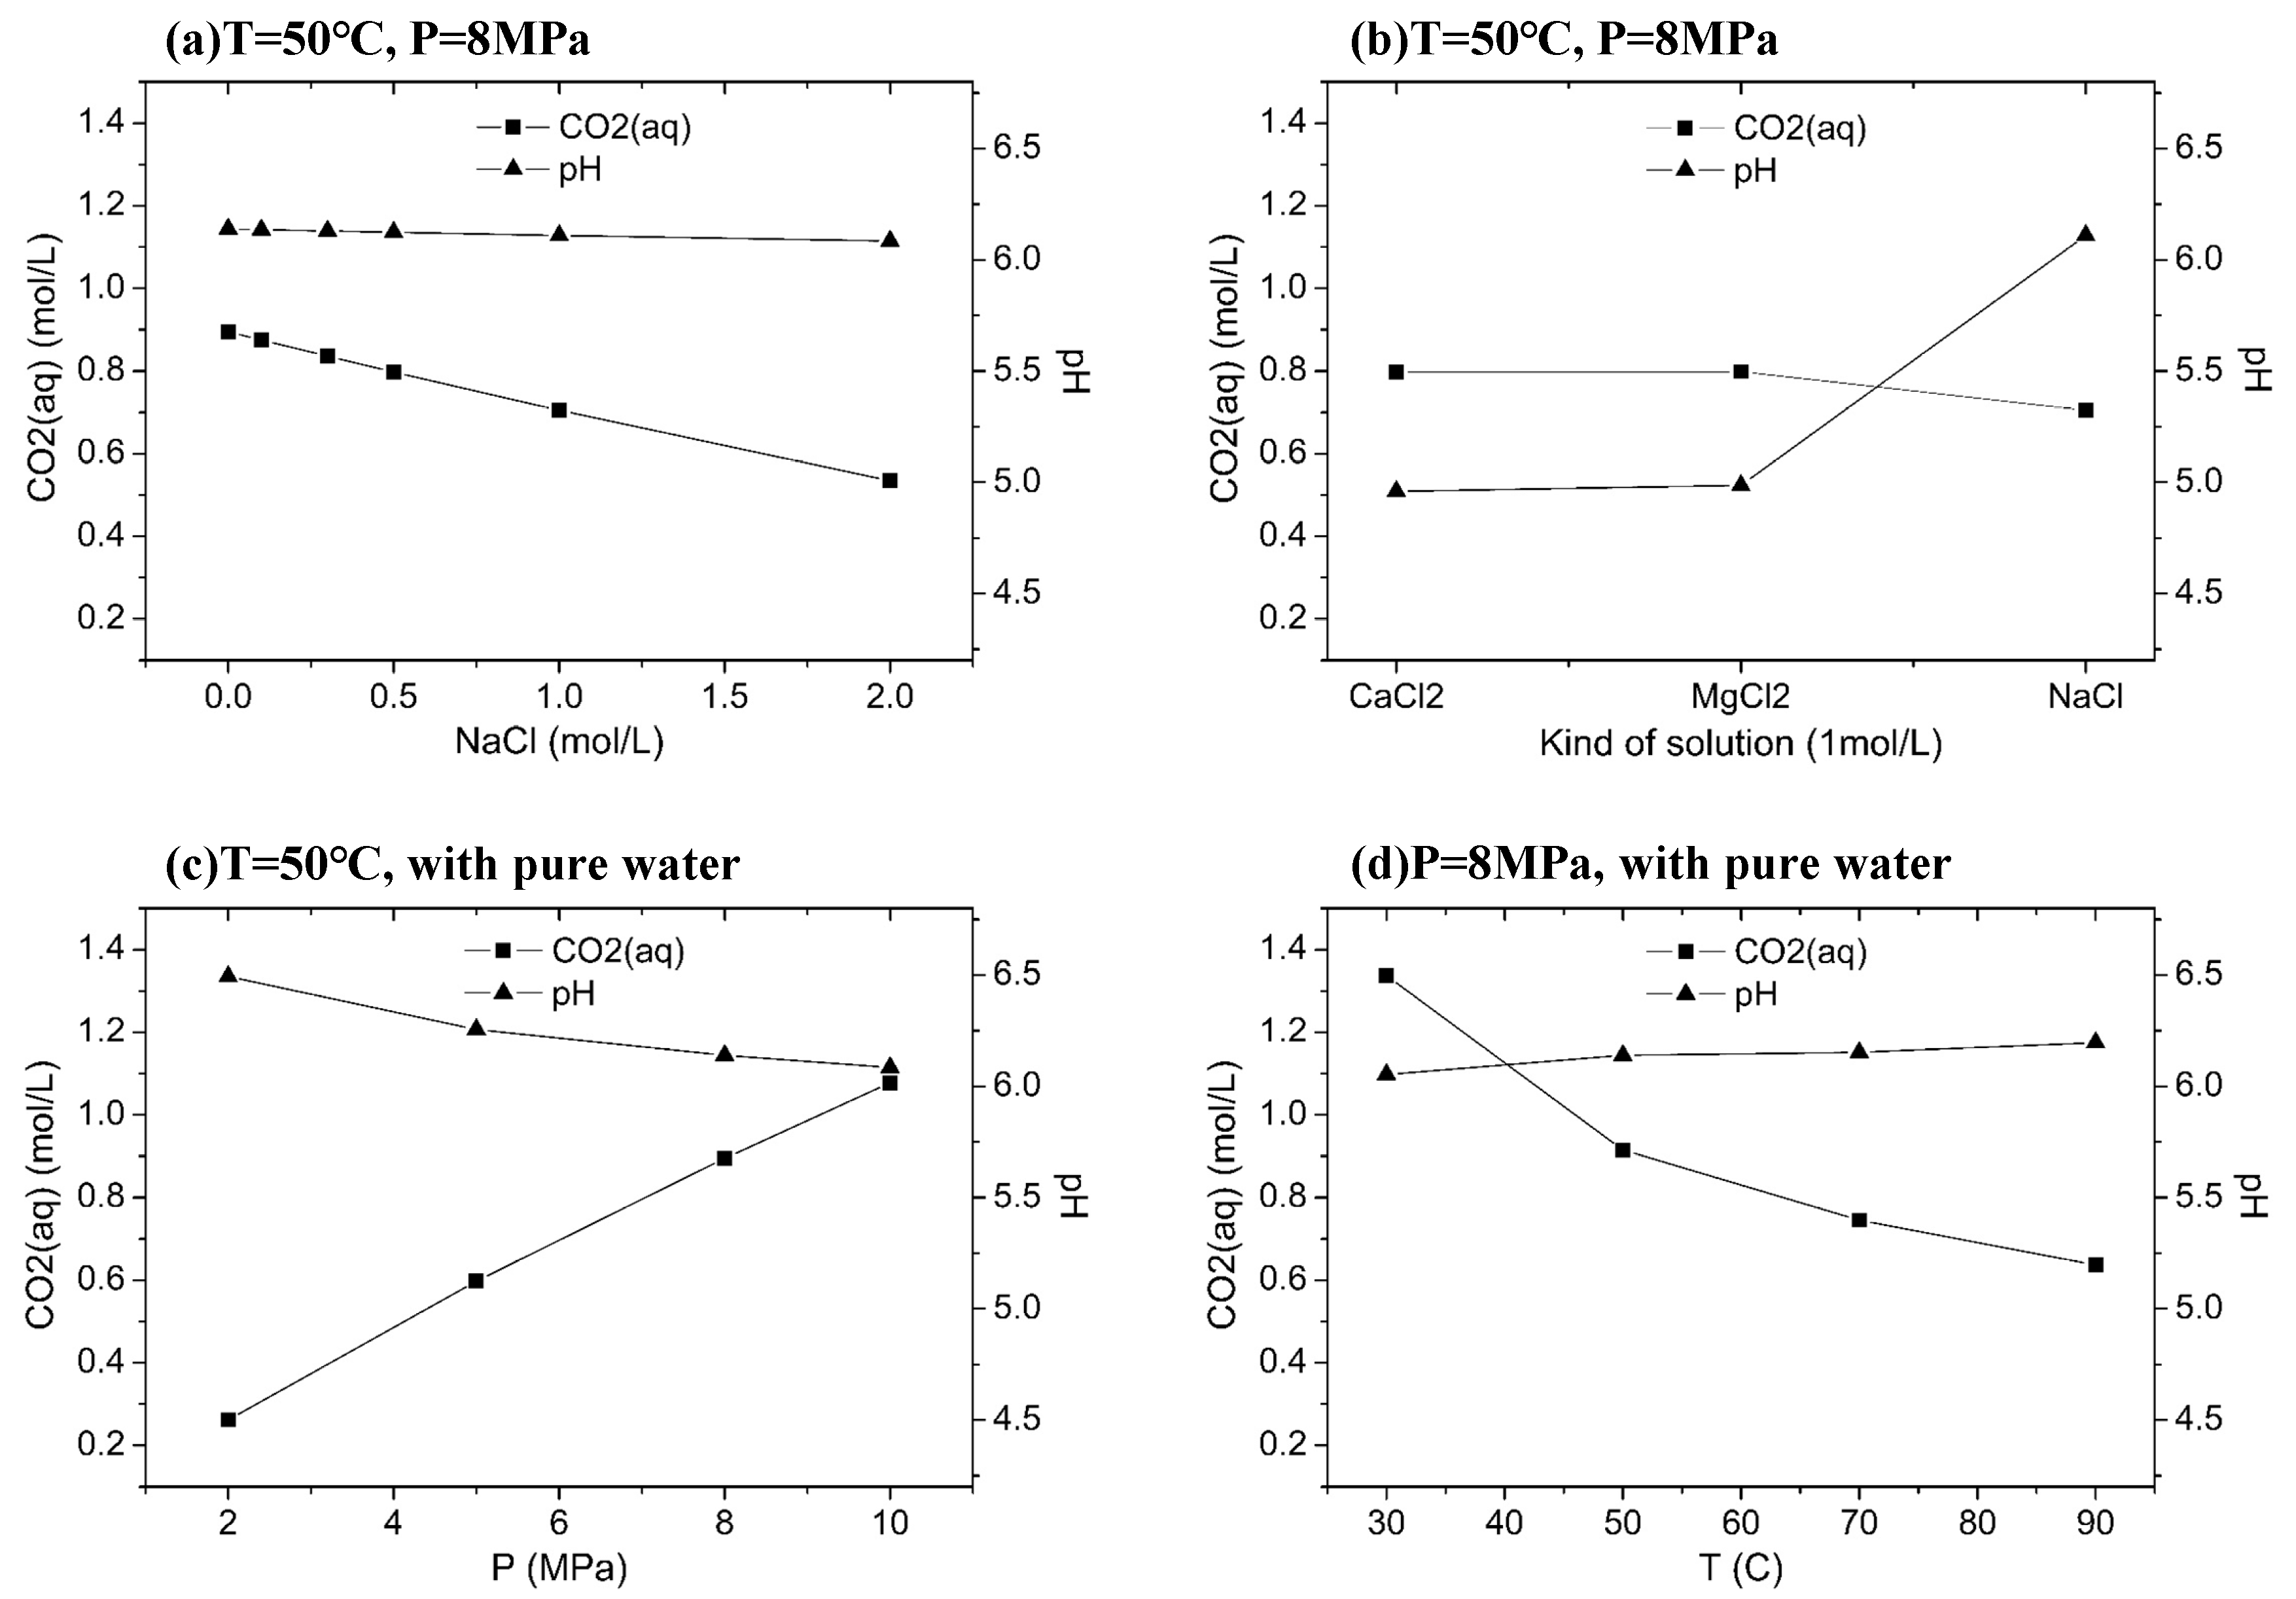
The changes in the amount of CO2 dissolution and the pH with different temperature, pressure, and types and concentrations of solutions are shown in Figure 8. The CO2 dissolution amount decreased from 0.89 mol/L in pure water to 0.53 mol/L in a 2.0 mol/L NaCl solution, and the pH varied slightly from 6.08 with pure water to 6.14 in the 2.0 mol/L NaCl solution at 50 °C, 8 MPa. The CO2 dissolution amount was 0.53–0.89 mol/L, and the pH was 6.08–6.14 at 50 °C, 8 Mpa, with NaCl concentrations ranging from 0–2.0 mol/L (Figure 8a). The CO2 dissolution amount was 0.70 mol/L in the NaCl solution of 1 mol/L, which was smaller than 0.80 mol/L in the CaCl2 and MgCl2 solutions, and the pH was 6.11 in a 1 mol/L NaCl solution, which was larger than 4.96 in the CaCl2 solution and 4.99 in the MgCl2 solution (Figure 8b). The CO2 dissolution amount increased from 0.26 mol/L at 2 MPa to 1.08 mol/L at 10 MPa, and the pH decreased from 6.08 at 2 MPa to 6.49 at 10 MPa in pure water at 50 °C (Figure 8c). The CO2 dissolution amount enhanced from 0.64 mol/L at 30 °C to 1.34 mol/L at 90 °C, and the pH changed from 6.05 at 30 °C to 6.20 at 90 °C in pure water at 8 MPa (Figure 8d).
After the interaction among CO2, sandstone and water (or solution), the concentration of ions in the liquid phase with different temperatures, pressures, and types and concentrations of solutions are shown in Figure 9. The concentrations of HCO3−, K+, and Na+ changed significantly in the solution throughout the simulation by PHREEQC. Pressure and temperature mainly affected the concentrations of HCO3− and K+. The concentration of HCO3− and K+ increased with increasing pressure and clearly decreased with increasing temperature. The concentration of NaCl slightly affected the concentrations of HCO3−, K+, Na+, and Cl−. With increasing NaCl concentrations, the concentration of K+ and Cl− increased, HCO3− decreased, and Na+ decreased at first and then increased later. The types of solutions mainly affected the concentrations of Ca2+, Mg2+, and HCO3−. In the CaCl2 and MgCl2 solutions, the concentration of Ca2+ and Mg2+ in solution after the reaction was smaller than in the initial solution. The concentration of HCO3− in the NaCl solution was larger than in the CaCl2 and MgCl2 solution.
3.2. Dynamic Simulation by TOUGHREACT
TOUGHREACT (ECO2N module) was used to analyze the dynamic interaction among CO2, sandstone and pure water at a pressure of 8 MPa and temperature of 50 °C. As shown in Figure 10, calcite dissolved at the beginning, and the amount of calcite dissolution decreased gradually before 0.1 year, then stayed nearly constant, and finally increased after 1000 years. Dolomite dissolved gradually after the CO2–brine–rock interaction, and the amount of dolomite dissolution remained constant after 0.1 year. Other minerals began to dissolve or precipitate after 100 years. The dissolved minerals were mainly albite, kaolinite, K-feldspar, and chlorite. The precipitated minerals were Ca-montmorillonite, illite, and quartz. The content of anhydrite and pyrite did not change during the simulation period.
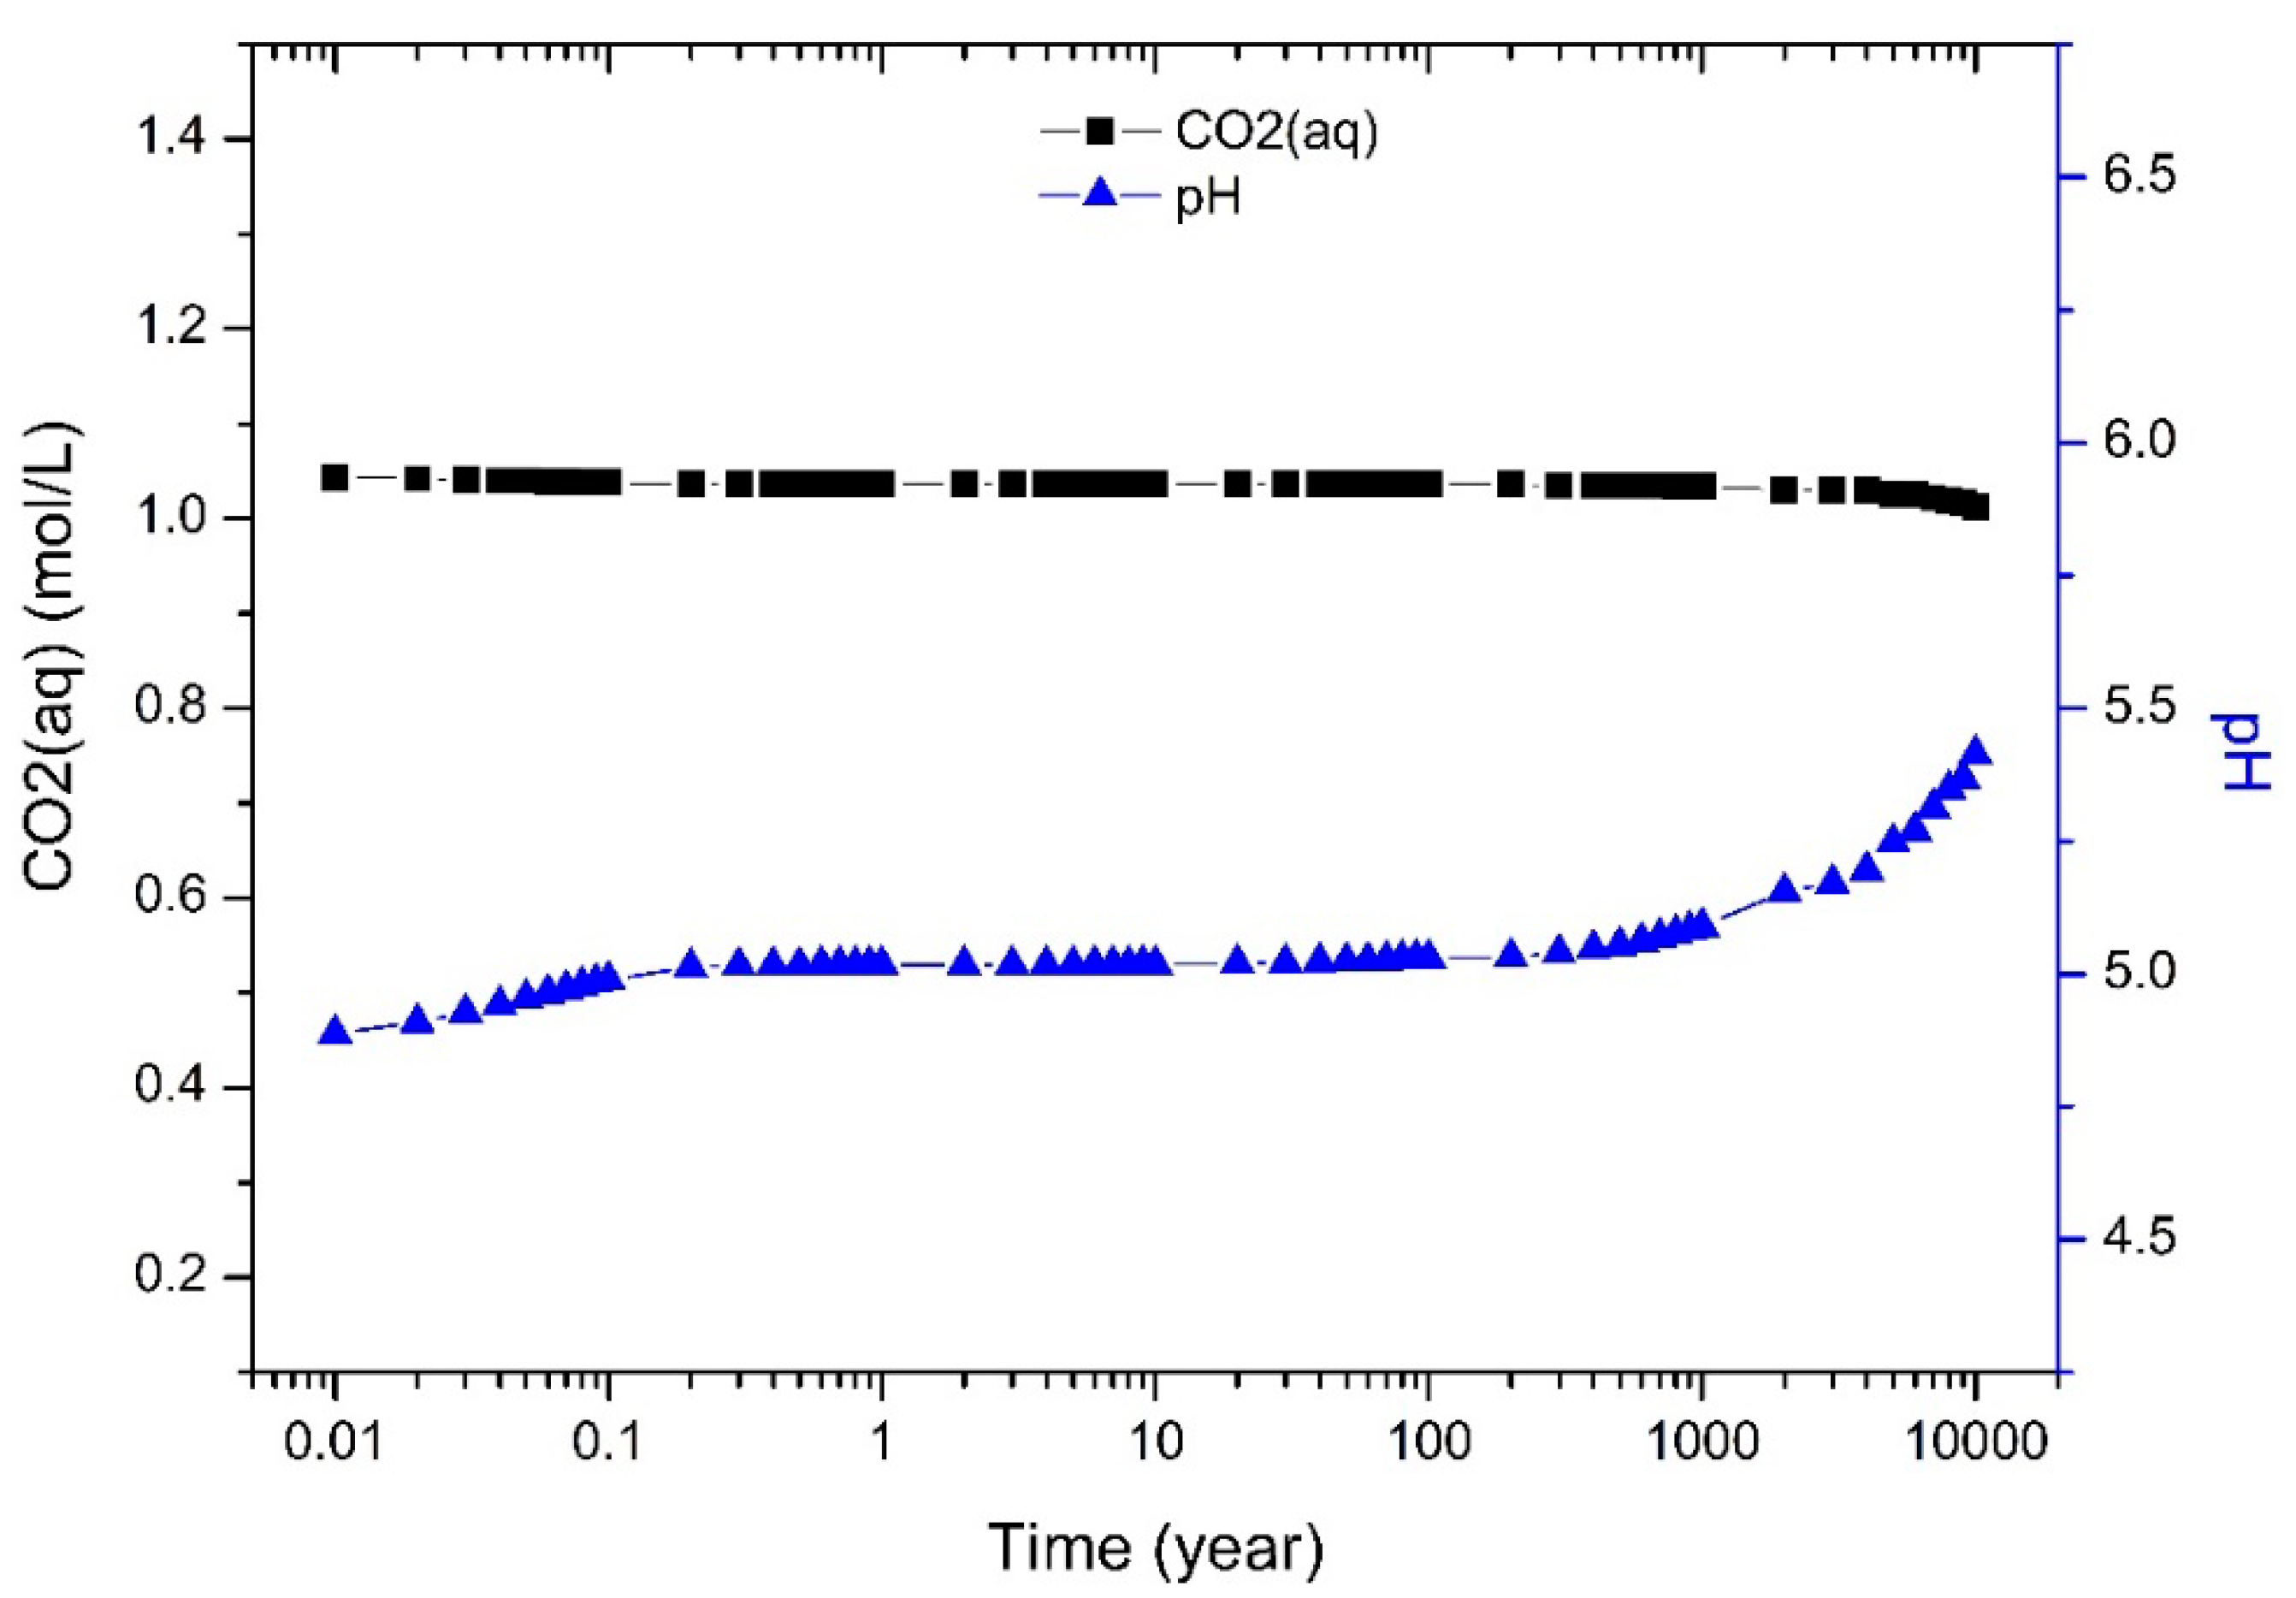
The CO2 dissolution amounts and pH of the solutions during the simulation period are shown in Figure 11. The CO2 dissolution amount was approximately 1.05 mol/L in the early simulation period and slightly decreasing after 1000 years. The pH decreased from 7 to 4.9 immediately at the beginning of the simulation, followed by a gradual pH increase to 5 at approximately 0.1 year, and then it changed little until 100 years, after which the pH increased again and was up to 5.4 at the end of the 10,000 year simulation period.
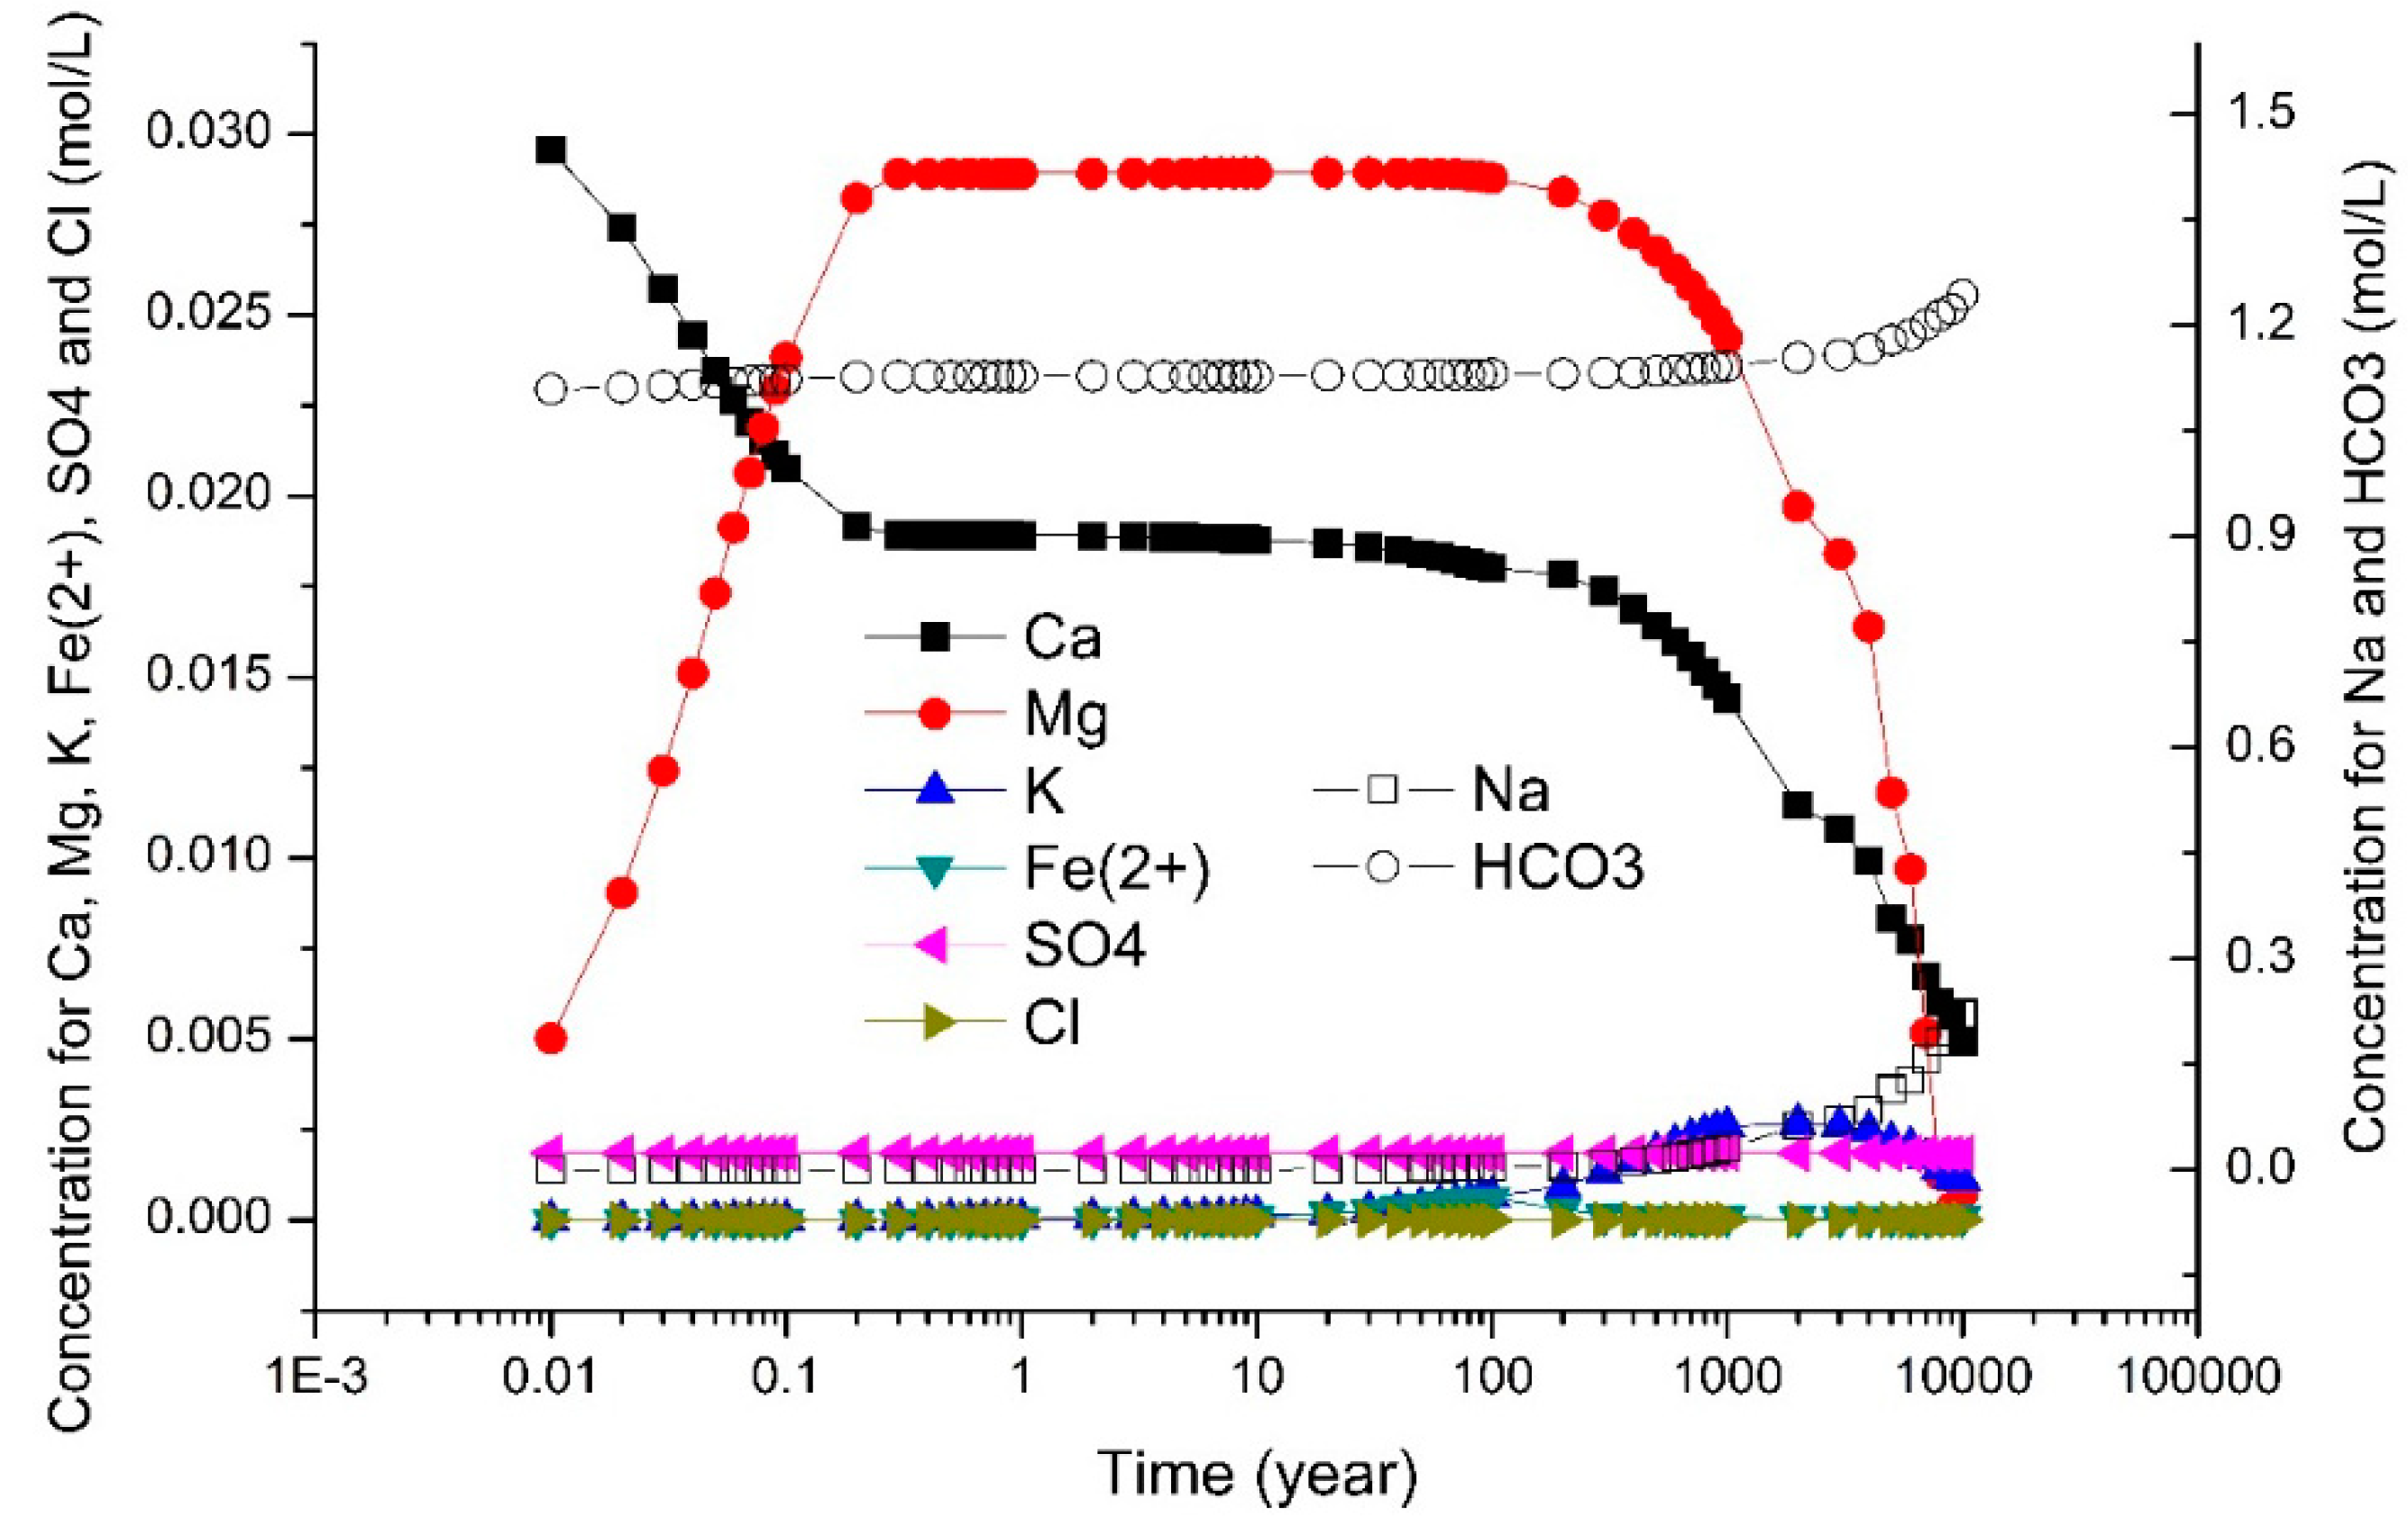
The primary ions in the solution after the interaction among CO2, sandstone and brine were HCO3−, Na+, Mg2+, Ca2+, SO42−, and K+ (as shown in Figure 12). The concentration of HCO3− was 1.13 mol/L at the beginning of the simulation increasing gradually after 1000 years. The concentration of Na+ was low before 100 years and increased up to 0.22 mol/L. The concentration of Mg2+ increased from 0.05 mol/L to 0.029 mol/L before 0.3 years, then remained unchanged until 100 years, and finally decreased in the late period of the simulation. The concentration of Ca2+ decreased from a high concentration of 0.03 mol/L in the initial simulation to the concentration of 0.01893 mol/L at 0.3 years, and then it decreased slightly from 1 year to 100 years, and finally decreased quickly to a low concentration of 0.0492 mol/L at 10000 years. The concentration of SO42− was always 0.00184 mol/L during the simulation period. K+ was nearly absent before 10 years, and the concentration of K+ gradually increased to 0.00267 mol/L at 2000 years and then decreased to 0.00109 mol/L at 10,000 years. The concentrations of Fe2+ and Cl− were very low throughout the simulation period.
4. Discussion
4.1. CO2 Dissolution and pH
The dissolution of CO2 in solution was affected by temperature, pressure, the type of solution, and the solution salinity. CO2 dissolution increased with the rise in pressure and decreased with increasing temperature and solute concentration. There is a negative correlation between the solution pH and the CO2 dissolution in general. When CO2 dissolved in the solution, carbonic acid formed, as shown in Formula (1). Then, the carbonic acid in the solution was further decomposed into hydrogen and bicarbonate, as shown in Formula (2). Therefore, the more CO2 dissolved in the solution, the more hydrogen ions formed, leading to the decrease of the solution pH:
4.2. Minerals Dissolution and Precipitation
The dissolution and precipitation of minerals was mainly affected by the CO2 dissolution and the pH. As discussed above, the CO2 dissolution amount was large and the pH was low under high pressure and low temperature conditions, which could promote the interaction between solution and rock. As shown in Figure 7, the amount of K-feldspar dissolution and the amount of precipitation of kaolinite and quartz was large under high pressure and low temperature conditions. At the same time, the pH was larger and the amount of K-feldspar, kaolinite, and quartz dissolution or precipitation in the NaCl solution was smaller than in MgCl2 and CaCl2 solutions. In addition, the pH decreased slightly with increasing NaCl concentrations and the amount of K-feldspar, kaolinite, and quartz dissolution or precipitation increased to a small extent.
The results of the dynamic simulation showed that calcite and dolomite dissolution occurred only at the beginning of the simulation. The quick dissolution of calcite can be confirmed with the SEM images of the sandstone, which show that calcite dissolved after the interaction of CO2, water, and rock for 72 h, leaving some holes in the rock surface. However, the dissolution and precipitation of other minerals occurred hundreds of years after the CO2–water–rock interaction (as shown in Figure 10a), which was indicated by the dynamic simulations and could not be observed in a short-time lab experiment. As shown in Figure 10b, the reaction rate of each mineral dissolution or precipitation kept at a constant after 4000 years. The dissolution rate of annual change in volume fraction for each mineral from high to low was albite of 4.02 × 10⁻⁷, kaolinite of 1.73 × 10⁻⁷, K-feldspar of 1.34 × 10⁻⁷, chlorite of 8.68 × 10⁻⁸, and calcite 4.23 × 10⁻⁸, and the precipitation rate of annual change in volume fraction for each mineral from high to low was Ca-Montmorillonite of 3.50 × 10⁻⁷, illite of 2.95 × 10⁻⁷, and quartz of 5.84 × 10⁻⁸.
The simulation results of PHREEQC and TOUGHREACT both showed that albite, anhydrite, calcite, K-feldspar, and chlorite dissolved, while quartz precipitated and pyrite changed little. However, there were also some differences in the simulation results between PHREEQC and TOUGHREACT. Ca-Montmorillonite and illite dissolved in the PHREEQC results, but precipitated in TOUGHREACT results. Additionally, dolomite and kaolinite precipitated in PHREEQC but dissolved in TOUGHREACT. The differences in the simulation results between PHREEQC and TOUGHREACT can be explained by the fact that the results of PHREEQC reflect the final equilibrium of the CO2–brine–rock interaction and the results of TOUGHREACT show the dynamic processes of the interaction. In addition, PHREEQC has the limitations of not considering complex ion exchange models and uncertainties in thermodynamic constants, and thus simplifies the assumptions [46,47]. These limitations may be another reason caused the differences.
4.3. Main Ions in Solution
In this experiment, Ca2+ and HCO3− were the main ions after the interaction of CO2, brine, and rock. Ca2+ was formed due to the dissolution of calcium-bearing minerals (as shown in Formula (3)). As discussed above, while calcite dissolution occurred quickly and was observed in SEM images, the dissolution of other minerals should take a long time. HCO3− mainly came from two reactions: one was the decomposition of H2CO3 (as shown in Formula (2)), and the other was the combination of H− and CO32− coming from the dissolution of calcite (Formula (3)):
With increased time of interaction among the CO2, water, and rock, the concentration of other ions in solution changed due to the dissolution or precipitation of minerals. K+ and Na+ were produced from the dissolution of K-feldspar and albite after hundreds of years of the interaction of CO2, water and rock simulated by TOUGHREACT. The concentrations of K+ and Na+ reached relatively large values when the CO2–brine–rock interaction was balanced, as simulated by PHREEQC. Mg2+ was detected in the experiment, and the concentration of Mg2+ increased in the early period simulated by TOUGHREACT, which may have come from the dissolution of dolomite. However, the concentration of Mg2+ decreased in the late period simulated by TOUGHREACT, which indicates that the rate of Mg2+ consumption due to Ca-montmorillonite precipitation was larger than the rate of Mg2+ generation because of dolomite dissolution. This is consistent with the results of PHREEQC, which showed that there was no Mg2+ in the solution, indicating that the precipitation of dolomite consumed all of the Mg2+ coming from the dissolution of Ca-montmorillonite.
5. Conclusions
This paper provides a method to study the hydrogeochemical reactions among CO2, formation water, and a sandstone reservoir at various stages during the geological storage of CO2. The lab experiment directly investigated the characteristics of CO2–brine–rock interaction over a short time. TOUGHREACT predicted the interaction processes at different times over a long period, and PHREEQC forecasted the interaction of CO2–brine–rock in the final equilibrium state. The conclusions of this paper can be summarized as follows.
The changes of ion concentrations were clear due to the CO2–brine–rock interaction in the experiment after 72 h. The concentrations of HCO3− and Ca2+ increased significantly. The concentration of HCO3− in solution was mainly increased in two ways: (i) the decomposition of carbonic acid that was formed by CO2 dissolution, and (ii) the dissolution of calcite, which was further shown in the SEM images of the lithic sandstone after the experiment. The increase in Ca2+ concentration was mainly caused by calcite dissolution. Moreover, the precipitation of dawsonite possibly led to the large decrease in Na+. Because of the limited run time of the experiment, the change in concentration of other ions and the dissolution or precipitation of other minerals was not observed.
The amount of CO2 dissolution and the solution pH was affected by the temperatures, pressures, types of solution, and the solution concentrations in the models, which further influenced mineral dissolution and precipitation. The simulation results of PHREEQC and TOUGHREACT both showed that albite, anhydrite, calcite, K-feldspar, and chlorite dissolved, while quartz precipitated and pyrite changed little. Ca-montmorillonite and illite precipitated, and dolomite and kaolinite dissolved in the simulation period simulated by TOUGHREACT; however, Ca-montmorillonite and illite dissolved and dolomite and kaolinite precipitated in the final equilibrium interaction simulated by PHREEQC. In the simulation period, HCO3−, Na+, Ca2+, and Mg2+ were the primary ions in solution because of the CO2 dissolution and mineral dissolution and precipitation during the CO2–brine–rock interaction. It would be helpful to further understand the CO2 mineralization process to securely store CO2 in deep saline aquifers.
Author Contributions
Conceptualization, B.L.; Formal Analysis, B.L. and J.X.; Investigation, F.Z., J.X., and Y.Q.; Methodology, B.L. and J.X.; Resources, F.Z.; Software, B.L.; Validation, F.Z.; Visualization, Y.Q.; Writing—Original Draft, B.L.; Writing—Review & Editing, Y.Q.
Funding
This work was supported by the Fundamental Research Funds for the Central Universities (No. 2014QNB49) and the National Natural Science Foundation of China (No. 41702257).
Conflicts of Interest
The authors declare no conflicts of interest. The funders had no role in the design of the study; in the collection, analyses, or interpretation of data; in the writing of the manuscript, and in the decision to publish the results.
References
- Wang, K.; Xu, T.; Wang, F.; Tian, H. Experimental study of CO2-brine-rock interaction during CO2 sequestration in deep coal seams. Int. J. Coal Geol. 2016, 154, 265–274. [Google Scholar] [CrossRef]
- Allen, M.R.; Stott, P.A.; Mitchell, J.F.B.; Schnur, R.; Dehworth, T.L. Quantifying the uncertainty in forecasts of anthropogenic climate change. Nature 2000, 407, 617. [Google Scholar] [CrossRef] [PubMed]
- Palmer, T.N.; Räisänen, J. Quantifying the risk of extreme seasonal precipitation events in a changing climate. Nature 2002, 415, 512–514. [Google Scholar] [CrossRef] [PubMed]
- Stocker, T.F.; Schmittner, A. Influence of CO2 emission rates on the stability of the thermohaline circulation. Nature 1997, 388, 862–865. [Google Scholar] [CrossRef]
- Bradshaw, J.; Bachu, S.; Bonijoly, D.; Burruss, R.; Holloway, S.; Christensen, N.P.; Mathiassen, O.M. CO2 storage capacity estimation: Issues and development of standards. Int. J. Greenh. Gas Control 2007, 1, 62–68. [Google Scholar] [CrossRef]
- Du, S.; Su, X.; Xu, W. Assessment of CO2 geological storage capacity in the oilfields of the Songliao Basin, northeastern China. Geosci. J. 2016, 20, 247–257. [Google Scholar] [CrossRef]
- Khudaida, K.J. Geological Carbon Sequestration in the Context of Two-Phase Flow in Porous Media: A Review. Crit. Rev. Environ. Sci. Technol. 2015, 45, 1105–1147. [Google Scholar]
- Bachu, S. Sequestration of CO2 in geological media: Criteria and approach for site selection in response to climate change. Energy Convers. Manag. 2000, 41, 953–970. [Google Scholar] [CrossRef]
- Bachu, S. CO2 storage in geological media: Role, means, status and barriers to deployment. Prog. Energy Combust. Sci. 2008, 34, 254–273. [Google Scholar] [CrossRef]
- Bachu, S.; Adams, J.J. Sequestration of CO2 in geological media in response to climate change: Capacity of deep saline aquifers to sequester CO2 in solution. Energy Convers Manag. Energy Convers. Manag. 2003, 44, 3151–3175. [Google Scholar] [CrossRef]
- Zahid, U.; Lim, Y.; Jung, J.; Han, C. CO2 geological storage: A review on present and future prospects. Korean J. Chem. Eng. 2011, 28, 674–685. [Google Scholar] [CrossRef]
- Zheng, F.; Shi, X.Q.; Wu, J.C.; Chen, Y.; Xu, H.X. Global Sensitivity Analysis of Reactive Transport Modeling of CO2 Geological Storage in a Saline Aquifer. Procedia Earth Planet. Sci. 2013, 7, 798–801. [Google Scholar] [CrossRef]
- Xu, T.; Apps, J.A.; Pruess, K. Mineral sequestration of carbon dioxide in a sandstone–shale system. Chem. Geol. 2005, 217, 295–318. [Google Scholar] [CrossRef]
- Zhang, W.; Li, Y.; Xu, T.; Cheng, H.; Zheng, Y.; Xiong, P. Long-term Variations of CO2 Trapped in Different Mechanisms in Deep Saline Formations: A Case Study of the Songliao Basin, China. Int. J. Greenh. Gas Control 2009, 3, 161–180. [Google Scholar] [CrossRef]
- Maroto-Valer, M.M.; Garcia, S.; Kaminska, A. Underground carbon dioxide storage in saline formations. Waste Resour. Manag. 2010, 163, 77–88. [Google Scholar]
- Steel, L.; Mackay, E.; Maroto-Valer, M.M. Experimental investigation of CO2-brine-calcite interactions under reservoir conditions. Fuel Process. Technol. 2018, 169, 122–131. [Google Scholar] [CrossRef]
- Benson, S.M.; Cole, D.R. CO2 Sequestration in Deep Sedimentary Formations. Elements 2008, 4, 325–331. [Google Scholar] [CrossRef]
- Kampman, N.; Bickle, M.; Wigley, M.; Dubacq, B. Fluid flow and CO2-fluid-mineral interactions during CO2-storage in sedimentary basins. Chem. Geol. 2014, 369, 22–50. [Google Scholar] [CrossRef]
- Liu, F.Y.; Lu, P.; Griffith, C.; Hedges, S.W.; Soong, Y.; Hellevang, H.; Zhu, C. CO2-brine-caprock interaction: Reactivity experiments on Eau Claire shale and a review of relevant literature. Int. J. Greenh. Gas Control 2012, 7, 153–167. [Google Scholar] [CrossRef]
- Maskell, A.; Kampman, N.; Chapman, H.; Condon, D.J.; Bickle, M. Kinetics of CO2-fluid-rock reactions in a basalt aquifer, Soda Springs, Idaho. Appl. Geochem. 2015, 61, 272–283. [Google Scholar] [CrossRef]
- Ostertag-Henning, C.; Risse, A.; Thomas, B.; Rosenbauer, R.; Rochelle, C.; Purser, G.; Kilpatrick, A.; Rosenqvist, J.; Yardley, B.; Karamalidis, A.; et al. GaMin’11-an international inter-laboratory comparison for geochemical CO2-saline fluid-mineral interaction experiments. In 12th International Conference on Greenhouse Gas Control Technologies, Ghgt-12, Austin; Dixon, T., Herzog, H., Twinning, S., Eds.; Elsevier: Amsterdam, The Netherlands, 2014; Volume 63, pp. 5538–5543. [Google Scholar]
- Pearce, J.K.; Kirste, D.M.; Dawson, G.K.W.; Farquhar, S.M.; Biddle, D.; Golding, S.D.; Rudolph, V. SO2 impurity impacts on experimental and simulated CO2-water-reservoir rock reactions at carbon storage conditions. Chem. Geol. 2015, 399, 65–86. [Google Scholar] [CrossRef]
- Tarkowski, R.; Wdowin, M.; Manecki, M. Petrophysical examination of CO2-brine-rock interactions-results of the first stage of long-term experiments in the potential Zaosie Anticline reservoir (central Poland) for CO2 storage. Environ. Monit. Assess. 2015, 187, 4215. [Google Scholar] [CrossRef] [PubMed]
- Waldmann, S.; Busch, A.; van Ojik, K.; Gaupp, R. Importance of mineral surface areas in Rotliegend sandstones for modeling CO2-water-rock interactions. Chem. Geol. 2014, 378, 89–109. [Google Scholar] [CrossRef]
- Zhao, D.F.; Liao, X.W.; Yin, D.D. An experimental study for the effect of CO2-brine-rock interaction on reservoir physical properties. J. Energy Inst. 2015, 88, 27–35. [Google Scholar] [CrossRef]
- Rathnaweera, T.D.; Ranjith, P.G.; Perera, M.S.A.; Ranathunga, A.S.; Wanniarachchi, W.A.M.; Yang, S.Q.; Lashin, A.; Arifi, N.A. An Experimental Investigation of Coupled Chemico-mineralogical and Mechanical Changes in Varyingly-cemented Sandstones upon CO2 Injection in Deep Saline Aquifer Environments. Energy 2017, 133, 404–414. [Google Scholar] [CrossRef]
- Wang, S.; Clarens, A.F. The effects of CO2-brine rheology on leakage processes in geologic carbon sequestration. Water Resour. Res. 2012, 48, 8518. [Google Scholar] [CrossRef]
- Liu, B.; Xu, J.; Li, Z.; Malekian, R.; Xu, Z. Modeling of CO2 transport and pressure buildup in reservoirs during CO2 storage in saline aquifers: A case in Dongying Depression in China. Environ. Earth Sci. 2018, 77, 158. [Google Scholar] [CrossRef]
- Rathnaweera, T.D.; Ranjith, P.G.; Perera, M.S.A.; Bandara, K.M.A.S.; Wanniarachchi, W.A.M.; Ranathunga, A.S. Investigation of relative flow characteristics of brine-saturated reservoir formation: A numerical study of the Hawkesbury formation. J. Nat. Gas Sci. Eng. 2017, 45, 609–624. [Google Scholar] [CrossRef]
- Emberley, S.; Hutcheon, I.; Shevalier, M.; Durocher, K.; Gunter, W.D.; Perkins, E.H. Geochemical monitoring of fluid-rock interaction and CO2 storage at the Weyburn CO2-injection enhanced oil recovery site, Saskatchewan, Canada. Energy 2004, 29, 1393–1401. [Google Scholar] [CrossRef]
- Duan, Z.; Sun, R. An improved model calculating CO2 solubility in pure water and aqueous NaCl solutions from 273 to 533 K and from 0 to 2000 bar. Chem. Geol. 2003, 193, 257–271. [Google Scholar] [CrossRef]
- Rosenbauer, R.J.; Koksalan, T. Experimental multi-phase CO2-brine-rock interactions at elevated temperature and pressure: Implications for CO2 sequestration in deep-saline aquifers. Abstr. Pap. Am. Chem. Soc. 2004, 227, U1098. [Google Scholar]
- Takenouchi, S.; Kennedy, G.C. The binary system H2O–CO2 at high temperatures and pressures. Am. J. Sci. 1964, 262, 1055–1074. [Google Scholar] [CrossRef]
- Xu, T.; Feng, G.; Shi, Y. On fluid–rock chemical interaction in CO2-based geothermal systems. J. Geochem. Explor. 2014, 144, 179–193. [Google Scholar] [CrossRef]
- Zhang, S.; Liu, H.H.; Dijke, M.I.J.V.; Geiger, S.; Agar, S.M. Constitutive Relations for Reactive Transport Modeling: Effects of Chemical Reactions on Multi-phase Flow Properties. Transp. Porous Media 2016, 114, 795–814. [Google Scholar] [CrossRef]
- Lasaga, A.C. Chemical Kinetics of Water-Rock Interaction. J. Geophys. Res. 1984, 89, 4009–4025. [Google Scholar] [CrossRef]
- Rosenbauer, R.J.; Koksalan, T.; Palandri, J.L. Experimental investigation of CO2-brine-rock interactions at elevated temperature and pressure: Implications for CO2 sequestration in deep-saline aquifers. Fuel Process. Technol. 2005, 86, 1581–1597. [Google Scholar] [CrossRef]
- Cui, G.; Zhang, L.; Tan, C.; Ren, S.; Zhuang, Y.; Enechukwu, C. Injection of supercritical CO2 for geothermal exploitation from sandstone and carbonate reservoirs: CO2-water-rock interactions and their effects. J. Co2 Util. 2017, 20, 113–128. [Google Scholar] [CrossRef]
- Gysi, A.P.; Stefansson, A. CO2-water-basalt interaction. Low temperature experiments and implications for CO2 sequestration into basalts. Geochim. Cosmochim. Acta 2012, 81, 129–152. [Google Scholar] [CrossRef]
- Gundogan, O.; Mackay, E.; Todd, A. Comparison of numerical codes for geochemical modelling of CO2 storage in target sandstone reservoirs. Chem. Eng. Res. Des. 2011, 89, 1805–1816. [Google Scholar] [CrossRef]
- Davila, G.; Luquot, L.; Soler, J.M.; Cama, J. Interaction between a fractured marl caprock and CO2-rich sulfate solution under supercritical CO2 conditions. Int. J. Greenh. Gas Control 2016, 48, 105–119. [Google Scholar] [CrossRef]
- Xu, T.; Spycher, N.; Sonnenthal, E.; Zhang, G.; Zheng, L.; Pruess, K. TOUGHREACT Version 2.0: A simulator for subsurface reactive transport under non-isothermal multiphase flow conditions. Comput. Geosci. 2011, 37, 763–774. [Google Scholar] [CrossRef] [Green Version]
- Tian, H.; Xu, T.; Wang, F.; Patil, V.V.; Sun, Y.; Yue, G. A numerical study of mineral alteration and self-sealing efficiency of a caprock for CO2 geological storage. Acta Geotech. 2014, 9, 87–100. [Google Scholar] [CrossRef]
- Andre, L.; Audigane, P.; Azaroual, M.; Menjoz, A. Numerical modeling of fluid-rock chemical interactions at the supercritical CO2-liquid interface during CO2 injection into a carbonate reservoir, the Dogger aquifer (Paris Basin, France). Energy Convers. Manag. 2007, 48, 1782–1797. [Google Scholar] [CrossRef]
- Labus, K.; Tarkowski, R.; Wdowin, M. Modeling gas-rock-water interactions in carbon dioxide storage capacity assessment: A case study of Jurassic sandstones in Poland. Int. J. Environ. Sci. Technol. 2015, 12, 2493–2502. [Google Scholar] [CrossRef]
- Liu, Q. Investigation of Mineral Trapping of Carbon Dioxide Sequestration in Brines. Ph.D. Thesis, University of Nottingham, Nottingham, UK, 2012. [Google Scholar]
- Merkel, B.J.; Planer-Friedrich, B.; Nordstrom, D.K. Groundwater Geochemistry: A Practical Guide to Modeling of Natural and Contaminated Aquatic Systems; Springer-Verlag Berlin Heidelberg: Berlin, Germany, 2008. [Google Scholar]
Figure 1.
Photo of the sandstone handsample and thin section image observed by electron microscope.
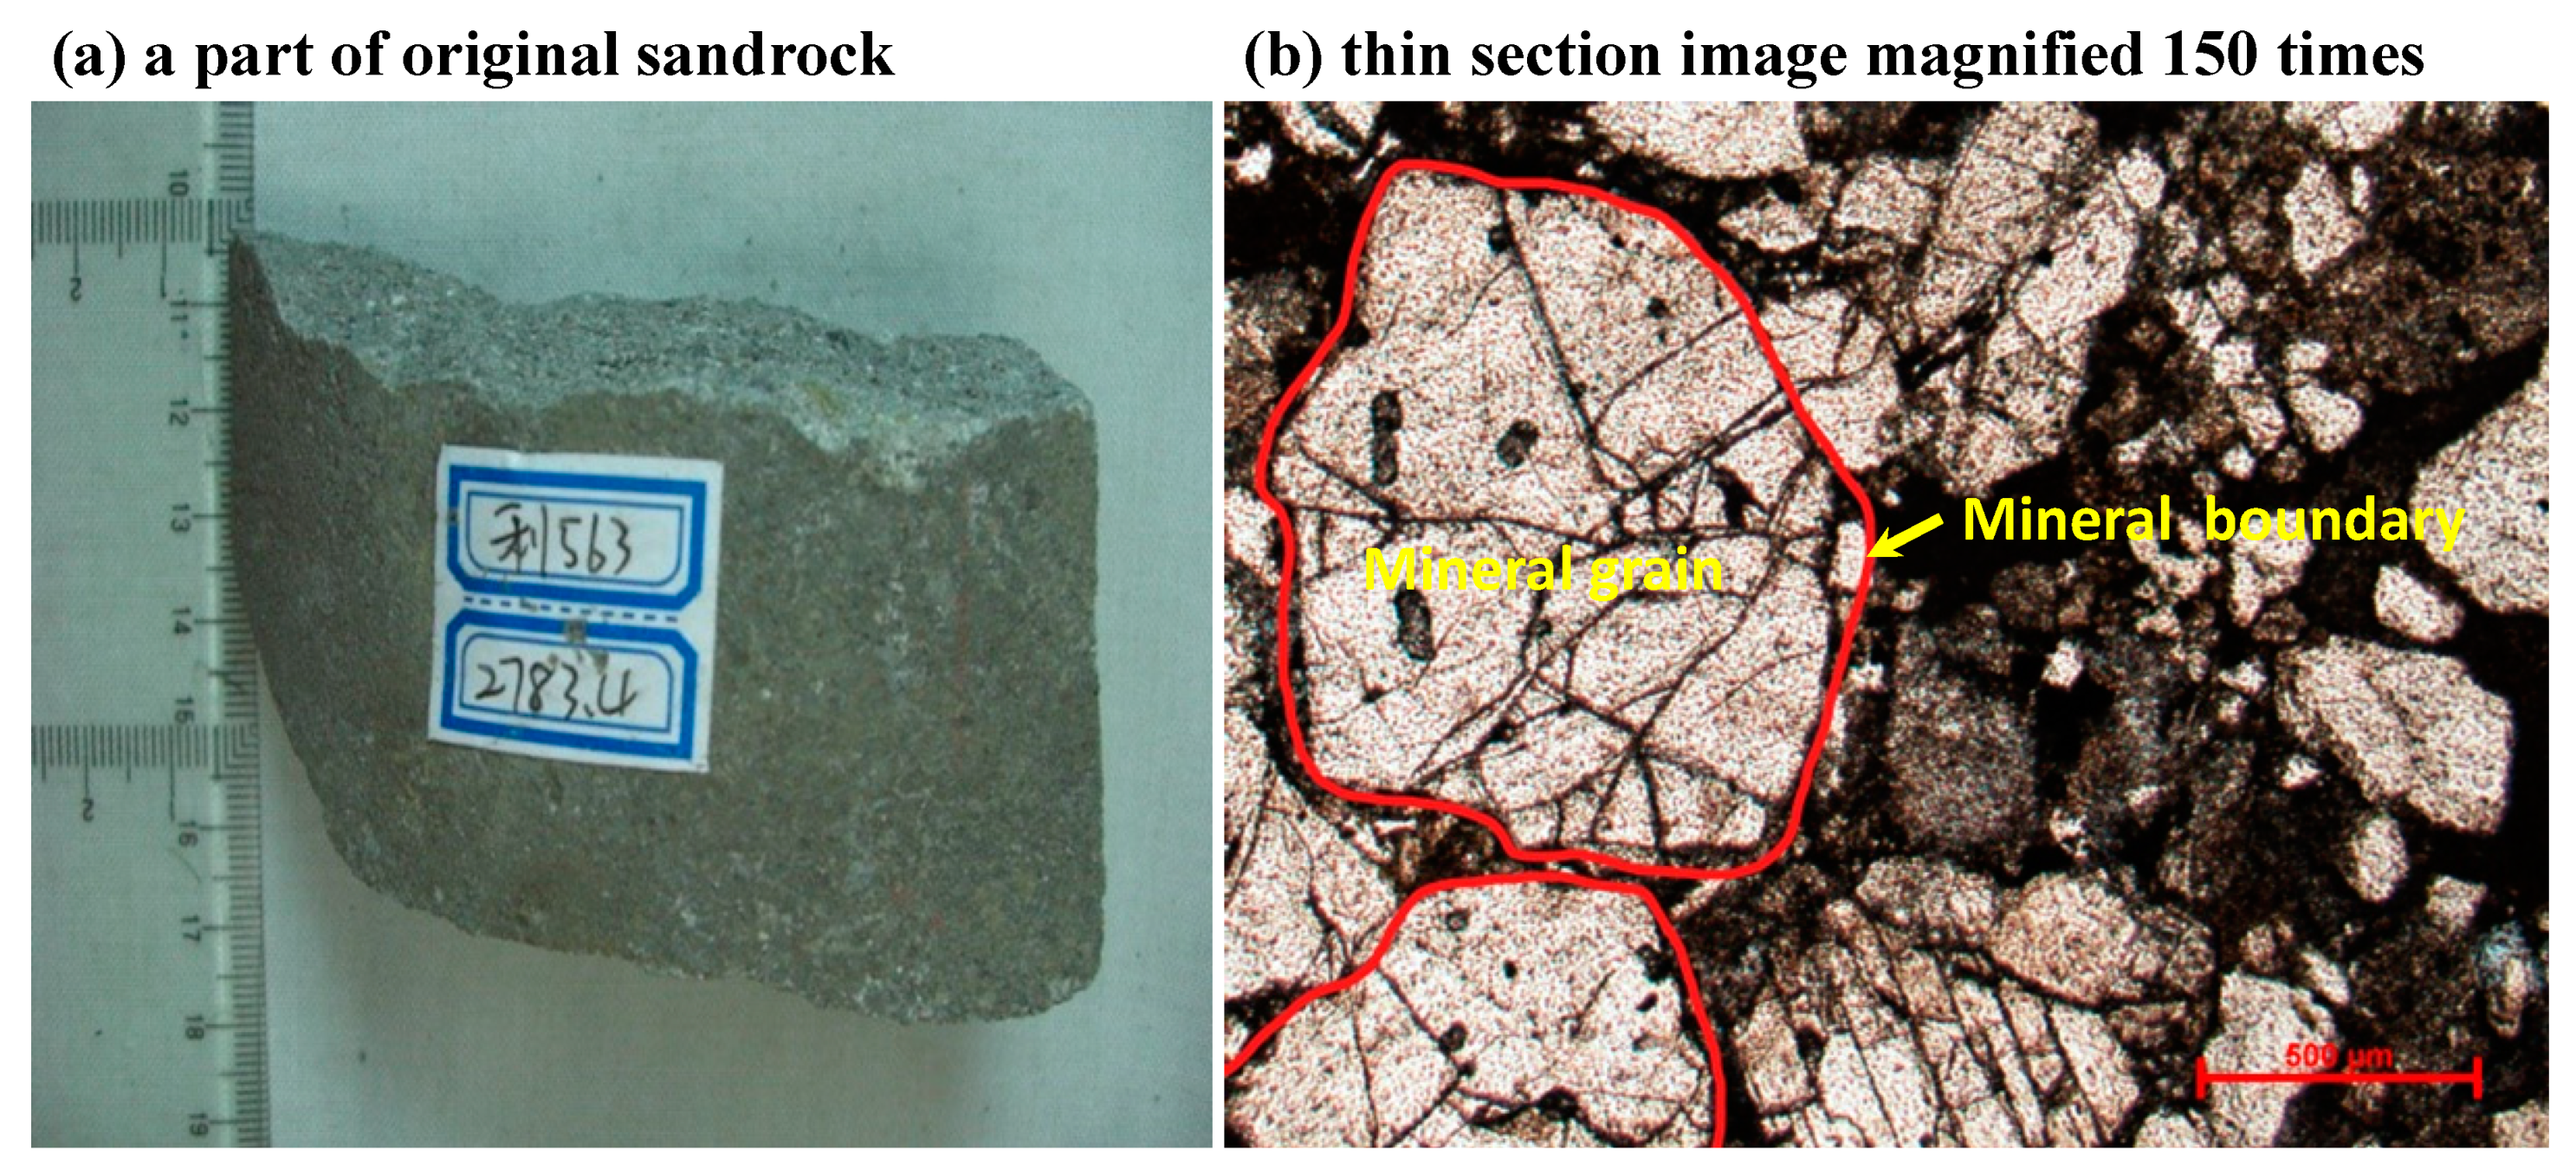
Figure 2.
Schematic diagram of the CO2–brine–rock interaction test system, with numbers corresponding to the following parts. (1) CO2 cylinder, (2) gas metering pump, (3) gas valve, (4) brine tank, (5) liquid metering pump, (6) liquid valve, (7) reactor container, (8) gauge, (9) thermometer, and (10) outlet.
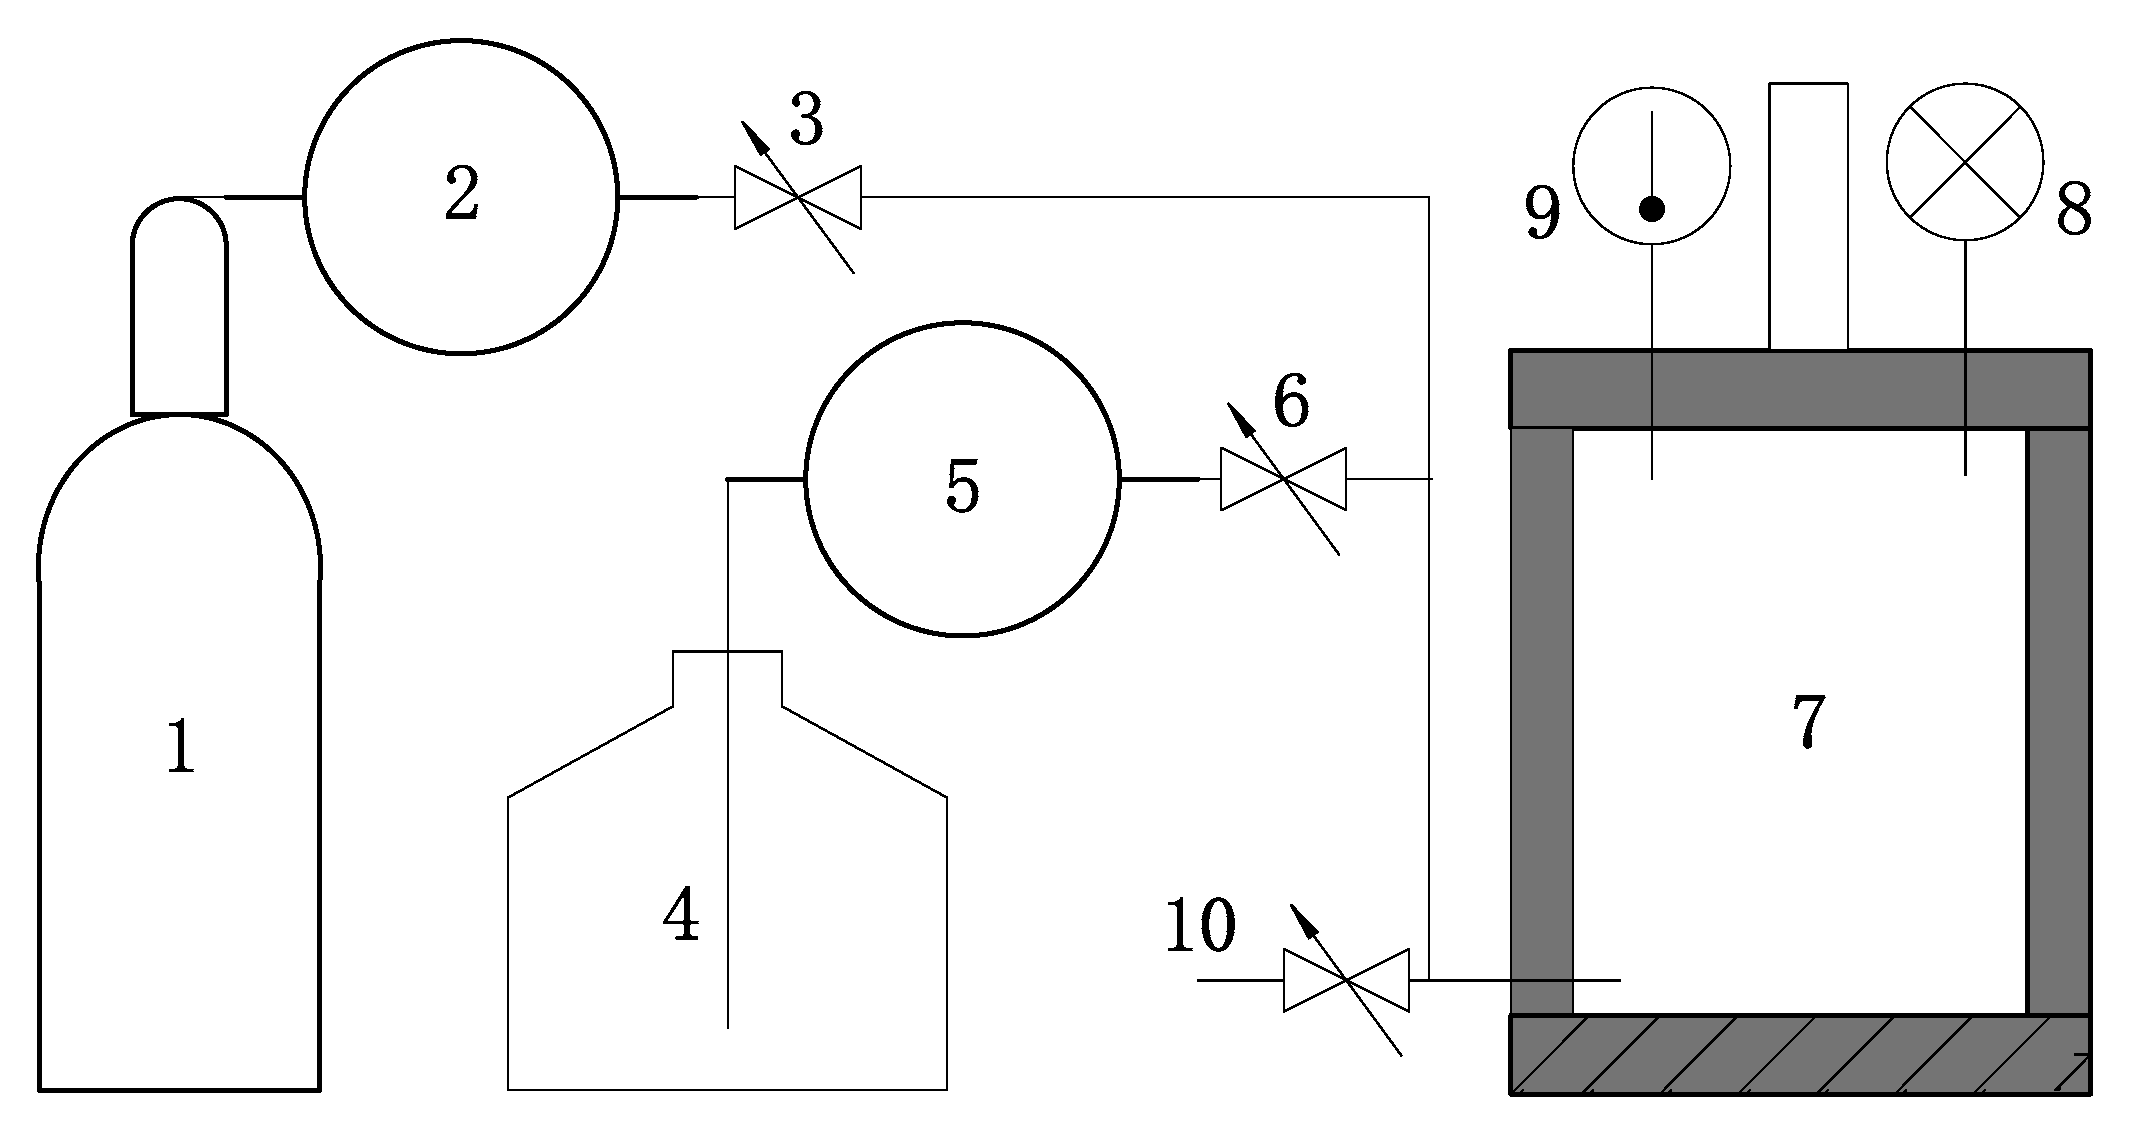
Figure 3.
Changes of main ion concentrations with experiment time during the CO2–brine–rock interaction, with an initial NaCl concentration of 0 mol/L; experiment pressure of 8 MPa and temperature of 50 °C.
Figure 3.
Changes of main ion concentrations with experiment time during the CO2–brine–rock interaction, with an initial NaCl concentration of 0 mol/L; experiment pressure of 8 MPa and temperature of 50 °C.
Figure 4.
Changes of main ion concentrations with different experimental pressures during the CO2–brine–rock interaction with an initial NaCl concentration of 0 mol/L; experiment temperature of 50 °C and time of 72 h.
Figure 4.
Changes of main ion concentrations with different experimental pressures during the CO2–brine–rock interaction with an initial NaCl concentration of 0 mol/L; experiment temperature of 50 °C and time of 72 h.
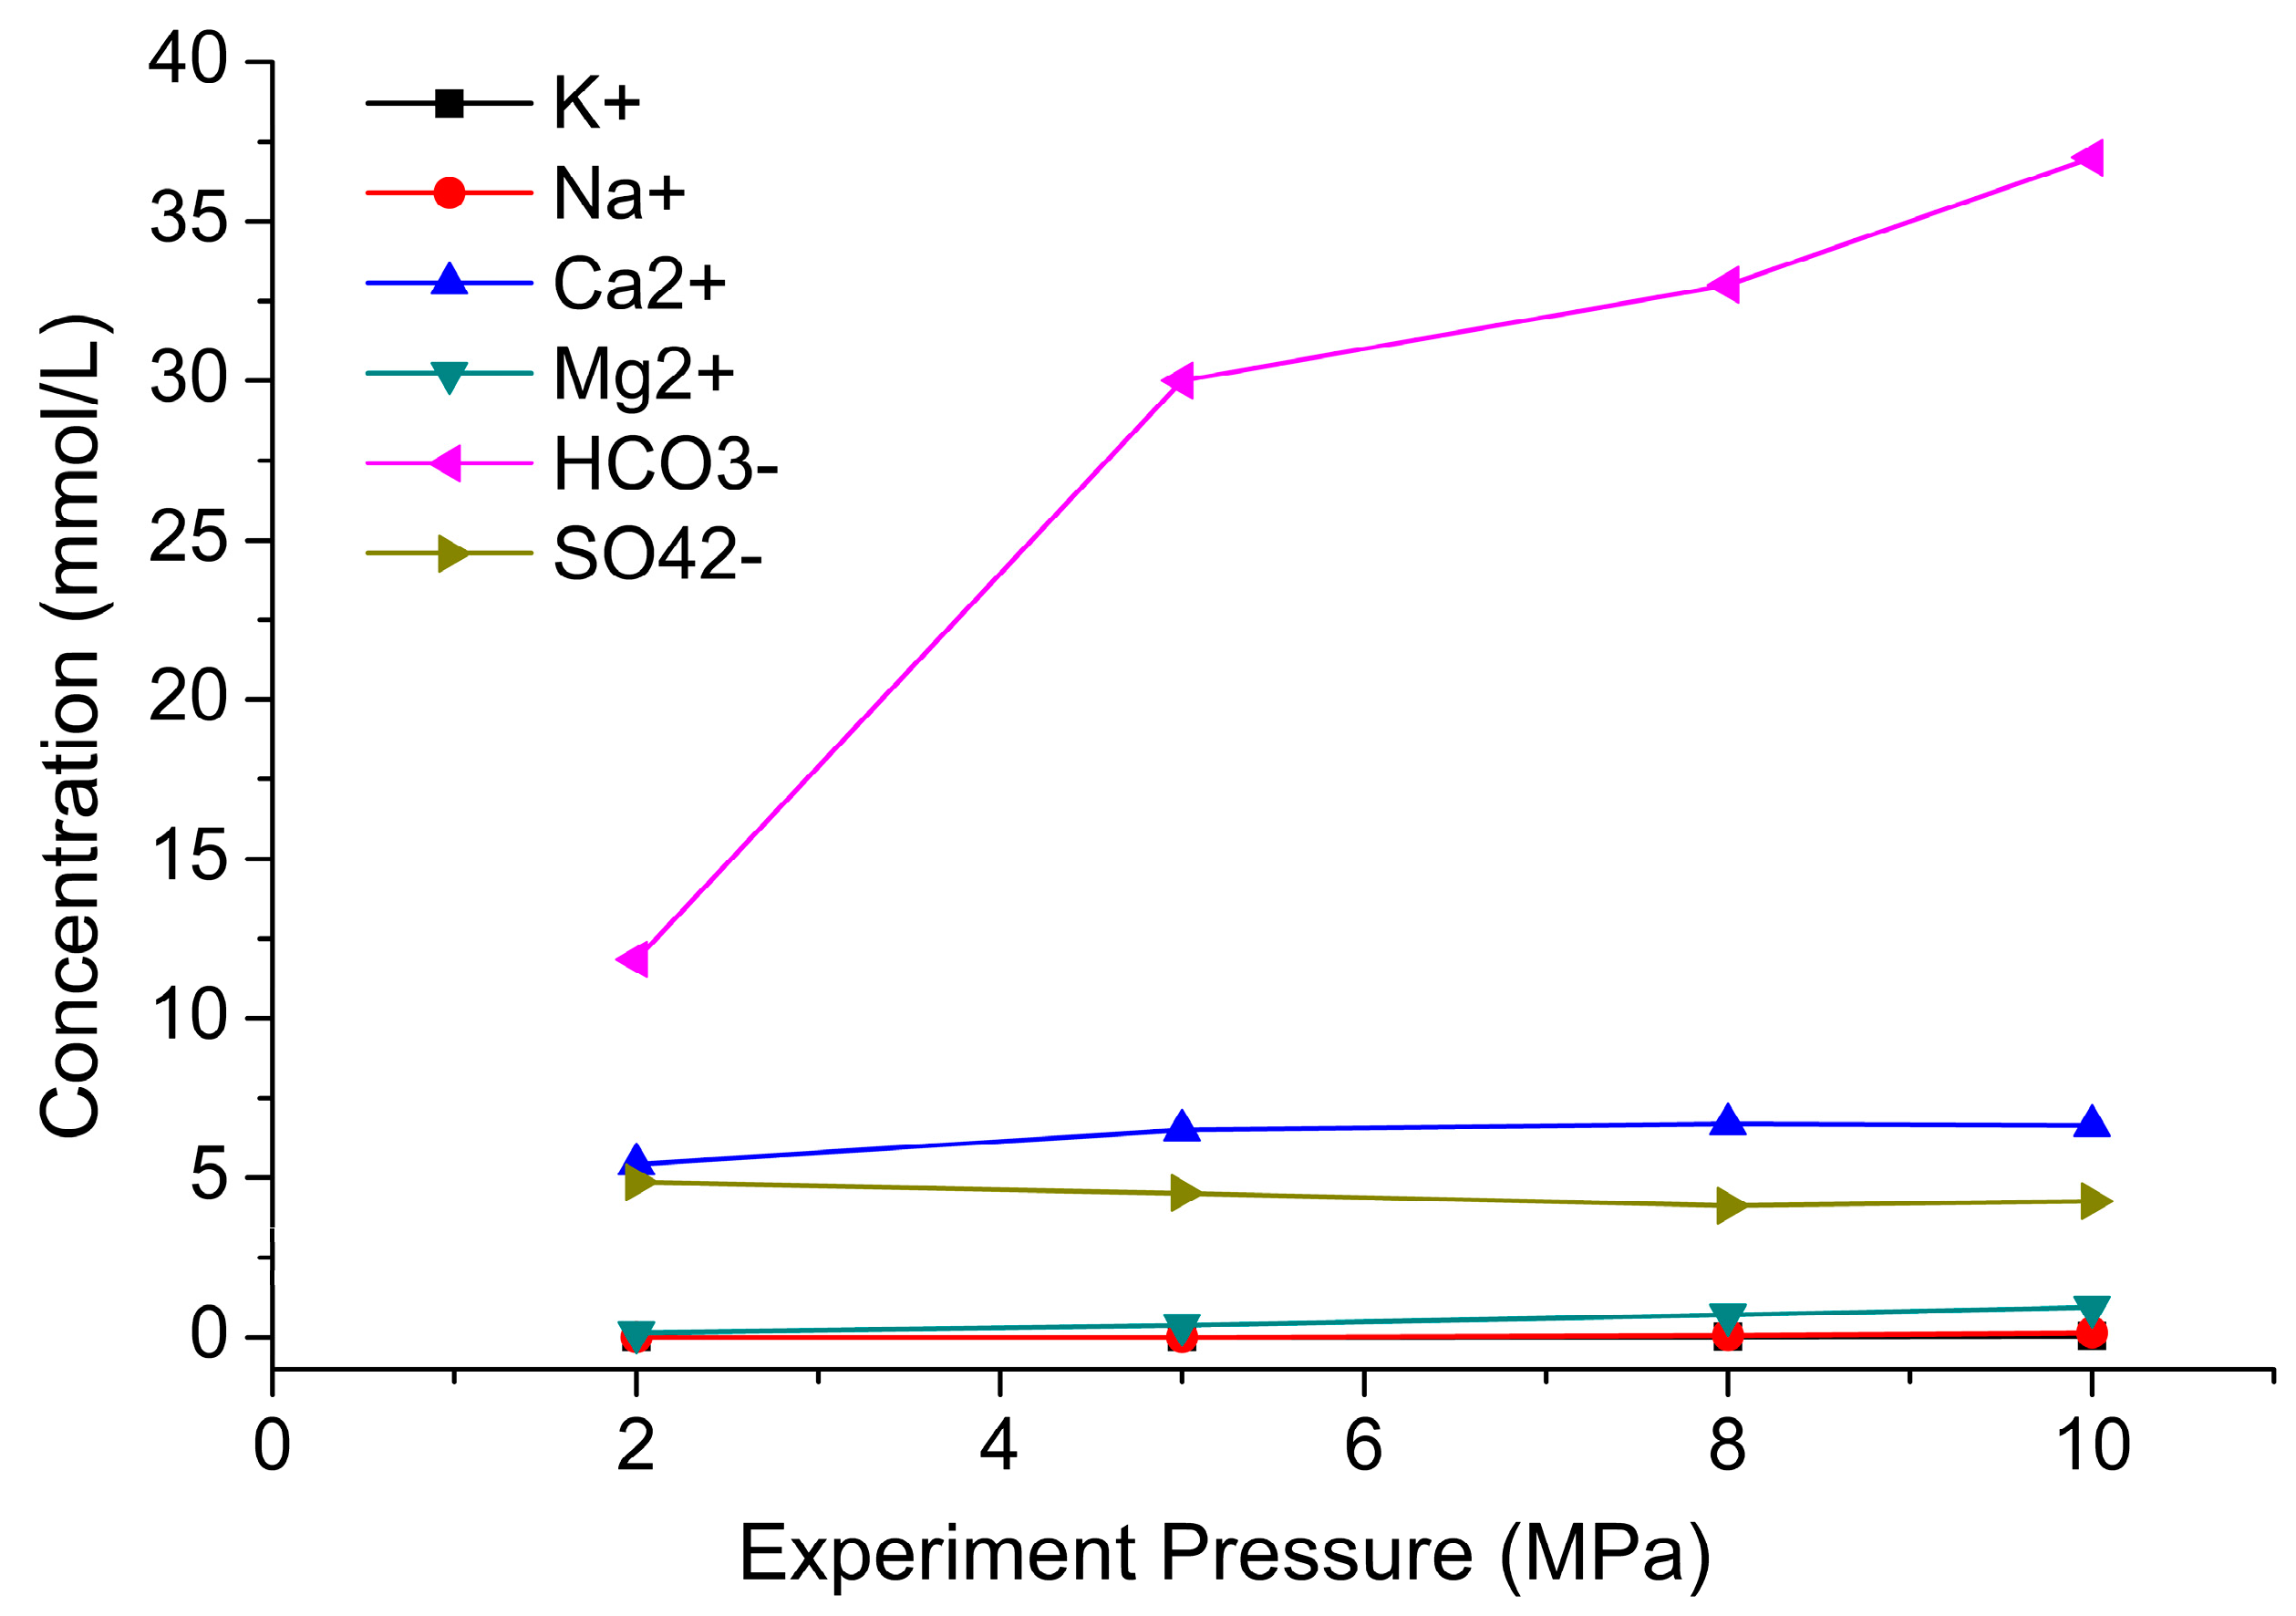
Figure 5.
Changes of main ion concentrations with different NaCl concentrations during the CO2–brine–rock interaction with an experiment pressure of 8 MPa, temperature of 50 °C, and time of 72 h.
Figure 5.
Changes of main ion concentrations with different NaCl concentrations during the CO2–brine–rock interaction with an experiment pressure of 8 MPa, temperature of 50 °C, and time of 72 h.
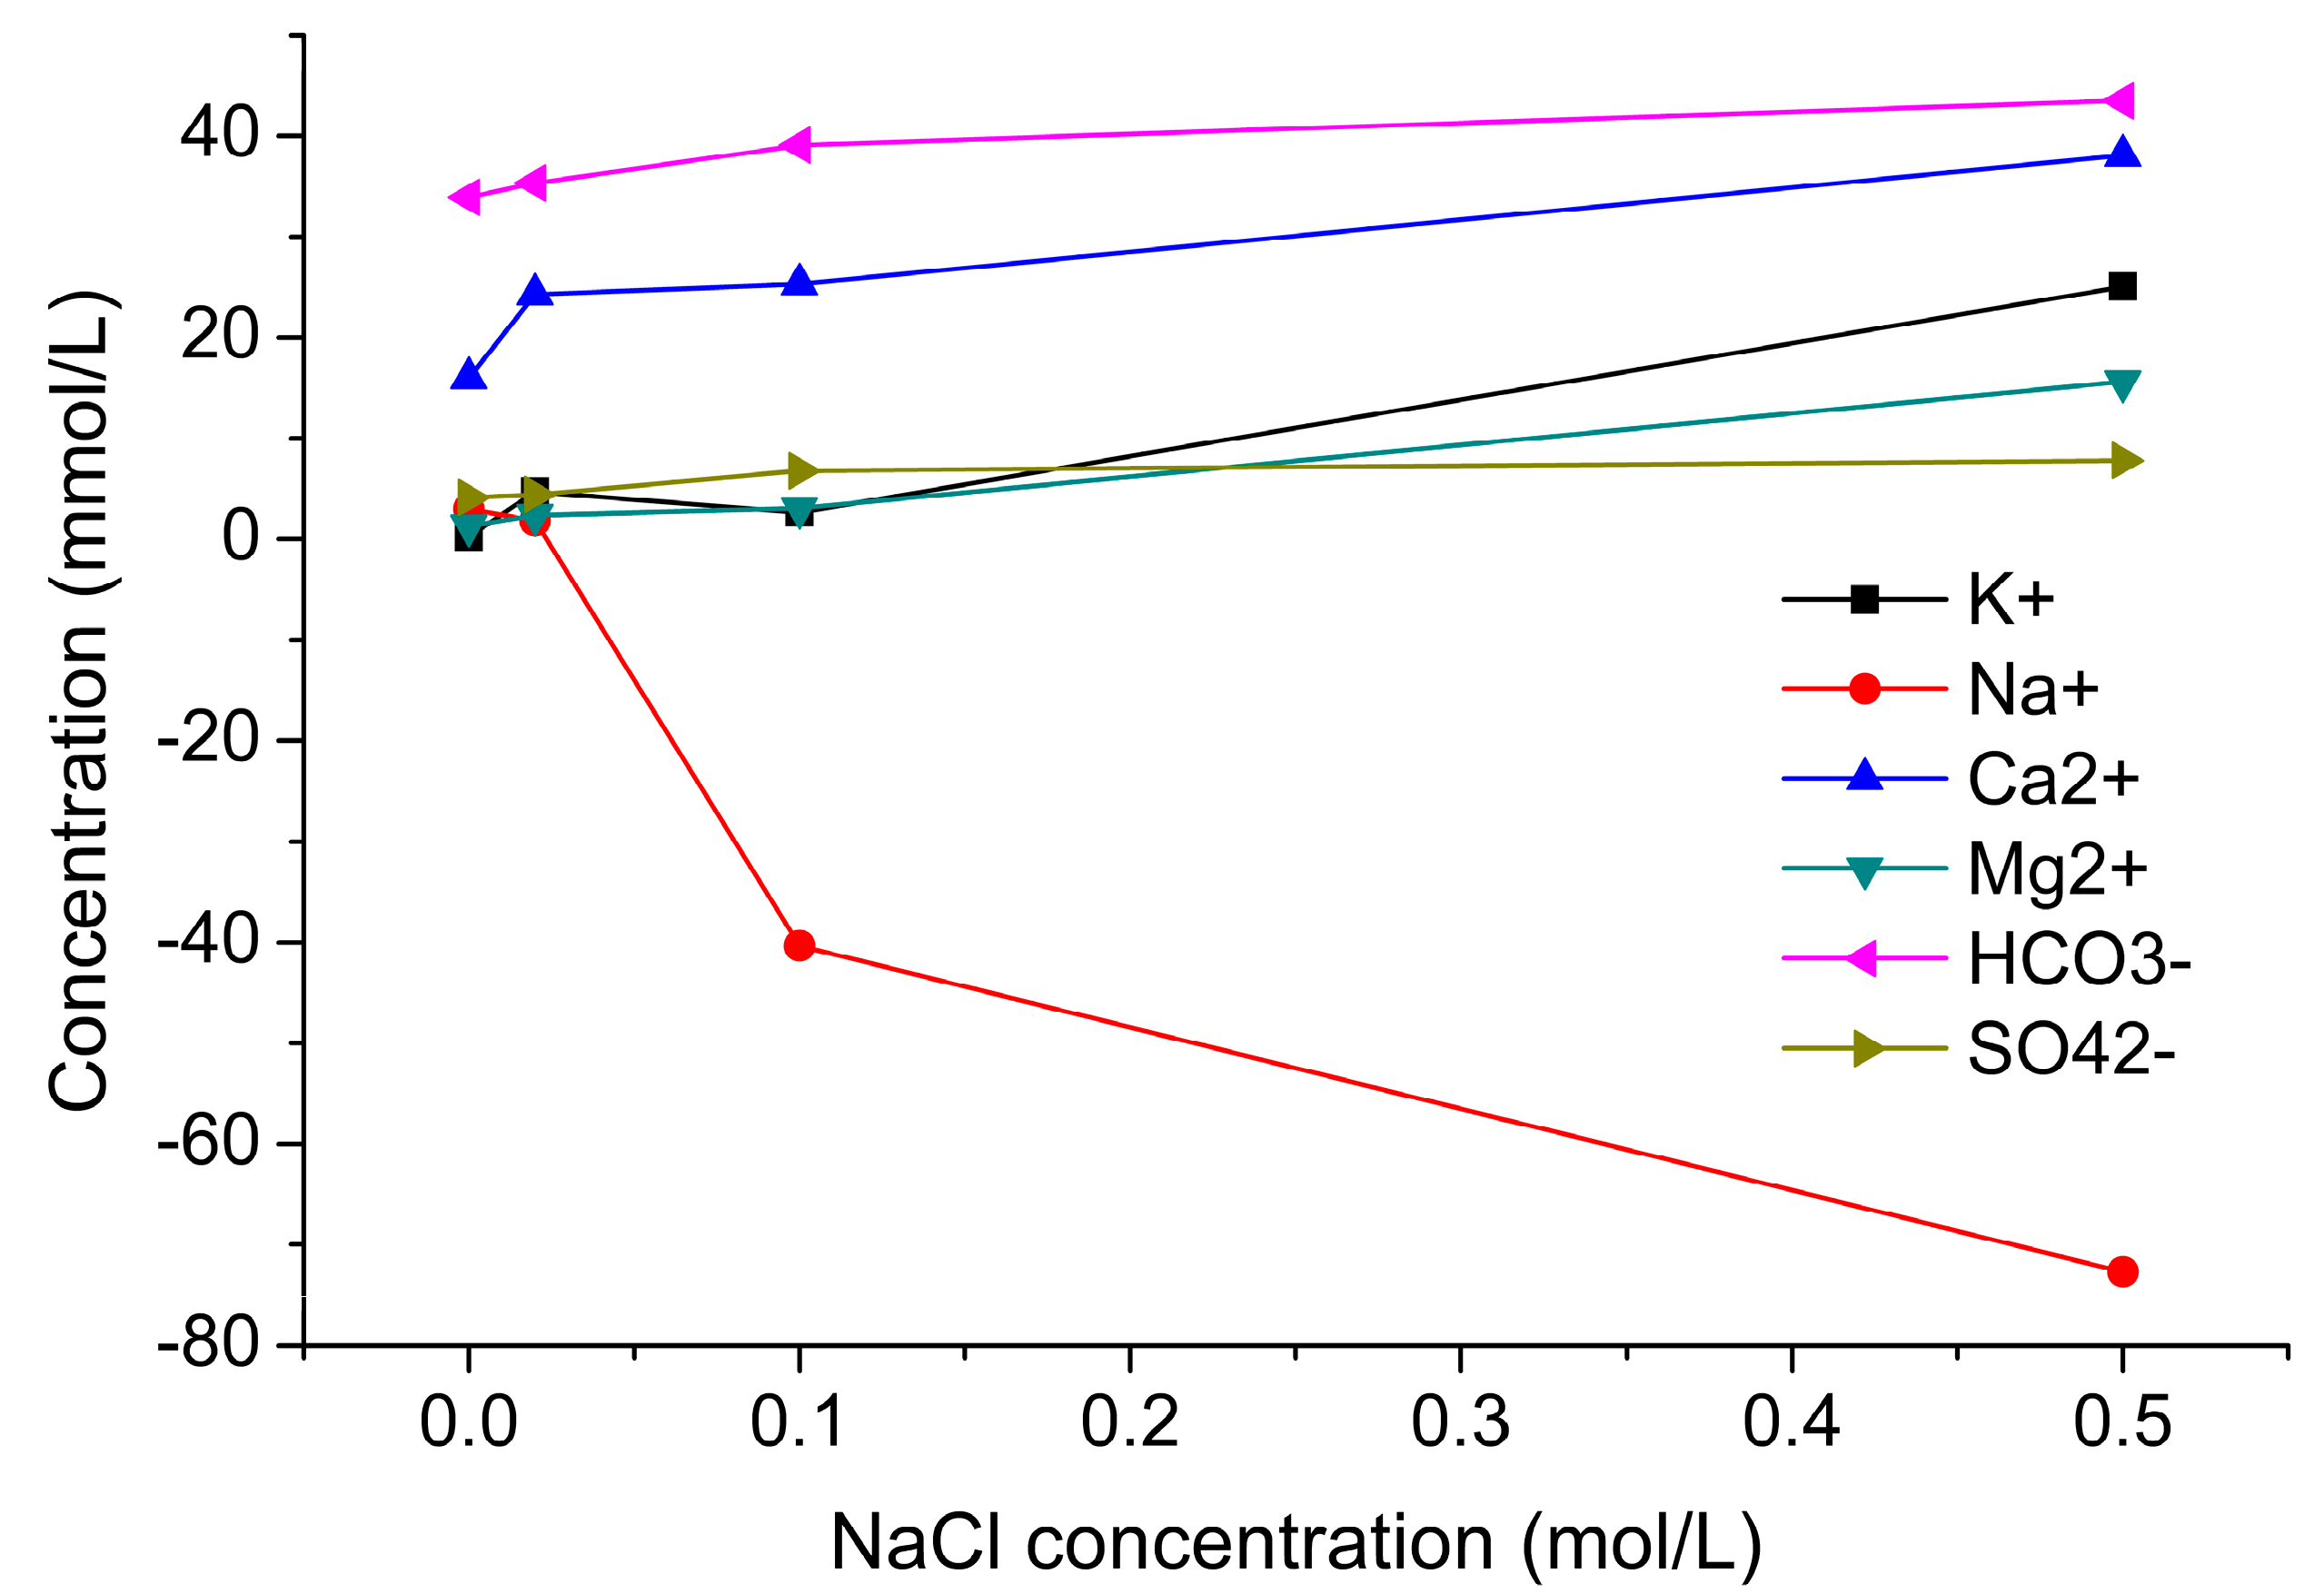
Figure 6.
SEM images of sandstone samples in the experiments before and after the CO2–brine–rock interactions. (a,b) Clean and smooth surface of calcites before the interaction, (c) unclear mineral surface after the interaction at the pressure of 2 MPa, (d,e) loose and porous mineral surface as calcite further dissolution at the pressure of 5 and 8 MPa, (f) holes left after most calcite dissolution, and (g–i) white slender minerals formed on the surface of the sandstone after the interaction.
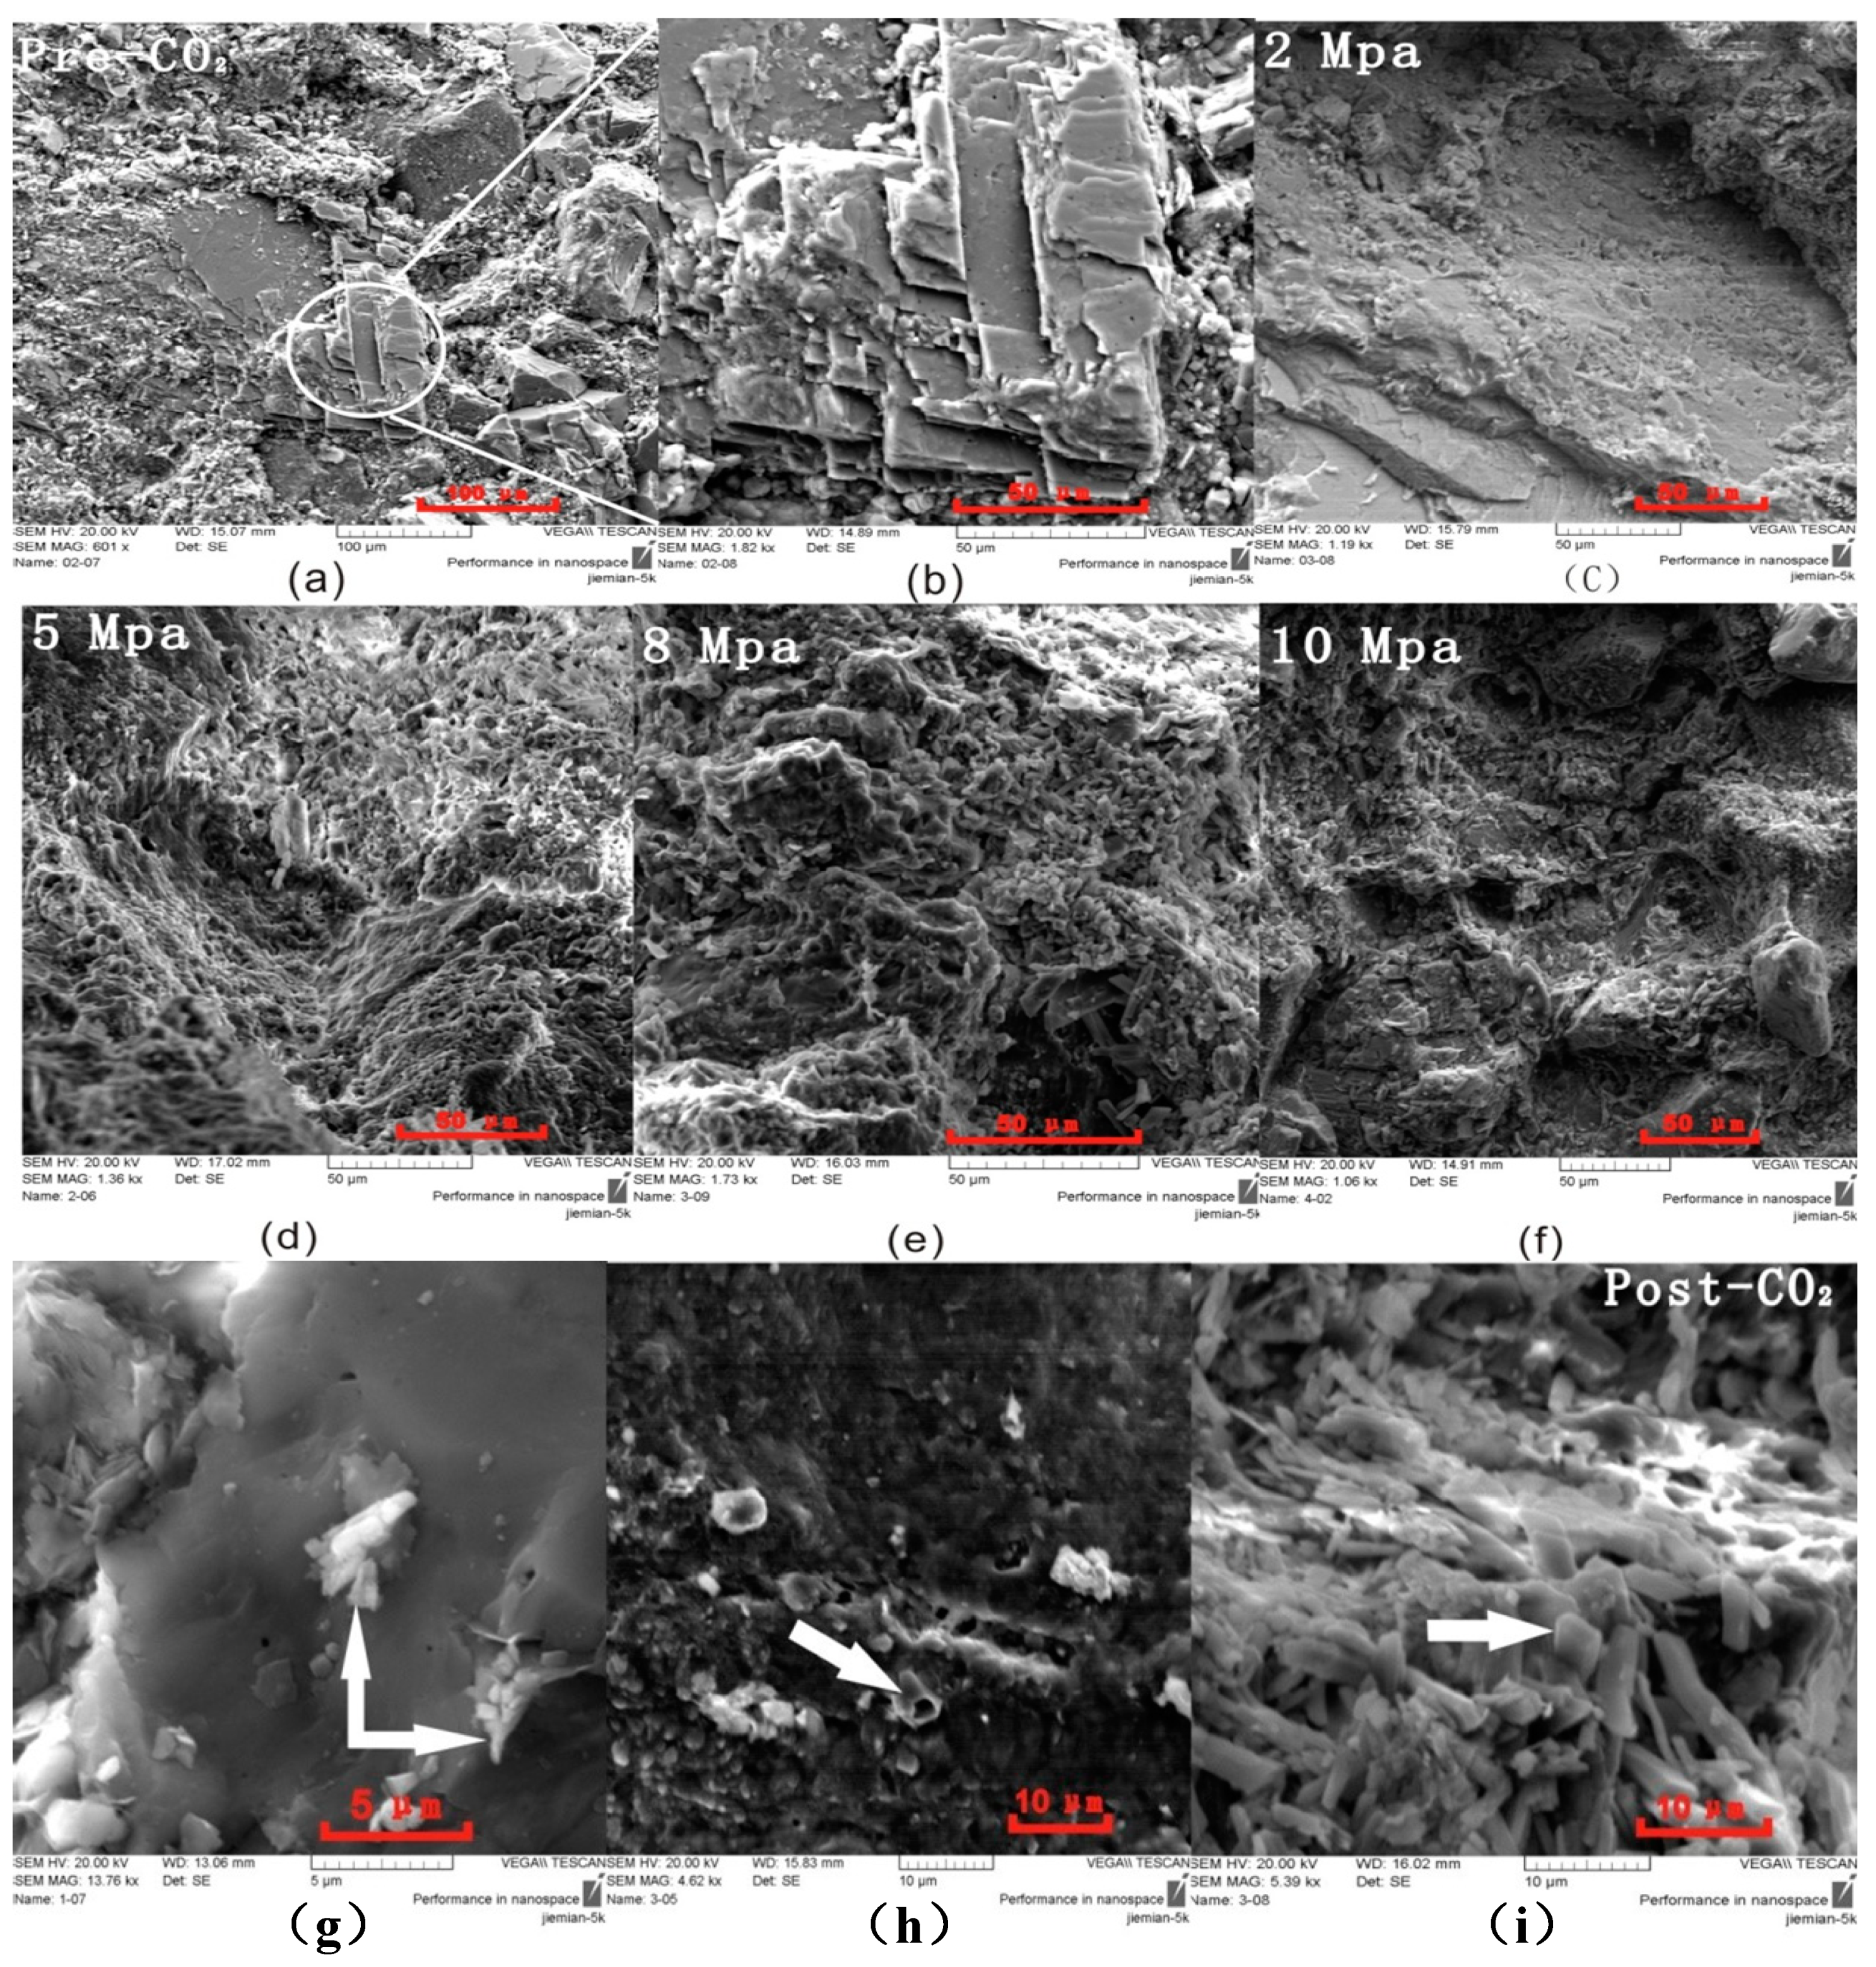
Figure 7.
Mineral dissolution/precipitation under different conditions simulated by PHREEQC.
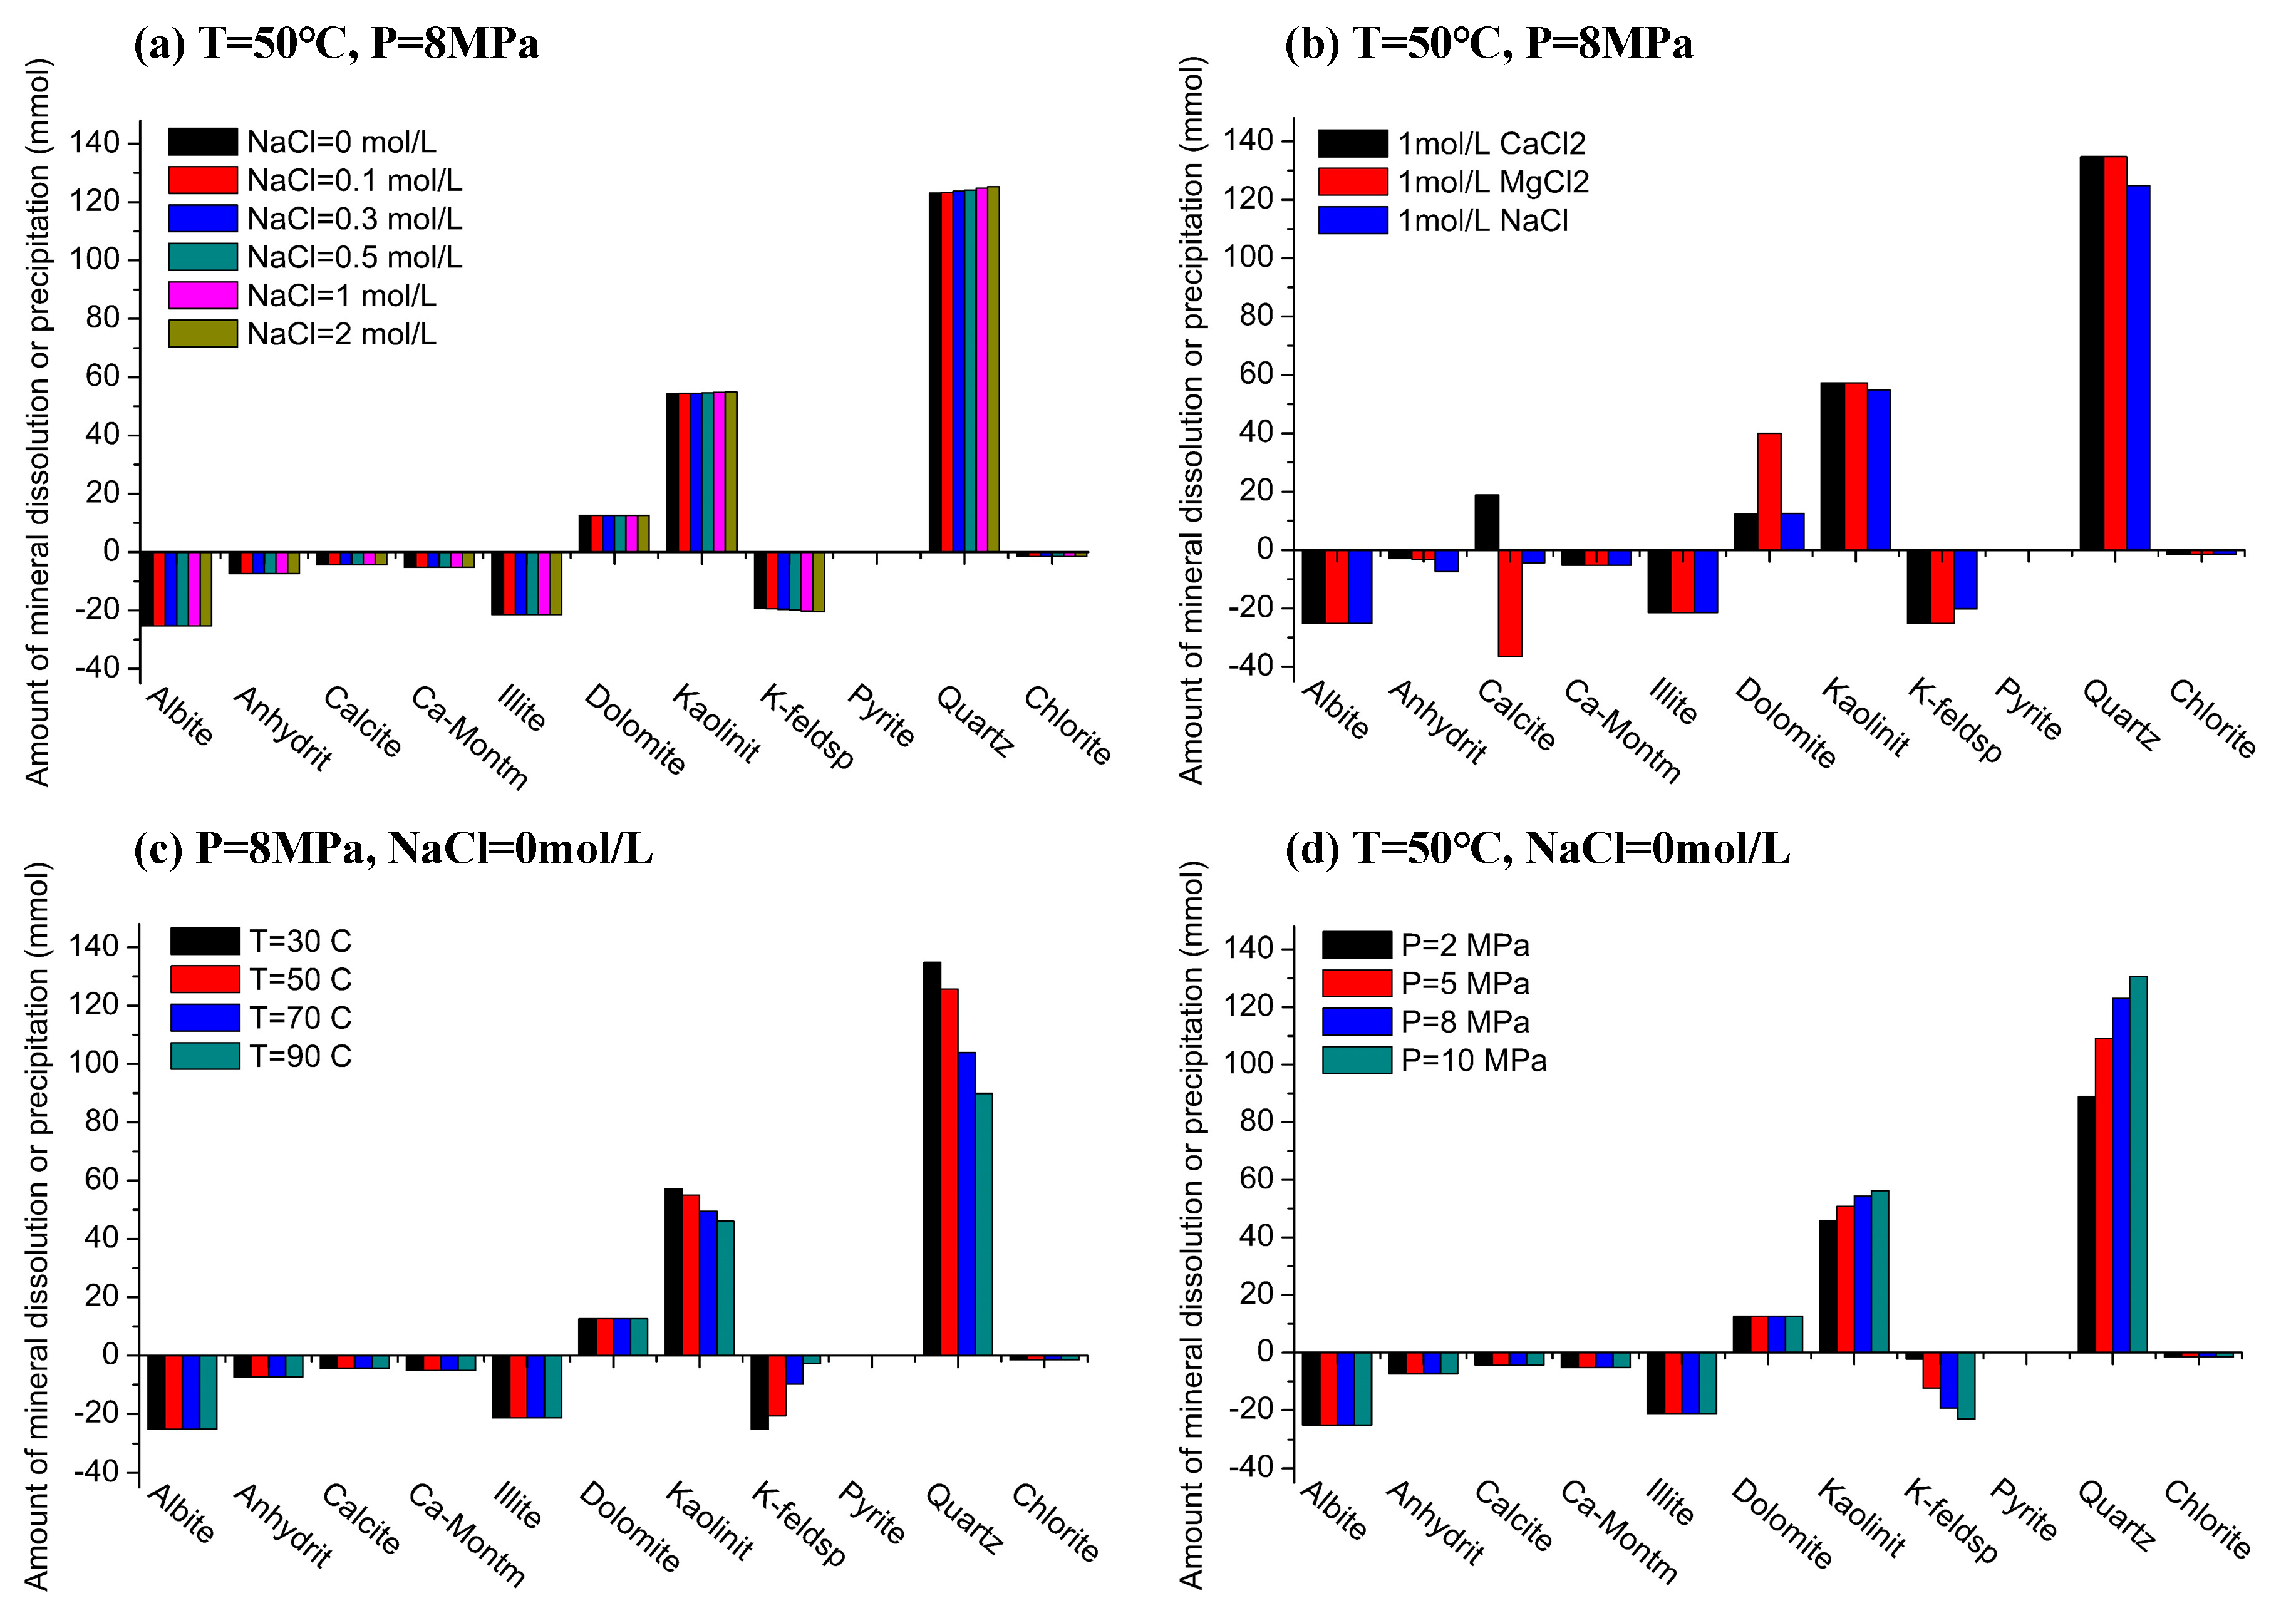
Figure 8.
Change of CO2(aq) and pH in solutions in different conditions simulated by PHREEQC.
Figure 9.
Change of ion concentration under different conditions simulated by PHREEQC.
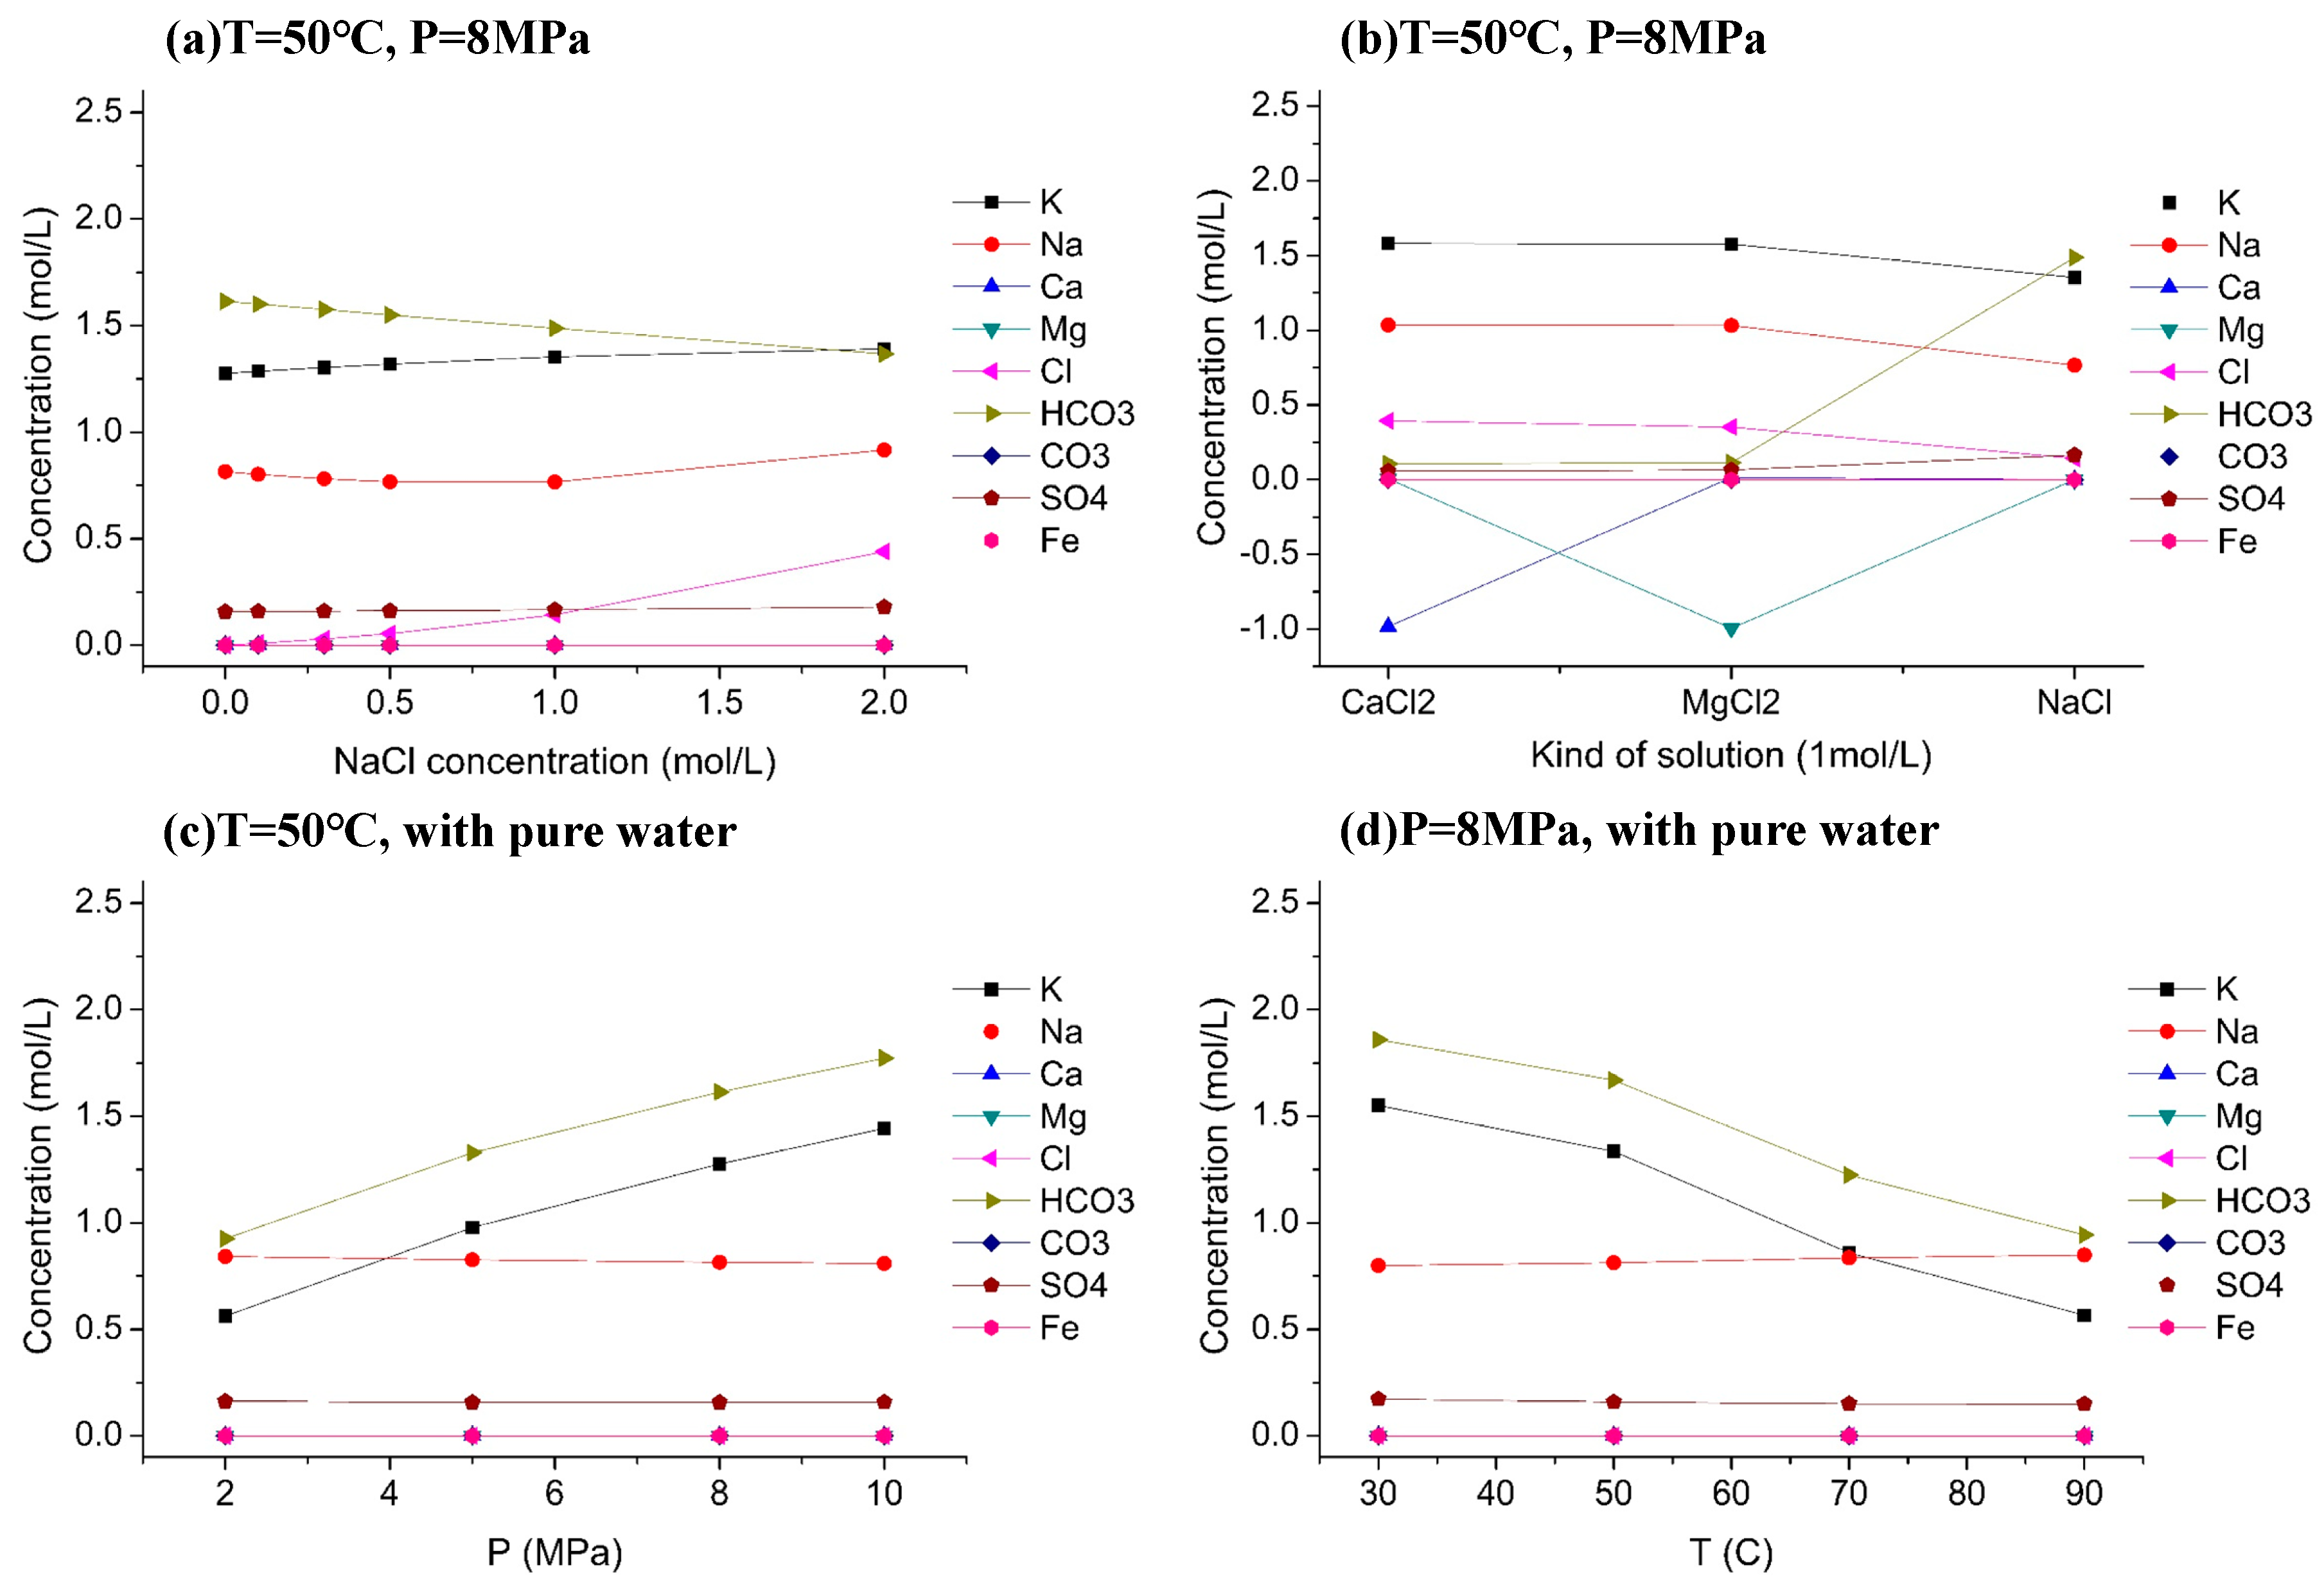
Figure 10.
Changes of mineral abundance in volume fraction with time simulated by TOUGHREACT. (a) Time in log10 scale for analyzing the early data and (b) time in linear scale for analyzing the later data.
Figure 10.
Changes of mineral abundance in volume fraction with time simulated by TOUGHREACT. (a) Time in log10 scale for analyzing the early data and (b) time in linear scale for analyzing the later data.
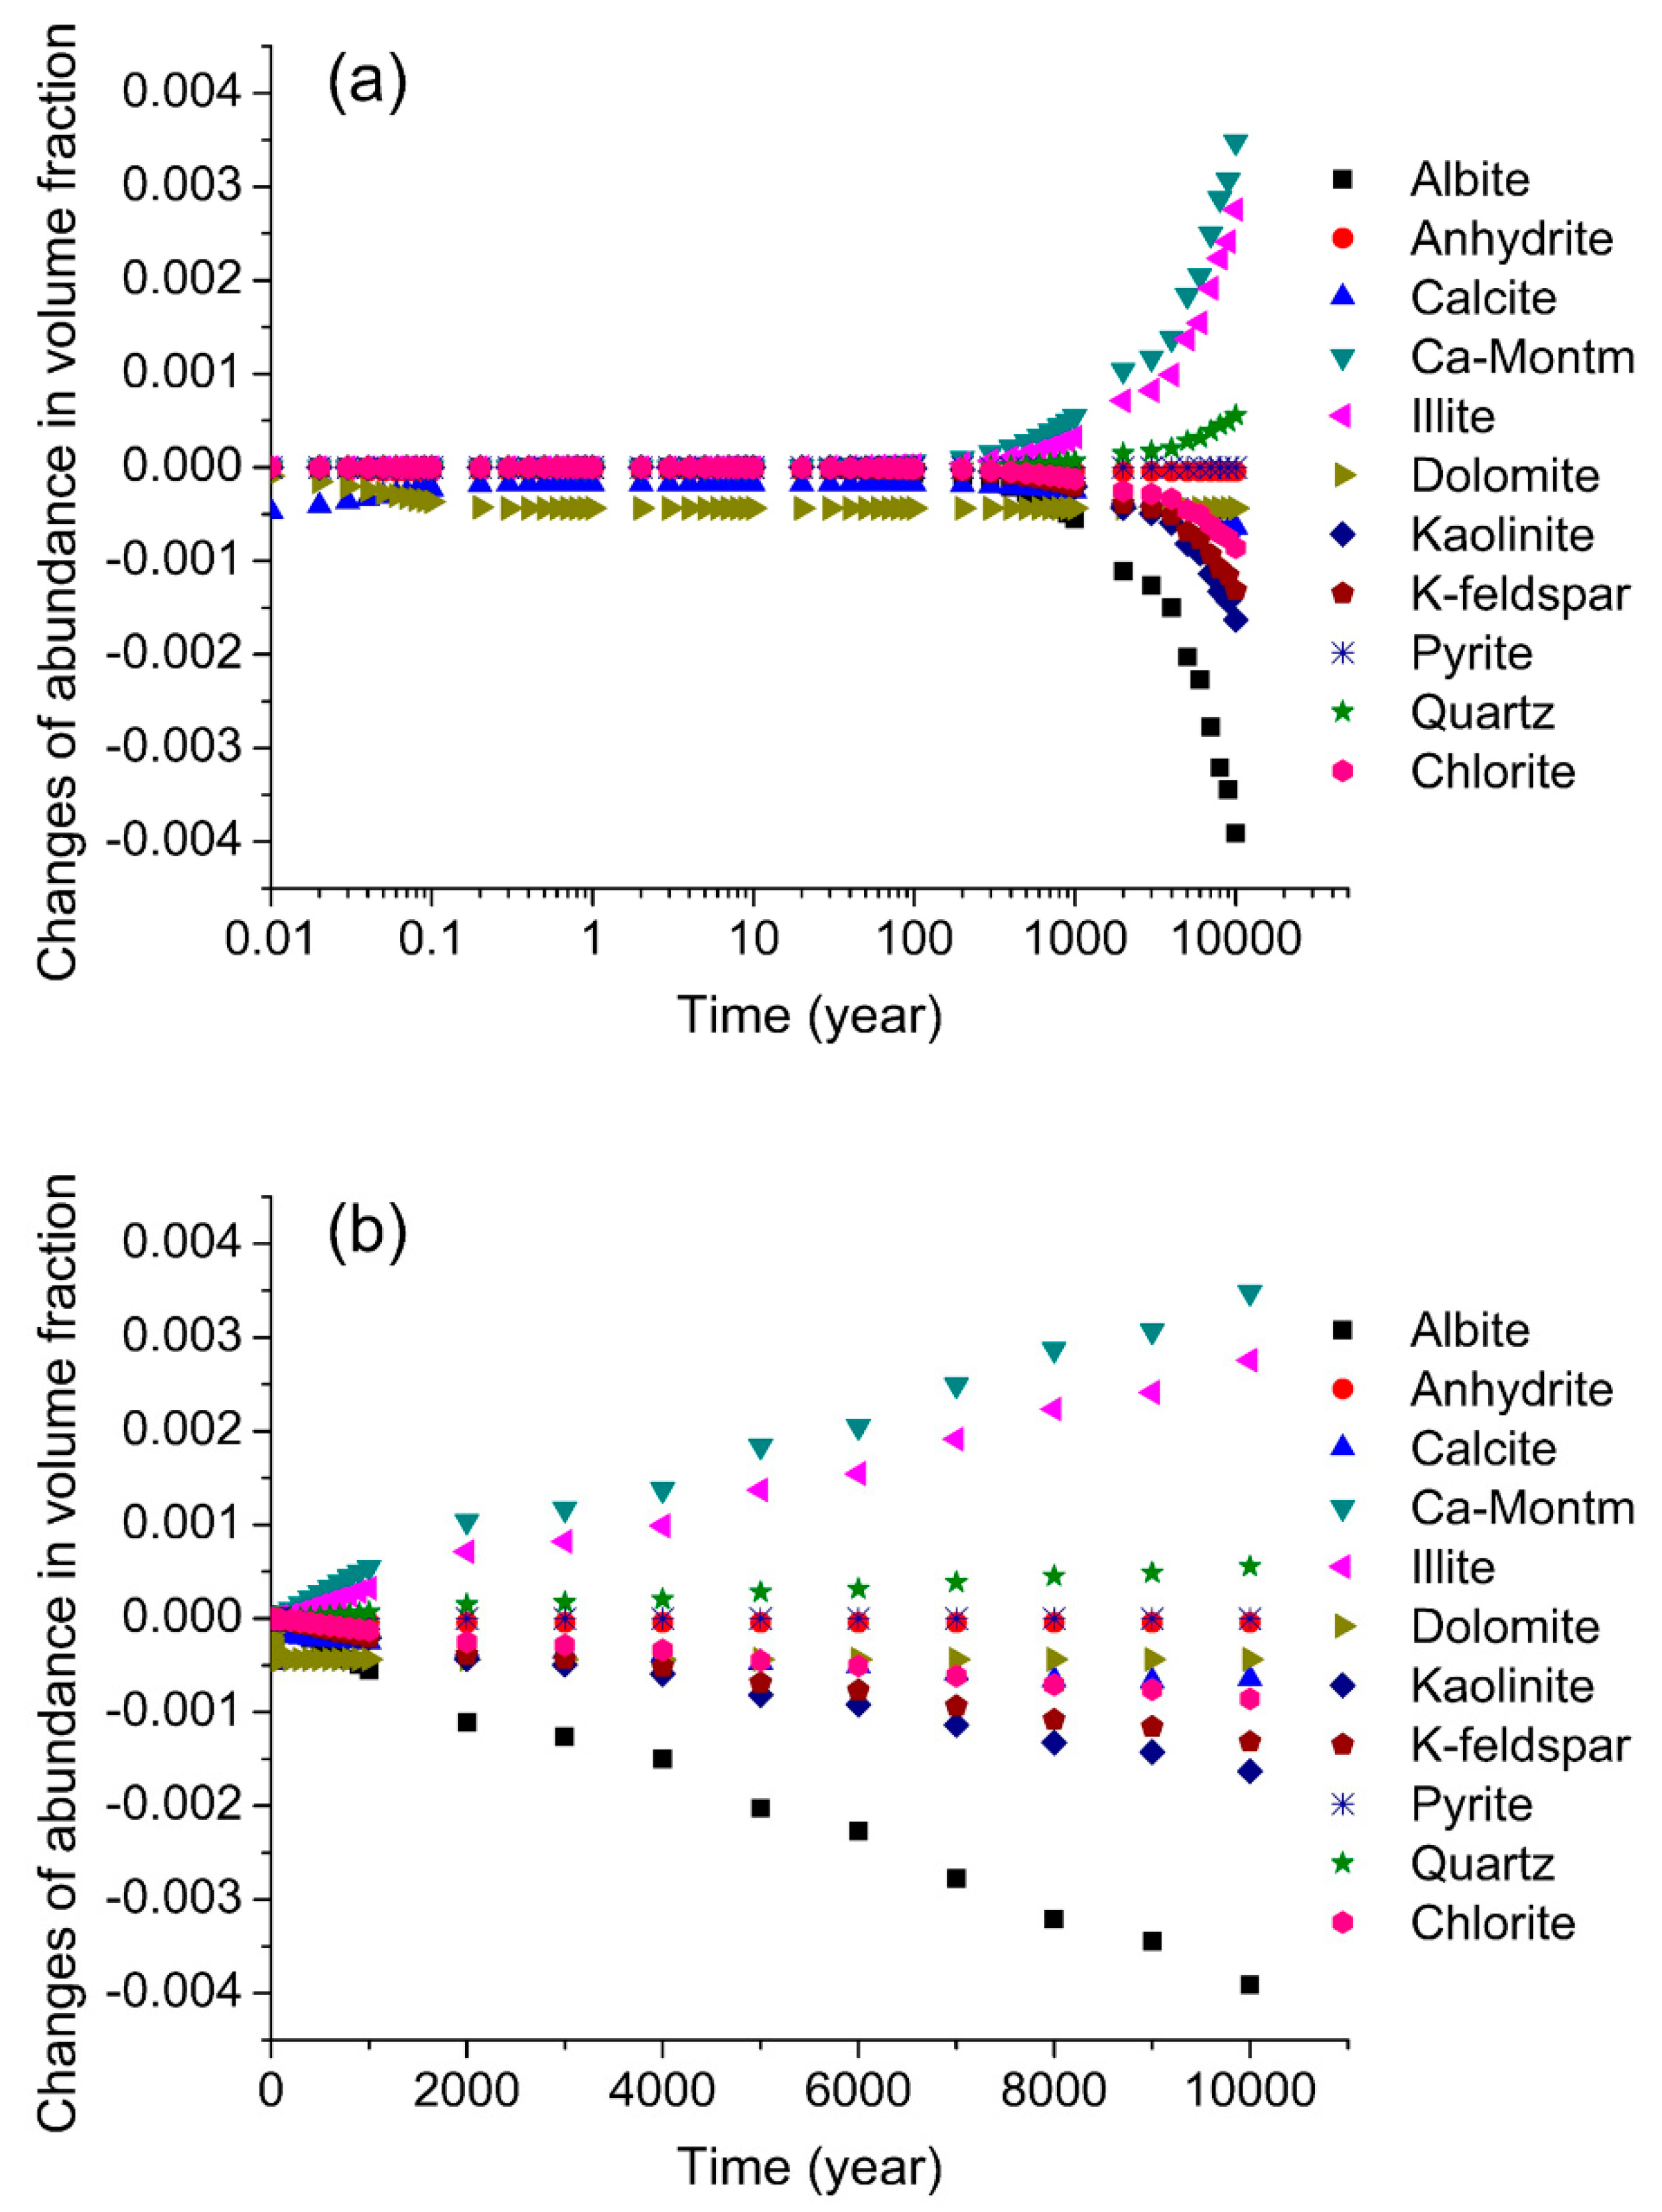
Figure 11.
Changes in the CO2 dissolution amount and pH in the solution with time, as simulated by TOUGHREACT.
Figure 11.
Changes in the CO2 dissolution amount and pH in the solution with time, as simulated by TOUGHREACT.
Figure 12.
Changes of ion concentration in the solution due to the interaction among CO2, sandrock, and brine with time, as simulated by TOUGHREACT.
Figure 12.
Changes of ion concentration in the solution due to the interaction among CO2, sandrock, and brine with time, as simulated by TOUGHREACT.

Table 1.
Mineral compositions and contents of the rock sample used in the experiments and simulations.
Table 1.
Mineral compositions and contents of the rock sample used in the experiments and simulations.
| Mineral | Chemical Formulae | Mass Fraction (%) 1 | Amount (mol) 2 |
|---|---|---|---|
| Quartz | SiO2 | 35.3 | 0.588 |
| Calcite | CaCO3 | 13.3 | 0.133 |
| K-feldspar | KAlSi3O8 | 7.0 | 0.025 |
| Albite | NaAlSi3O8 | 6.6 | 0.025 |
| Dolomite | CaMg(CO3)2 | 15.3 | 0.083 |
| Pyrite | FeS2 | 1.3 | 0.011 |
| Anhydrite | CaSO4 | 1.0 | 0.007 |
| Ca-Montmorillonite | Ca0.165Al2.33Si3.67O10(OH)2 | 1.9 | 0.005 |
| Kaolinite | Al2Si2O5(OH)4 | 9.3 | 0.036 |
| Chlorite | Mg5Al2Si3O10(OH)8 | 0.8 | 0.001 |
| Illite | K0.6Mg0.25Al2.3Si3.5O10(OH)2 | 8.2 | 0.021 |
Where the captions noted with ‘1’ and ‘2’ refer to the mineral amount used in dynamic simulations and in equilibrium simulations, respectively. The values of mass fraction were analyzed by XRD and values of amount were calculated from mass fraction, molecular weight and a total mass of 100 g.
Table 2.
Parameters for the batch experiments on the CO2–brine–rock interaction.
| Experiment Time (h) | NaCl Solution Concentration (mol/L) | Experiment Pressure (MPa) |
|---|---|---|
| 12 | 0 * | 2 |
| 24 | 0.02 | 5 |
| 72 * | 0.1 | 8 * |
| 144 | 0.5 | 10 |
When the value of one factor changed, the values of the other two factors were constant and equal to the values designated with a “*”.
© 2019 by the authors. Licensee MDPI, Basel, Switzerland. This article is an open access article distributed under the terms and conditions of the Creative Commons Attribution (CC BY) license (http://creativecommons.org/licenses/by/4.0/).
Share and Cite
MDPI and ACS Style
Liu, B.; Zhao, F.; Xu, J.; Qi, Y. Experimental Investigation and Numerical Simulation of CO2–Brine–Rock Interactions during CO2 Sequestration in a Deep Saline Aquifer. Sustainability 2019, 11, 317. https://doi.org/10.3390/su11020317
AMA Style
Liu B, Zhao F, Xu J, Qi Y. Experimental Investigation and Numerical Simulation of CO2–Brine–Rock Interactions during CO2 Sequestration in a Deep Saline Aquifer. Sustainability. 2019; 11(2):317. https://doi.org/10.3390/su11020317
Chicago/Turabian StyleLiu, Bo, Fangyuan Zhao, Jinpeng Xu, and Yueming Qi. 2019. "Experimental Investigation and Numerical Simulation of CO2–Brine–Rock Interactions during CO2 Sequestration in a Deep Saline Aquifer" Sustainability 11, no. 2: 317. https://doi.org/10.3390/su11020317
Note that from the first issue of 2016, this journal uses article numbers instead of page numbers. See further details here.