Article

Grazing Affects the Ecological Stoichiometry of the Plant–Soil–Microbe System on the Hulunber Steppe, China

1
National Hulunber Grassland Ecosystem Observation and Research Station, Institute of Agricultural Resources and Regional Planning, Chinese Academy of Agricultural Sciences, Beijing 100081, China
2
College of Arts and Sciences, Governors State University, University Park, IL 60484, USA
3
Faculty of Life Science and Technology, Central South University of Forestry and Technology, Changsha 410004, China
4
Department of Grassland Technology Extension, The Institute of Forestry and Grassland in Urumqi City, Xinjiang 830000, China
*
Author to whom correspondence should be addressed.
Co-first authors: Juan Cao and Ruirui Yan. These authors contributed equally to this work.
Sustainability 2019, 11(19), 5226; https://doi.org/10.3390/su11195226
Submission received: 5 August 2019 / Revised: 17 September 2019 / Accepted: 19 September 2019 / Published: 24 September 2019
(This article belongs to the Special Issue Sustainable Livestock Production)

Abstract

:
Grazing affects nutrient cycling processes in grasslands, but little is known by researchers about effects on the nutrient stoichiometry of plant–soil–microbe systems. In this study, the influence of grazing intensity (0, 0.23, 0.34, 0.46, 0.69, and 0.92 AU ha−1) on carbon (C), nitrogen (N) and phosphorus (P) and their stoichiometric ratios in plants, soil, and microbes was investigated in a Hulunber meadow steppe, Northeastern China. The C:N and C:P ratios of shoots decreased with grazing increased. Leaf N:P ratios <10 suggested that the plant communities under grazing were N-limited. Heavy grazing intensities increased the C:N and C:P ratios of microbial biomass, but grazing intensity had no significant effects on the stoichiometry of soil nutrients. The coupling relationship of C:N ratio in plant–soil–microbial systems was tightly significant compared to C:P ratio and N:P ratio according to the correlation results. The finding suggested grazing exacerbated the competition between plants and microorganisms for N and P nutrition by the stoichiometric changes (%) in each grazing level relative to the no grazing treatment. Therefore, for the sustainability of grasslands in Inner Mongolia, N inputs need to be increased and high grazing intensities reduced in meadow steppe ecosystems, and the grazing load should be controlled within G0.46.

1. Introduction

Grasslands, which occupy about a fifth of the land surface, are among the most important biome globally. Nevertheless, grasslands have been degrading as a consequence of human disturbances and global climate change [1,2,3]. As the most prevalent land-use type, livestock grazing is related to the sustainable use of grassland ecosystems, because grassland degradation primarily results from imbalances in energy flow and material cycles due to overgrazing. Overgrazing not only threatens the biodiversity and stability of grassland ecosystems but also results in dramatic shifts in their original structural and functional characteristics [4,5,6,7]. Although the effects of grazing on the structure and function of grassland ecosystems have been investigated in many studies, the understanding of the mechanisms underlying the responses of grasslands to grazing remains limited. In particular, those mechanisms that govern the relationships between grazing intensity and plant and soil ecological stoichiometry remain unclear [8].
Ecological stoichiometry studies the balance of essential nutrients by examining element ratios at different levels in various ecosystems [9]. The ratios provide more information than the individual nutrient concentrations and increase understanding of the interactions between different trophic levels [10,11]. C, N and P are the most important elements for plant growth and ecosystem attributes and are coupled because of their cycling in plants and soil [12,13]. The C:N:P ratio in soil is an indication of plant nutritional status, and leaf N:P ratios may reflect N- and/or P-limitation [13,14,15,16].
The effects of grazing on C, N, and P contents and stoichiometry in different components of grassland ecosystems have been investigated in several studies. The contents of C, N, and P in soils are substantially altered by mid- and long-term grazing through the export of nutrients, particularly in heavily grazed grasslands [8,17]. Grazing can increase N availability in soils through inputs of dung and urine and thus can significantly decrease plant above- and belowground C:N ratios [18,19]. Practically, a change in C:N:P stoichiometry is likely the first step in a cascade of plant-soil feedbacks [18,20,21]. The N and P required for plant growth are principally derived from soil, and therefore, soil nutrient concentrations regulate plant C:N:P stoichiometry [22,23]. Grazing can alter soil microbial habitats, and microbes can affect the stoichiometry of soil available resources, subsequently influencing the nutrient availability for plants [24]. Moreover, when returned to the soil from both above- and belowground compartments, the plant detritus affects the stoichiometry of the microbial community. The changes in C:N:P stoichiometry may be associated with changes in the composition of species and functional groups under grazing [19,20]. The study of Elser et al. (2010) showed that species identity and growth form were the key constraints on construction and metabolism, with subsequent effects on ecological stoichiometry [14]. Therefore, the interactions between above- and belowground ecosystem processes in grazed grasslands [12,16,20] and the stoichiometric relationships of the plant–soil–microbial system are also closely linked [24]. Although the ecological stoichiometry in grassland ecosystems has been extensively studied, most of the research focuses on the stoichiometric features of plant leaves or aboveground parts and soils [12]. Few studies have characterized the belowground stoichiometry in plant roots and soil microorganisms, and we have not paid much attention to the influence of grazing activity on the stoichiometry of the plant–microbial–soil system in grassland ecosystems. Therefore, to better understand the linkages between above- and belowground compartments under the influence of grazing, more studies of belowground stoichiometry are needed in grasslands [16].
The Hulunber meadow steppe is one of the largest natural grasslands in the world and accounts for approximately 60% of the total temperate meadow steppe area in China [25,26]. The Hulunber grassland provides much high-quality forage for livestock and is a fundamental source of livelihood for local residents, in addition to providing various ecological services at regional and national scales. However, long-term, high-intensity grazing has resulted in serious degradation of the Hulunber grasslands [25]. In recent years, much effort has been directed to the restoration and sustainable management of the Hulunber grasslands, including fencing to exclude grazers, retiring of livestock, and returning farmlands to grasslands. In this study, the aim was to examine the impacts of grazing intensity on the ecological stoichiometry in the plant–soil–microbe system of meadow steppes of the Hulunber grassland in Northeastern China. The specific objectives of the study were: (1) to quantify the changes in C, N, and P contents in plant shoots and roots, soil, and soil microbial biomass under different levels of grazing, (2) to investigate the changes in C:N:P stoichiometry in the plant–soil–microbe system under different grazing intensities, and (3) to develop the relationships of stoichiometric features between aboveground and belowground parts in this grazed grassland ecosystem.

2. Materials and Methods

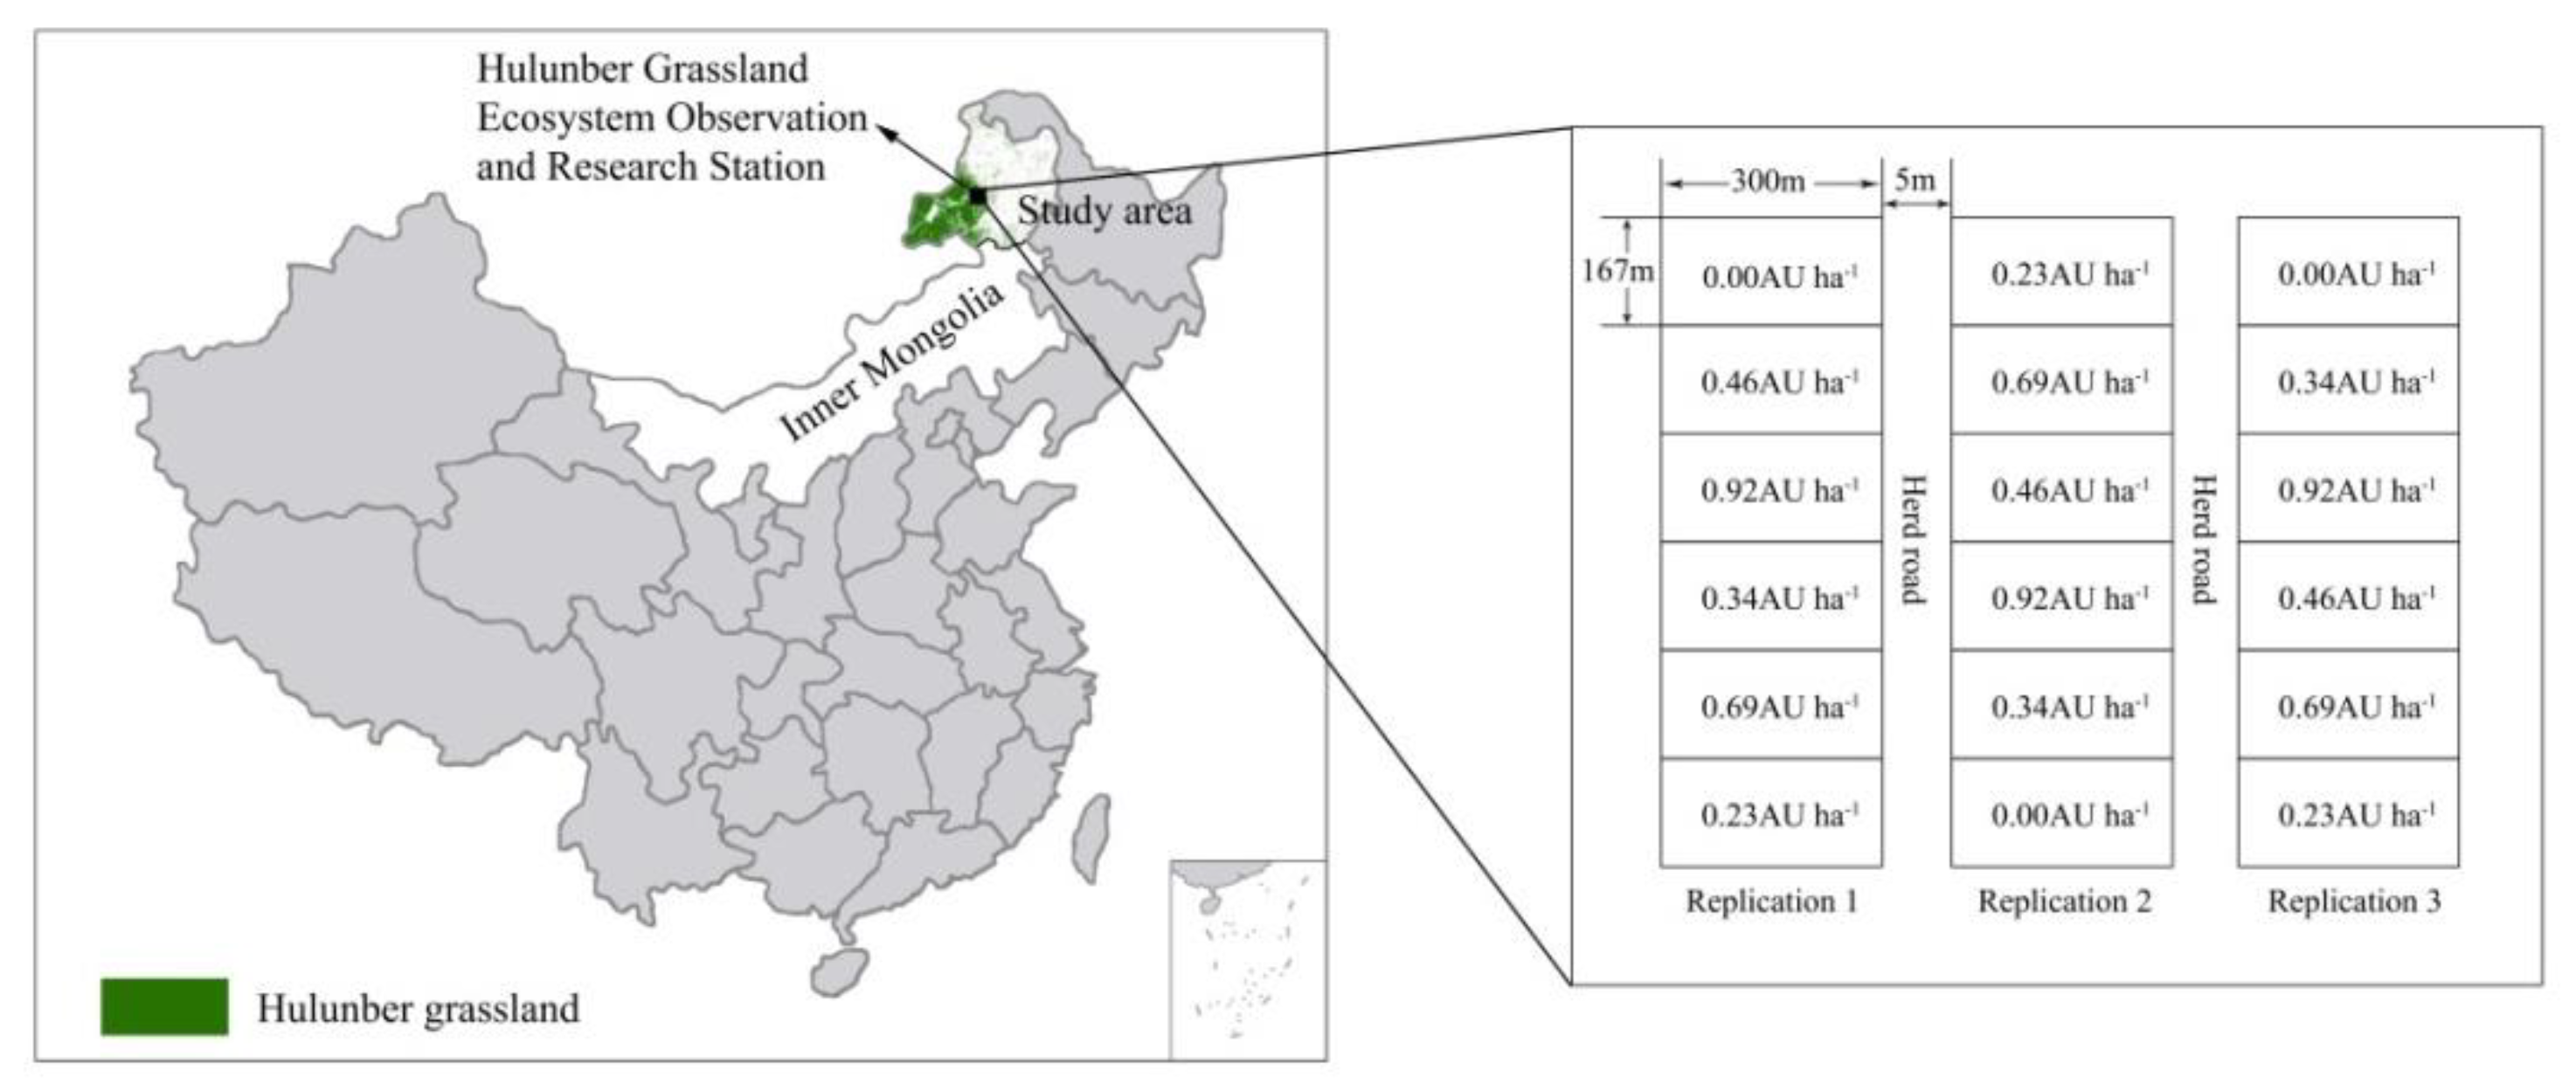
2.1. Discription of the Experimental Site

The experiment was conducted at a long-term grazing experimental site (49°19′35″ N, 119°56′52″ E) in Inner Mongolia, China. The elevation of the study area varies from 666 to 680 m. The annual mean precipitation is 349 mm and approximately 85% falls between June and September (Figure 1). The annual mean temperature is 0.08 °C in 2018. The frost-free period is 110 days. According to Chinese soil taxonomy, the main soil type in the study area was classified as chernozem or chestnut soil. The meadow steppe was dominated by the plant species Leymus chinensis, Scutellaria baicalensis, Carex duriuscula, Galium verum, Bupleurum scorzonerifolium, and Filifolium sibiricum.
The long-term study began in 2009 when a spilt-plot design with six grazing intensity treatments was established (Figure 2). The six grazing densities were set using the stocking rates of G0.00, G0.23, G0.34, G0.46, G0.69, and G0.92 AU ha−1 (where 1 AU = 500 kg of adult cattle). Three plots (each 5 ha) were set up for each of the grazing intensity treatments. The six grazing intensity treatments were simulated with stocking rates of 0, 2 (G0.23 AU ha−1), 3 (G0.34 AU ha−1), 4 (G0.46 AU ha−1), 6 (G0.69 AU ha−1), and 8 (G0.92 AU ha−1) head of 250–300 kg young cattle. The cattle grazed in the plots day and night for 120 days annually from June to October. Before the grazing experiment was set up, the study area had been under long-term free grazing by cattle or sheep.

2.2. Sampling and Chemical Measurement

The soils were sampled in early August 2018 from three randomly selected quadrats (1 m × 1 m) in each plot, for a total of 54 quadrats. In each quadrat, soil with plants was sampled to the depth of 15 cm. The samples were transported to the laboratory to separate the rhizosphere (RS) and bulk (BS) soils. The RS was defined as that soil adhering to the roots, which was obtained by carefully shaking the plants free from loose soil. The soil not tightly adhering to the roots was the BS [6,27]. The plants collected with the soil samples were cut at the collar to separate the aboveground shoots and the belowground roots. Then, the soil and plant samples taken from the three quadrats within a plot were pooled to form one composite plant sample and one composite soil sample, for a total of 36 soil samples and 36 plant samples. The composite soil sample was divided into two portions by weight; one portion was naturally dried in the shade, and the other portion was stored at −20 °C before further analyses. The naturally dried soil sample was ground to pass through a 0.149-mm mesh sieve, and total C (TC), total N (TN), and total P (TP) were determined. The fresh soil samples were sieved through a 2-mm mesh and used for analyses of microbial biomass C (MBC), N (MBN), and P (MBP). For the analysis of plant TC, TN, and TP, the shoot and root samples were oven-dried to a constant weight at 60 °C for 48 h and then ground to a fine powder to pass through a 0.25-mm sieve.
The concentration of organic C in soil and plant samples was analyzed by the Walkley–Black modified acid-dichromate FeSO4 titration method. The TN concentration of soil and plant samples was determined using a continuous flow analyzer made in German (AA3). The TP concentration was analyzed colorimetrically by spectrophotometer after digestion with H2SO4 and HC1O4. The soil MBC, MBN, and MBP were determined by the chloroform fumigation direct extraction method. The concentration of MBC, MBN, and MBP was calculated using the following equation:
MBE = E fumigated E non fumigated K
where Efumigated and Enon-fumigated are the concentrations of C, N, or P in soil samples extracted after fumigation with chloroform and without fumigation for 24 h, respectively. K is the correction factor, with KC = 0.38, KN = 0.45, and KP = 0.40.
To determine the level of enrichment of soil nutrients in the rhizosphere, the enrichment ratio (E) was calculated using the following equation:
E = R B
where R and B are the concentrations of nutrients in the RS and BS, respectively.

2.3. Statistical Analysis

To analyze the effects of grazing intensity on the nutrient concentrations and stoichiometric characteristics of soils and plants, one-way ANOVA was used. Two-way ANOVAs were used to determine the effects of grazing intensity and soil position (rhizosphere and bulk) or plant tissue (shoots and roots) on stoichiometry. Regression analysis was performed to test whether soil nutrient concentrations were linearly related to microbial biomass or plant nutrient concentrations. The statistical analyses were performed using the SPSS statistical software package (SPSS Version 19.0). In all statistical analyses, differences were accepted at α = 0.05.

3. Results

3.1. Nutrients in Plants and Soil

Overall, the concentrations of TC, TN, and TP were significantly higher in shoots than in roots (P < 0.05) (Figure 3a–c). Compared with the G0.00 plots, grazing intensity did not significantly alter the TC concentration in shoots and roots. At low and moderate grazing densities (G0.23 to G0.46), the concentrations of TN and TP in plants were not significantly affected, but at the high grazing intensities of G0.69 and G0.92, the TN and TP concentrations in shoots and roots increased significantly (P < 0.05) (Figure 3b,c).
The concentrations of TC and TN were significantly greater in RS than in BS, but the concentration of TP was significantly lower in RS than in BS in all grazing treatment plots (P < 0.05) (Figure 3d–f). Compared with the G0.00 plots, the TC concentrations in RS and BS were not significantly different in the low and moderate grazing intensity plots (G0.23 to G0.46) (P > 0.05), but at high grazing intensities (G0.69 and G0.92), the TC concentration in both RS and BS significantly decreased (P < 0.05). The TN concentrations in RS and BS were not significantly different among the six grazing intensity treatments, although the concentrations declined in the highly grazed plots. The TP concentrations in RS and BS were not significantly different between the grazed and non-grazed plots (P > 0.05), with the exception of the G0.34 plots in which grazing increased the TP concentration in RS and BS, compared with that in the G0.00 plots.
The MBC and MBN concentrations were higher in RS than in BS (P < 0.05), but for MBP, the differences between RS and BS were not consistent or significant (P > 0.05) (Figure 3g–i). Soil MBC concentration was not significantly different between grazed and non-grazed plots in RS and BS. Compared with the G0.00 plots, the MBN concentration in both RS and BS decreased significantly in the G0.46 and G0.69 grazing plots. The concentrations of MBP in RS and BS showed no consistent response to grazing. In RS under the different grazing intensities, MBP decreased in the order G0.34 > G0.23 > G0.00 > G0.92 > G0.46 > G0.69, whereas in BS, the order of decrease in MBP was G0.34 > G0.00 > G0.23 > G0.92 > G0.69 > G0.46.

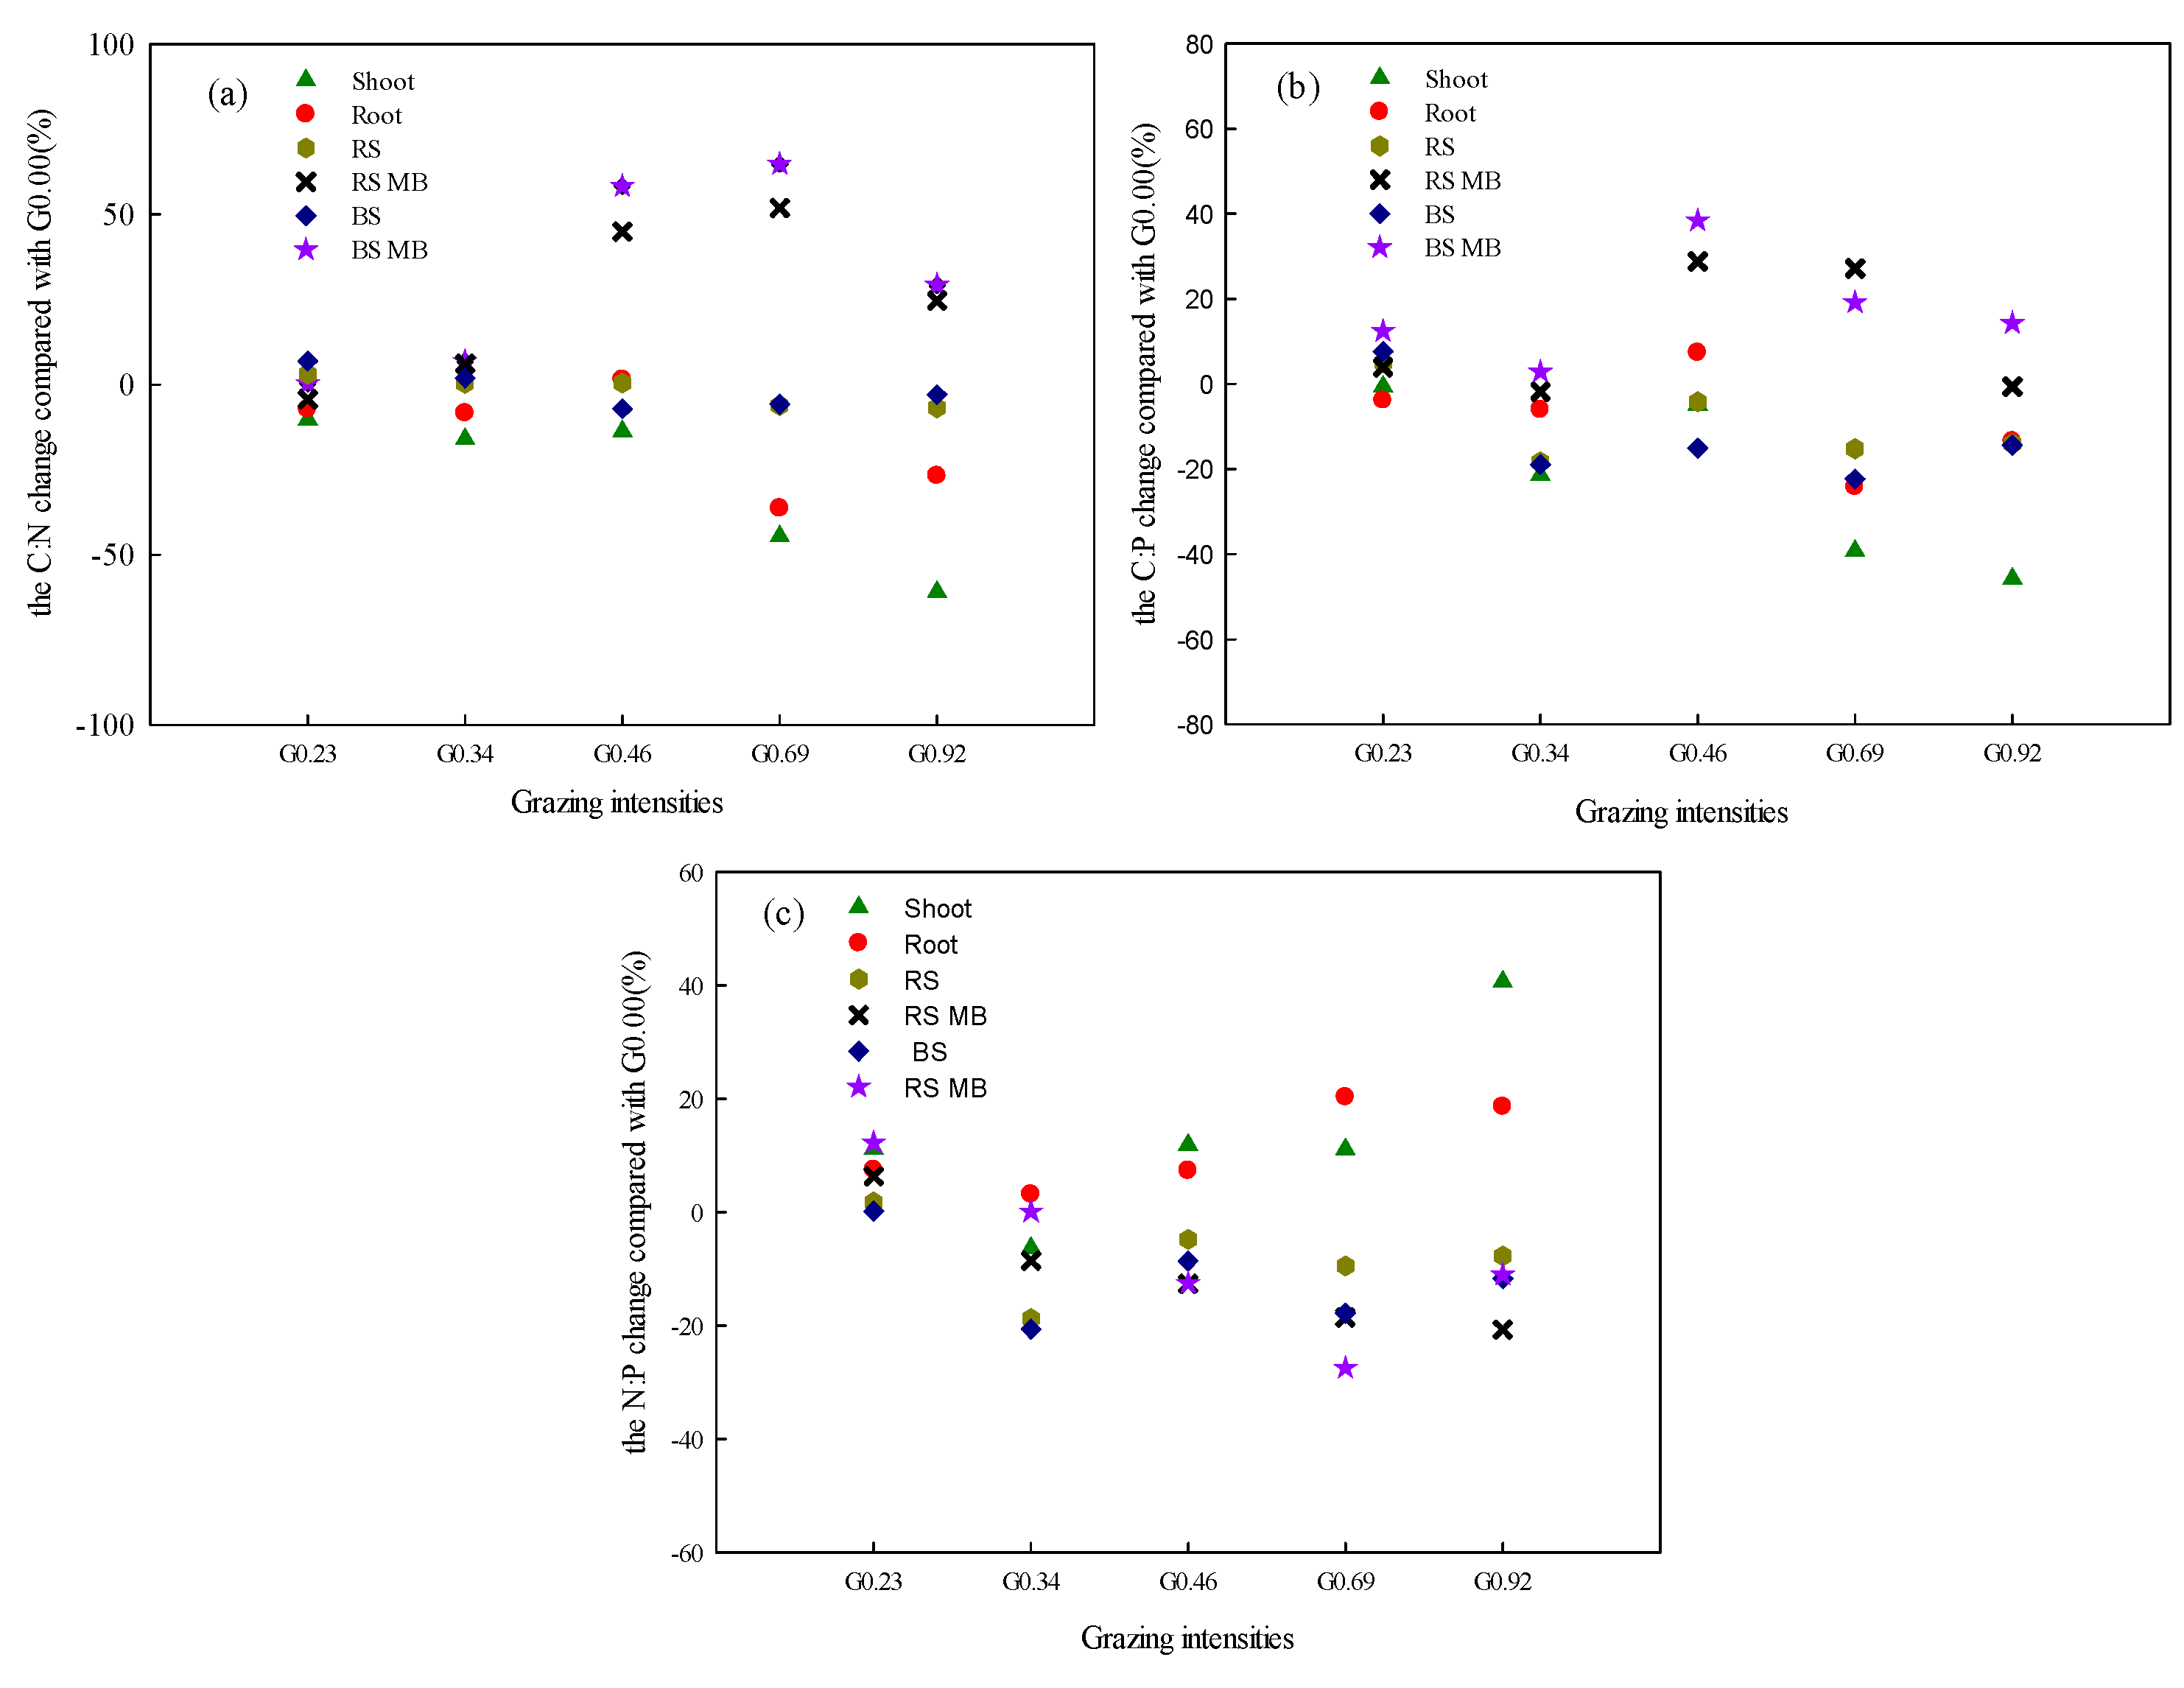
3.2. Stoichiometric Characteristics in Plants and Soil

The increase in grazing intensity generally reduced the C:N and C:P ratios in shoots and roots, except for an increase under G0.46 (Figure 4a,b). Grazing had no significant influence on the N:P ratios of shoots and roots with the increase in grazing intensity. The highest N:P ratios of shoots and roots occurred under grazing intensities from G0.46 to G0.92 (Figure 4c).
The highest RS C:N ratio was in the G0.23 treatment, which was significantly higher than that in G0.69 and G0.92 treatments (Figure 4d). The highest BS C:N ratio was also in the G0.23 treatment, but the ratio was not significantly different from those at the highest levels of grazing. The RS C:P ratio decreased in the order G0.23 > G0.00 > G0.46 > G0.92 > G0.69 > G0.34. The order was the same for BS, except the lowest C:P ratio was in the G0.69 treatment (Figure 4e). In response to grazing intensity, the patterns for RS and BS N:P ratios were the same as those for RS and BS C:P ratios (Figure 4f).
Compared with the G0.00 plots, the RS and BS microbial biomass C:N ratios were the highest in the G0.69 treatment and the lowest in the G0.23 treatment. The ratios at moderate-to-high grazing intensities were significantly higher than those at the lowest level of grazing intensity (Figure 4g). Compared with the G0.00 plots, the lowest RS and BS microbial biomass C:P ratios were in the G0.34 treatment, whereas the highest ratios were in the G0.46 treatment (Figure 4h). The largest RS and BS microbial biomass N:P ratios were in the G0.23 treatment, whereas the lowest ratios were in the G0.92 treatment for RS and in the G0.69 treatment for BS (Figure 4i).

3.3. Relationships of Nutrients and the Stoichiometry between Soil and Plants

No significant correlations were found between the concentrations of nutrients in plants and soils (RS and BS) (P > 0.05) (Table S1). However, the concentration of shoot N was significantly negatively correlated with MBN in RS and BS under the different levels of grazing intensity (Table S1). The regressions between shoot N and MBN in RS and BS also identified significant negative relations (Figure 5a,b). MBC was significantly positively correlated with soil C, and MBN was significantly positively correlated with soil N (Figure 5c,d and Table S2).
Under the different grazing intensities, a significantly positive linear relation was observed between shoot C:N ratios and RS C:N ratios (Figure 6a). The two parameters were also significantly positively correlated (Table S3). The shoot C:N ratios were significantly negatively correlated with RS and BS microbial biomass C:N ratios (Figure 6b,c and Table S3). The shoot C:P ratios were significantly positively correlated with RS and BS C:P ratios (Figure 6d,e and Table S3). The root C:P ratio was significantly positively correlated with the C:P ratio in both RS and BS (Figure 6f,g and Table S3). For the stoichiometry between microbial biomass and soil under different levels of grazing, the soil C:N ratio was significantly negatively correlated with the microbial biomass C:N ratio (Figure 6i and Table S2). By contrast, the soil N:P ratio was significantly positively correlated with the microbial biomass N:P ratio (Figure 6h and Table S2).

4. Discussion

4.1. Effects of Grazing on Stoichiometric Characteristics of Plants

The decrease in shoot C:N and C:P ratios (Figure 4a,b) with the increase in grazing intensity was related to the C, N, and P contents in the plant tissues. Grazing did not significantly affect the TC content of plants (Figure 3a), because the TC content was considered as relatively stable framework materials. However, heavy grazing (G0.69 and G0.92) resulted in higher concentrations of TN and TP in plants (Figure 3b,c). The change of TN and TP is consistent with a previous study which found that herbivory led to increases in the TN and TP concentrations of plant tissues in a grassland [28], although the significant increase occurred only under heavy grazing. At low to moderate grazing intensities, notwithstanding that herbivores diminish the photosynthetic area of leaves with high N content, new tissues are formed with high concentrations of TN and TP in the compensatory regrowth [29]. The increase in concentrations of TN and TP observed under the heaviest grazing in this study could be explained by the following. First, the vegetation under high grazing intensity mostly consists of young metabolic tissues without heavy weathering, which are rich in nutrients [29]. Moreover, with the mineralization of herbivore urine and feces, the availability of soil N and P could increase, stimulating uptake by plants. Additionally, the changes in species composition under high grazing intensities can also affect the availability of nutrients. For example, grazing can increase the number of forbs, which can absorb more N than graminoids [6,30]. In addition, unpalatable and grazing-tolerant annual species become dominant under heavy grazing pressure, and those species usually have higher nutrient contents with lower leaf C:N ratios than perennial grass species [6,8,13,30].
According to the growth rate hypothesis, organisms with higher growth rates have lower C:N, C:P, and N:P ratios, primarily because the rapid growth of organisms requires the synthesis of considerable amounts of protein and RNA [31]. Simultaneously, plants with strong vegetative growth have lower C:N ratios, whereas those with strong reproductive growth have lower C:P ratios [9]. Thus, the decrease in shoot C:N and C:P ratios with the increase in grazing intensity was primarily because plants accelerated vegetative and reproductive growth to complete the life history. Similarly, the root C:N ratios decreased with increasing grazing intensities, most likely because root activities increased. Grazing promotes the aggregation of roots at the soil surface, particularly fine roots, and the proportion of fine roots in the total root system of the topsoil increases with the intensity of grazing [32,33]. The finer the root diameter is, the higher the N and P contents and the higher the root activity [34,35]. In this study, the root C:N ratios were greater than the shoot C:N ratios, which were attributed to the lower N content in roots because of higher lignification. The changes in shoot C:P and C:N ratios were consistent, which was likely related to the coupling of N and P in plant physiological processes. Although the root C:P ratios tended to decrease with increasing grazing intensity, the ratio was significantly reduced only under high grazing intensities. Grazing had no significant influence on the N:P ratios of shoots and roots, with the exception of the shoot N:P ratio in the G0.92 treatment (Figure 4c). Leaf N:P ratios <10 and >20 correspond to N- and P-limitation, respectively [23]; therefore, the plant communities under grazing in this study were likely N-limited.

4.2. Effects of Grazing on Stoichiometric Characteristics of Soil

The RS and BS C:N ratios decreased from light to heavy grazing, which was mainly caused by the decreases in TC in the heavier grazing treatments. The TC concentrations in RS and BS were not significantly different in the low and moderate grazing intensity plots (G0.23 to G0.46), whereas the TC concentration in both RS and BS significantly decreased under heavy grazing (G0.69 and G0.92) (Figure 3d). The TN concentrations in RS and BS were not significantly different among the six grazing intensity treatments, although the concentrations declined in the highly grazed plots (Figure 3e). These decreases in TC and TN may be explained because aboveground biomass decreases significantly under heavy grazing, which can lead directly to reductions in litter inputs as the resource for soil C and N. Plant removal by herbivores also tends to decrease C allocation to roots, because root elongation and root biomass are reduced [36,37]. The reduction of carbon and nitrogen content in heavier grazing would affect the structure and function of the entire grassland ecosystem, and thus affect the sustainable use of grassland ecosystems. The decreases in litter and root biomass inputs may in turn decrease soil and microbial biomass C. The decrease in RS and BS C:N ratios also was an indication of increased availability of soil N. In addition, because heavy grazing exposes more bare soil, the increase in temperatures facilitates rapid decomposition [29,38].
The C:P ratio is an indicator of the utilization and release of P for soil microbes, and relatively low C:P ratios promote the availability of P via mineralization by bacterial species with different strategies of P acquisition [39]. In this study, the decrease of C:P ratio shows that the availability of P increased with grazing compared with that in the control, except in the G0.23 treatment, which is consistent with the increased demand for P in shoots. The RS and BS N:P ratios decreased with grazing compared with those in the control, except for soils in the G0.23 treatment, and the values were significantly smaller than the global average (13.1 or 17.5) [40,41]. The low N:P ratios also suggested relatively low N content in the study area.

4.3. Responses of Microbial Biomass to Grazing

In the high grazing treatments, the microbial biomass C:N and C:P ratios increased. That is because grazing did not significantly affect MBC, by contrast, MBN and MBP increased under light grazing (G0.23 and G0.34) but then decreased under high grazing (G0.46 to G0.92). In previous studies, the shifts in microbial biomass C:N:P were related to changes in the microbial community, given that microbes (e.g., bacteria and fungi) have specific elemental compositions [42,43,44]. Because of the lower metabolic activity and nutrient (N or P) requirements of fungi than bacteria, higher C:N and C:P ratios are an indication of a fungal rather than a bacterial community [6,44]. Indeed, Xun et al. (2018), in the same study plots as in this study, found that bacteria became prevalent with increasing grazing intensity [45]. Thence, the increase in microbial biomass C:N and C:P ratios in this study could be related to the utilization of N and P under high grazing intensities. As noted above, plants under high grazing intensities have increased demand for N and P, and under those conditions, plants could out-compete microorganisms for N and P, resulting in a decrease in MBN and MBP. In this study, the microbial biomass N:P ratio was well constrained in the grazing treatments and was lower than the global average (6.9 or 5.6) [40,41,44]. According to a previous study, a relatively high microbial biomass N:P ratio suggests P limitation and low soil P availability, which can strongly limit microbial activity and other ecosystem processes [40]. The low microbial biomass N:P ratios were primarily due to the low N in the study area, and the reduction in microbial biomass N:P ratios indicated that N-limitation was more serious with the increase in grazing intensity.

4.4. Linkages between Above- and Belowground Nutrients

The cycling of nutrients between soil and plants is mediated by microbes in ecosystems, including grasslands (Figure 7) [24]. Based on the correlation analysis, plant elements had no significant relationships with those in the soil (Table S1). This absence of correlation could be explained because plants primarily absorb the available forms of N and P, which account for only a small portion of the TN and TP. However, shoot N was significantly negatively correlated with RS and BS MBN (Figure 5a,b and Table S1). Generally plants release 10–30% of photosynthetic products into the soil [46], which includes energy and C and N resources for microbes. In this grazing system, the negative correlation between shoot N and MBN of RS and BS suggested that grazing exacerbated the competition between plants and microorganisms for N nutrition. The changes in the C, N, and P contents in the plant–soil–microbe system under different levels of grazing were then compared with those in the no grazing treatment (Figure 8). Notably, the shifts in N and P in the soil were small; whereas the changes in values for plants and microorganisms were larger (Figure 8). The changes were particularly notable under high grazing treatments, with N and P contents in plants increasing and those in microbes decreasing relative to the no grazing treatment. From the trend chart, we can get another message that the N and P contents of plants were more affected by grazing intensity than those in microbes.
In this study, the microbial biomass C:N ratios decreased with soil C:N ratios, and simultaneously, the shoot C:N ratios were negatively correlated with RS and BS microbial biomass C:N ratios. These results also suggested the competition between plants and microorganisms for N nutrition was exacerbated. Moreover, unlike a previous study in which the N:P ratios between soil and plant were positively correlated [24], in this study, the shoot C:N ratios increased linearly with the RS C:N ratios, and the C:P ratios of plant shoots and roots increased linearly with the RS and BS C:P ratios (Table S3). Because C is generally not a limiting factor for plant growth, these results demonstrated tight coupling of N and P between plant and soil. Similarly, the stoichiometric ratios under each grazing treatment were compared with those in the no grazing treatment for the whole system, and the soil stoichiometric ratios changed less under grazing than those for plants and microorganisms (Figure 9). The stoichiometric changes in plants and microorganisms included both increases and decreases relative to no grazing. Changes also occurred with the increase in grazing intensity, particularly under high grazing treatments (Figure 9). The C:N and C:P ratios in plants decreased, whereas the C:N and C:P ratios in microbes increased. Thus, the trend graphs of the shifts in N and P contents and C:N and C:P ratios in the plant–soil–microbe system also indicated that grazing exacerbated plant and microbial competition for nutrients, with the greatest impact under high grazing intensity (Figure 8 and Figure 9). However, N:P ratios in plants increased with the increase in grazing intensity, whereas those in the microorganisms only decreased slightly. The plants N:P ratios are more variable than those of microorganisms and soil, indicating that plants are more sensitive to grazing.

4.5. Role of the Rhizosphere in Nutrient Cycles

The rhizosphere is an active zone in the soil adjacent to plant roots in which microorganisms interact with root exudates [27,47,48]. The higher TC, TN, MBC and MBN in the RS than in the BS are consistent with general observations, although the TP content was lower in the RS than in the BS. That’s because that the root exudates released by plant roots consist of a complex of substances (i.e., sugars, amino acids, proteins, and so on), which increase the availability of nutrients and stimulate microorganism populations and activities in the rhizosphere [49,50,51]. Simultaneously, soil microbes affect plant growth via stimulating the production of exoenzymes that decompose soil organic matter and thereby increase soil nutrient availability to plants [27,51]. The higher soil P in BS than in RS was most likely because P is very easily immobilized in soil, and any P in the rhizosphere was likely rapidly consumed and not sufficiently replenished. We also found that no significant differences were observed in the EC, EN and EP ratios with the increase in grazing intensity (Table 1) which were consistent with those reported by Yang et al. (2018). Although the nutrient enrichment rate did not differ significantly with the grazing gradient, the rhizosphere was essential for the migration of soil nutrients from soil to plants.

5. Conclusions

Grazing decreased the C:N and C:P ratios of plant shoots. With leaf N:P ratios of <10 and >20 corresponding to N- and P-limitation, respectively, the results suggested that the meadow steppe in this study was an N-limited grassland ecosystem. TN and TP contents and C:N and C:P ratios of plants and microorganisms significantly changed when grazing intensity was greater than G0.46. Correlation results indicated that the coupling relationship of C:N ratios in plant–soil–microbial systems was tightly significant compared to C:P ratio and N:P ratio. The study showed that grazing exacerbated the competition between plant and microbial for nutrients, particularly at the intensity that is greater than G0.46. As an important terrestrial ecosystem in China, the sustainable development of grassland ecosystems is critical to the improvement of our environment. Our study gave the evidence that for the sustainability of grasslands in Inner Mongolia, N inputs need to be increased and high grazing intensities reduced in meadow steppe ecosystems, and the grazing load should be controlled within G0.46.

Supplementary Materials

The following are available online at https://www.mdpi.com/2071-1050/11/19/5226/s1, Table S1: Correlations between nutrients (C, N, P) of plants (shoots and roots) and those of rhizosphere and bulk soils and soil microbial biomass, Table S2: Correlations between nutrients (C, N, P) in soil and soil microbial biomass and between the nutrient stoichiometry of soil and soil microbial biomass (C:N, C:P, N:P), Table S3: Correlations for nutrient stoichiometry (C:N, C:P, N:P) between plants (shoots and roots) and rhizosphere and bulk soils and soil microbial biomass.

Author Contributions

J.C. conceived and designed the experiments; J.C. executed the experiments and measured the data; J.C. and R.Y. analyzed the data and wrote the paper; J.C., R.Y., X.C., Q.Y., Y.Z. (Yunlong Zhang) and C.N. revised the manuscript. Data curation, L.H.; Formal analysis, Y.Z. (Yongjuan Zhang); Funding acquisition, X.X.; Methodology, X.W.

Funding

This study was sponsored by the National Natural Science Foundation of China (41471093, 41671044, 31971769), the National Key Research and Development Program of China (2016YFC0500601, 2017YFE0104500, 2017YFC0503906), Fundamental Research Funds for Central Nonprofit Scientific Institutions (1610132018009, 1610132019031, 1010132019040), and the China Agriculture Research System (CARS-34).

Acknowledgments

We acknowledge the assistance of Xiaotong Jia, Minghui Jing, and Wei Zhou in the field and laboratory.

Conflicts of Interest

The authors declare no conflict of interest.

References

  1. Knapp, A.K.; Fay, P.A.; Blair, J.M.; Collins, S.L.; Smith, M.D.; Carlisle, J.D.; Harper, C.W.; Danner, B.T.; Lett, M.S.; McCarron, J.K. Rainfall variability, carbon cycling, and plant species diversity in a mesic grassland. Science 2002, 298, 2202–2205. [Google Scholar] [CrossRef] [PubMed]
  2. Reed, M.; Stringer, L.C. Climate Change and Desertification: Anticipating, Assessing & Adapting to Future Change in Drylands; Agropolis International: Montpellier, France, 2015. [Google Scholar]
  3. Eldridge, D.J.; Delgado-Baquerizo, M.; Travers, S.K.; Val, J.; Oliver, I. Do grazing intensity and herbivore type affect soil health? Insights from a semi-arid productivity gradient. J. Appl. Ecol. 2017, 54, 976–985. [Google Scholar] [CrossRef]
  4. McNaughton, S.J. Grazing as an optimization process: Grass-ungulate relationships in the serengeti. Am. Nat. 1979, 113, 691–703. [Google Scholar] [CrossRef]
  5. Zhou, G.Y.; Zhou, X.H.; He, Y.H.; Shao, J.J.; Hu, Z.H.; Liu, R.Q.; Zhou, H.M.; Hosseinibai, S. Grazing intensity significantly affects belowground carbon and nitrogen cycling in grassland ecosystems: A meta-analysis. Glob. Chang. Biol. 2017, 23, 1167–1179. [Google Scholar] [CrossRef] [PubMed]
  6. Yang, Z.A.; Zhu, Q.A.; Zhan, W.; Xu, Y.Y.; Zhu, E.X.; Gao, Y.H.; Li, S.Q.; Zheng, Q.Y.; Zhu, D.; He, Y.X.; et al. The linkage between vegetation and soil nutrients and their variation under different grazing intensities in an alpine meadow on the eastern Qinghai-Tibetan Plateau. Ecol. Eng. 2018, 110, 128–136. [Google Scholar] [CrossRef]
  7. Liu, S.J.; Yang, X.D.; Ives, A.R.; Feng, Z.L.; Sha, L.Q. Effects of seasonal and perennial grazing on soil fauna community and microbial biomass carbon in the subalpine meadows of Yunnan, Southwest China. Pedosphere 2017, 27, 371–379. [Google Scholar] [CrossRef]
  8. Tessema, Z.K.; de Boer, W.F.; Baars, R.M.T.; Prins, H.H.T. Changes in soil nutrients, vegetation structure and herbaceous biomass in response to grazing in a semi-arid savanna of Ethiopia. J. Arid Environ. 2011, 75, 662–670. [Google Scholar] [CrossRef]
  9. Sterner, R.W.; Elser, J.J. Ecological Stoichiometry: The Biology of Elements from Molecules to the Biosphere; Princeton University Press: Princeton, NJ, USA, 2002. [Google Scholar]
  10. Elser, J.J.; Sterner, R.W.; Galford, A.E.; Chrzanowski, T.H.; Findlay, D.L.; Mills, K.H.; Paterson, M.J.; Stainton, M.P.; Schindler, D.W. Pelagic C:N:P stoichiometry in a eutrophied lake: Responses to a whole-lake food-web manipulation. Ecosystems 2000, 3, 293–307. [Google Scholar] [CrossRef]
  11. Zeng, Y.L.; Fang, X.; Xiang, W.H.; Deng, X.W.; Peng, C.H. Stoichiometric and nutrient resorption characteristics of dominant tree species in subtropical Chinese forests. Ecol. Evol. 2017, 7, 11033–11043. [Google Scholar] [CrossRef] [Green Version]
  12. Yang, X.J.; Huang, Z.Y.; Zhang, K.L.; Cornelissen, J.H.C. C:N:P stoichiometry of artemisia species and close relatives across northern China: Unravelling effects of climate, soil and taxonomy. J. Ecol. 2015, 103, 1020–1031. [Google Scholar] [CrossRef]
  13. Zheng, S.X.; Ren, H.Y.; Li, W.H.; Lan, Z.C. Scale-dependent effects of grazing on plant C:N:P stoichiometry and linkages to ecosystem functioning in the Inner Mongolia grassland. PLoS ONE 2012, 7, e51750. [Google Scholar] [CrossRef] [PubMed]
  14. Elser, J.J.; Fagan, W.F.; Kerkhoff, A.J.; Swenson, N.G.; Enquist, B.J. Biological stoichiometry of plant production: Metabolism, scaling and ecological response to global change. New Phytol. 2010, 186, 593–608. [Google Scholar] [CrossRef]
  15. Batjes, N.H. Total carbon and nitrogen in the soils of the world. Eur. J. Soil Sci. 2014, 65, 10–21. [Google Scholar] [CrossRef]
  16. Fan, H.B.; Wu, J.P.; Liu, W.F.; Yuan, Y.H.; Hu, L.; Cai, Q.K. Linkages of plant and soil C:N:P stoichiometry and their relationships to forest growth in subtropical plantations. Plant Soil 2015, 392, 127–138. [Google Scholar] [CrossRef]
  17. Pineiro, G.; Paruelo, J.M.; Oesterheld, M. Potential long-term impacts of livestock introduction on carbon and nitrogen cycling in grasslands of southern South America. Glob. Chang. Biol. 2006, 12, 1267–1284. [Google Scholar] [CrossRef]
  18. Heyburn, J.; McKenzie, P.; Crawley, M.J.; Fornara, D.A. Effects of grassland management on plant C:N:P stoichiometry: Implications for soil element cycling and storage. Ecosphere 2017, 8, e01963. [Google Scholar] [CrossRef]
  19. Bai, Y.F.; Wu, J.G.; Clark, C.M.; Pan, Q.M.; Zhang, L.X.; Chen, S.P.; Wang, Q.B.; Han, X.G. Grazing alters ecosystem functioning and C:N:P stoichiometry of grasslands along a regional precipitation gradient. J. Appl. Ecol. 2012, 49, 1204–1215. [Google Scholar] [CrossRef]
  20. Bardgett, R.D.; Wardle, D.A. Herbivore-mediated linkages between aboveground and belowground communities. Ecology 2003, 84, 2258–2268. [Google Scholar] [CrossRef]
  21. Frank, D.A. Ungulate and topographic control of nitrogeN: Phosphorus stoichiometry in a temperate grassland; soils, plants and mineralization rates. Oikos 2008, 117, 591–601. [Google Scholar] [CrossRef]
  22. Zhang, J.H.; Zhao, N.; Liu, C.C.; Yang, H.; Li, M.L.; Yu, G.C.; Wilcox, K.; Yu, Q.; He, N.P. C:N:P stoichiometry in China’s forests: From organs to ecosystems. Funct. Ecol. 2018, 32, 50–60. [Google Scholar] [CrossRef]
  23. Gusewell, S. N:P ratios in terrestrial plants: Variation and functional significance. New Phytol. 2004, 164, 243–266. [Google Scholar] [CrossRef]
  24. Bell, C.; Carrillo, Y.; Boot, C.M.; Rocca, J.D.; Pendall, E.; Wallenstein, M.D. Rhizosphere stoichiometry: Are C:N:P ratios of plants, soils, and enzymes conserved at the plant species-level? New Phytol. 2014, 201, 505–517. [Google Scholar] [CrossRef]
  25. Yan, R.R.; Tang, H.J.; Xin, X.P.; Chen, B.R.; Murray, P.J.; Yan, Y.C.; Wang, X.; Yang, G.X. Grazing intensity and driving factors affect soil nitrous oxide fluxes during the growing seasons in the Hulunber meadow steppe of China. Environ. Res. Lett. 2016, 11, 054004. [Google Scholar] [CrossRef] [Green Version]
  26. Xu, D.W.; Chen, B.R.; Yan, R.R.; Yan, Y.C.; Sun, X.B.; Xu, L.J.; Xin, X.P. Quantitative monitoring of grazing intensity in the temperate meadow steppe based on remote sensing data. Int. J. Remote Sens. 2018, 40, 2227–2242. [Google Scholar] [CrossRef]
  27. Chaudhary, D.R.; Gautam, R.K.; Yousuf, B.; Mishra, A.; Jha, B. Nutrients, microbial community structure and functional gene abundance of rhizosphere and bulk soils of halophytes. Appl. Soil Ecol. 2015, 91, 16–26. [Google Scholar] [CrossRef]
  28. Baron, V.S.; Mapfumo, E.; Dick, A.C.; Naeth, M.A.; Okine, E.K.; Chanasyk, D.S. Grazing intensity impacts on pasture carbon and nitrogen flow. J. Range Manag. 2002, 55, 535–541. [Google Scholar] [CrossRef]
  29. Han, G.D.; Hao, X.Y.; Zhao, M.L.; Wang, M.J.; Ellert, B.H.; Willms, W.; Wang, M.J. Effect of grazing intensity on carbon and nitrogen in soil and vegetation in a meadow steppe in Inner Mongolia. Agric. Ecosyst. Environ. 2008, 125, 21–32. [Google Scholar] [CrossRef]
  30. Jiang, L.L.; Wang, S.P.; Pang, Z.; Wang, C.S.; Kardol, P.; Zhou, X.Q.; Rui, Y.C.; Lan, Z.C.; Wang, Y.F.; Xu, X.L. Grazing modifies inorganic and organic nitrogen uptake by coexisting plant species in alpine grassland. Biol. Fertil. Soils 2016, 52, 211–221. [Google Scholar] [CrossRef]
  31. Elser, J.J.; Acharya, K.; Kyle, M.; Cotner, J.; Makino, W.; Markow, T.; Watts, T.; Hobbie, S.; Fagan, W.; Schade, J.; et al. Growth rate-stoichiometry couplings in diverse biota. Ecol. Lett. 2003, 6, 936–943. [Google Scholar] [CrossRef] [Green Version]
  32. Greenwood, K.L.; Hutchinson, K.J. Root characteristics of temperate pasture in New South Wales after grazing at three stocking rates for 30 years. Grass Forage Sci. 1998, 53, 120–128. [Google Scholar] [CrossRef]
  33. Fan, G.Y.; Zhang, J.N.; Zhang, Y.S.; Li, G.; Wang, Q.; Yang, D.L. Effects of grazing on plant root distribution and soil physicochemical properties in Stipa baicalensis grassland. Chin. J. Ecol. 2010, 29, 1715–1721. [Google Scholar]
  34. Pregitzer, K.S.; Laskowski, M.J.; Burton, A.J.; Lessard, V.C.; Zak, D.R. Variation in sugar maple root respiration with root diameter and soil depth. Tree Physiol. 1998, 18, 665–670. [Google Scholar] [CrossRef] [Green Version]
  35. Li, X.Z.; Chen, Z.Z. Influences of stocking rates on C, N and P contents in plant-soil system. Acta Agrestia Sin. 1998, 6, 90–98. [Google Scholar]
  36. Bagchi, S.; Ritchie, M.E. Introduced grazers can restrict potential soil carbon sequestration through impacts on plant community composition. Ecol. Lett. 2010, 13, 959–968. [Google Scholar] [CrossRef]
  37. McSherry, M.E.; Ritchie, M.E. Effects of grazing on grassland soil carbon: A global review. Glob. Chang. Biol. 2013, 19, 1347–1357. [Google Scholar] [CrossRef]
  38. Snyman, H.A.; du Preez, C.C. Rangeland degradation in a semi-arid South Africa—II: Influence on soil quality. J. Arid Environ. 2005, 60, 483–507. [Google Scholar] [CrossRef]
  39. García-Oliva, F.; Tapia-Torres, Y.; Montiel-Gonzalez, C.; Perroni-Ventura, Y. Carbon, Nitrogen, and Phosphorus in Terrestrial Pools: Where Are the Main Nutrients Located in the Grasslands of the Cuatro Ciénegas Basin? In Ecosystem Ecology and Geochemistry of Cuatro Cienegas; Springer: Berlin/Heidelberg, Germany, 2018; pp. 1–13. [Google Scholar]
  40. Cleveland, C.C.; Liptzin, D. C:N:P stoichiometry in soil: Is there a “redfield ratio” for the microbial biomass? Biogeochemistry 2007, 85, 235–252. [Google Scholar] [CrossRef]
  41. Xu, X.F.; Thornton, P.E.; Post, W.M. A global analysis of soil microbial biomass carbon, nitrogen and phosphorus in terrestrial ecosystems. Glob. Ecol. Biogeogr. 2013, 22, 737–749. [Google Scholar] [CrossRef]
  42. Fanin, N.; Fromin, N.; Buatois, B.; Hättenschwiler, S. An experimental test of the hypothesis of non-homeostatic consumer stoichiometry in a plant litter—Microbe system. Ecol. Lett. 2013, 16, 764–772. [Google Scholar] [CrossRef]
  43. Zimmerman, A.E.; Allison, S.D.; Martiny, A.C. Phylogenetic constraints on elemental stoichiometry and resource allocation in heterotrophic marine bacteria. Environ. Microbiol. 2014, 16, 1398–1410. [Google Scholar] [CrossRef]
  44. Chen, Y.L.; Chen, L.Y.; Peng, Y.F.; Ding, J.Z.; Li, F.; Yang, G.B.; Kou, D.; Liu, L.; Fang, K.; Zhang, B.B.; et al. Linking microbial C:N:P stoichiometry to microbial community and abiotic factors along a 3500-km grassland transect on the Tibetan Plateau. Glob. Ecol. Biogeogr. 2016, 25, 1416–1427. [Google Scholar] [CrossRef]
  45. Xun, W.B.; Yan, R.R.; Ren, Y.; Jin, D.Y.; Xiong, W.; Zhang, G.S.; Cui, Z.L.; Xin, X.P.; Zhang, R.F. Grazing-induced microbiome alterations drive soil organic carbon turnover and productivity in meadow steppe. Microbiome 2018, 6, 170. [Google Scholar] [CrossRef]
  46. Bowen, G.D.; Rovira, A.D. The rhizosphere and its management to improve plant growth. Adv. Agron. 1999, 66, 1–102. [Google Scholar]
  47. Murphy, C.A.; Foster, B.L.; Gao, C. Temporal dynamics in rhizosphere bacterial communities of three perennial grassland species. Agronomy 2016, 6, 17. [Google Scholar] [CrossRef]
  48. Zhang, C.; Liu, G.B.; Xue, S.; Wang, G.L.; Wang, J.; Song, Z.L. Effects of rhizosphere interactions of grass interspecies on the soil microbial properties during the natural succession in the loess plateau. Eur. J. Soil Biol. 2018, 85, 79–88. [Google Scholar] [CrossRef]
  49. Uren, N.C. Types, amounts, and possible functions of compounds released into the rhizosphere by soil-grown plants. In The Rhizosphere; CRC Press: Boca Raton, FL, USA, 2000; pp. 35–56. [Google Scholar]
  50. Raaijmakers, J.M.; Paulitz, T.C.; Steinberg, C.; Alabouvette, C.; Moenne-Loccoz, Y. The rhizosphere: A playground and battlefield for soilborne pathogens and beneficial microorganisms. Plant Soil 2009, 321, 341–361. [Google Scholar] [CrossRef]
  51. Aira, M.; Gomez-Brandon, M.; Lazcano, C.; Baath, E.; Dominguez, J. Plant genotype strongly modifies the structure and growth of maize rhizosphere microbial communities. Soil Biol. Biochem. 2010, 42, 2276–2281. [Google Scholar] [CrossRef]
Figure 1. The data of rainfall and temperature for the study area in Inner Mongolia, China.
Sustainability 11 05226 g001
Figure 2. Geographical location of the study site with the experimental design and plot layout. The six grazing treatments (n = 3) were set at stocking densities of G0.00, G0.23, G0.34, G0.46, G0.69, andG0.92 AU ha−1 (where 1 AU = 500 kg of adult cattle). The stocking rates were achieved using 0, 2 (G0.23), 3 (G0.34), 4 (G0.46), 6 (G0.69), and 8 (G0.92) young cows (250–300 kg) per plot.
Sustainability 11 05226 g002
Figure 3. Effects of six levels of grazing intensities (G0.00, G0.23, G0.34, G0.46, G0.69, and G0.92 AU ha−1) on (a) total carbon (g kg−1), (b) total nitrogen (g kg−1), and (c) total phosphorous (g kg−1) concentrations in plants (shoots, black bars; roots, white bars); on (d) total carbon (g kg−1), (e) total nitrogen (g kg−1), and (f) total phosphorous (g kg−1) concentrations in soils (RS, rhizosphere soil, black bars; BS, bulk soil, white bars); and on (g) soil microbial biomass carbon (mg kg−1), (h) nitrogen (mg kg−1), and (i) phosphorous (mg kg−1) (RS, rhizosphere soil, black bars; BS, bulk soil, white bars). Different uppercase letters indicate significant differences between different positions (shoots vs. roots or rhizosphere soil vs. bulk soil), and different lowercase letters indicate significant differences between different grazing intensities. P-values of the ANOVA for grazing intensity (G), position (P), and their interaction (G * P) are indicated: * P ≤ 0.05; ** P ≤ 0.01; ns, not significant.
Sustainability 11 05226 g003
Figure 4. Effects of six levels of grazing intensity (G0.00, G0.23, G0.34, G0.46, G0.69, and G0.92 AU ha−1) on (a) the C:N, (b) C:P, and (c) N:P ratios of plants (shoots, solid lines; roots, dashed lines); on the (d) C:N, (e) C:P, and (f) N:P ratios of soil (RS, rhizosphere soil, solid lines; BS, bulk soil, dashed lines); and on (g) the C:N, (h) C:P, and (i) N:P ratios in soil microbial biomass (MB) (RS, rhizosphere soil, solid lines; BS, bulk soil, dashed lines). Different uppercase letters indicate significant differences between different positions (shoots vs. roots or rhizosphere soil vs. bulk soil), and different lowercase letters indicate significant differences between different grazing intensities. P-values of the ANOVA for grazing intensity (G), position (P), and their interactions (G * P) are indicated: * P ≤ 0.05; ** P ≤ 0.01; ns, not significant.
Sustainability 11 05226 g004
Figure 5. Regressions (y = ax + b, R2 = coefficient of determination) of the concentrations of shoot N and soil microbial biomass N (MBN) (mg kg−1) in (a) rhizosphere soil and (b) bulk soil and of the concentrations of (c) soil microbial biomass C(MBC) (mg kg−1) and soil C (g kg−1) and (d) soil microbial biomass N (MBN) (mg kg−1) and soil N (g kg−1). Regressions are significant at P ≤ 0.05.
Sustainability 11 05226 g005
Figure 6. Regressions (y = ax + b, R2 = coefficient of determination) between stoichiometric characteristics in the plant–soil–microbe system. (a) Shoot C:N and rhizosphere soil C:N; (b) shoot C:N and rhizosphere soil microbial biomass C:N(MB C:N); (c) shoot C:N and bulk soil microbial biomass C:N(MB C:N); (d) shoot C:P and rhizosphere soil C:P; (e) shoot C:P and bulk soil C:P; (f) root C:P and rhizosphere soil C:P; (g) root C:P and bulk soil C:P; (i) soil C:N and microbial biomass C:N(MB C:N); (h) soil N:P and microbial biomass N:P(MB N:P). Regressions are significant at P ≤ 0.05.
Sustainability 11 05226 g006
Figure 7. Conceptual model of the interactions in a grazed plant–soil–microbial system.
Sustainability 11 05226 g007
Figure 8. Trend chart of the changes (%) in (a) C, (b) N, and (c) P contents at each level of grazing intensity (G0.23, G0.34, G0.46, G0.69, and G0.92 AU ha−1) relative to the no grazing treatment (G0.00) in plants (shoots and roots), soil (RS, rhizosphere; BS, bulk soil), and soil microbial biomass (MB).
Sustainability 11 05226 g008
Figure 9. Trend chart of the stoichiometric changes (%) in (a) C:N ratio, (b) C:P ratio, and (c) N:P ratio at each level of grazing intensity (G0.23, G0.34, G0.46, G0.69, and G0.92 AU ha−1) relative to the no grazing treatment (G0.00) in plants (shoots and roots), soil (RS, rhizosphere; BS, bulk soil), and soil microbial biomass (MB).
Sustainability 11 05226 g009
Table 1. Rhizosphere enrichment ratios (rhizosphere soil/bulk soil) of total carbon (EC), total nitrogen (EN), and total phosphorous (EP) under different grazing intensities (G0.00, G0.23, G0.34, G0.46, G0.69, and G0.92 AU ha−1).
G0.00G0.23G0.34G0.46G0.69G0.92
EC1.15 ± 0.05a1.12 ± 0.04a1.16 ± 0.06a1.20 ± 0.09a1.19 ± 0.02a1.17 ± 0.02a
EN1.17 ± 0.06a1.20 ± 0.04a1.20 ± 0.04a1.24 ± 0.08a1.22 ± 0.03a1.25 ± 0.03a
EP−0.88 ± 0.01a−0.89 ± 0.05a−0.89 ± 0.01a−0.90 ± 0.02a−0.86 ± 0.08a−0.90 ± 0.09a
Values are the mean ± SE (n = 3). Different letters indicate a significant difference between grazing levels.

