Sustainability and Environmental Inequality: Effects of Animal Husbandry Pollution in China

School of Maritime Economics and Management, Dalian Maritime University, Dalian 116026, China
*
Author to whom correspondence should be addressed.
Sustainability 2019, 11(17), 4576; https://doi.org/10.3390/su11174576
Submission received: 4 August 2019
/
Revised: 18 August 2019
/
Accepted: 21 August 2019
/
Published: 23 August 2019
(This article belongs to the Special Issue Sustainable Livestock Production)
Abstract
:Environmental inequality in animal husbandry is an important issue that matters in sustainable livestock production and environmental sustainability. In this context, the objective of this study is to measure and analyze the chemical oxygen demand (COD) discharge inequality from animal husbandry in the Liaoning province in China, as a case study in environmental inequality. Using the pollutant discharge coefficient method and environmental inequality indices, the study looks specifically at the impacts on unequal distribution and unequal economic efficiency in Liaoning in the period 2000 to 2016. The study explores the determinants of COD discharge inequality by constructing panel threshold regression models. The major findings are as follows. First, there is COD discharge inequality in distribution and in economic efficiency in Liaoning, and these were not reduced over time, despite a decline in the absolute quantity of COD discharge after 2013. Second, the impact of COD discharge inequality in economic efficiency lasted longer and was more serious across Liaoning compared with COD discharge inequality in distribution. Third, the quantitative upgrading of the agricultural industrial structure did not significantly reduce COD discharge inequality, and even led to a rise in inequality, especially in terms of economic efficiency. Ultimately, regional economic development turned out to be the key factor in inequality reduction. In addition, improvement in public fiscal support for science and technology also led to greater reduction in inequality.
1. Introduction
Environmental inequality is an important theme interconnected with sustainability. Its main focus is on the process of distributing the benefits and costs of improving environmental quality across the members of society. According to the Living Planet Report 2014 released by the World Wide Fund for Nature and other international organizations, regional equality imbalance is one of the severe challenges facing the earth [1]. In a resource-constrained world, equitable distribution is a central consideration not only for long-term economic and social sustainability, but also for ecological sustainability. Thus, the question of how to reduce environmental inequality to contribute to sustainability has become a core concern. This concern is highlighted in the 10th goal of the 2030 Agenda for Sustainable Development adopted in 2015 at the UN summit, namely, reducing inequality within and among countries [2]. As the burdens of pollution are not shared equally across the globe, they can lead to a loss of social welfare [3]. Thus, regional differences in the environmental inequality of pollution emissions need to be assessed not only in terms of absolute quantity, but also in terms of compatibility with local social and economic development levels. Therefore, the measurement of the influence factors of environmental inequality has become an important topic in sustainability research.
The interest in environmental inequality began with the environmental justice movement. This movement came about in response to a desire to fight against the unequal distribution of uncontrolled toxic waste in African American communities in the 1980s [4,5,6]. As scholars became aware of environmental inequality, they began to consider it a form of environmental racism [7,8]. Initially, the concepts of class and race were the academic focus of environmental inequality [9,10]. More recently, the connotations of environmental inequality have been enhanced, and the scope of the search expanded [11,12,13,14]. Although continuously evolving, the uneven allocation of environmental benefits and costs remains the main cause of environmental inequality with research paradigms providing a reference for its study [15,16,17].
The geographic distribution of the environmental burden has been investigated mainly from the environmental inequality perspective [18,19]. According to these studies, poverty tends to be more prevalent in or proximal to areas characterized by higher levels of environmental pollution. For example, Walker et al. examine the distribution of sites within the Industrial Pollution Control regime and provide evidence in England of socially unequal distribution [20]. Padilla et al. find that environmental inequality is related to the historical socioeconomic composition of cities and their evolution [21]. Rüttenauer emphasizes the importance of spatial clustering processes in environmental inequality [22].
The measurement of environmental inequality has always been an ongoing concern in this field. According to Boyce et al. [3], “no single indicator is sufficient for addressing the entire range of equity concerns.” The Gini coefficient, measures of entropy, and their improved forms have been used widely to sort individuals based on inequality [23,24,25,26]. More recent research has discarded the traditional methods of measuring economic inequality and instead considered more social economic factors [27,28,29]. Notably, research on environmental inequality has concentrated on air pollution and industrial pollution, and related research on water pollution or agricultural pollution has been scarce [30,31,32].
As a main sector of agriculture, animal husbandry is crucial to the socioeconomic development of many developing countries in Asia, especially China. With the continuous improvement in its economic level, demand for meat, eggs, milk, and other animal products has been increasing, and animal husbandry has become a pillar industry. The Liaoning province is one of China’s major areas for animal breeding and products. Since entering the 21st century, the growth rate of animal husbandry in Liaoning has been accelerating, benefiting from the optimization of and upgrades to the agriculture industrial structure. However, this sector may impose negative externalities (uncompensated costs) upon society through environmental pollution and other damage to the environment, an increased incidence of foodborne disease as well as the poor welfare experienced by intensively reared farm animals [33,34,35,36]. Among these negative externalities, sometimes referred to as “hidden costs” [34], waste from this industry is posing a serious threat to sustainability. Due to animal husbandry’s substantial pollutant discharge and low treatment rate of sewage, it has become a dominant cause of regional water pollution. To achieve sustainability, China has swiftly and steadily shifted from the blind pursuit of an increase in its gross domestic product (GDP) to a philosophy of balanced growth, known as ecological civilization. Thus, the issue of environmental inequality in animal husbandry in Liaoning province is a noteworthy example to investigate trends in inequality, the effects over time, as well as how currently unacceptable levels of water pollution can be overcome. The key to ensuring sustainability is to strike a balance between large-scale livestock and the poultry industry, responding to society’s rapid economic growth, and the maintenance of resilient agroecosystems.
Driven by the aforementioned concerns, the objective of this study is to measure environmental inequality in chemical oxygen demand (COD) discharge from animal husbandry to investigate, as a case example, the nonlinear effect of the agricultural industry structure on environmental inequality in Liaoning. Furthermore, we examine whether there are different effects on environmental inequality under the differing economic development levels of the cities in the province.
The remainder of the paper is structured as follows. Section 2 describes methods to measure regional COD discharge, the environmental inequality from animal husbandry, and the econometric method for the empirical study; Section 3 describes the study area and data source; Section 4 analyzes the determinants of regional environmental inequality; and Section 5 discusses the main findings and summarizes the conclusions.
2. Methodology
This section describes the COD discharge estimations, environmental inequality measures, and threshold regression methods we used to measure and study the factors influencing the environmental inequality of animal husbandry in Liaoning province. First, we describe the pollutant discharge coefficient method and COD discharge estimation. Second, we describe the equitable distribution index (EDI) and economic efficiency index (EEI) that measure COD discharge inequality. Last, we describe our panel threshold models.
2.1. Estimation Method of Pollutant Discharged from the Animal Husbandry
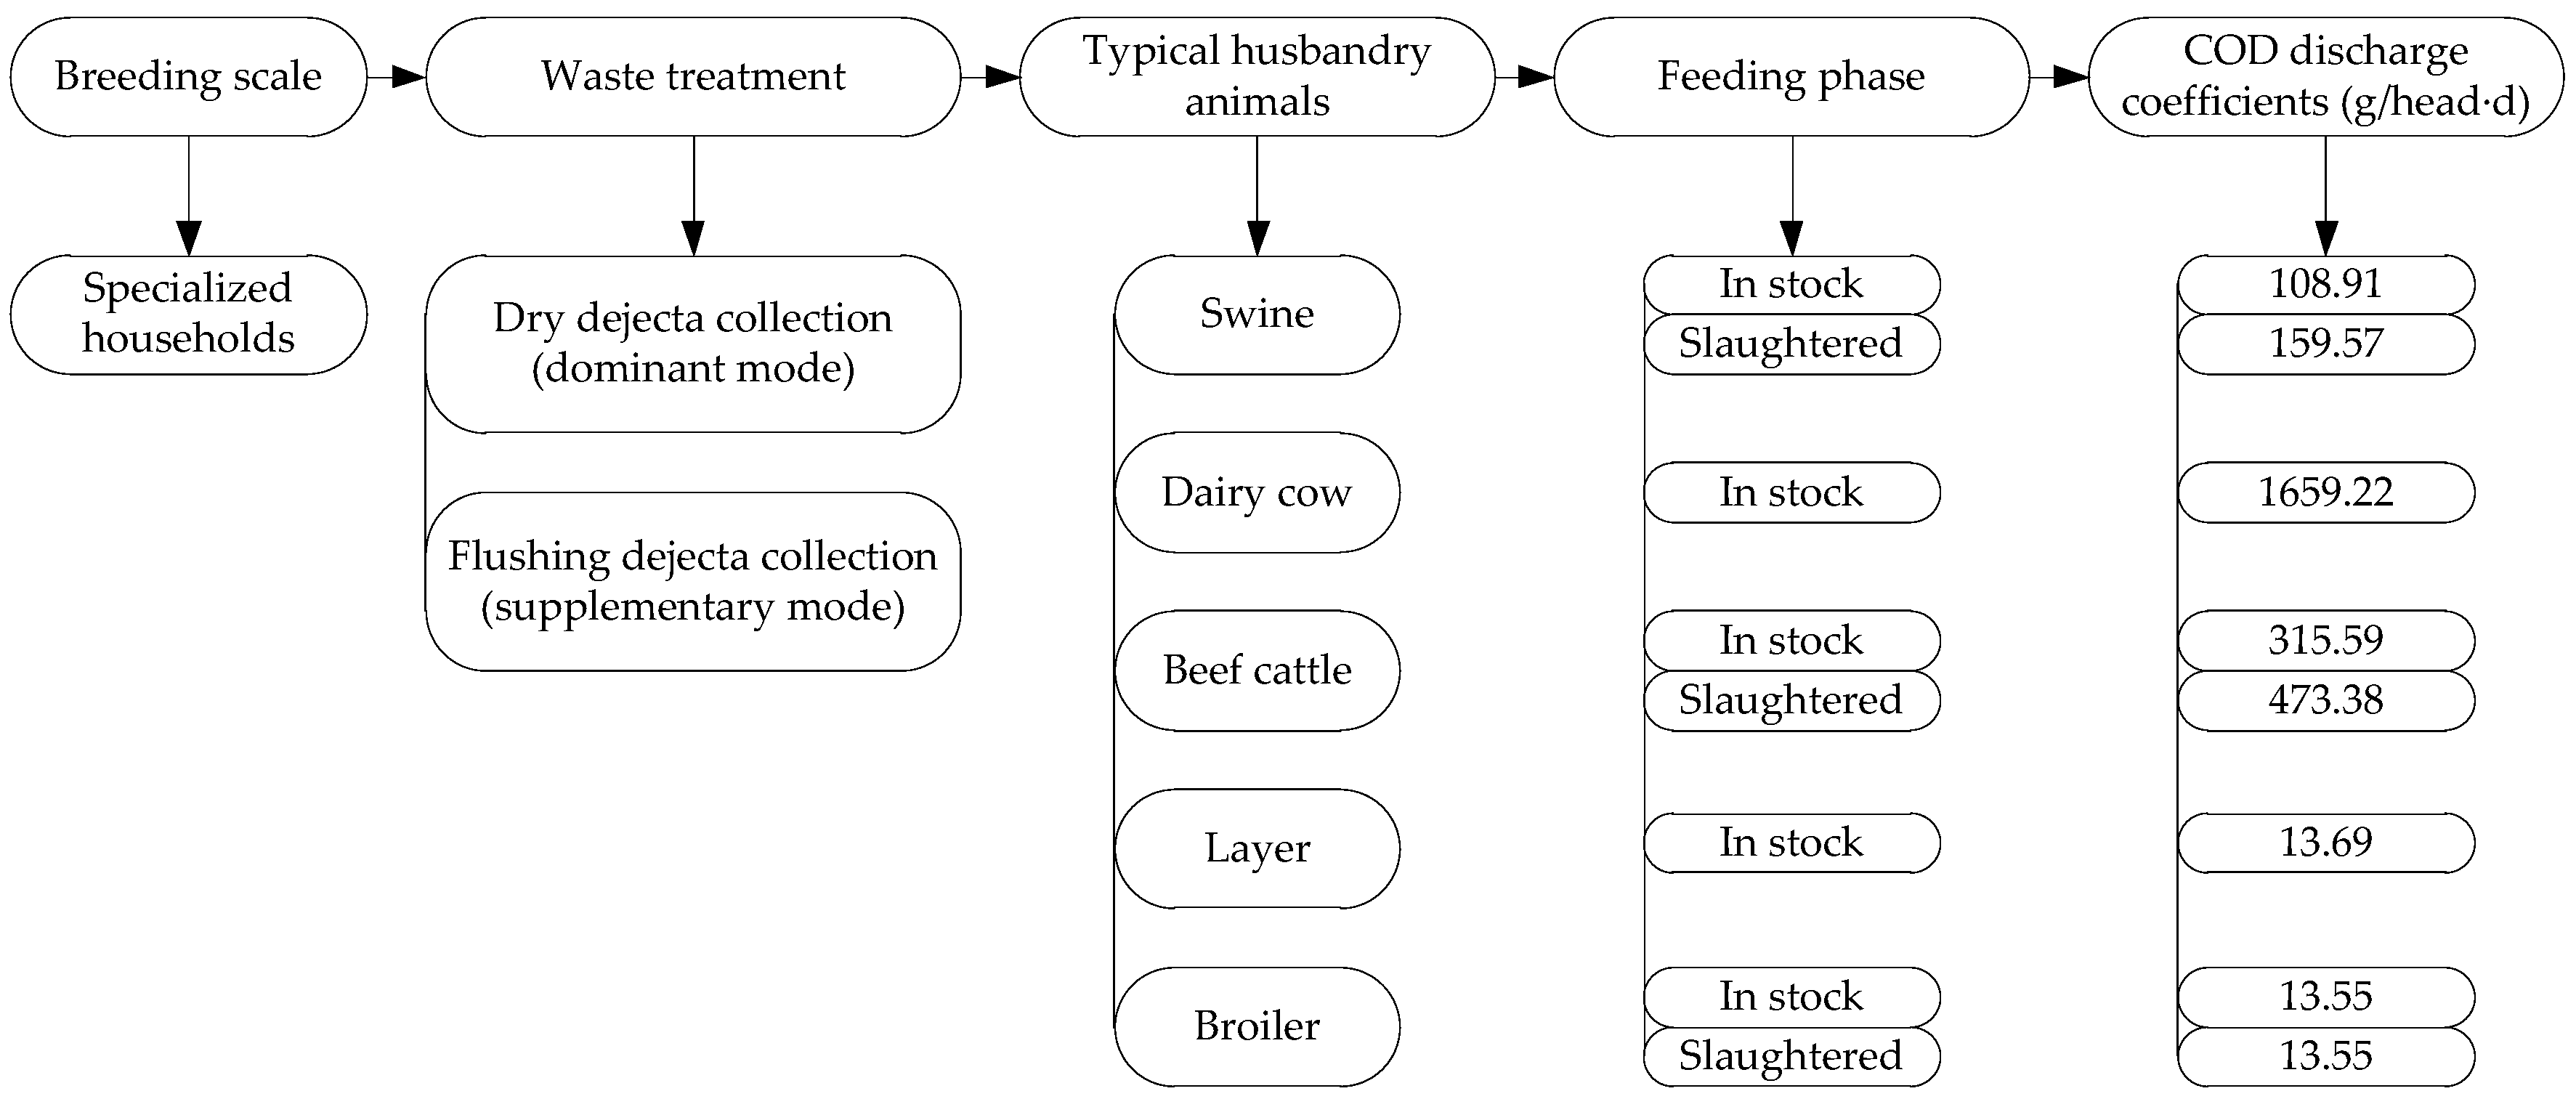
It is difficult to precisely calculate the pollutants discharged from animal husbandry through monitoring or concentrated sampling due to their dispersity, randomness, and complexity. The estimation of the main pollutants requires parameterizing the impact factors. COD is a comprehensive index reflecting the pollution degree of organic matter in the water. The high content of COD leads to oxygen deprivation and death of aquatic organisms, and water quality degradation [37]. It is one of the important indexes in water monitoring. According to the 2018 Report on the State of the Ecology and Environment in China, COD was one of the main pollution indicators for assessing 194 monitoring sections of the rivers flowing into the sea [38]. In addition, for more than a decade, COD has been a main target for emission reduction in China’s five-year plans. Studies revealed that livestock production contributed to high concentration of COD in waterbodies [37,39]. Wang et al. indicated that livestock industry was one of the main sources of COD discharge of the Liaohe River Basin in 2010, accounting for 34% of the total pollution loads [37]. Hence, the amount of COD discharged is chosen as the main environmental indicator to estimate the pollution emissions of animal husbandry. The pollutant discharge coefficient method is adopted for COD discharge estimation because of its validity, efficiency, and feasibility. Pollutant discharge coefficients are the most important and basic data in environmental management systems in China. The pollution sources of the industries involved are detailed in classification and pollutants are relatively complete on variety. The results of the first national census of domestic source pollution provide reference and technical support for extracting pollutant discharge coefficient. The pollutant discharge coefficient method is widely applied to calculation of pollutant source. The COD discharge estimation is calculated based on the number of typical husbandry animals, extracting the corresponding discharge coefficients. A discharge coefficient of a certain pollutant refers to the amount of pollutant discharged into the environment by an individual husbandry animal under typical conditions of normal breeding and management. It is a comprehensive parameter determined through statistical data, field research, and expert experience. Based on relevant research on the pollutant discharge coefficient method [40,41], annual COD discharge is calculated as follows.
2.2. Environmental Inequality Measures
At present, there are three major opinions on the definition of environmental inequality: (1) Inequality in right to a clean and safe environment for individuals and communities; (2) unfair treatment in in environmental policy; (3) disproportionate burden of pollution according to economic outcomes and other factors for countries and regions [7,15]. Based on the third opinion, this study defines environmental inequality as the discordance in discharge of pollutants and regional conditions. Environmental inequality in animal husbandry considers the population in different regions, the geographic area, the economic development level, and the economic efficiency, among other elements [42,43,44]. Therefore, this study selects two indicators to measure the COD discharge inequality from animal husbandry in terms of unequal distribution and unequal economic efficiency, namely, the equitable distribution index (EDI) and the economic efficiency index (EEI).
2.2.1. Equitable Distribution Index
Equal rights for pollution emission and reasonable allocation of social welfare are important concepts of environmental equality. The inequality in the regional distribution of pollution emissions is influenced by geographical area and population. The degree of regional environmental inequality in COD discharge distribution is measured by the EDI, which has been widely used in the literature [42,43,44]. This study applies the EDI as an evaluation indicator for distribution inequality:
where EDIit represents the environmental inequality in the distribution of city i in year t: The greater the value, the better the equality, and vice versa. Ypit and Ypt represent the per capita COD discharge from animal husbandry of city i and of Liaoning province in year t, respectively. Ygit and Ygt represent the COD discharge density from animal husbandry of city i and Liaoning province in year t, respectively. A and B are weight coefficients in a range from 0 to 1. According to studies on EDI, index weights are appraised by authorities in three alternatives: 70%/30%, 60%/40%, and 50%/50% [43]. In this study, the separate weighting factors A and B are assigned as 70% and 30%, respectively, as more pollution tends to be released in heavily populated areas. According to the principle of environmental equality, if the per capita COD discharge of a prefecture-level city is higher than that of the whole province, it damages the environment of the other cities and undermines the equitable basis for pollution emissions. This principle also applies to the analyses of the index of COD discharge density.
2.2.2. Economic Efficiency Index
The rapid growth in the COD discharge from animal husbandry closely relates to the development of the agricultural economy, specifically that of animal husbandry. Generally, the COD discharge is considered an undesirable output of animal husbandry. In essence, the comparison between contribution to gross output value and COD discharge from animal husbandry is a reflection of economic efficiency. The degree of regional environmental inequality in terms of economic efficiency is measured by the EEI, which has been widely used in the literature [42,43,44]. This study applies the EEI as an indicator of efficiency inequality:
where EEIit represents the environmental inequality in the economic efficiency of city i in year t: The greater the value, the better the equality, and vice versa. Git and Gt denote the gross output value of animal husbandry of city i and Liaoning province, respectively, in year t. Pit and Pt denote the COD discharge from animal husbandry in city i and Liaoning province, respectively, in year t. If the contribution rate of COD discharge is greater than that of the gross value in city i, there is low efficiency in animal husbandry, which encroaches on the environmental interests of the other cities, and vice versa.
2.3. Panel Threshold Model
Due to the large gap in economic development level, there were significant differences in both industrial agriculture structure and environmental inequality among prefecture-level cities in Liaoning province. It is necessary to analyze the role of economic development level thresholds in the relationship between COD discharge inequality from animal husbandry and industrial agriculture structure. Previous studies have adopted various exogenous criteria to partition the sample, resulting in misleading inferences [45]. To examine the non-uniform relation, panel threshold regression models are constructed. They allow the data to endogenously generate several regimes identified by the thresholds, instead of subjective judgments by researchers [46]. This empirical study includes three steps. The first step is to verify whether the agricultural industry structure has a threshold effect on the environmental equality in the COD discharge from animal husbandry. The second is to identify the possible threshold value of the economic development level and divide the cities into different economic development stages according to the threshold value. The third is to use panel threshold regression to estimate the impact of the agricultural industry structure on environmental equality at different economic development stages. To identify the possible economic development threshold level, traditionally, dummy variables are artificially set according to different economic development levels; however, this is too subjective. The current mainstream method is to use the panel threshold model proposed by Hansen in 1999, which identifies the critical threshold value endogenously and avoids bias caused by artificially setting dummy variables [47,48,49]. Additionally, to avoid missing possible multiple thresholds, Hansen assumes the existence of one threshold, and then gradually expands to two or more thresholds [47,49]. The econometric equations of environmental inequality for COD discharge from animal husbandry are as follows:
where i denotes the individual city, and t denotes time. The dependent variable EDIit denotes the COD discharge inequality in distribution of animal husbandry. The dependent variable EEIit denotes the COD discharge inequality in economic efficiency of animal husbandry. The key independent variable ISAit is the ratio of the gross output value of animal husbandry to that of agriculture, representing the industrial structure of agriculture. The per capita GDP of the city (PGDP) is selected as the threshold variable and denoted as Qit. It represents the regional economic development level. I(∙) is the indicator function. Depending on the comparison of the threshold variable Qit result and the threshold δn to be estimated, the observations are divided into different sections. The sections are distinguished by different regression coefficients [47]. In this study, one index is selected as the control variable, namely, the ratio of science and research expenditure to public finance expenditure (FST). This index represents the level of public fiscal support for science and technology.
3. Study Area and Data
3.1. Study Area
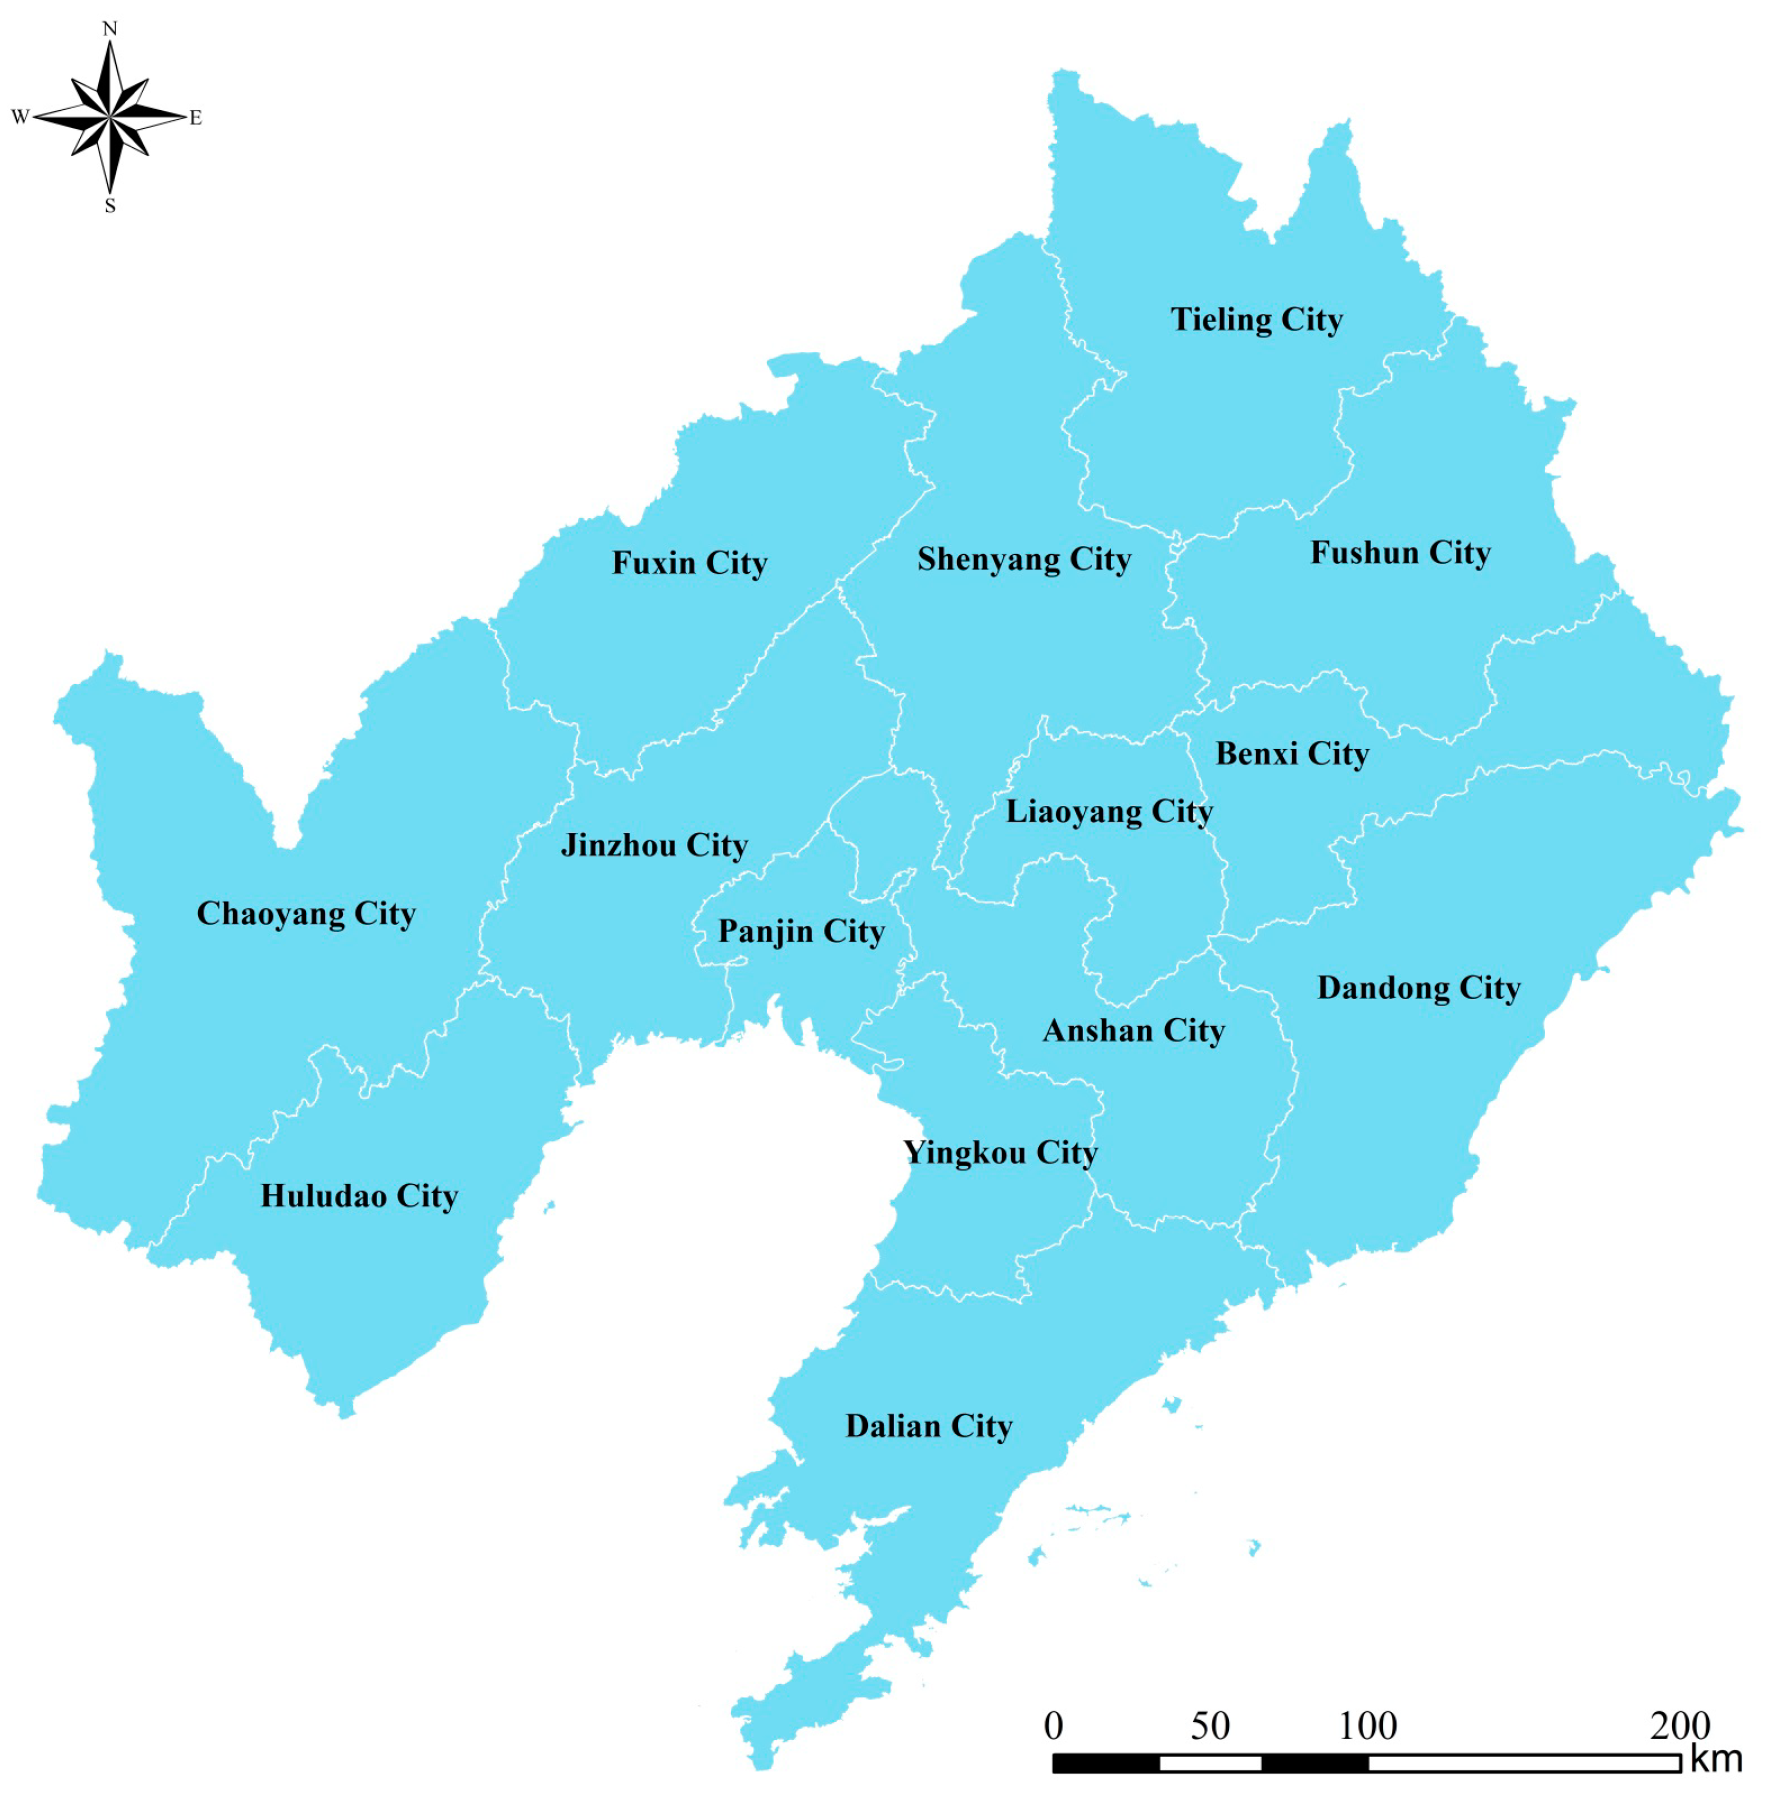
Liaoning province is one of the major bases of animal breeding and products in northeastern China. Liaoning includes 14 prefecture-level cities, namely, Shenyang (SY), Dalian (DL), Anshan (AS), Fushun (FS), Benxi (BX), Dandong (DD), Jinzhou (JZ), Yingkou (YK), Fuxin (FX), Liaoyang (LY), Panjin (PJ), Tieling (TL), Chaoyang (CY), and Huludao (HLD). Figure 2 shows the spatial distribution of these cities. After the year 2000, Liaoning entered a rapid development stage in its agricultural economy. The total output value of its agriculture exceeded 100 billion yuan in 2001 and 400 billion yuan in 2012. In terms of economic scale, the gross output value of the livestock and poultry sector in Liaoning increased from 30.420 billion yuan in 2000 to 145.608 billion yuan in 2016, with an average annual growth rate of 10.281%. In terms of industrial structure, the animal husbandry proportion increased from 31.284% in 2000 to 34.362% in 2016, which was much higher than the national average during the period. In 2008, the output contribution rate of animal husbandry exceeded that of the planting industry for the first time and reached the maximum value of 41.823% in 2009. In animal husbandry, large livestock numbers maintained a relatively steady growth in the period 2000–2016. The comprehensive production capacity of animal husbandry steadily increased, and staple agricultural produce was in sufficient supply, especially meat and milk products. At the same time, the extensive development of animal husbandry resulted in heavy non-point source agricultural pollution on the land and serious marine environment pollution.
3.2. Data Sources
COD discharge inequality from animal husbandry is determined through a series of socioeconomic factors. Economic development level represents the economic development stage of a city. This level affects land use, cultivation scale of livestock and poultry, level of industry management, and residents’ awareness of environmental protection. GDP per capita is used as the index for economic development level in this study. Industrial structure is also considered a critical factor affecting environmental inequality. The structure comprises the function, status, and combination of animal husbandry and other industries. Based on the structural adjustments in agriculture recently, animal husbandry is increasing at a high rate in the agricultural economy. When adjusting from the planting industry to other industries, the COD discharge from animal husbandry will increase as demand increases, affecting environmental inequality. Therefore, industrial structure is used and indexed by the proportion of the gross output value of animal husbandry to agriculture. Local fiscal support for science and technology also contributes to the progress of agricultural technology and, thus, affects environmental inequality. The proportion of science and research expenditure in a local finance general public budget expenditure is used to measure the public fiscal support for science and technology. Table 1 shows detailed information for each variable.
This study comprises a panel of 14 cities in Liaoning province with annual data from the period 2000–2016. Data related to COD discharge coefficients are extracted based on the manual of the first national census of domestic source pollution. The data on animal husbandry and the social economy from 2000 to 2016 are available in the Liaoning Statistical Yearbooks. Examinations of and adjustments to the data are from the China City Statistical Yearbook and China Regional Economic Statistical Yearbook.
4. Results and Analysis
4.1. Estimation of COD Discharges of the Animal Husbandry
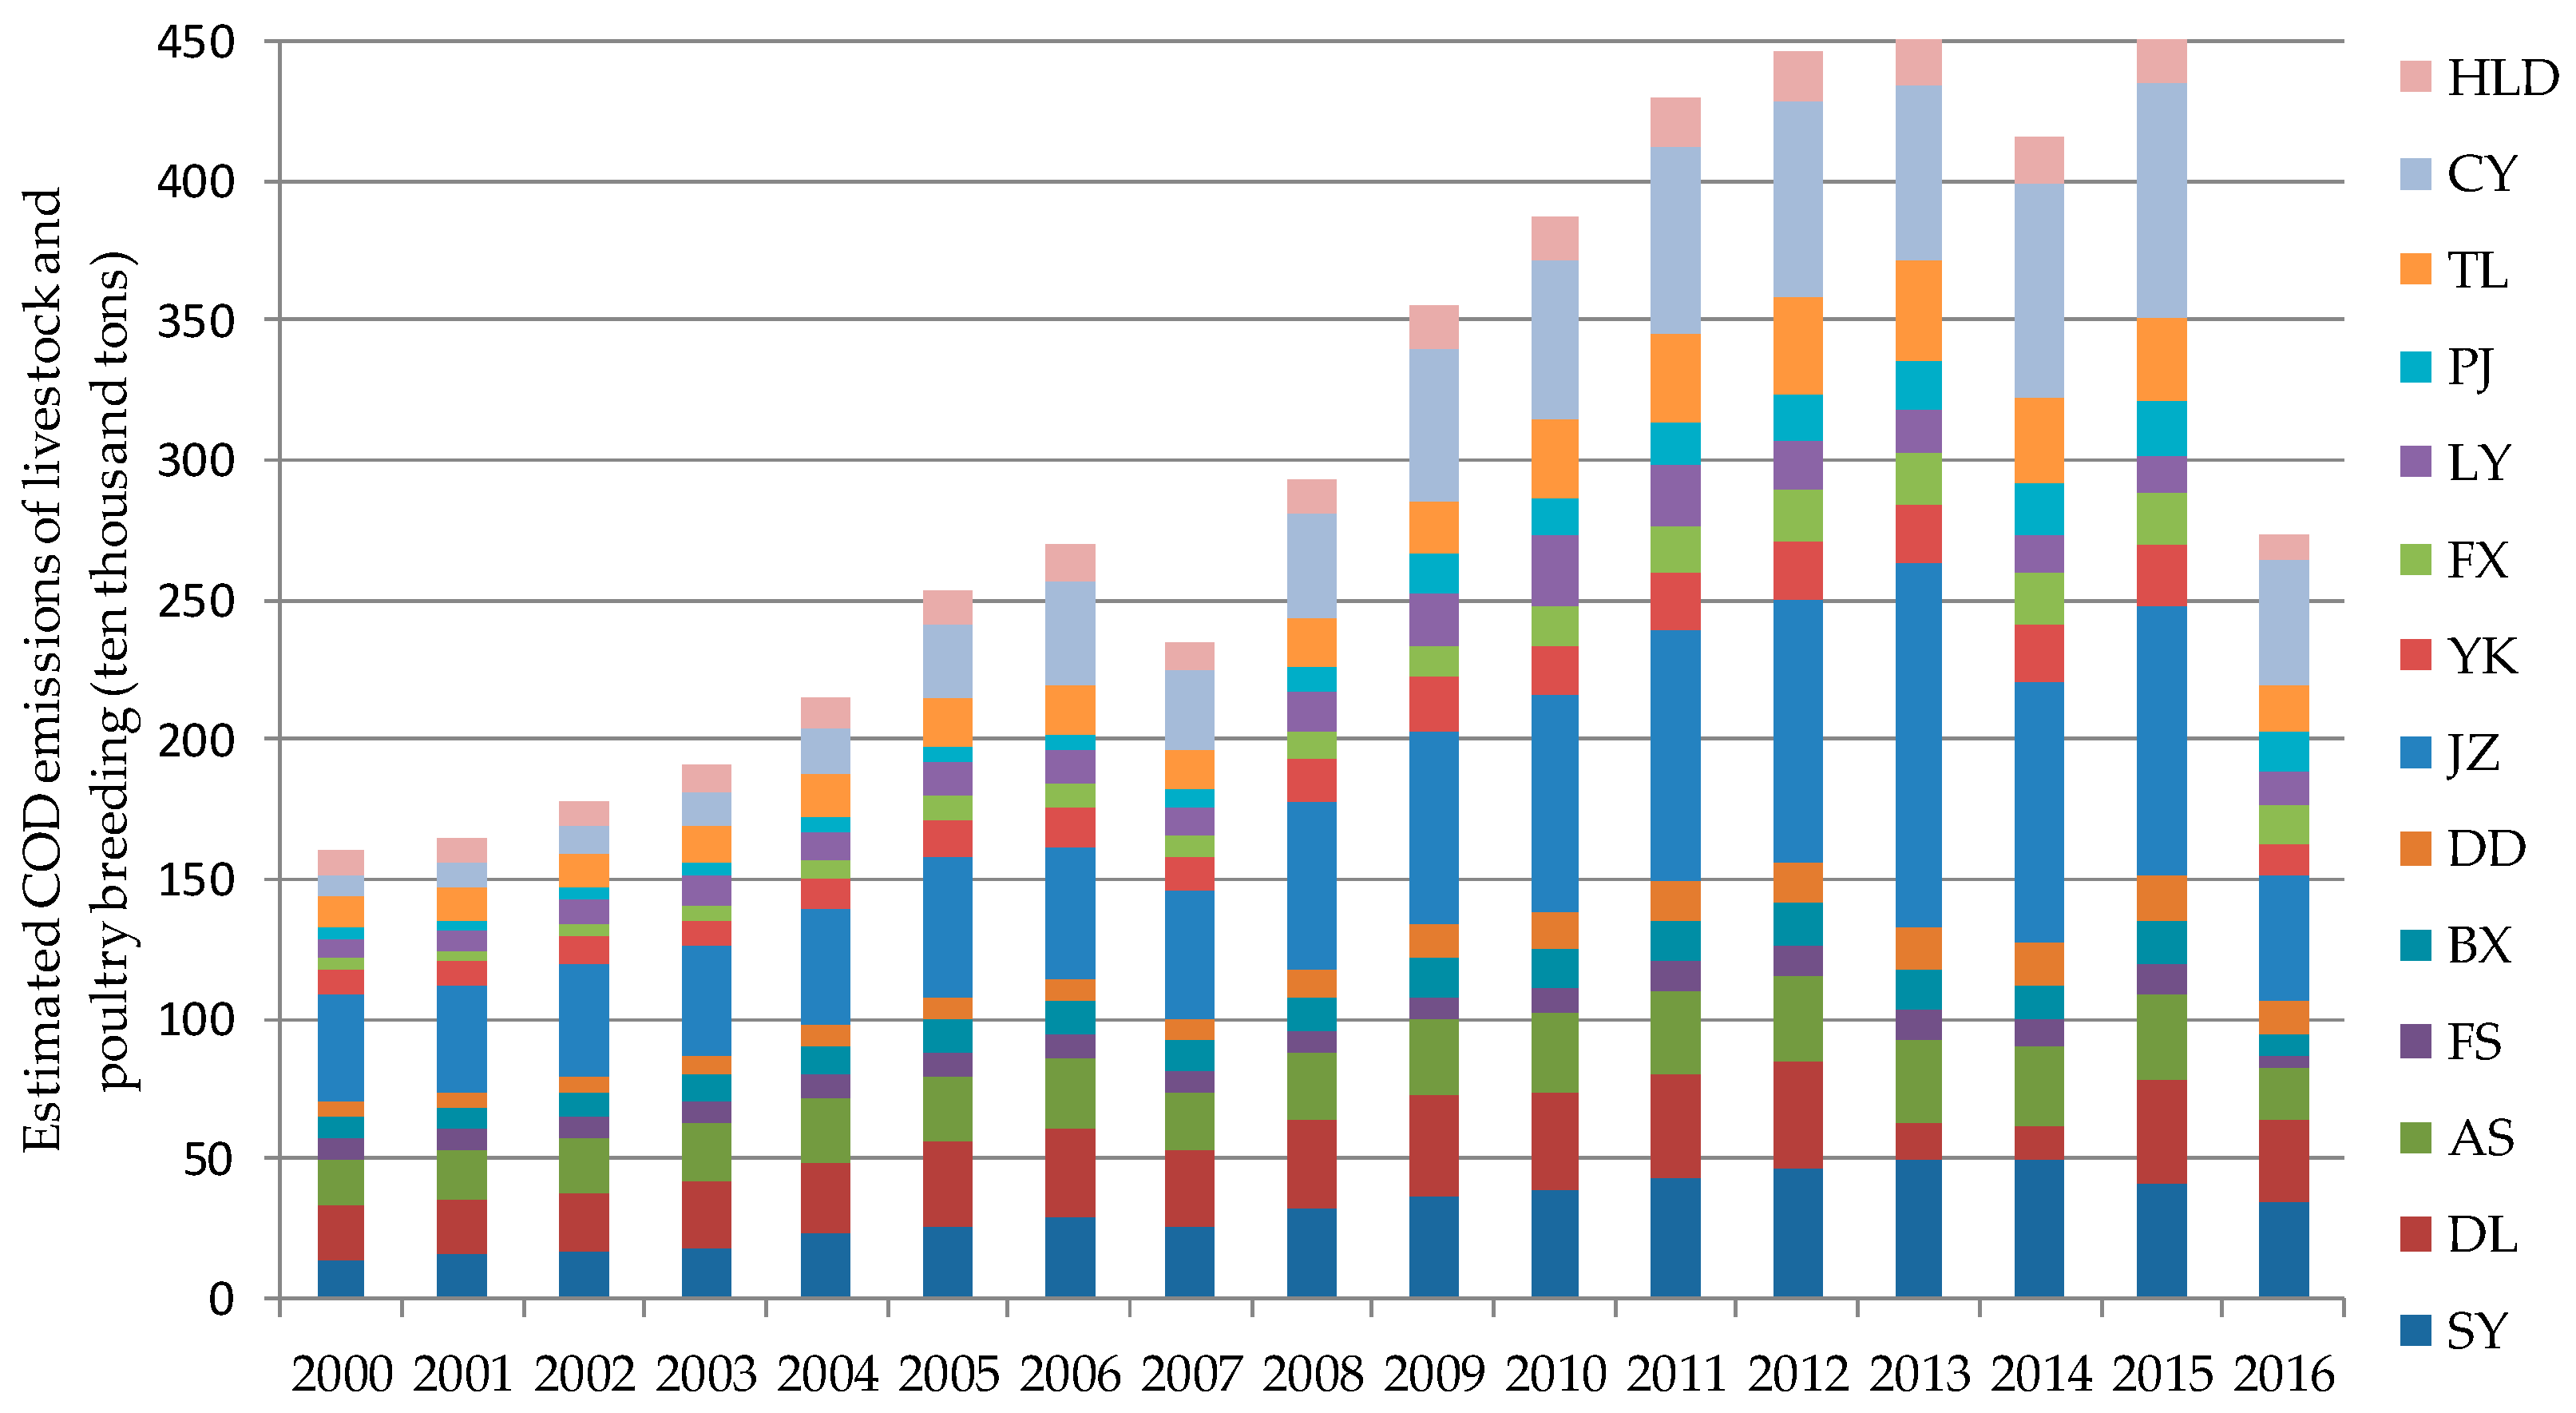
Based on the estimated results, total COD discharge from animal husbandry in Liaoning increased from 1.602 million tons in 2000 to 2.730 million tons in 2016. This basically shows an inverted U-shaped trajectory, as in 2013, the COD discharge reached its maximum of 4.509 million tons, an increase of 1.815 times that in 2000. The average annual growth of COD discharge from animal husbandry was 8.288% from 2000 to 2013, manifesting fast growth of pollution from animal husbandry in this period. However, overall, the average annual growth rate of COD discharge was 3.390% from 2000 to 2016 as it was −15.401% from 2013 to 2016, declining in growth and absolute COD discharge quantity. Jinzhou was one of the main contributor cities to COD discharge from animal husbandry in Liaoning province. The average contribution rate of Jinzhou accounted for more than 16%, exceeding any other city in Liaoning in this period; in 2013, its COD discharge reached the maximum, accounted for 28.839% of Liaoning. COD discharge from the livestock and poultry sectors in Jinzhou increased from 0.386 million tons in 2000 to 1.300 million tons in 2013 and then declined to 0.453 million tons. COD discharge from animal husbandry was also distributed across Chaoyang, Shenyang, and Dalian. The contribution rate of Chaoyang exceeded 10% as of 2005. In addition, Chaoyang replaced Jinzhou as the largest COD discharge contributor in 2016. The annual average contribution rates of Shenyang and Dalian were 10.403% and 9.853%, respectively. The estimated COD discharge from animal husbandry of the cities in Liaoning from 2000 to 2016, calculated based on Equation (1), are shown in Figure 3.
4.2. Spatial–Temporal Differentiation of COD discharge Inequality
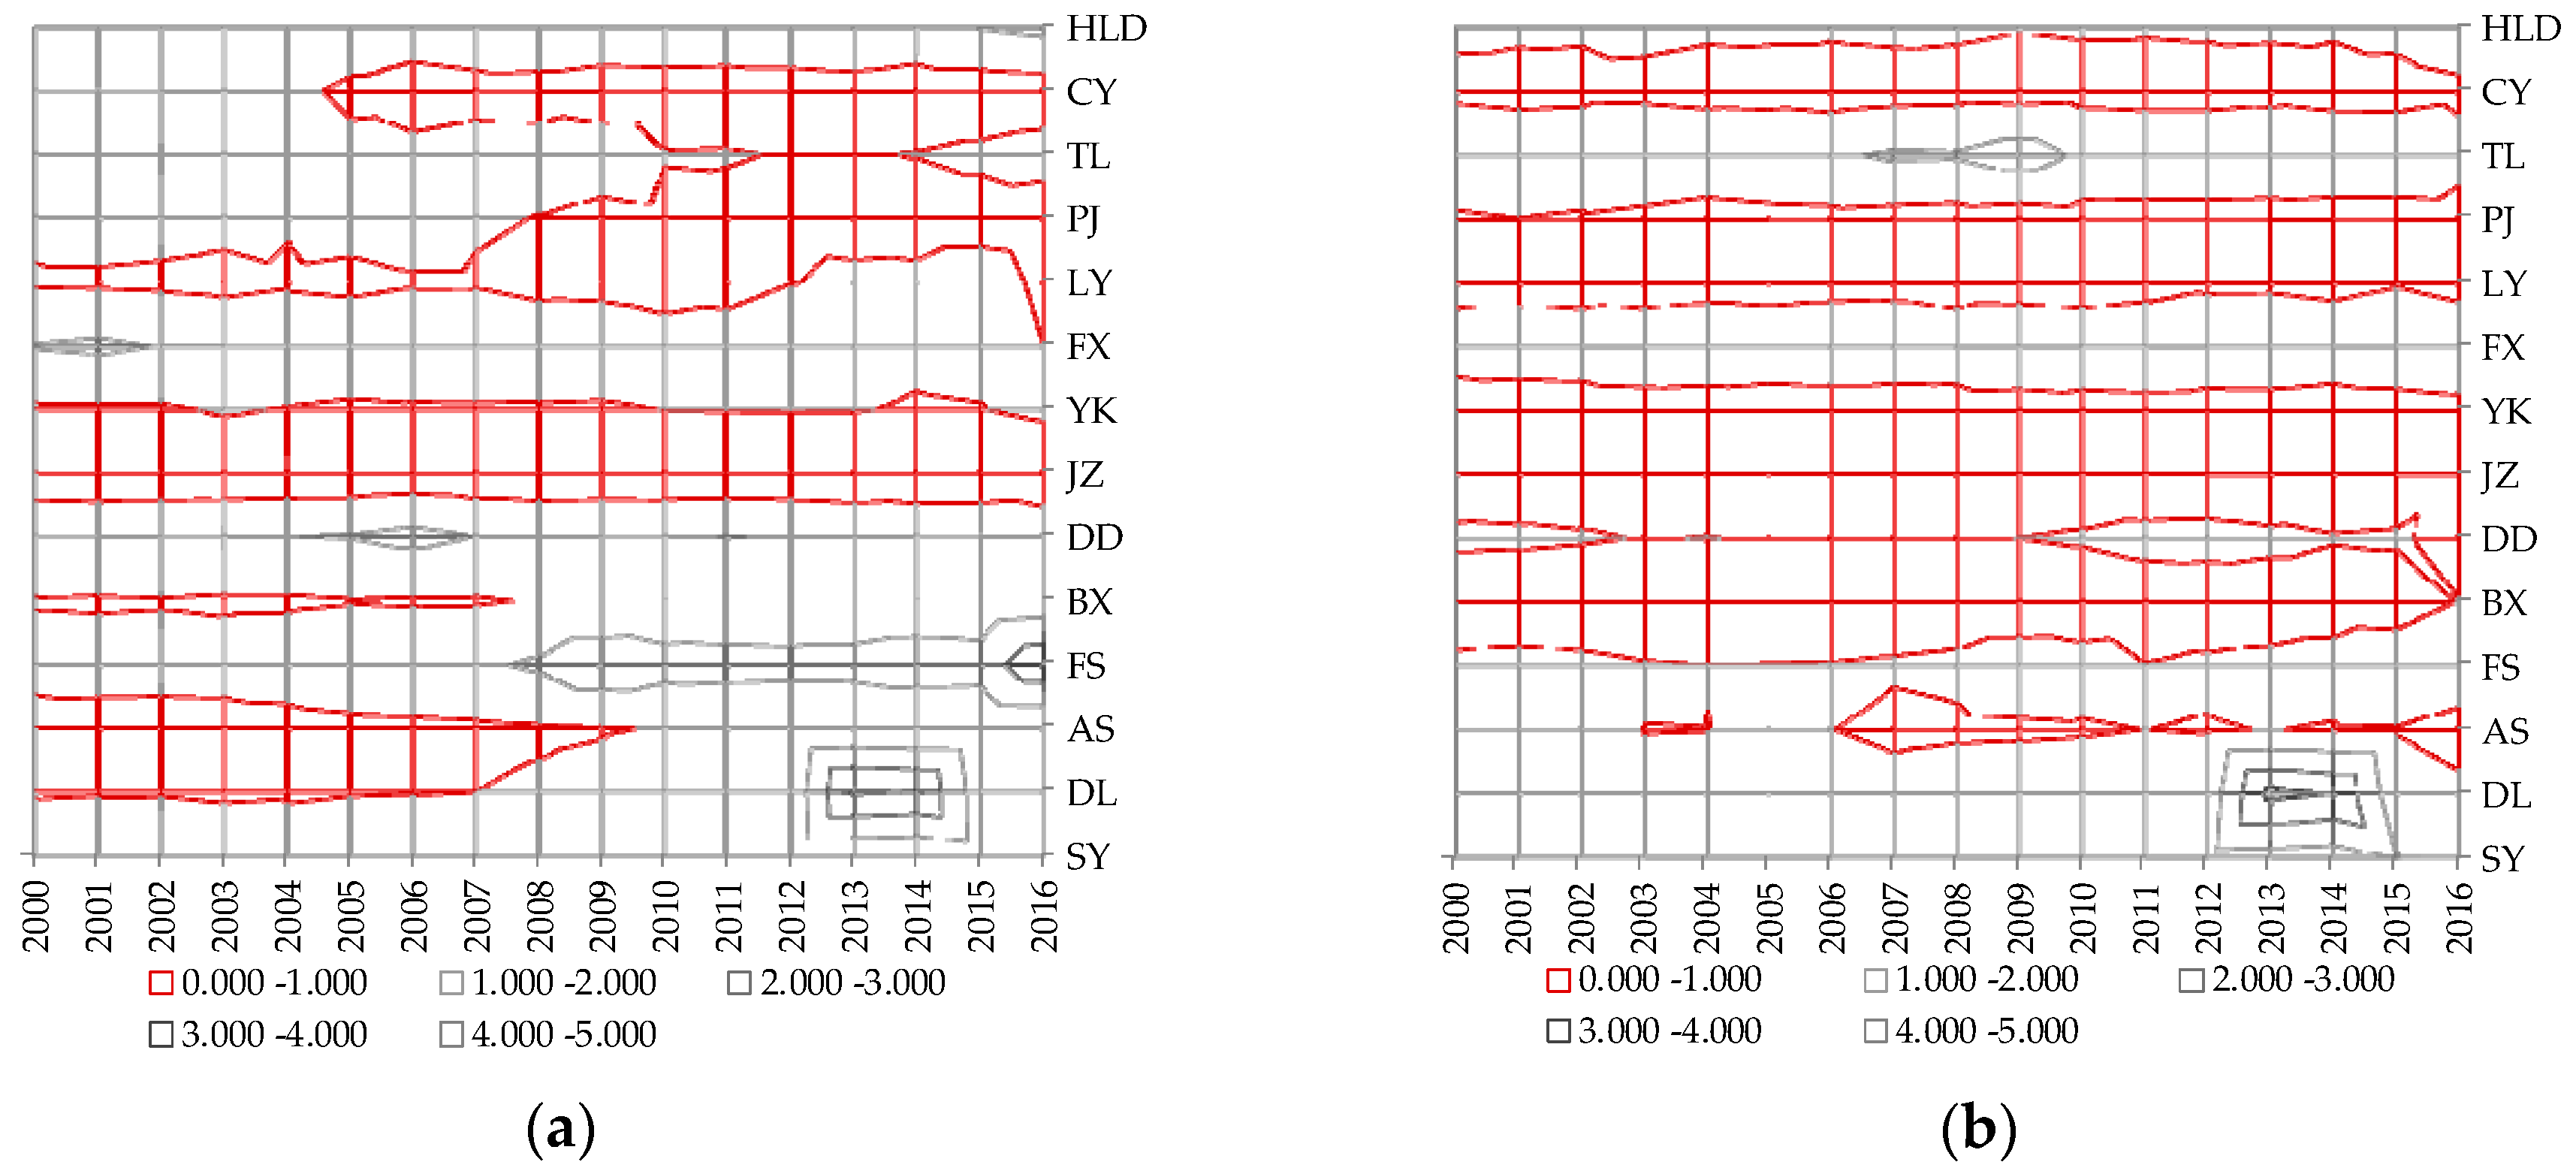
COD discharge inequality from animal husbandry in all cities in Liaoning from 2000 to 2016, calculated based on Equations (2) and (3), are shown in Figure 4. As shown, dynamic changes can be observed in the COD discharge inequality levels of different cities.
In terms of COD discharge distribution inequality, the EDI values of some cities were lower than 1, indicating that these cities emitted more pollutants than they could afford within the limit of their population and land area. This then harmed the equal emission rights of the other cities and caused social welfare loss in Liaoning. Jinzhou had the highest level of inequality in COD discharge from animal husbandry, with EDI values going from 0.246 to 0.425 during this period. The EDI values of Shenyang, Fushun, Dandong, Fuxin, and Huludao were higher than 1, and their annual EDI values were 1.284, 2.064, 1.926, 1.514, and 1.572, respectively. Over time, there was obvious improvement in COD discharge equality among Dalian, Anshan, Benxi, and Yingkou but deterioration among Panjin, Tieling, and Chaoyang.
As for COD discharge inequality in economic efficiency, most cities had EEI values of less than 1 and their pollution contribution rates exceeded that of the agricultural economy. This result indicates that the undesirable output of animal husbandry activities exceeded the desirable output. In essence, it caused low economic efficiency and an inequality in sharing the burdens of COD discharge among cities in Liaoning. Jinzhou had the highest level of inequality in COD discharge from animal husbandry, with EDI values going from 0.391to 0.868 during this period. Additionally, the EEI values of Yingkou, Liaoyang, Panjin, and Chaoyang were less than 1; and their annual EEI values were 0.681, 0.744, 0.694, and 0.662, respectively. The EEI values of Shenyang, Dalian, Fushun, Fuxin, Tieling, and Huludao were more than 1; and their annual EEI values were 1.678, 1.584, 1.178, 1.556, 1.831, and 1.174, respectively.
4.3. Threshold Model of Determinants of COD discharge Inequality
4.3.1. Threshold Effect Testing
Threshold effect testing is conducted to test whether the threshold effect is statistically significant. The number of thresholds can be also determined by this testing, allowing for one, two, and three thresholds. The statistical significance of the threshold effect is evaluated through the bootstrap method. The F value, P value, and critical value of various hypothetical threshold models are calculated. The results, calculated by STATA 13 and based on Equations (4) and (5), are shown in Table 2.
The results in Table 3 show that in the panel threshold models, a single threshold is statistically significant when the dependent variable is EDI, and a double threshold is statistically significant when the dependent variable is EEI. This indicates that the agricultural industrial structure has a single-threshold effect on distribution while there is a double-threshold effect on the economic efficiency of COD discharge inequality among cities at different economic levels in Liaoning. When EDI is selected as the dependent variable, the single threshold is statistically significant at the 1% level because the corresponding F statistic and P value are 47.674 and 0.004, respectively. When EEI is selected as the dependent variable, the double threshold is statistically significant at the 1% level because the corresponding F statistic and P value are 69.828 and 0.002, respectively. Based on the testing results, the triple threshold is not statistically significant because the corresponding F statistic and P value are 20.913 and 0.106, respectively, when the dependent variable is EDI. In addition, both the single and triple thresholds are not statistically significant when the dependent variable is EEI.
4.3.2. Threshold Recognition and Estimate
Based on the threshold effect test results, the threshold values of the natural logarithm of per capita GDP are estimated. The results in Table 3 show the threshold estimates of the natural logarithm of the threshold factor and confidence intervals for each threshold, calculated using STATA 13 and based on Equations (4) and (5).
In the EDI panel threshold model, the value of the single threshold is 8.532, meaning that the threshold value of GDP per capita is e8.532 (5074.585) yuan. On the basis of the single-threshold value of per capita GDP, the samples are divided into two groups: Cities with lower economic development levels [2461,5074.585] and cities with higher economic development levels (5074.585,110,682]. Based on the level of economic development, the industrial structure is assumed to have different influences on COD discharge distribution inequality among cities in Liaoning province.
In the panel threshold model of EEI, the values of the double threshold are 10.027 and 11.608, indicating that the threshold values of GDP per capita are, respectively, e10.027 (22,629.282) yuan and e11.608 (109,974.082) yuan. Therefore, the samples are divided into three groups: Cities with lower economic development levels [2461,22,629.282], cities with medium economic development levels (22,629.282,109,974.082], and cities with higher economic development levels (109,974.082,110,682]. In the panel threshold model of EDI, the subgroups of cities are refined according to economic development level in the panel threshold model of EEI. Different dimensions of COD discharge inequality have considerably different responses to the changing industrial structure of animal husbandry in Liaoning.
4.3.3. Panel Threshold Model Estimation
One of the aims of this research is to explore how socioeconomic factors influence the COD discharge inequality of animal husbandry and clarify their quantitative relation in econometric terms. Based on the Hansen panel threshold regression method, this study aims to validate and illustrate the effect of the industrial structure on COD discharge inequality from the dimensions of distribution and economic efficiency. Table 4 shows the regression results of the panel threshold models calculated by STATA 13 based on Equations (4) and (5).
Based on the regression results from the EDI models, marginal impacts from the industrial structure changed with the rising level of economic development. When the per capita GDP of the city was less than e8.532 (5074.585) yuan, there was a significantly negative correlation between EDI and industrial structure. This result implies that the preference for animal husbandry in the industrial structure led to increasing inequality in the distribution of COD discharge among cities at lower economic development level. However, when the per capita GDP exceeded e8.532 (5074.585) yuan, the industrial structure had positive impacts on EDI, although not statistically significant. The industrial structure impact on COD discharge inequality appears as an inverted V-pattern in the dimension of distribution with the growth of economic development level. In the panel threshold model, the variables pass the significance test for cities at lower economic development levels. However, for the cities at higher economic development levels, most variables do not pass the significance test.
Based on the regression results of the EEI models, with a gradual improvement in economic development level, the marginal impacts of industrial structure on EEI change from positive to negative and from low to high. The impact of the industrial structure on COD discharge inequality presents a V-pattern trend for the dimension of economic efficiency. When the per capita GDP is less than e10.027 (22,629.282) yuan, there is a negative correlation between the EEI and industrial structure. In addition, regarding cities at a medium economic development level, the industrial structure has a negative effect on EEI, statistically significant at the 10% level. When the per capita GDP is more than e11.608 (109,974.082) yuan, the industrial structure also has a negative effect on the EEI, and it is statistically significant at the 1% level. The regression coefficients of the threshold variable in the three models are 0.0333, −0.185, and −0.574, respectively. In other words, the industrial structure causes the highest degree of change in COD discharge inequality in cities at a higher economic development level in Liaoning Province.
Regarding the control variables, the regression coefficients are positive in all the models; however, they are only statistically significant in the EDI model for cities at lower economic development levels and in the EEI model for cities at medium economic development levels. These results indicate that enhancing public fiscal support for science and technology will contribute to the reduction in COD discharge inequality. From the perspective of distribution, the increase in public fiscal support level for science and technology achieves the highest reduction in COD discharge inequality in cities at lower economic development levels. As for economic efficiency, the increase in public fiscal support for science and technology contributes to the highest reduction in COD discharge inequality in cities at medium economic development levels.
5. Discussion and Conclusions
5.1. Discussion
According to the results presented in Section 4.2, COD discharge inequality is found in the distribution and economic efficiency of animal husbandry in Liaoning province in the period 2000–2016. Combined with results presented in Section 4.1, it can be concluded that in spite of the decline in the total amount of COD discharge after 2013, COD discharge inequality is not reduced over time. The decreasing of total amount of COD discharge after 2013 is closely connected with adjustment of industrial agriculture structure and tighter environmental policy for animal husbandry. It is generally consistent with the previous results in China [30,37]. It is also worth noting the considerable importance of decreasing environment inequality. To ensure sustainability of animal husbandry, more efforts should be directed toward coordinating discharge of pollutants with regional economic outcomes or other conditions than controlling total pollutant emission.
According to the results presented in Section 4.2, the impact of COD discharge inequality in economic efficiency lasts longer and is more serious compared with that of inequality in distribution. It is indicated that the disproportionate burden of pollution according to economic outcomes would make a more notable impact on sustainability of animal husbandry in Liaoning province. A high degree of variability is shown in COD discharge inequality across Liaoning province (see Figure 4). Jinzhou presents the highest level of COD discharge inequality from animal husbandry, judging by two indices in this period. Shenyang, Fushun, Fuxin, and Huludao maintain a relatively high level of COD discharge equality in distribution and economic efficiency in Liaoning in this period. Based on the pollutant discharge coefficient method, the estimating accuracy of COD discharge inequality from animal husbandry is much improved compared with previous studies [7,14,25,31]. The reliable measures of COD discharge equality in distribution and economic efficiency provide information that might be used for identifying the key regions for governance as well as agriculture sustainability policy making in Liaoning province in the future. According to the results presented in Section 4.3, it is indicated that the quantitative upgrading of agricultural industrial structure does not significantly reduce the COD discharge inequality, and even leads to an increase in inequality, especially in terms of economic efficiency. Regional economic development is the key factor in inequality reduction. Additionally, an increase in science and technology public fiscal support contributes to a reduction in inequality. These conclusions are important revelations on the sustainability and environmental inequality in a big agricultural province in northeastern China. In terms of COD discharge inequality in distribution, the agricultural industrial structure has a single-threshold effect on it, and the threshold value of the per capita GDP is e8.532 (5074.585) yuan. With growth in economic development levels, the effect of upgrading agricultural industrial structure turns from negative to positive. In terms of the COD discharge inequality in economic efficiency, the agricultural industrial structure has a double-threshold effect on it, and the threshold values of the per capita GDP are, respectively, e10.027 (22,629.282) yuan and e11.608 (109,974.082) yuan. The preference for animal husbandry in agricultural industrial structure results in an increase in COD discharge inequality in cities at medium and higher economic development levels while it results in a decrease in cities at lower economic development levels. Notably, most cities were at medium and higher economic development levels in Liaoning province during this period. The increase in COD discharge caused by the upgrading of agricultural industrial structure exceeded the increase in the economic benefits associated with this. Hence, the quantitative upgrading of agricultural industrial structure is not effective in reducing COD discharge inequality in cities at medium and higher economic development levels in Liaoning. The nonlinear effect of an agricultural industry structure on environmental inequality in animal husbandry has not been discovered by previous studies on sustainable livestock production at prefecture levels in China [14,15,20]. Therefore, this study updates and enriches related research. It will provide some guidance for the overall environmental inequality reduction of animal husbandry in Liaoning province. It is hoped that relevant departments will pay attention to it in policy making and planning concerning sustainability in the future.
5.2. Conclusions
This study focuses on the measurement of environmental inequality in animal husbandry and analyzes the influential social economic factors by using the panel threshold model. Indices for COD discharge inequality (EDI, EEI) are introduced to explore its relation to population, geographic area, and economic contribution rates across Liaoning province. The agriculture industrial structure is selected as the key determinant; economic development level is selected as the threshold factor; and the fiscal support level for science and technology is selected as the control variable. It is found that there is COD discharge inequality in distribution and in economic efficiency in Liaoning, and these were not reduced over time, despite a decline in the absolute quantity of COD discharge after 2013. Compared with COD discharge inequality in distribution, the impact of COD discharge inequality in economic efficiency lasted longer and was more serious across Liaoning. Furthermore, the quantitative upgrading of the agricultural industrial structure did not significantly reduce COD discharge inequality, and even led to a rise in inequality, especially in terms of inequality in economic efficiency. Ultimately, regional economic development turned out to be the key factor in reducing environmental inequality. In addition, improvement in public fiscal support for science and technology contributed to reduction in environmental inequality. Thus, this study provides insights into the key factors that can reduce environmental inequality in animal husbandry to aid in formulating environmental economic policies.
Considering the sustainability of animal husbandry, the following are some policy suggestions for the relevant authorities.
1. Instead of controlling total pollutant emission, coordinating discharge of pollutants with regional economic outcomes or other conditions should be the focus of policies to reduce environmental inequality in animal husbandry.
2. It needs to bring attention to the lasting effect of environmental inequality in economic efficiency. Relative indicators should be adopted in environment management to identify the key regions for reducing environmental inequality.
3. To reduce environmental inequality in animal husbandry, local governments should take into account the economic development levels of different cities, explore new patterns of upgrading the agriculture industrial structure, and provide public fiscal support for science and technology. Upgrading the agriculture industrial structure is not confined to scale expansion of animal husbandry. Policymakers should pay more attention to the management, green technological reform, and comprehensive treatment of animal husbandry. Corresponding changes are required to economic statistics, production management, and environmental supervision.
However, there are still some limitations to the study in terms of determinants of COD discharge inequality by using threshold models. The control variable includes but is not limited to the level the level of public fiscal support for science and technology. Other factors such as income, labor costs, investment in environmental governance, etc., can also be involved for further study. In the future, the environmental carrying capacity, resource endowment, ecological support, and social welfare assessment should also be taken into account. Therefore, further research could improve environmental inequality indices and highlight social economic factors.
Author Contributions
Conceptualization, W.L. and Y.Y.; methodology, Y.Y.; formal analysis, Y.Y. and Y.X.; resources, Y.Y. and Y.X.; writing—original draft preparation, Y.Y.; writing—review and editing, Y.Y., W.L. All the authors have reviewed the manuscript.
Funding
This research study was supported by the Major Project of the National Social Science Fund of China (Grant no.14ZDB131), Public Science and Technology Research Funds Projects of Ocean (Grant no. 201505001), and the National Natural Science Foundation of China (Grant no. 41671117).
Acknowledgments
This research study was supported by the Major Project of the National Social Science Fund of China (Grant no.14ZDB131), Public Science and Technology Research Funds Projects of Ocean (Grant no. 201505001), and the National Natural Science Foundation of China (Grant no. 41671117). The authors would like to acknowledge all experts’ contributions in the building of the model in this study.
Conflicts of Interest
The authors declare no conflict of interest.
References
- WWF. Living Planet Report. 2014. Available online: http://wwf.panda.org/knowledge_hub/all_publications/living_planet_report_timeline/lpr_2014/ (accessed on 8 December 2018).
- UN. Transforming Our World: The 2030 Agenda for Sustainable Development. 2015. Available online: https://sustainabledevelopment.un.org/post2015/transformingourworld/ (accessed on 8 December 2018).
- Boyce, J.K.; Zwickl, K.; Ash, M. Measuring environmental inequality. Ecol. Econ. 2016, 124, 114–123. [Google Scholar] [CrossRef] [Green Version]
- Szasz, A.; Meuser, M. Environmental inequalities: Literature review and proposals for new directions in research and theory. Curr. Sociol. 1997, 45, 99–120. [Google Scholar] [CrossRef]
- Pellow, D.N.; Weinberg, A.; Schnaiberg, A. The environmental justice movement: Equitable allocation of the costs and benefits of environmental management outcomes. Soc. Justice Res. 2001, 14, 423–439. [Google Scholar] [CrossRef]
- Wen, T.; Li, W.Q. On environmental equity, environmental efficiency, and sustainable development. China Popul. Resour. Environ. 2003, 13, 13–17. [Google Scholar]
- Wu, C.F.; Yao, Z.C.; Li, Y.W. An overview and progress of the study of environmental equity. Adv. Earth Sci. 2009, 24, 1268–1274. [Google Scholar]
- Boer, J.T.; Pastor, M.; Sadd, J.L.; Snyder, L.D. Is there environmental racism? The demograhics of hazardous waste in losangeles county. Soc. Sci. Q. 1997, 78, 793–810. [Google Scholar]
- Hird, J.A.; Reese, M. The distribution of environmental quality: An empirical analysis. Soc. Sci. Q. 1998, 79, 693–716. [Google Scholar]
- Chalmers, H.; Colvin, J. Addressing environmental inequalities in UK policy: An action research perspective. Local Environ. 2005, 10, 333–360. [Google Scholar] [CrossRef]
- Brulle, R.J.; Pellow, D.N. Environmental justice: Human health and environmental inequality. Ann. Rev. Public Health 2006, 27, 103–124. [Google Scholar] [CrossRef]
- Fernández, I.C.; Wu, J. Assessing environmental inequalities in the city of santiago (chile) with a hierarchical multiscale approach. Appl. Geogr. 2016, 74, 160–169. [Google Scholar] [CrossRef]
- Kedron, P. Identifying the geographic extent of environmental inequalities: A comparison of pattern detection methods. Can. Geogr. 2016, 60, 479–492. [Google Scholar] [CrossRef]
- Zhao, X.L.; Zhang, S.F.; Fan, C.Y. Environmental externality and inequality in China: Current Status and future choices. Environ. Pollut. 2014, 190, 176–179. [Google Scholar] [CrossRef] [PubMed]
- Zhong, M.C.; Yan, W.J. Research frame and survey of environmental equity issue. China Populat. Resour. Environ. 2012, 22, 1–6. [Google Scholar]
- Heerink, N.; Mulatu, A.; Bulte, E. Income inequality and the environment: Aggregation bias in environmental Kuznets curves. Ecol. Econ. 2001, 38, 359–367. [Google Scholar] [CrossRef]
- Boyce, J.K. Inequality as a cause of environmental degradation. Ecol. Econ. 1994, 11, 169–178. [Google Scholar] [CrossRef] [Green Version]
- Marshall, J.D. Environmental inequality: Air pollution exposures in california’s south coast air basin. Atmos. Environ. 2008, 42, 5499–5503. [Google Scholar] [CrossRef]
- Kyle, C.; Liam, D. Inter-Neighborhood Migration, Race, and Environmental Hazards: Modeling Micro-Level Processes of Environmental Inequality. Am. J. Sociol. 2010, 115, 1110–1149. [Google Scholar]
- Walker, G.; Mitchell, G.; Fairburn, J.; Smith, G. Industrial pollution and social deprivation: Evidence and complexity in evaluating and responding to environmental inequality. Local Environ. 2005, 10, 361–377. [Google Scholar] [CrossRef] [Green Version]
- Padilla, C.M.; Kihal-Talantikite, W.; Vieira, V.M.; Rossello, P.; Le Nir, G.; Zmirou-Navier, D.; Deguen, S. Air quality and social deprivation in four French metropolitan areas—A localized spatio-temporal environmental inequality analysis. Environ. Res. 2014, 134, 315–324. [Google Scholar] [CrossRef]
- Rüttenauer, T. Neighbours matter: A nation-wide small-area assessment of environmental inequality in Germany. Soc. Sci. Res. 2018, 70, 198–211. [Google Scholar] [CrossRef]
- Huang, H.P. Study on the fairness of resource-environment system of Jiangxi Province based on different methods of Gini coefficient. Acta Ecol. Sin. 2012, 32, 6431–6439. [Google Scholar] [CrossRef] [Green Version]
- Lu, M.J.; Chen, H.M. Review on the Inequality of Carbon Emissions. Resour. Sci. 2013, 35, 1617–1624. [Google Scholar]
- Yang, J.S.; Xu, J. Inequality in the Distribution of Environmental Benefit and Its Transfer Mechanism. Econ. Res. J. 2016, 51, 155–167. [Google Scholar]
- Druckman, A.; Jackson, T. Measuring resource inequalities: The concepts and methodology for an area-based gini coefficient. Ecol. Econ. 2008, 65, 242–252. [Google Scholar] [CrossRef]
- Jackson, L.M.; Bitacola, L.M.; Janes, L.M.; Esses, V.M. Intergroup ideology and environmental inequality. Anal. Soc. Issues Public Policy 2013, 13, 327–346. [Google Scholar] [CrossRef]
- Dons, E.; Kochan, B.; Bellemans, T.; Wets, G.; Panis, L.I. Modeling personal exposure to air pollution with ab2c: Environmental inequality. Procedia Comput. Sci. 2014, 32, 269–276. [Google Scholar] [CrossRef]
- Liévanos, R.S.; Greenberg, P.; Wishart, R. In the shadow of production: Coal waste accumulation and environmental inequality formation in Eastern Kentucky. Soc. Sci. Res. 2018, 71, 37–55. [Google Scholar] [CrossRef] [PubMed]
- Li, F.; Cheng, S.K.; Yu, H.L.; Yang, D.W. Waste from livestock and poultry industry and its potential assessment of biogas energy in rural china. J. Clean. Prod. 2016, 126, 451–460. [Google Scholar] [CrossRef]
- Wang, J.N.; Xu, Z.C.; Wu, G.Y.; Yang, J. Construction of pollutants producing and discharging coefficient accounting system for livestock and poultry industry. Environ. Monit. China 2013, 2, 143–147. [Google Scholar]
- Yang, J.; Guo, A.D.; Li, X.M.; Huang, T. Study of the Impact of a High-Speed Railway Opening on China’s Accessibility Pattern and Spatial Equality. Sustainability 2018, 10, 2943. [Google Scholar] [CrossRef]
- Bennett, R.M. Farm animal welfare and food policy. Food Policy. 1997, 22, 281–288. [Google Scholar] [CrossRef]
- Bennett, R. The value of farm animal welfare. J. Agric. Econ. 1995, 46, 46–60. [Google Scholar] [CrossRef]
- Musto, M.; Cardinale, D.; Lucia, P.; Faraone, D. Influence of different information presentation formats on consumer acceptability: The case of goat milk presented as obtained from different rearing systems. J. Sens. Stud. 2015, 30, 85–97. [Google Scholar] [CrossRef]
- Musto, M.; Cardinale, D.; Lucia, P.; Faraone, D. Creating public awareness of how goats are reared and milk produced may affect consumer acceptability. J. Appl. Anim. Welf. Sci. 2016, 19, 217–233. [Google Scholar] [CrossRef] [PubMed]
- Wang, H.; Luan, W.X.; Kang, M.J. COD pollution load of social and economic activities in Liaohe River Basin, China. Geogr. Res. 2013, 32, 1802–1813. [Google Scholar]
- Ministry of Ecology and Environment, the People’s Republic of China. The 2018 Report on the State of the Ecology and Environment in China. 2019. Available online: http://www.mee.gov.cn/hjzl/zghjzkgb/lnzghjzkgb/201905/P020190619587632630618.pdf (accessed on 12 August 2019).
- Wang, C.; Sun, Q.; Jiang, S.; Wang, J.K. Evaluation of pollution source of the bays in Fujian province. Procedia Environ. Sci. 2011, 10, 685–690. [Google Scholar]
- Yang, J.; Guan, Y.Y.; Xia, J.H.; Jin, C.; Li, X.M. Spatiotemporal variations in greenspace ecosystem service value at urban fringes: A case study on Ganjingzi District in Dalian, China. Sci. Total Environ. 2018, 639, 1453–1461. [Google Scholar] [CrossRef] [PubMed]
- Yang, J.; Sun, J.; Ge, Q.S.; Li, X.M. Assessing the Impacts of Urbanization-Associated Green Space on Urban Land Surface Temperature: A Case Study of Dalian, China. Urban For. Urban Green. 2017, 22, 1–10. [Google Scholar] [CrossRef]
- Lu, J.Y.; Huang, X.J.; Dai, L.; Cheng, Z.G.; Li, Y. Spatio-temporal scale analysis on the equality of energy consumption carbon emission distribution in china. J. Nat. Resour. 2012, 27, 2006–2017. [Google Scholar]
- Wang, Q.X.; Gao, Z.Q.; Ning, J.C. Model building discussions on the provincial differences of carbon emissions in china based on fairness for 2010. Resour. Sci. 2014, 36, 998–1004. [Google Scholar]
- Wang, Q.X.; Gao, Z.Q.; Ning, J.C. Model-based assessment of the pattern differences and the equity of national carbon emissions in China during 2000–2010. J. Clean. Prod. 2015, 103, 696–704. [Google Scholar] [CrossRef]
- Zhang, D.; Chen, L.Y. Environmental regulation, upgrading of industrial structure and economic fluctuation: An empirical study of dynamic panel threshold. J. Environ. Econ. 2019, 4, 92–109. [Google Scholar]
- Zheng, S.Z.; Chen, Z.; Hou, L. Research on the threshold effect of local government scale and economic growth. Rev. Econ. Manag. 2019, 4, 116–127. [Google Scholar]
- Hansen, B.E. Threshold effects in non-dynamic panels: Estimation, testing, and inference. J. Econ. 1999, 93, 345–368. [Google Scholar] [CrossRef] [Green Version]
- Yang, Y.J.; Luan, W.X. Industrial Structure and COD Emission of Livestock and Poultry Breeding in Liaoning Province, NE China: Empirical Research on the Panel Threshold Model. In Proceedings of the 2018 International Conference of Green Buildings and Environmental Management, Qingdao, China, 23–25 August 2018; Volume 186. [Google Scholar]
- Aydin, C.; Esen, Ö. Does the level of energy intensity matter in the effect of energy consumption on the growth of transition economies? Evidence from dynamic panel threshold analysis. Energy Econ. 2018, 69, 185–195. [Google Scholar] [CrossRef]
Figure 1.
Chemical oxygen demand (COD) discharge coefficient system of animal husbandry in Liaoning province.
Figure 1.
Chemical oxygen demand (COD) discharge coefficient system of animal husbandry in Liaoning province.
Figure 2.
Spatial distribution of all prefecture-level cities in Liaoning province.
Figure 3.
Estimated COD discharges of animal husbandry in cities in Liaoning province from 2000 to 2016.
Figure 3.
Estimated COD discharges of animal husbandry in cities in Liaoning province from 2000 to 2016.

Figure 4.
COD discharge inequality of animal husbandry of all prefecture-level cities in Liaoning province from 2000 to 2016: (a) equitable distribution index (EDI); (b) economic efficiency index (EEI).
Figure 4.
COD discharge inequality of animal husbandry of all prefecture-level cities in Liaoning province from 2000 to 2016: (a) equitable distribution index (EDI); (b) economic efficiency index (EEI).


Table 1.
Description of variables.
| Variable | Description | Mean | Min | Max |
|---|---|---|---|---|
| Equitable distribution index (EDI) | COD discharge inequality in distribution | 1.216 | 0.246 | 4.096 |
| Economic efficiency index (EEI) | COD discharge inequality in economic efficiency | 1.069 | 0.391 | 4.237 |
| Economic development level (PGDP) | Gross domestic product/city population | 33,212 | 2461 | 110,682 |
| Industrial structure of agriculture (ISA) | Gross output value of animal husbandry/gross output value of agriculture (ratio) | 0.378 | 0.104 | 0.601 |
| Public fiscal support level for science and technology (FST) | Science & research expenditure/public finance expenditure (ratio) | 0.009 | 0.001 | 0.045 |
Table 2.
Test results of threshold effects a.
| Model | Threshold Forms | F-Value | p-Value | Bootstrap Times | Critical Values | ||
|---|---|---|---|---|---|---|---|
| 1% | 5% | 10% | |||||
| EDI | Single threshold | 47.674 *** | 0.004 | 500 | 37.149 | 24.095 | 18.933 |
| Double threshold | 63.335 ** | 0.020 | 500 | 71.090 | 40.405 | 8.104 | |
| Triple threshold | 20.913 | 0.106 | 500 | 47.810 | 29.176 | 21.910 | |
| EEI | Single threshold | 4.569 | 0.230 | 500 | 40.659 | 17.120 | 12.129 |
| Double threshold | 69.828 *** | 0.002 | 500 | 49.742 | 21.276 | 10.348 | |
| Triple threshold | 4.742 | 0.102 | 500 | 9.266 | 6.370 | 4.860 | |
a ***, **, and * represent statistical significance at 1%, 5%, and 10%, respectively.
Table 3.
Estimation results of the thresholds.
| Threshold Forms | Threshold Estimate | 95% Confidence Intervals | ||
|---|---|---|---|---|
| EDI | Single threshold | 8.532 | [8.532,8.682] | |
| Double threshold | Ito1 | 11.608 | [11.608,11.608] | |
| Ito2 | 8.532 | [8.532,8.532] | ||
| Triple threshold | 10.053 | [9.839,10.514] | ||
| EEI | Single threshold | 11.375 | [8.532,11.375] | |
| Double threshold | Ito1 | 10.027 | [8.532,11.163] | |
| Ito2 | 11.608 | [11.608,11.608] | ||
| Triple threshold | 10.118 | [8.532,11.360] |
Table 4.
Estimation results of panel threshold models a,b.
| Model | EDI | EEI | ||||
|---|---|---|---|---|---|---|
| Economic development level | Lower | Higher | Lower | Medium | Higher | |
| Threshold variable (lnPGDP) | ≤8.532 | >8.532 | ≤10.027 | (10.027, 11.608] | >11.608 | |
| lnISA | −0.561 *** | 0.149 | 0.0333 | −0.185 * | −0.574 *** | |
| (−7.20) | (1.87) | (1.26) | (−2.17) | (−7.89) | ||
| lnFST | 0.0527 ** | 0.0253 | 0.0222 | 0.0464 ** | 0.0133 | |
| (2.65) | (1.16) | (1.26) | (−2.27) | (0.94) | ||
| _cons | 0.329 ** | 0.362 ** | 0.0966 | 0.0156 | 0.0285 | |
| (3.26) | (2.85) | (1.12) | (0.16) | (0.39) | ||
| Fixed region effect | controlled | controlled | controlled | controlled | controlled | |
| Time trend effect | controlled | controlled | controlled | controlled | controlled | |
| F Stat | 70.06 | 55.20 | 88.60 | 84.01 | 109.29 | |
| Prob. F Stat. | 0.0000 | 0.0000 | 0.0000 | 0.0000 | 0.0000 | |
a ***, **, and * represent statistical significance at 1%, 5%, and 10% levels, respectively. b Results in brackets are standard errors.
© 2019 by the authors. Licensee MDPI, Basel, Switzerland. This article is an open access article distributed under the terms and conditions of the Creative Commons Attribution (CC BY) license (http://creativecommons.org/licenses/by/4.0/).
Share and Cite
MDPI and ACS Style
Yang, Y.; Luan, W.; Xue, Y. Sustainability and Environmental Inequality: Effects of Animal Husbandry Pollution in China. Sustainability 2019, 11, 4576. https://doi.org/10.3390/su11174576
AMA Style
Yang Y, Luan W, Xue Y. Sustainability and Environmental Inequality: Effects of Animal Husbandry Pollution in China. Sustainability. 2019; 11(17):4576. https://doi.org/10.3390/su11174576
Chicago/Turabian StyleYang, Yujie, Weixin Luan, and Yunan Xue. 2019. "Sustainability and Environmental Inequality: Effects of Animal Husbandry Pollution in China" Sustainability 11, no. 17: 4576. https://doi.org/10.3390/su11174576
Note that from the first issue of 2016, this journal uses article numbers instead of page numbers. See further details here.