Article

Threshold Determination for Sharing Bus Rapid Transit–Exclusive Lanes with Conventional Buses

1
Jiangsu Key Laboratory of Urban ITS, Southeast University, Nanjing 211189, China
2
Jiangsu Province Collaborative Innovation Center of Modern Urban Traffic Technologies, Southeast University, Nanjing 211189, China
3
School of Transportation, Southeast University, Nanjing 211189, China
4
Shenzhen Urban Transport Planning Center, Shenzhen 518021, China
*
Author to whom correspondence should be addressed.
Sustainability 2019, 11(17), 4592; https://doi.org/10.3390/su11174592
Submission received: 12 July 2019 / Revised: 16 August 2019 / Accepted: 21 August 2019 / Published: 23 August 2019
(This article belongs to the Special Issue Sustainability Issues in Public Transport)

Abstract

:
Sharing bus rapid transit (BRT) exclusive lanes with conventional buses is being considered to solve the problem of low utilization rate of BRT-exclusive lanes. However, the quantitative conditions and threshold that determine when to share need to be study. This paper took the common section of BRT and conventional bus lines as its research object. Practical investigation was conducted to analyze shared characteristics from multiple perspectives and explore influencing factors and mechanisms for sharing implementation. Based on the survey results, analytical models were established to quantify the influencing factors from three perspectives of road section, intersection, and bus stop. We selected departure volume of conventional buses as a threshold index and then summarized the constraints and the calculation process of sharing threshold. Finally, numerical examples of different scenarios were used to verify the feasibility and effectiveness of the method. The operation efficiency of the road section on exclusive lanes was the constraint on the lower limit of the shared threshold, while the upper limit was constrained by queuing probability or bus operation time under different intersections and stop spacing, which can provide reference for the shared setting of exclusive bus lanes.

1. Introduction

As a new form of urban public transit system, bus rapid transit (BRT) has been widely used around the world (and especially in China) owning to the advantages of fast and reliable service. According to the newest statistics from China, BRT systems were in operation in 19 cities, and more than 17 cities are in the planning stage. By 2017, there were 8802 BRT vehicles the length of BRT lines was 3424.5 km, and the annual BRT passenger volume has reached to 2.96 billion [1].
Exclusive bus lanes are the precondition for ensuring the high speed of BRT, which is one of the important factors to determine the operating efficiency of BRT [2]. However, the utilization rate of some BRT-exclusive lanes is low in practical applications, which is a waste of road resource. It is a feasible method to optimize the resource allocation by changing the road right of BRT lanes from exclusive to shared, which can better reflect the concept of sustainable transportation development. Similar practices have been carried out in some cities, such as Zhengzhou city in China, where some conventional bus vehicles were allowed to enter the BRT-exclusive lanes from 2010, resulting in the improvement of both the utilization rate of BRT lanes and the operation efficiency of conventional buses. The main purpose of sharing the BRT-exclusive lanes with conventional buses is to improve the speed of conventional buses on the premise that the running efficiency of BRT is affected by the reasonable control, and the sharing principal is to make the use of BRT-exclusive lanes more sustainable and efficient. Nevertheless, there are few studies on the conditions about whether to share, how to define the control index, explore the influencing factors, and quantify the shared threshold interval. There is a lack of quantitative consideration for the sharing in practice, so it is of research and practical value to study the setting constraints and determination method of BRT-exclusive lane sharing threshold.
Planning and setting of exclusive bus lanes have been influenced by a variety of factors, including traffic environmental conditions, operating form of buses, and station characteristics. Jeason took the factor of time delay into consideration, compared the before and after setting the exclusive bus lane and obtained the setting conditions based on the index of traffic flow [3]. Li et al. compared the difference between the road section influenced by bus stops, the section influenced by intersections and the pure section, took the bus flow as the judgement index, and respectively analyzed the flow conditions on setting exclusive bus lanes in several places [4]. Liu et al. considered factors such as lane utilization rate, saturation, and car flow and established a critical flow model for the setting of exclusive bus lanes [5]. Jose Viegas et al. put forward the concept of intermittent bus lane and analyzed the single point and regional signal setting of the intermittent bus lane through studying the operating characteristics of buses and cars on the intermittent bus lane [6,7]. From the signal control optimization point of view, the transit signal priority was proposed with the use of exclusive bus lanes [8,9,10]. However, the current research on BRT-exclusive lanes has been independent of conventional buses.
The existing ways to modeling for implementation of exclusive bus lanes and quantifying the influencing factors mainly concentrate on the aspects of flow, speed, delay, and transportation ridership. Sun et al. established a simulation network model to determine the threshold values of traffic flow for the provision of exclusive bus lanes was with the target of optimal travel benefits by using VISSIM software (PTV Group, Germany). The model took into consideration the road conditions, pedestrian crossing, traffic composition, bus stops and traffic signal [11]. Han studied the exclusive lanes shared by taxis and buses, demonstrated its feasibility from the aspect of operation factors, and established the calculation model of the per capita travel time when the taxi drives on exclusive bus lanes [12]. Shalabay analyzed and evaluated the setting benefit of exclusive bus lanes from the point of speed and delay by simulating the lanes through TRANSYT7F software (TRRL, UK) [13]. Based on the actual survey data, Huang et al. established the speed model of buses and cars before and after the setting of exclusive bus lanes and analyzed the variation characteristics of running speed [14]. Lei built a simulation model according to the running speed of vehicles on exclusive bus lanes in Beijing, simulated the changes of vehicle delay indicators under different setting conditions, and analyzed the effects on other traffic that is not on exclusive bus lanes [15]. Zhou et al. took the bus stop as the research object and analyzed the influencing range of the bus stop through the speed model [16]. Vedagiri et al. and Basso took departure frequency, vehicle size, stopping spacing and the number of lanes as decision variables, and took maximum social benefit as the objective function, and analyzed the impact of exclusive bus lanes setting on traffic ridership [17,18]. Khoo et al. proposed a bi-objective optimization model to optimize a bus lane schedule taking into consideration key parameters (such as population size, travel demand level, and minimum duration for implementation) [19]. These existing methods used on influence analysis, and an evaluation of the exclusive bus lanes setting can provide a reference for the research of shared threshold in this paper. However, these studies still fail to explore the influencing mechanism based on multiple factors because of the limitations in relevant data collection.
In the review of the literatures above, factors considered in each study are quite different, and the selection and analysis of key factors and indicators are qualitative. There is a lack of scientific standard of setting conditions, and the model constructed is difficult to be widely used. In view of the shortcomings of exiting studies and based on the mature current models and methods, this paper aims to explore the influencing factors and characteristics of sharing the BRT-exclusive lane with conventional buses, analyze the constraints of sharing setting, and propose an approach of calculating the shared threshold by taking the common road section of the bus lane that was used together by BRT and conventional buses as the research objective.

2. Shared Influencing Factors and Analytical Models

2.1. Sharing BRT-Exclusive Lane with Conventional Bus Survey

2.1.1. Analysis of Shared Influencing Factors

The aim of sharing BRT-exclusive lanes with conventional buses is to improve the travelling speed of conventional buses on the premise that the operation efficiency of BRT is not greatly affected. Therefore, the overall capacity and service level of public transit will achieve higher benefits.
This paper took the common road section of the bus lane that was used together by BRT and conventional buses as the research objective, as shown in Figure 1. From the perspectives of road sections, intersections, and bus stops, it is believed that the possible effects after sharing are mainly reflected in (1) reduction of BRT speed, (2) increase of delay at intersections, and (3) increase queuing time and queuing probability. From the point of benefit, the average travel time of road sections, the queuing time and probability, and the delay of operation time are the key indicators to consider whether to share or not. Meanwhile, some factors like stop spacing, green split, numbers of berths, and length of road sections are relevant to these key indicators, which will produce indirect effects on sharing decisions. Practical investigation and analytical models were conducted to analyze shared characteristics from multiple perspectives and explore influencing factors and mechanism of shared implementation.

2.1.2. Survey Scheme Design

To explore and compare the characteristics before and after sharing BRT-exclusive lanes with conventional buses, this paper investigated the road sections and stations respectively.
Changzhou city was chosen as the survey site, as shown in Table 1. The BRT system in Changzhou is combined with main and branch lines. The BRT main lines run on the exclusive lanes and only stop at BRT stations.
In the section where branch lines coincide with main lines, branch lines are allowed to use BRT-exclusive lanes and stations while they operate like conventional buses on other sections. Thus, the BRT branch lines of Changzhou can be regarded as conventional bus lines for study in this paper. The section where the main lines and branch lines coincide was regarded as the shared road section, and the common station as the shared stop. On the contrary, the section and station that were only run and stopped by branch lines were considered as non-shared.
The shared road section selected in the survey is located in Yanling Middle Road while the non-shared section is located in Dongfang West Road. The shared station selected was people’s park station, including one BRT main line (B2 line) and four branch lines (B12, B21, B11, and Y1). The non-shared station is Lihua Road–Guanhe Road Station, with only one BRT main line (line B2). The sections and stations investigated in this paper are close to each other, as shown in Figure 2. Meanwhile, the surrounding road traffic environment and physical conditions of the stations are similar, which is suitable to compare and analyze the variation before and after lane sharing.

2.2. Analytical Models

2.2.1. Analysis of Speed and Flow-Speed Model

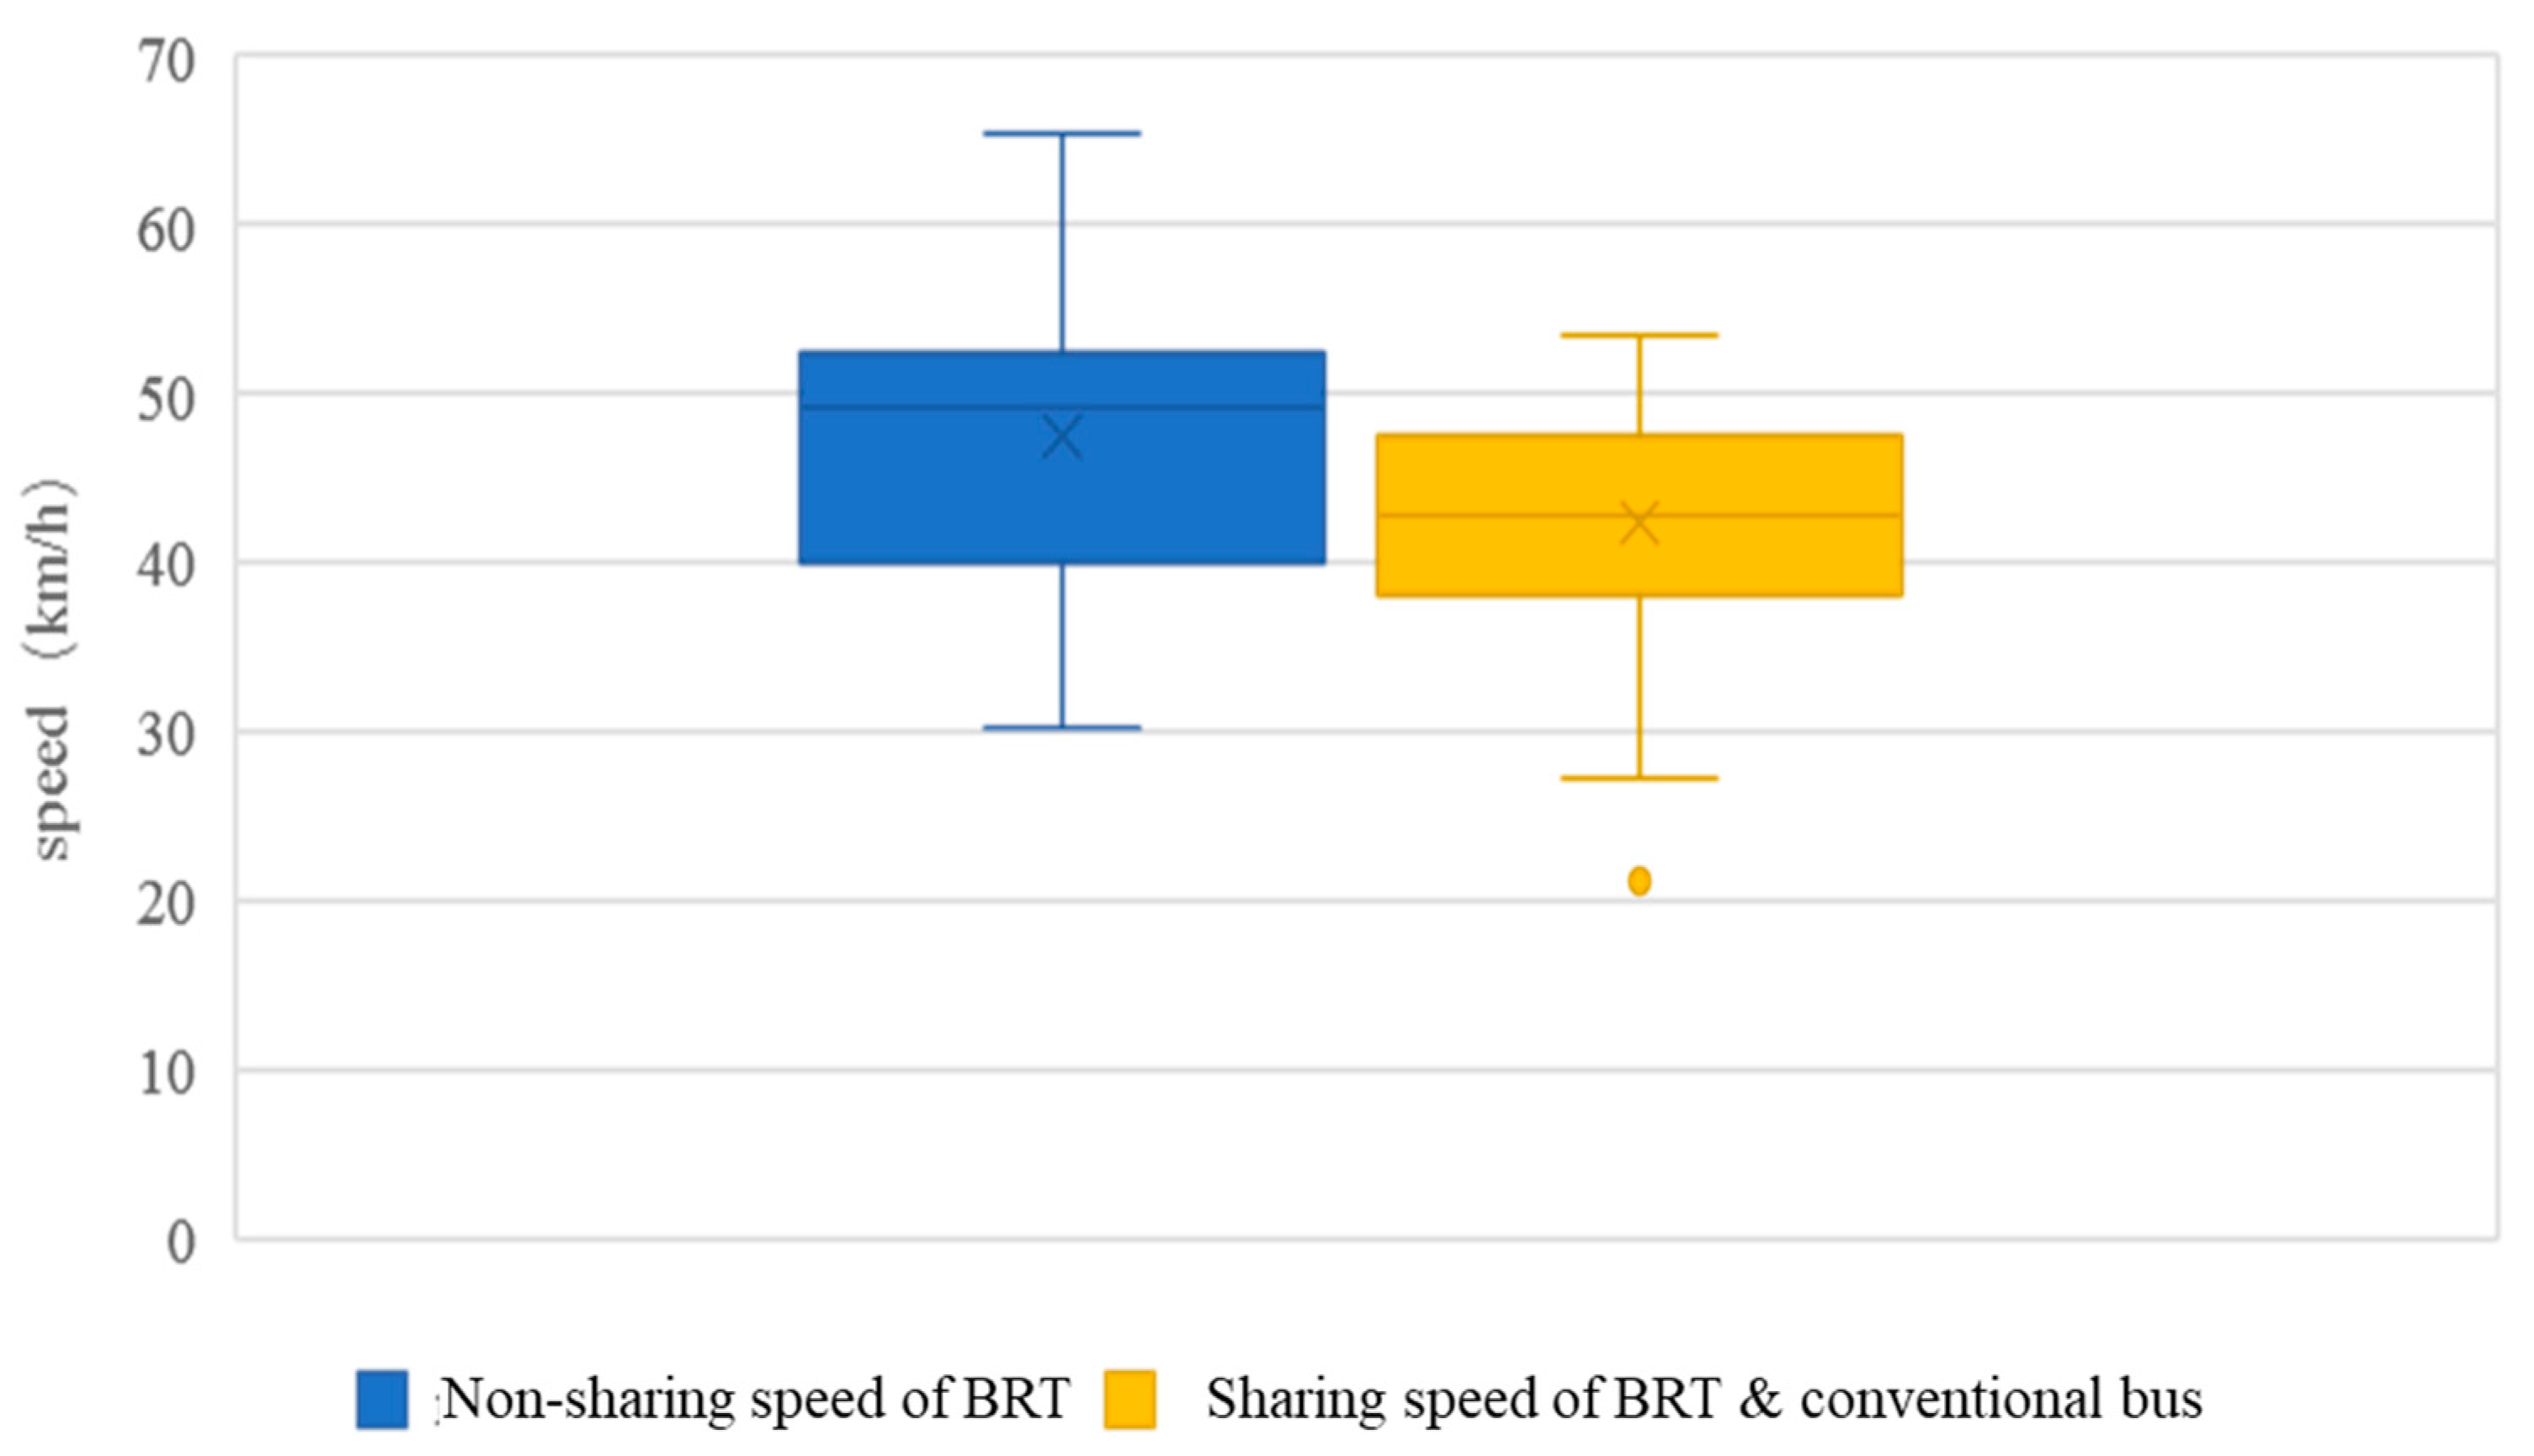
The average travel time of road section is an important indicator to measure the section operation efficiency, it can be calculated by section length to speed ratio. The video survey data were extracted and counted, and the running speed of BRT before and after lane sharing is shown in Figure 3.
From the figure above, the average running speed of BRT on non-shared section (47.51 km/h) is faster than that of two kinds of buses on shared section (42.39 km/h). After sharing lanes with conventional buses, the overall average speed of BRT decreased by about 5 km/h. The reduction of speed will lead to cumulative delay in operation. If the amount of conventional buses cannot be controlled reasonably, the speed of BRT will be greatly affected, and it will not give full play to the advantage of BRT after sharing lanes with conventional buses.
BPR function is the most commonly used method to calculate the relationship between driving time and traffic flow [20]. The section investigated was a pure one that was not directly affected by intersections. However, the phenomenon of brunching was observed during investigation, where vehicles that should have arrived at different times formed a fleet due to the cumulative delay. Although the survey was conducted far from the intersection, the speed of vehicles was not directly affected by the intersection. Due to the barrier of intersections, vehicles arriving at different times form a motorcade. After passing through the intersection, vehicles follow each other in front and behind, maintaining a certain time headway between cars. The vehicles behind the motorcade are affected by the cars in front to some extent, and their speed decreases. In this case, although the overall saturation is not high for a period of time, because the headway of this period is smaller than the overall saturation, the actual running speed of the vehicle is equivalent to the speed in the case of higher saturation. When the saturation increases, the difference between the actual headway of the following fleet and the overall saturation headway decreases, and the influence of this effect decreases with the continuous increase of saturation.
As a result, after passing through intersections, the speed of the rear car will decrease because of the influence of the front car. Therefore, an improved BPR model which contains an indirect correction factor of intersections was considered in this paper, the form of is as follows:
ζ = 1 q a q 2 + b
where
  • q : The traffic flow;
  • a , b : The undetermined coefficients.
The form of BPR model is as follows:
t = t 0 [ 1 + α ( q c ) β ]
Thus, the final form of improved BPR model is as follows:
v = v 0 [ 1 + α ( q c ) β ] 1 ( 1 q a q 2 + b )
where
  • t 0 : The free travel time;
  • v 0 : The free flow speed;
  • c : The road capacity;
  • α , β : The undetermined coefficients, the other symbols are the same as before.
According to the real data investigated in Changzhou, the parameters of improved BPR model were calibrated as the following results (see Figure 4):
α = 1.536 , β = 2.195 , a = 0.02256 , b = 659.7
The final flow-speed model of road section in this paper is
v = v 0 [ 1 + 1.536 ( q c ) 2.195 ] 1 ( 1 q 0.02256 q 2 + 659.7 )

2.2.2. Delay Analytical Model

The main impact after lane sharing on intersections is the increase of total control delay caused by the increase in inlet saturation. When a bus line passes through a mass of intersections, the accumulated delays are more obvious, so it is necessary to analyze the delay at intersections. However, no investigation for intersections has been carried out in this paper due to the complexity of influencing factors and the difficulty of survey implementation.
In urban road evaluation, control delay is an effective evaluation index. According to HCM2010 [21], control delay is the component of delay that results when a control signal causes a lane group to reduce speed or to stop. It is measured by comparison with the uncontrolled condition. In this paper, the delay model introduced by HCM2010 was used to quantify the change of vehicles delay before and after lane sharing. For intersections without initial queue, the control delay is expressed as follows:
d = d 1 × P F + d 2
d 1 = 0.5 C ( 1 g / C ) 1 [ min ( 1 , X ) ]
d 2 = 900 T [ ( X 1 ) + ( X 1 ) 2 + 8 k I X c T ]
where
d : The control delay;
d 1 : The uniform delay;
d 2 : The incremental delay;
P   F : The progression adjustment factor of signal linkage, PF value is 1 in this paper;
X : The volume to capacity ratio;
C : The signal cycle length;
g : The effective green time for lane group;
T : The duration in the analysis period;
k : The incremental delay adjustment factor for the actuated control, for fixed-period signal, k value is 0.50;
I : The incremental delay adjustment for the filtering or metering by upstream signals, the value of independent intersection is 1.0.
Therefore, for a single intersection, the delay analytical model in this paper is:
d = 0.5 C ( 1 g / C ) 1 min ( 1 , X ) + 225 [ ( X 1 ) + ( X 1 ) 2 + 4 X 0.25 c ]

2.2.3. Analysis of Queuing and M/M/n Model

Both the shared and non-shared stations surveyed in this paper are two-berth. Throughout the survey, no queuing was observed at the non-shared stop, and the statistical data of queuing probability and time at the shared stop were shown in Table 2.
As can be seen from the statistics, the average queuing time of queuing vehicles at shared stations is 25.24 s, which is long, and the overall fluctuation is large. For all vehicles, the queuing vehicles is of a high proportion at around 30%, and the average queuing time is about 7.36 s, which indicates that the shared station can easily cause queuing. To sum up, the traffic efficiency of vehicles at the shared station will be reduced because of the queuing delay.
Taking the multi-berth overtaking platform as an example, assuming that the arrival of vehicles obeys the Poisson distribution, the bus can overtake and stop at the downstream vacant berth even if the upstream berth is occupied. Thus, the queuing probability and queuing time can be solved by using the M/M/n queuing theory model to calculate its indexes [22].
For the queuing system of bus station, the service rate and service intensity are as follows:
u = 3600 t = 3600 ( λ A + λ B ) λ A t A + λ B t B
ρ = λ s u
where
  • λ A , λ B : The arrival rates of BRT and conventional buses respectively;
  • t A , t B : The average service time of BRT and conventional buses respectively;
  • λ : The arrival rate of equivalent bus flow;
  • t : The average service time of equivalent bus flow;
  • u : The average service rate of equivalent bus flow;
  • ρ : The service intensity of the system;
  • s : The number of berths at shared stations;
  • P 0 : The idle probability of service berth.
Due to the additivity of Poisson distribution, the arrival rate of total system λ is the sum of λ A and λ B ; t is the weighted average of t A and t B .
Thus:
λ = λ A + λ B
t = λ A t A + λ B t B λ A + λ B
Idle probability of the service berth is as follows:
P 0 = [ n = 0 s 1 1 n ! ( λ u ) n + 1 s ! ( 1 ρ ) ( λ u ) s ] 1
Queuing probability can be calculated as follows:
p p = j = n p j = j = n n n n ! ρ j p 0 = p n 1 ρ
Average queuing length can be calculated as follows:
L q = j = 0 ( j n ) p j = ρ p 0 n ! ( 1 ρ ) 2 ( λ μ ) n + ( λ μ )
Average queuing time can be calculated as follows:
W q = L q λ = p 0 μ n × n ! ( 1 ρ ) 2 ( λ μ ) n

3. Sharing Threshold Determination Method

By analyzing the sharing influence mechanism and clarifying the key indicators, the threshold control index and constraints can be further defined based on quantifying related factors by using analytical models, and thus the method of determining the shared threshold is proposed.

3.1. Sharing Threshold Index

The values of some relevant influencing factors have been determined on the stage of planning, such as berths, stop spacing, and intersection spacing, which cannot be adjusted in practical applications. The indicators that can be easily adjusted and controlled are the departure frequency and volume of the two types of buses.
As is generally known, the exclusive bus lanes mainly serve BRT. It is necessary to give priority to the operation efficiency of BRT, and the departure frequency of BRT should not be changed after introducing conventional buses into the lanes. Otherwise, the sharing will be meaningless. Therefore, this paper argued that the control index of shared threshold should be the departure volume of conventional buses. That is, the amount of sharing conventional buses per time unit under the settled departure frequency of BRT.

3.2. Sharing Threshold Constranits

3.2.1. The Operation Efficiency of Road Section

By comparing the operation efficiency of sections via determining the average travel time. The constraint of lower limit on shared threshold can be described as follows:
t a v g < ξ t a v g
where
  • ξ : The efficiency priority coefficient;
  • t a v g : The per capita travel time after sharing;
  • t a v g : The per capita travel time before sharing.
The corresponding formulas are as follows:
t a v g = q B R T t z p B R T + q c g t h x p c g + q s h t h x p s h q B R T p B R T + q c g p c g + q s h p s h
t a v g = q B R T t z p B R T + q c g t z p c g + q s h t h x p s h q B R T p B R T + q c g p c g + q s h p s h
where
  • q B R T : The BRT flow;
  • q c g : The conventional bus flow;
  • q s h : The car flow;
  • t z : The travel time of vehicles on BRT lane before sharing;
  • t h x : The travel time of vehicles on social driveway before sharing;
  • t z : The travel time of vehicles on BRT lane after sharing;
  • t h x : The travel time of vehicles on social driveway after sharing;
  • p B R T : The passenger volume of BRT;
  • p c g : The passenger volume of conventional buses;
  • p s h : The passenger volume of cars.

3.2.2. The Queuing Probability

The constraint of upper limit on shared threshold under the queuing probability as the indicator is as follows:
P P p e r m i t
where
  • P : The queuing probability at shared stop;
  • P p e r m i t : The maximum allowable queuing probability, 10–25% is usually suggested.

3.2.3. The Operation Time

The constraint of upper limit on shared threshold under the total operation time as the indicator is as follows:
T g z + T g j + T g l = t g z n z + t g j n j + L v g l L v y
where
  • L : The length of the shared section;
  • T g z : The delay of all stops after sharing;
  • T g j : The delay of all intersections after sharing;
  • T g l : The operation time of vehicles on BRT lane after sharing;
  • t g z : The average delay of each stop after sharing;
  • t g j : The average delay of each intersection after sharing;
  • n z : The number of stops on shared section;
  • n j : The number of intersections on shared section;
  • v g l : The speed of vehicles on shared section;
  • v y : The speed of BRT at lowest level of service.

3.3. Sharing Threshold Interval

According to the judgement condition of the three kinds of constraints above, the lower limit of shared conventional buses volume was determined by the operation efficiency constraint. By comparing the two values calculated by the queuing probability and operation time constraints, the smaller one was selected as the upper limit.
The detailed determination process of shared threshold was summarized as shown in Figure 5. First, an initial value was set for each constraint. (i.e., 0 veh/h for lower limit; 200 veh/h for upper limit.) Then, adjust the value until the results meet the constraints by conducting the cycle calculation. The interval of shared threshold can be finally obtained.

4. Numerical Examples

4.1. Indicator Values

The determination of shared threshold is related to relevant factors and varies with different values of indicators. In this example, the assumed values of indicators are shown in Table 3.

4.2. Calculation of Lower Limit

The variation trend of per capita travel time with the change of departure volume of conventional buses before and after sharing was shown in Figure 6. When the value of is 0.95 as shown in Table 3, which means that the per capita travel time can be reduced by no more than 5% after sharing, the conventional buses can be introduced into the BRT-exclusive lane.
It can be observed from Figure 6 that, when the departure volume of conventional buses is over 15.3 veh/h (rounding up to 16 veh/h), the per capita travel time after sharing is less than that before sharing, which will meet the requirements of constraint. Therefore, the lower limit in this example is 16 veh/h.
In the calculation process of this constraint, different values of car flow will lead to different results of threshold. In order to analyze the relationship between social traffic flow and shared threshold, for a one-way three-lane urban road (including a BRT lane), the lower limits of departure volume of conventional buses under different car flow were shown in Table 4.
From the table above, the minimum amount of conventional buses that need to be introduced into the BRT-exclusive lanes will become larger with the decrease of the car flow. As the flow of cars is small, the running speed of conventional buses before sharing is less interfered with by cars, and the improvement of the overall running efficiency after sharing is not as significant as the sharing when the flow is large. Therefore, only when the lower limit value is larger can the overall efficiency be significantly improved by introducing more sharing conventional buses.
On the contrary, when the social flow is large, even if a little sharing is introduced, it can meet the requirement of overall efficiency improvement, which shows that, when car flow is large, the marginal utility of sharing is greater than that of low car flow. That is to say, sharing BRT-exclusive lanes with conventional buses is more meaningful when the car flow is high.

4.3. Calculation of Upper Limit

4.3.1. Upper Limit Constrained by Queuing Probability

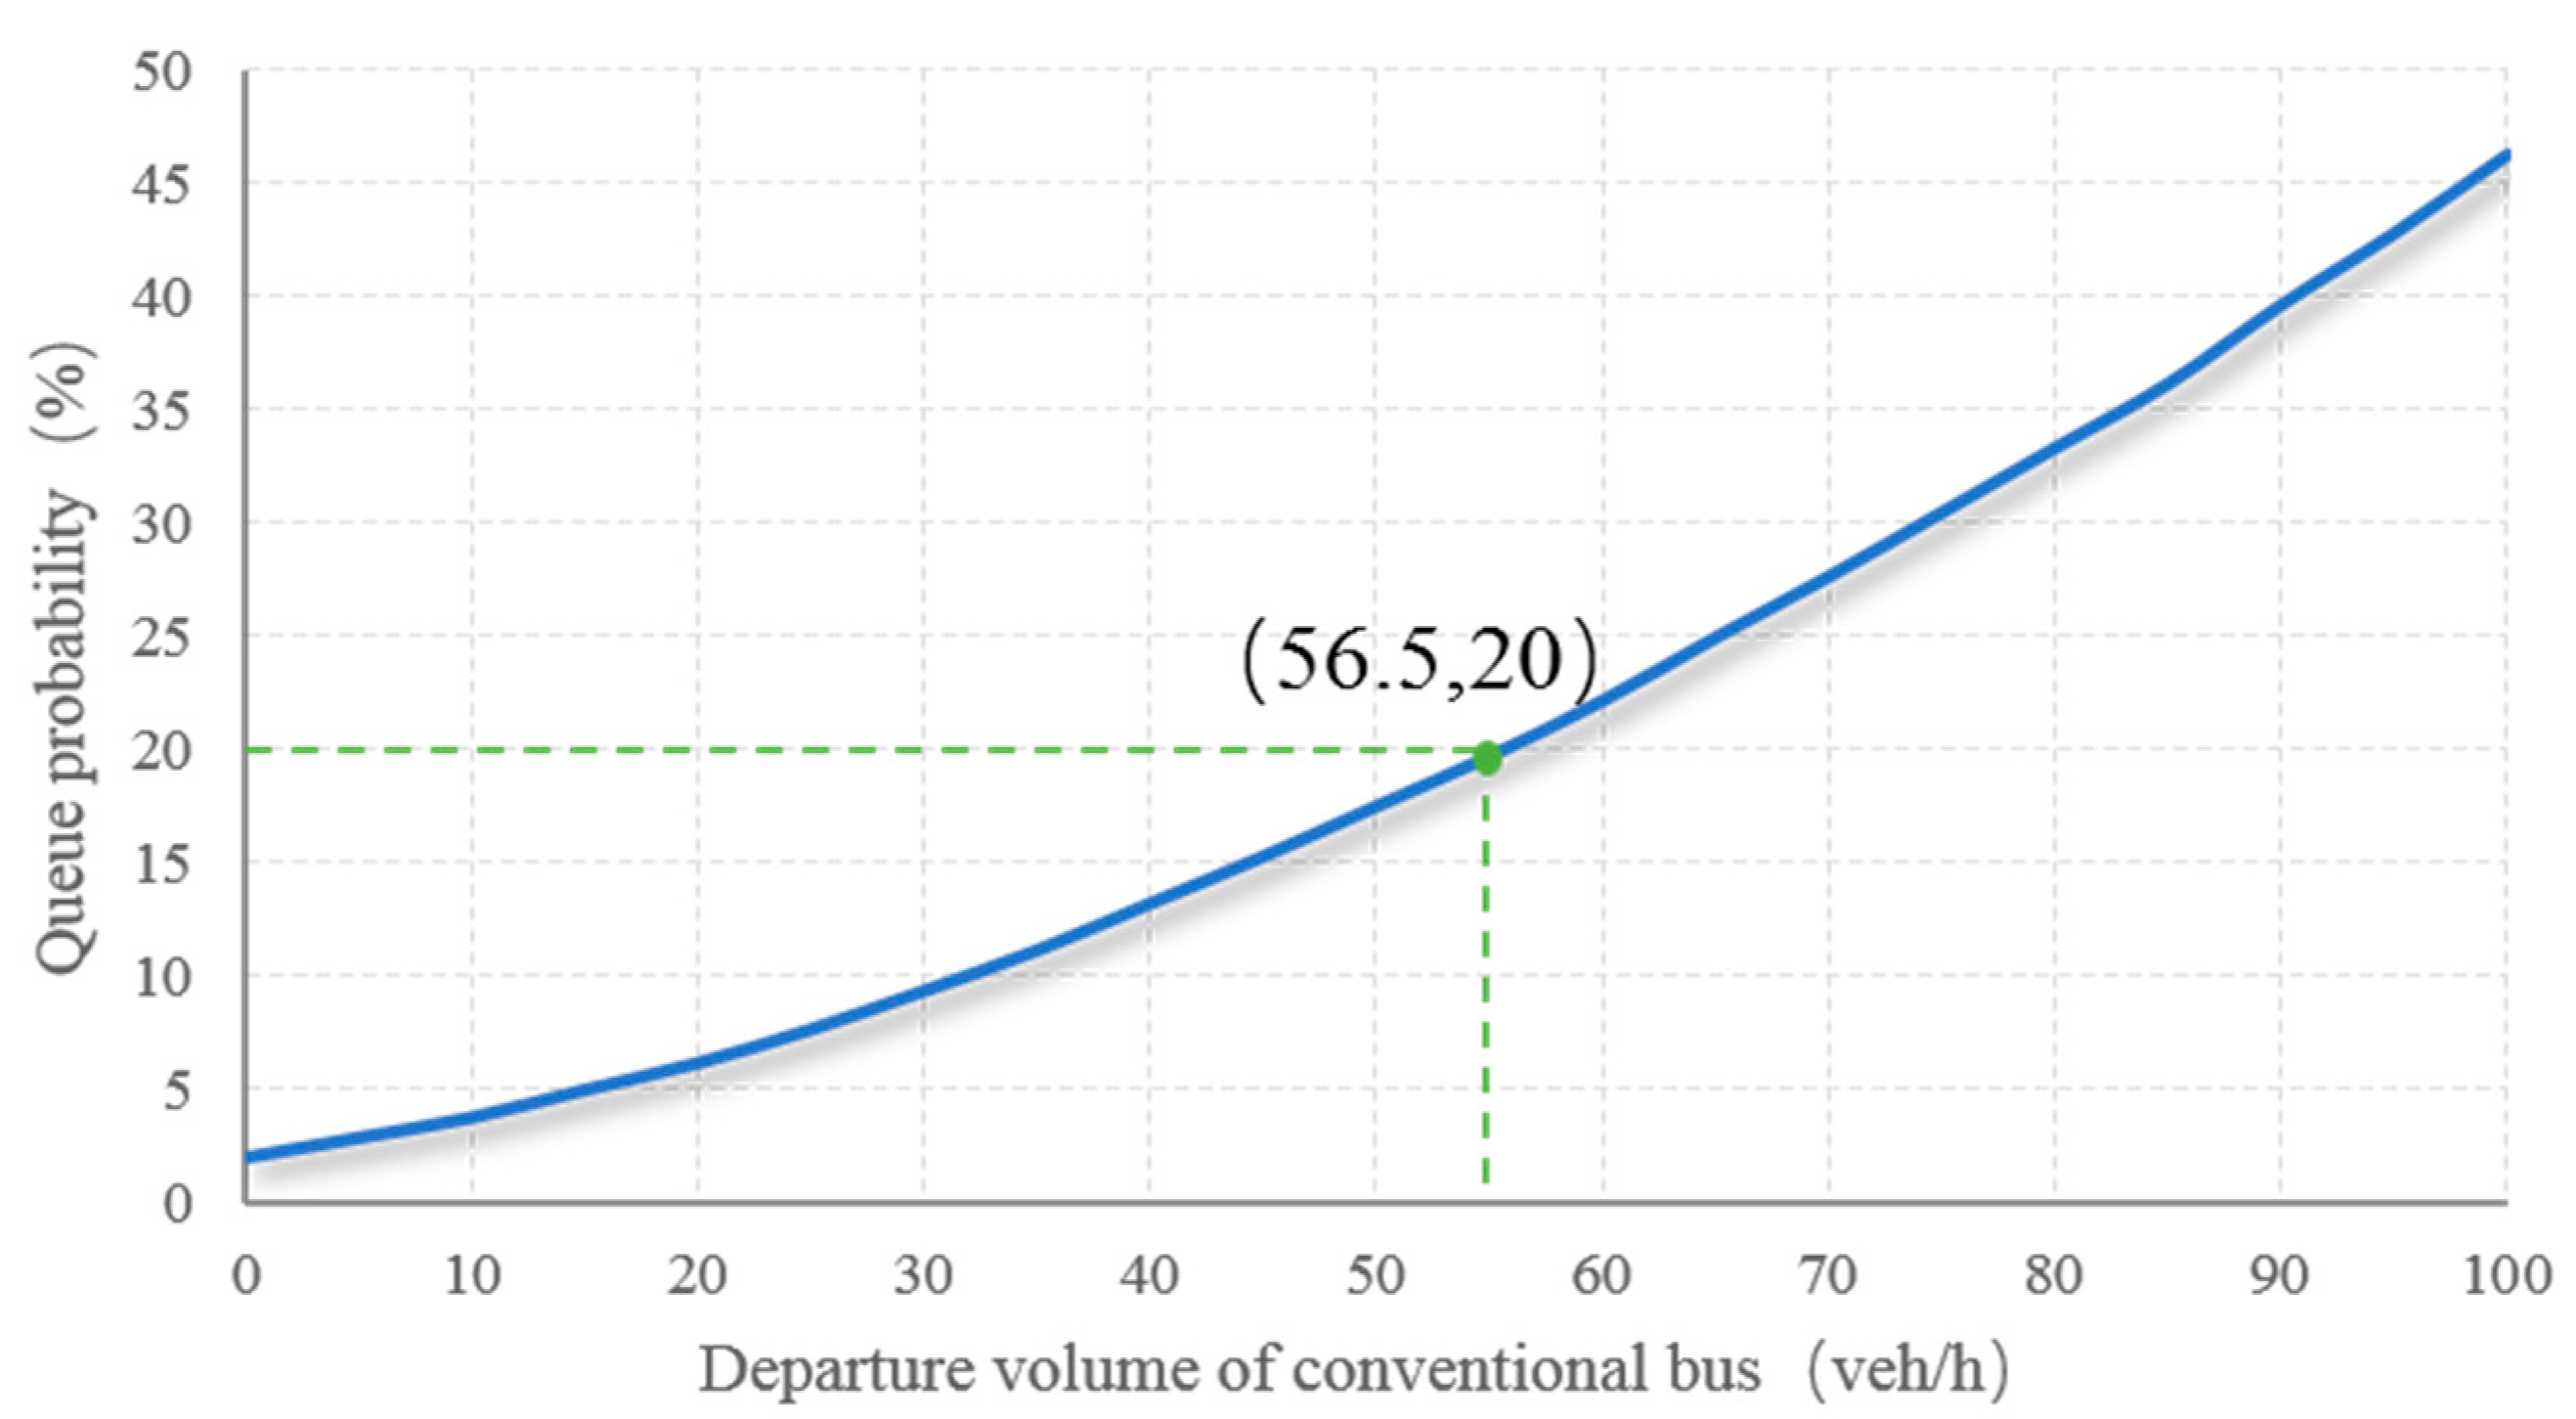
The queuing probability under different departure volume of conventional buses was calculated, as shown in Figure 7. Since P p e r m i t is 20%, the upper limit in this example is 56.5 veh/h (rounding down to 56 veh/h).
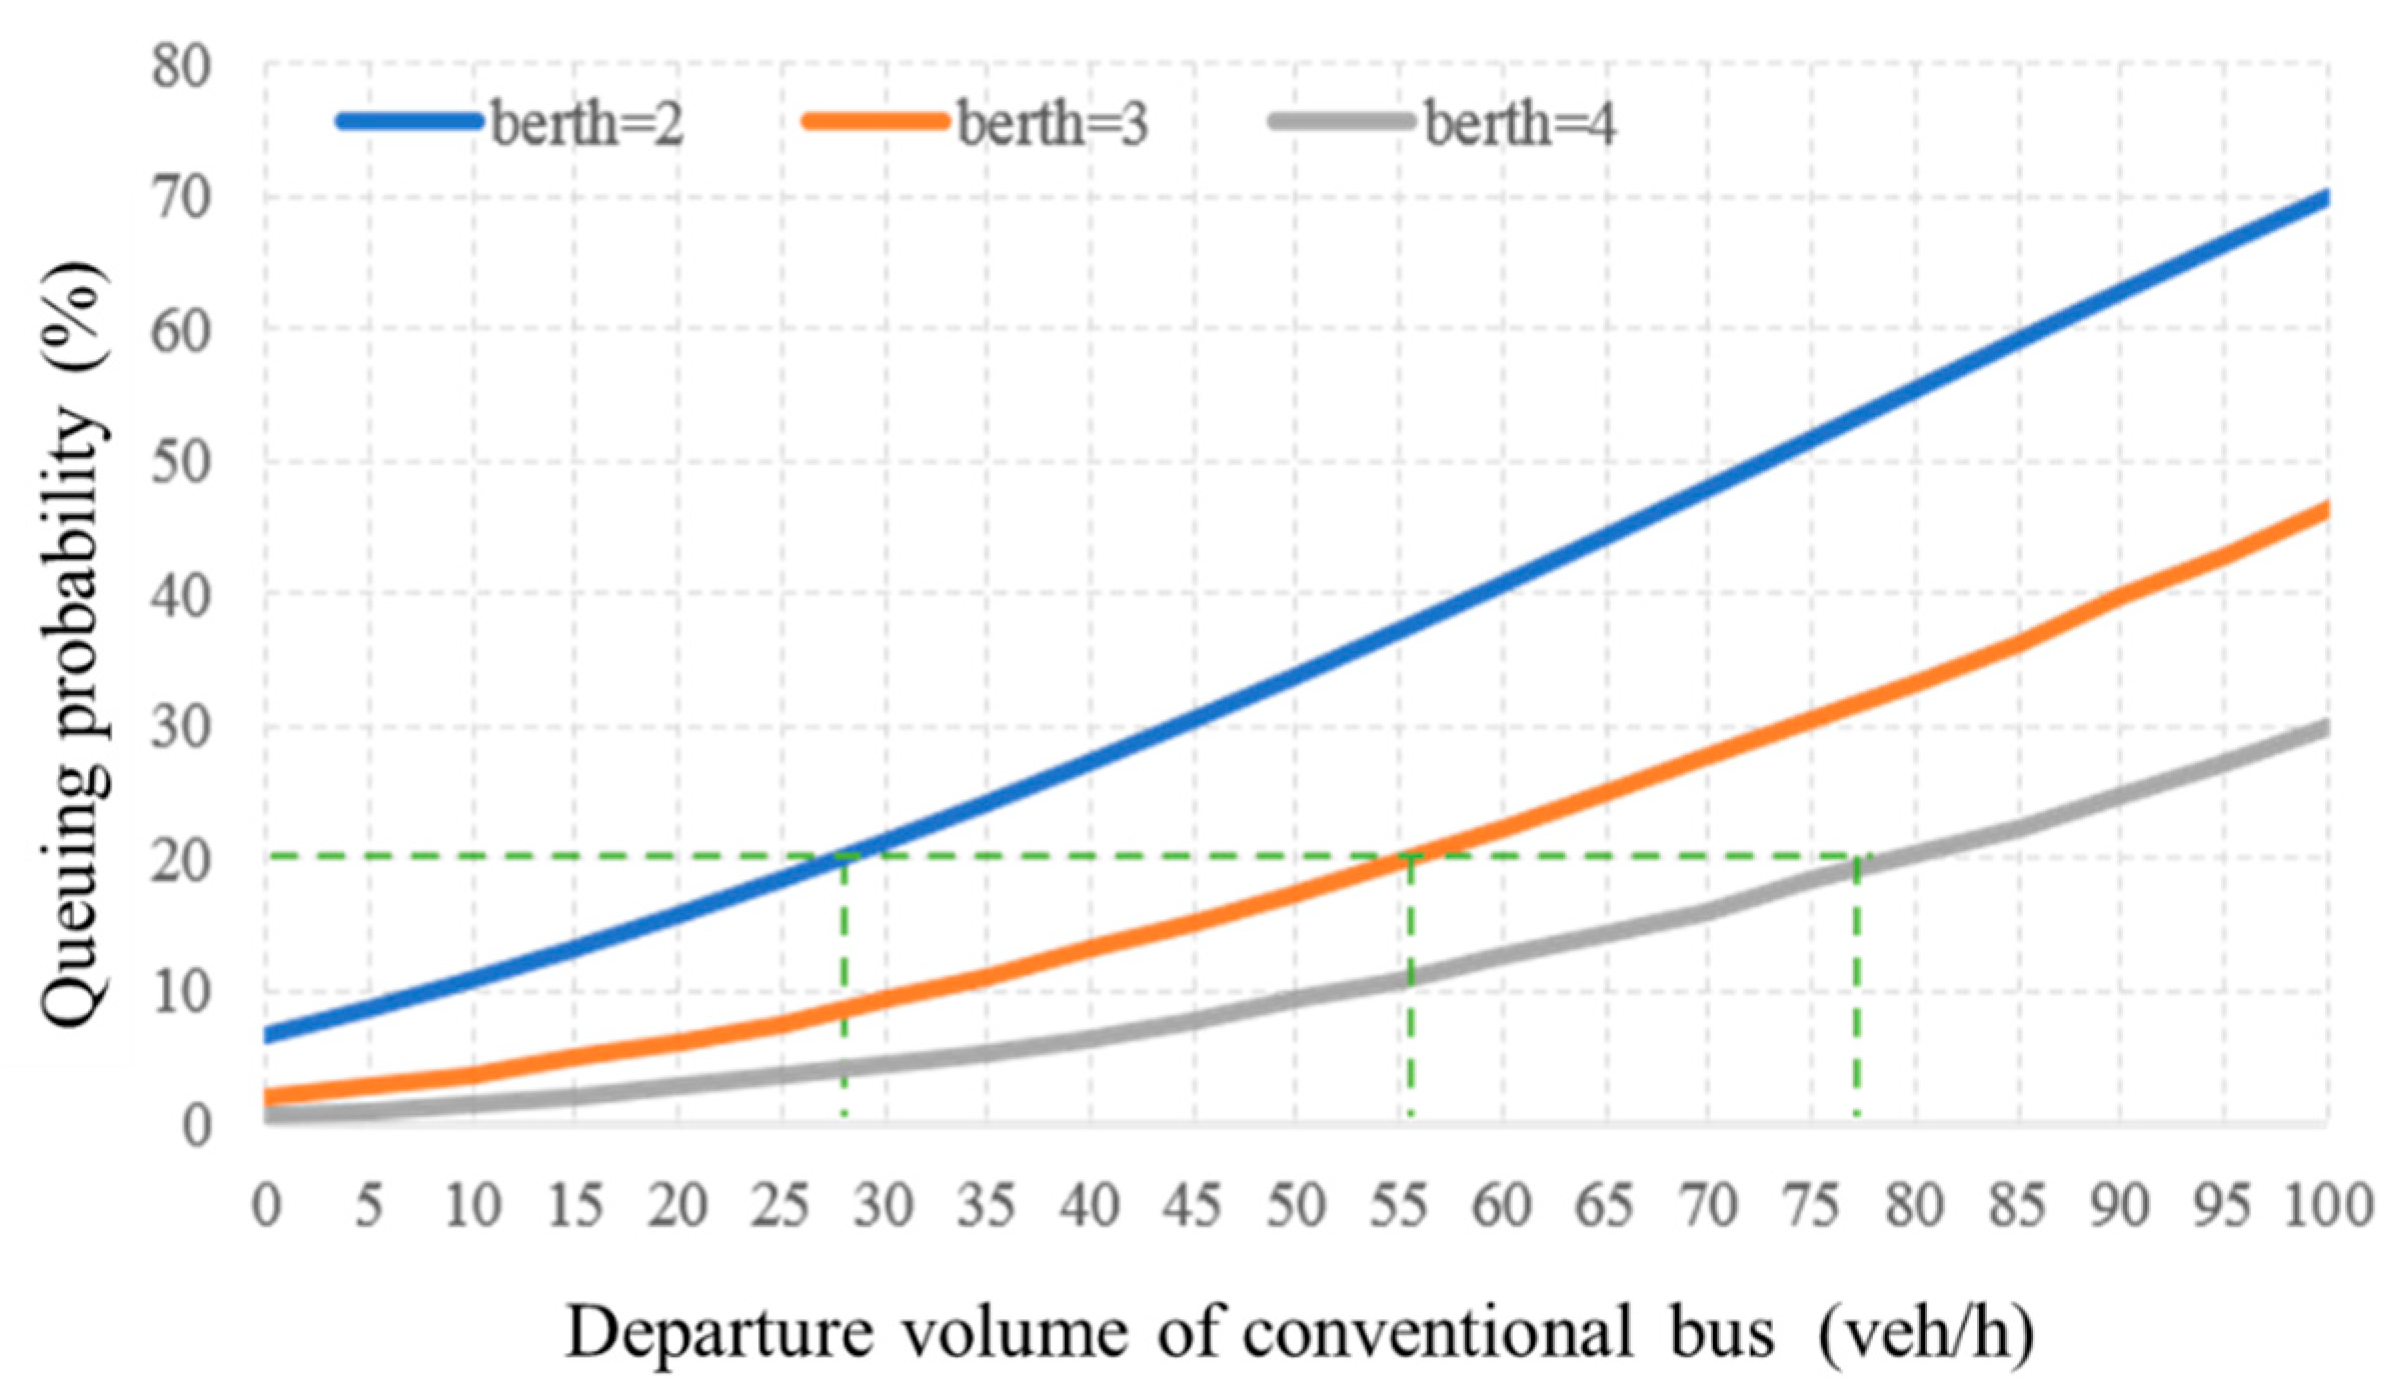
The number of berths is the main influencing factor of queuing probability. Figure 8 shows the trend of queuing probability change with different berths.
It is apparent from the figure that the number of berths has a great influence on queuing probability, and it will be lower with the increase of departure volume. Moreover, as for the maximum allowable queuing probability of 20%, the upper limits of departure volume under 2, 3, and 4 berths are 28 veh/h, 56 veh/h, and 79 veh/h, respectively.

4.3.2. Upper Limit Constrained by Operation Time

The change of overall operation time on the shared road section with the increase of departure volume is shown in Figure 9. As the speed of BRT at lowest level of service is 20 km/h and the length of shared road section is 10 km, the constraint of overall operation time should not exceed 30 min. The upper limit in this example is 76.3 veh/h (rounding down to 76 veh/h).
The effects of stop spacing and intersections spacing on operation time are analyzed respectively as follows (see Figure 10):
According to the figures above, the greater stop and intersection spacing are, the less operation time is. It was found that the influence of stop spacing on running time is slightly higher than that of intersections.

4.4. Results of Scenarios

For the purpose of threshold comparison and feasibility verification, three scenarios with different stop spacing, intersection spacing, and number of berths are shown in Table 5.
As a result, the queuing probability and operation time respectively constrain the upper limit of shared threshold in different scenarios. The characteristics and are summarized as follows:
  • Under each scenario above, threshold within the number of berths ranging from 2–4 were compared. The more berths are, the bigger upper limit is and the larger interval of threshold is. In practical engineering applications, it is possible to improve traffic conditions, like increasing the number of berths, which can expand the shared threshold interval, so that there will be a higher possibility of sharing implementation.
  • When the spacing of intersections and stops is not so large (scenario 1, 2), the value under the operation time constraint is smaller than that calculated by queuing probability constraint, which determines the upper limit of threshold. When the spacing is small, a greater delay will be caused during the process of deceleration, approaching, stopping, acceleration, and leaving at the bus stop or intersection.
  • With the spacing of stops and intersections reasonably improved (scenario 3), the operation time becomes the constraint of the maximum of conventional buses that can be introduced into exclusive bus lanes.
Through the comparative analysis among different scenarios, the shared threshold is influenced by various factors. The method proposed in this paper is from theoretical perspectives, and therefore there is certain distance from the actual promotion and application. Nevertheless, it is still of great significance to provide guidance for future practice.

5. Conclusions

According to the actual investigation data, the characteristics after Sharing BRT-exclusive bus lanes with conventional buses were compared from the perspective of road section and bus stop, and key indicators and related factors were identified through the analysis. Three constraints—namely, road section operation efficiency, station queuing probability, and runtime—were proposed to determine whether the BRT-exclusive lane was shared or not. For further study on the proper intervals that conventional buses can be introduced into the BRT-exclusive lane, the departure volume of conventional buses was selected as the shared threshold control index that can be adjusted. Furthermore, in order to quantity the related indicators of constraints like speed, delay, and queuing probability, three analytical models were presented in this paper.
Afterward, the complete process of determining the shared threshold was given, and several scenarios under different physical environment were set up to verify the validity of the method. The results show that lower limits of shared threshold were depended on road section operation effectiveness constraint, and upper limits under different hypothetical scenarios were determined by different constraints between runtime and queuing probability. For example, when the intersection and stop spacing is small, upper limits are mostly considered by runtime constraint. On the contrary, queuing probability is the main constraint of the upper limit.
Sustainability is the trend of future transportation development. Sharing BRT-exclusive lanes with conventional buses is beneficial to improve the overall operation efficiency and the resource utilization of urban public transport system, which can make the development of transportation more sustainable. The shared threshold determination method proposed will play an important role in guiding practical application.

Author Contributions

The authors confirm contribution to the paper as follows: J.C. directed this study and acquired the funding; Y.Y. analyzed the data, wrote and revised the paper; Q.Y. and J.Y. conducted the survey; Y.Y. and J.Y. reviewed and edited the paper.

Funding

This research was funded by the Key Project of National Natural Science Foundation of China (Grant No. 51638004).

Conflicts of Interest

The authors declare that there are no conflict of interest regarding the publication of this article.

References

  1. China M.O.T.O. 2016 Statistical Bulletin of the Development of the Transportation Industry, Finance & Accounting for Communications. Heavy Veh. 2017, 5, 92–97. [Google Scholar]
  2. Deng, T.; Nelson, J.D. Recent Developments in Bus Rapid Transit: A Review of the Literature. Transp. Rev. 2011, 31, 69–96. [Google Scholar] [CrossRef]
  3. Jepson, D.; Ferreira, L. Assessing travel time impacts of measures to enhance bus operations. Part II: Assessment criteria and main findings. Road. Transp. Res. 2000, 9, 3–18. [Google Scholar]
  4. Tiezhu, L.; Ding, J.; Sun, Y.; HE, Z. Traffic Condition for Bus Lane Setting on Urban Arteries. J. Kunming Li 2010, 35, 56–60. [Google Scholar]
  5. Liu, W.; Bie, M.; Zhang, J.X.; Zhu, S.Y. Study on traffic conditions for setting up bus lanes. J. Chongqing Jiaotong Univ. 2005, 24, 129–132. [Google Scholar]
  6. Viegas, J.; Lu, B. Widening the scope for bus priority with intermittent bus lanes. Transp. Plan. Technol. 2001, 24, 87–110. [Google Scholar] [CrossRef]
  7. Viegas, J.; Lu, B. Bus priority with intermittent bus lane. In Proceedings of the Seminar D, European Transportaion Conference, Cambridge, UK, 27–29 September 1999. [Google Scholar]
  8. Duerr, P.A. Dynamic Right-of-Way for Transit Vehicles: Integrated Modeling Approach for Optimizing Signal Control on Mixed Traffic Arterials. Transp. Res. Rec. J. Transp. Res. Board 2000, 1731, 31–39. [Google Scholar] [CrossRef]
  9. Janos, M.; Furth, P. Bus priority with highly interruptible traffic signal control: Simulation of San Juan’s Avenida ponce de leon. Transp. Res. Rec. J. Transp. Res. Board 2002, 1811, 157–165. [Google Scholar] [CrossRef]
  10. Lin, W.H. Quantifying Delay Reduction to Buses with Signal Priority Treatment in Mixed-Mode Operation. Transp. Res. Rec. J. Transp. Res. Board 2002, 1811, 100–106. [Google Scholar] [CrossRef]
  11. Feng, S.; Dian-Hai, W.; Dong-Fang, M.A.; Sheng, J. Threshold values of traffic flow for the provision of exclusive. J. Beijing Inst. Technol. 2013, 22, 342–349. [Google Scholar]
  12. Han, H. Feasibility Study of Taxi Driving on Bus Lanes; Beijing Jiaotong University: Beijing, China, 2007. [Google Scholar]
  13. Shalaby, A.S. Simulating performance impacts of bus lanes and supporting measures. J. Transp. Eng. 1999, 125, 390–397. [Google Scholar] [CrossRef]
  14. Huang, Y.J.; Chen, X.W.; Zhang, W.H. Comparison of traffic flow models on the road sections before and after the establishment of bus lanes. J. Huazhong Univ. Sci. Technol. 2003, 20, 68–70. [Google Scholar]
  15. Lei, L. Effects of Bus Lanes on Road Traffic; Beijing Jiaotong University: Beijing, China, 2008. [Google Scholar]
  16. Zhou, Z.Y.; Guang, Y.J.; Chen, J.; Wang, W. Study on the characteristics of the bus stop before and after the establishment of the dedicated bus lane. Highw. Traff. Technol. 2004, 7, 103–107. [Google Scholar]
  17. Vedagiri, P.; Arasan, V.T. Modelling modal shift due to the enhanced level of bus service. Transport 2009, 24, 121–128. [Google Scholar] [CrossRef]
  18. Basso, L.J.; Guevara, C.A.; Gschwender, A.; Fuster, M. Congestion pricing, transit subsidies and dedicated bus lanes: Efficient and practical solutions to congestion. Transp. Policy 2011, 18, 676–684. [Google Scholar] [CrossRef]
  19. Khoo, H.L.; Ong, G.P. Bi-Objective Optimization Approach for Exclusive Bus Lane Scheduling Design. J. Comput. Civ. Eng. 2015, 29, 04014056. [Google Scholar] [CrossRef]
  20. Wei, J.; Cui, Y. Reversible Lane Scheme Selection Model Based on the BPR Function and Environmental Benefits. In Proceedings of the 2nd International Conference on Materials Science, Machinery and Energy Engineering, Dalian, China, 13–14 May 2017. [Google Scholar]
  21. Transportation Research Board. Highway Capacity Manual 2000; National Research Council: Washington, DC, USA, 2000.
  22. Lipsky, L. Queuing Theory: A Linear Algebraic Approach, 2nd ed.; Springer Science+Business Media, LLC: New York, NY, USA, 2008. [Google Scholar]
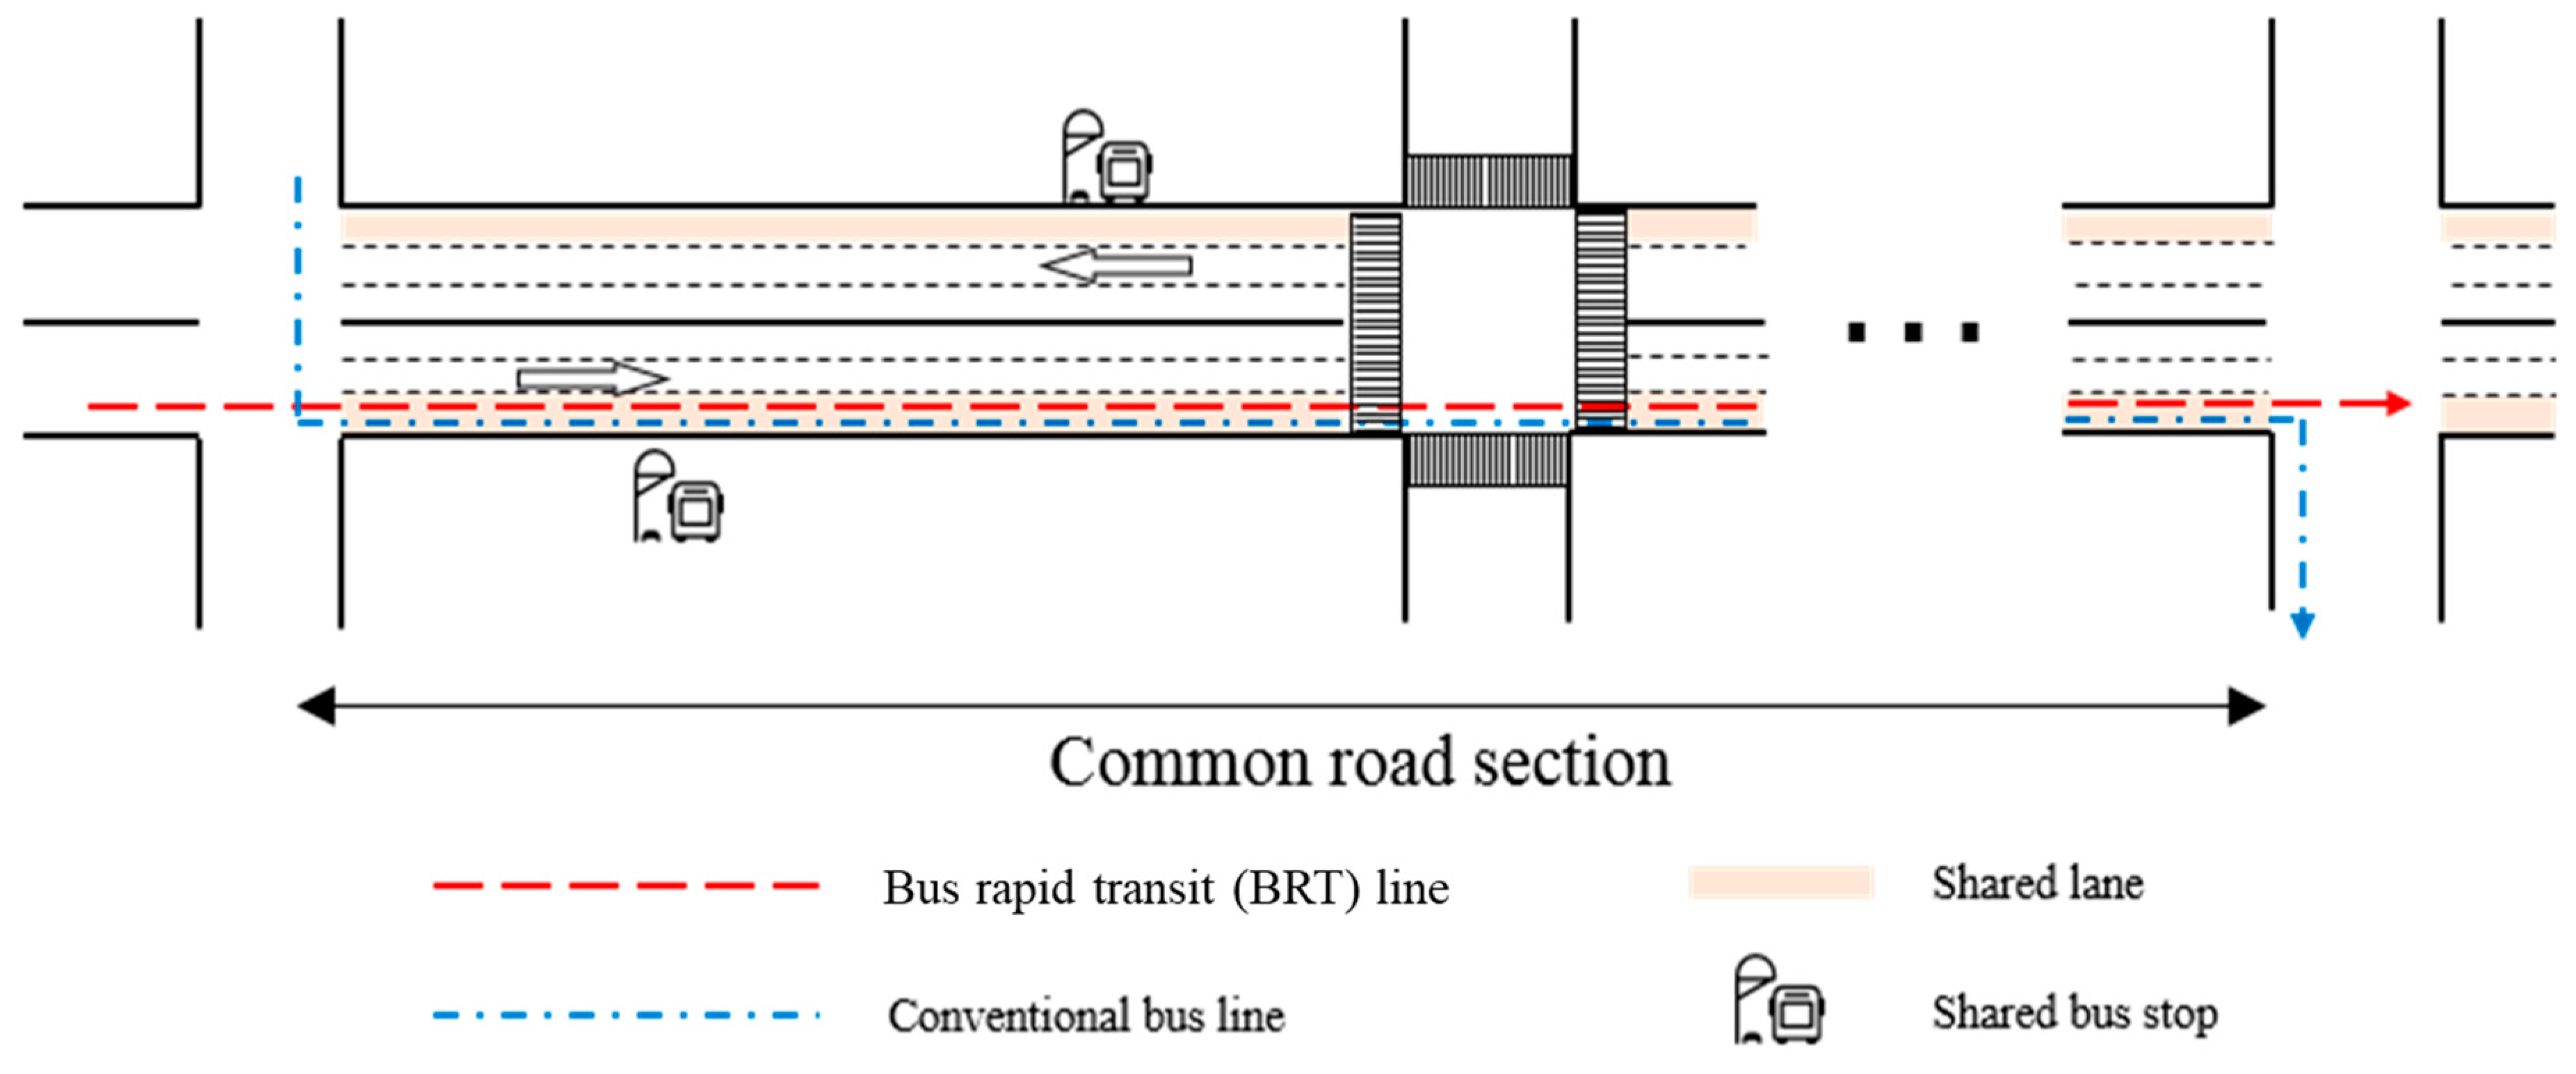
Figure 1. Objective of research.
Sustainability 11 04592 g001
Figure 2. Spatial distribution of the survey spots and areas.
Sustainability 11 04592 g002
Figure 3. Comparison of speed before and after lane sharing.
Sustainability 11 04592 g003
Figure 4. The fitting curve of the improved Bureau of Public Road (BPR) model.
Sustainability 11 04592 g004
Figure 5. Sharing threshold interval determination flowchart.
Sustainability 11 04592 g005
Figure 6. The lower limit of threshold constrained by per capita travel time.
Sustainability 11 04592 g006
Figure 7. The upper limit of threshold constrained by per queuing probability.
Sustainability 11 04592 g007
Figure 8. The influence of berths on queuing probability.
Sustainability 11 04592 g008
Figure 9. The upper limit of threshold constrained by operation time.
Sustainability 11 04592 g009
Figure 10. The influence of stop and intersection spacing on operation time.
Sustainability 11 04592 g010
Table 1. Survey scheme design.
RespondentsLocationMethodTimeData
Road sectionSharedYanling Middle RoadVideo Survey2017.9.26–2017.9.28
(peak period: 7:00–9:00; 16:00–18:00); (off-peak period: 9:00–10:00; 15:00–16:00)
Speed
Flow
Non-SharedDongfang West Road
StationSharedPeople’s Park StationSurvey at Stop2017.9.26–2017.9.28
(peak period: 7:00–9:00; 16:00–18:00)
Arrival Time
Service Time
Queuing Time
Boarding and Alighting
Non-SharedLihua Road-Guanhe Road Station
Table 2. The queuing proportion and queuing time.
Proportion of Queuing Vehicles in all Vehicles (%)Average Queuing Time of All Vehicles (s)Average Queuing Time of Queuing Vehicles (s)Maximum Queuing Time of Queuing Vehicles (s)Standard Deviation
29.1%7.3625.247615.79
Table 3. Assumed values of indicators.
IndicatorsAssumed Value
Length of Shared Road Section, L 10 km
Flow of BRT, q B R T 30 veh/h
Flow of Cars, q s h 30 veh/h
Average Intersection Spacing800 m
Average Stop Spacing800 m
Average Green Ratio of Intersection, g / C 0.6
Average Service Time of BRT and Conventional Buses, t 30 s
The Maximum Allowable Queuing Probability, P p e r m i t 20%
The Number of Berths, s 3
Passenger Volume of BRT, p B R T 60
Passenger Volume of Conventional Buses, p c g 30
Passenger Volume of Cars, p s h 2
Coefficient of Efficiency Priority, ξ 0.95
Speed of BRT at Lowest Level of Service, v y 20 km/h
Arrival Distribution of BusesPassion Distribution
Table 4. The departure volume of conventional buses under different cars.
Flow of Cars (veh/h/ln)Departure Volume of Conventional Buses (veh/h)Flow of Cars (veh/h/ln)Departure Volume of Conventional Buses (veh/h)
20010145014
2506750013
3004255011
350256009
400166507
Table 5. The calculation results of sharing threshold under three scenarios.
Scenario 1: Average Stop Spacing = 600 m, Average Intersection Spacing = 600 m
Number of BerthsLower Limit by Operation Efficiency (veh/h)Upper Limit by Queuing Probability (veh/h)Upper Limit by Operation Time (veh/h)Interval of Threshold
(veh/h)
21628//
3568/
47917(16, 17)
Scenario 2: Average Stop Spacing = 700 m, Average Intersection Spacing = 700 m
Number of BerthsLower Limit by Operation Efficiency (veh/h)Upper Limit by Queuing Probability (veh/h)Upper Limit by Operation Time (veh/h)Interval of Threshold
(veh/h)
2162819(16, 19)
35647(16, 47)
47963(13, 63)
Scenario 3: Average Stop Spacing = 800m, Average Intersection Spacing = 800m
Number of BerthsLower Limit by Operation Efficiency (veh/h)Upper Limit by Queuing Probability (veh/h)Upper Limit by Operation Time (veh/h)Interval of Threshold
(veh/h)
2162843(16, 28)
35676(16, 56)
479122(16, 79)
Note: The upper limits are defined by highlighted values.