Optimal Alignments for Designing Urban Transport Systems: Application to Seville


1
Research Department, Link Campus University of Rome, Via del Casale di San Pio V, 44, 00165 Rome, Italy
2
Instituto de Matemáticas de la Universidad de Sevilla, (IMUS), Universidad de Sevilla, Avenida Reina Mercedes 41012 Seville, Spain
3
Departamento de Matematica Applicada I, Universidad de Sevilla, Avenida Reina Mercedes, 41012 Seville, Spain
4
Departamento de Matematica Applicada II, Escuela Técnica Superior de Ingeniería, Universidad de Sevilla, Camino de los Descubrimientos, 41092 Seville, Spain
*
Author to whom correspondence should be addressed.
Sustainability 2019, 11(18), 5058; https://doi.org/10.3390/su11185058
Submission received: 31 July 2019
/
Revised: 9 September 2019
/
Accepted: 10 September 2019
/
Published: 16 September 2019
(This article belongs to the Special Issue Sustainability Issues in Public Transport)
Abstract
:The achievement of some of the Sustainable Development Goals (SDGs) from the recent 2030 Agenda for Sustainable Development has drawn the attention of many countries towards urban transport networks. Mathematical modeling constitutes an analytical tool for the formal description of a transportation system whereby it facilitates the introduction of variables and the definition of objectives to be optimized. One of the stages of the methodology followed in the design of urban transit systems starts with the determination of corridors to optimize the population covered by the system whilst taking into account the mobility patterns of potential users and the time saved when the public network is used instead of private means of transport. Since the capture of users occurs at stations, it seems reasonable to consider an extensive and homogeneous set of candidate sites evaluated according to the parameters considered (such as pedestrian population captured and destination preferences) and to select subsets of stations so that alignments can take place. The application of optimization procedures that decide the sequence of nodes composing the alignment can produce zigzagging corridors, which are less appropriate for the design of a single line. The main aim of this work is to include a new criterion to avoid the zigzag effect when the alignment is about to be determined. For this purpose, a curvature concept for polygonal lines is introduced, and its performance is analyzed when criteria of maximizing coverage and minimizing curvature are combined in the same design algorithm. The results show the application of the mathematical model presented for a real case in the city of Seville in Spain.
1. Introduction
The growing concern surrounding the environmental impacts generated by the use of fossil fuel sources and global warming effects are causing an increasing interest in study and the optimization of the configurations of transport systems [1,2,3,4] and public transport network [5,6]. Planning urban rapid transit systems is a complex decision process that takes place over a long period and involves the participation of designers, engineers, politicians, and social committees. In general, the total planning process is usually split into several stages, where one of these early phases is the generation of alignments to compose the urban transport system.
The network design problem being globally considered consists of determining transit routes, locating main transit centers, and allocating the associated frequencies. As García et al. [7] pointed out, network design problems can have:
- Continuous nature—when, for instance, network topology is previously given and the objective is the optimal determination of system parameters;
- Discrete nature—if a part of network topology, edges (alignments), and/or nodes (main stations) is the objective to be determined.
Since transit network design is a non-convex problem (considered as a continuous problem [8]) and is computationally NP-hard (understood as a discrete problem [9]), associated solution methods are commonly based on algorithmic procedures. These methods involve both continuous and integer decision variables and use techniques based on a combination of different heuristics and/or meta-heuristics (such as genetic algorithms, tabu search, simulated annealing, local convergence, etc.). Some interesting references for this discussion point are:
- Hertz and Widmer [12], which contains some guidelines to adapt meta-heuristics to combinatorial optimization problems.
Approaches proposed in this article are concerned with a discrete point of view.
On the web page www.UrbanRail.net, we can find information about all the rapid transit systems that exist in the world. In a considerable portion of cities, metropolitan transport systems are currently being built from scratch. The topological configurations of the already existing networks indicate, in many cases, that their history started with building a few basic quasi-linear corridors and, in a later phase, the aforementioned networks were complemented by adding circular lines or other quasi-linear corridors with the objective of extending the influence of the earlier lines. Nevertheless, analytical tools used for the selection of these alignments are little known. To mitigate this lack of information, our objective is to develop procedures that select the early basic alignments to build the first phase of an urban transit network.
Due to the multiplicity of constraints and objectives, the problem of generating a good transit network is too complicated to handle by means of analytical methods; therefore, the global problem could be tackled by piecemeal development by locating one alignment at a time such that, ultimately, a collection of good solutions with respect to the main criteria would be obtained.
The vehicle routing network plays a key role in logistics costs. Recent research [13,14,15,16,17] underlined the fact that most convenient itineraries that a vehicle should follow in a transit line can be obtained from vehicle routing problem (VRP) approaches.
The literature on route design applied to transit systems planning is rich of contributions. Dell’Olmo et al. [18] analyzed a set of alternative itineraries and proposed a multicriteria shortest path algorithm that considers the Pareto optimal itineraries between the places of departure and arrival. As an approach for VRP issues, a hybrid genetic algorithm was also proposed by Ho et al. [19].
Concerning the railway network, De Los Santos et al. [20] developed a heuristic algorithm in order to define, for each line, the number of services per hour and the number of carriages of a defined metro, improving the satisfaction for users. Tu et al. [21] demonstrated the advantages of using a metaheuristic method based on a bi-level Voronoi diagram to approach the VRP. The benefits of using a mathematical approach based on a Voronoi diagram are also underlined in a real application for the city of Seville [22].
In this sense, powerful research mathematical models can solve important issues in regard to the position of station location and can provide good results in terms of quality alignments and improving the rapid transit network planning [23]. Laporte et al. [24] highlighted the importance of defining an optimal timetable for all itineraries of a transport network by knowing the departure and the arrival hours. Canca and Barrena [25] proposed a genetic algorithm to simultaneously determine weekly rolling stock circulation plans and the depot location in the context of railway rapid transit systems.
Actually, the variability of travel demand assumes a fundamental role in the urban transport network. In the public transport line design, a key aspect is the relationship between the demand and the transportation supply and related characteristics. Other important variables such as the level of service of a public transport line (for instance, the service frequency and the use of exclusive lanes) may influence the cost of the public transport facility. These features of city configuration are related to the concept of urban fragmentation, which influences sustainability through environmental, economic, and social costs [26,27,28,29,30]. In this sense, Cigu et al. [31] highlighted the role of urban transport design for economic growth, guaranteeing mobility for people as well as efficiency and effectiveness in the distribution of resources.
In the literature of transport network design, there is a frequently considered idea of “induced demand” [32]. This concept includes different key parameter aspects, underlining their importance in considering demand for benefit–cost analyses. Potential demand depends on different variables, such as land use, employment, citizens, and income. Taking into account these aspects can make it possible to forecast, in a timely manner, the measure of traffic volume. From the economic point of view, all changes in the variables such as travel time, operating costs, and accidents considered in volume affect the “price” value and correspond to a shift in the demand curve. Globally, travel demand should consider exogenous factors that influence the demand curve and the price–volume point in the demand curve. Lee et al. [33] highlighted the importance of considering the travel demand variability in a benefit–cost analysis. Van der Loop et al. [34] investigated the effects of induced demand in the Netherlands and the benefits of their new road infrastructure. They underlined the importance of an optimal choice of the departure time in cost–benefit evaluations of new road infrastructure.
Since our approach refers only to the strategic phase, which consists of simultaneously designing corridors for the subsequent construction of rapid transit lines in the network, aspects regarding the induced demand that would be generated if the implementation of the different lines was sequentially made over time are not considered in this article.
2. Literature Review on Optimal Alignments of Transport Network
Metro configurations are designed on maps in which the nodes represent the stations, and the itinerary connecting two stations can be composed through adding edges. The edges appear on these maps represent rectilinear segments, and when they interconnect, they generate angles at the meeting vertices that visually appear to be 0°, 45°, or 90°. For example, on the map of San Francisco and its Bay Area (obtained from www.urbanrail.net), all segments of transport lines (metro, railways, etc.) are drawn by rectilinear sections whose slopes with respect to the horizontal level are 0°, 45°, or 90° [35]
Configuration and spatial distribution of urban transport networks can vary as the total length L of the considered zone raises. Another logical consequence of that expanding is the increase of the form complexity of the global network and the total number of lines. A number of indices can be used to assess the topological configuration of a network G (N, E), where N is the node set and E is the edge set. For instance, Musso and Vuchic (1988) [36] consider quality indices such as the number of stations, the total length of the network, the number of lines, and the number of multiple stations. Laporte et al. (1994) [37] introduced two indices (the passenger/network effectiveness index of a network and the passenger/plane effectiveness index) in order to compare passenger travel time on the network to what it would be if travel was made on the street network. Although these measurements are purely topological and make no assumption about passenger volumes and modal competition, some conclusions can be addressed. Computational experiments indicate that both effectiveness measures tend to be inversely related to the number of cycles in the network, the complexity, the connectivity, and the directness. As a consequence, the worst network topology is the star, whereas the triangle and the cartwheel are rather effective configurations.
Various network configurations for different lenght L values can be considered. As shown in [38] it is clear that, for low L values, it is possible to have a line or a tree configuration. For higher L values, a configuration such as a ring is evident, and for much higher L values, the results show more intricate shapes considering a fitted grid or an overlap of a circle and radial segments.
In the case of low L values (10 Km), for example, in the cases of Miami or Helsinki, metro maps are recorded as a simple line or a simple tree. Some radial lines appear in the cases of Rome, Kyoto, and Buenos Aires. Considering higher values of L (25 Km), the result is a ring shape or a grid of line, such as the Glasgow or the Lisbon metro structures. For wider networks in which L is higher than 75 Km, the urban network complexity is higher (see Milan or Paris). Aldous et al. highlighted the numerical relation between L and the different possible shapes [38].
Parameters as the maximum number of nodes and the maximum number of lines represent some of the most important vinculums to take into account in urban network design. For example, in [25] the possibilities when considering six different networks, all with the same number of nodes (13 in this case) and with a common number of edges (from 12 to 16) are highlighted. In all the configurations considered, the maximum number of lines is three.
The challenge of constructing a single transit line such that trip coverage for the population is maximized turns out to be generally intractable for all but small size instances. To solve this problem, a number of heuristics based on classical construction and improvement procedures or on advanced local search paradigms can be used instead of exact algorithms to yield high quality solutions. Dufourd et al. [39] proposed a heuristic approach based on tabu search for a simplified version of the problem, where a single transit line is determined such that the total population covered by the alignment (living nearby) is maximized. Bruno et al. [40] proposed a different heuristic approach for the single alignment problem, which consists of two phases: construction of an initial alignment and solution improvement. Both papers work on a discretized grid network (square grid of 100 × 100), where a population p(x,y) is associated with each integer coordinate vertex (x,y). It is assumed that people travel by foot to the closest station using a Manhattan (rectilinear) metric. The total population covered by a station s is estimated, taking a gravitational model of proximity into account. A maximum separation between consecutive stations is imposed, and a minimum separation between any two stations (consecutive or not) must also be added to avoid duplicity when counting passengers in the transit system. Algorithms in both cases work as follows:
- Starting with a single edge, the heuristic iteratively extends the current alignment in a greedy fashion (i.e., by maximizing the trip coverage for the population), while inter-station spacing constraints are not violated;
- In a second phase, the neighborhood of the current solution is explored by tabu search (for instance). The neighbor of a solution is obtained by cutting an edge of the alignment and reconstructing several partial alignments from the break point.
The usual extension mechanism of the current alignment consists of finding the node w not yet included in the current alignment Align(L), where the highest effectiveness is reached (in the case of a tie, consider the option that generates a minor increase in length). While the length of alignment Align(L) is less than a boundary LMAX, determine the position pos(w) where node w should be inserted along the node sequence Align(L) to produce the smallest increase in its length. In the multi-alignment heuristic provided by Bruno and Laporte (2002) [41], the decision maker must first select a fixed configuration (for instance, one of the types described by Laporte et al. [37]: cartwheel, star, U and cross, circumferential, grid, triangle, half-wheel, or half-radial) (see Figure 4). Components of these configurations (circular sections and linear segments) are selected according to a mathematical programming approach that evaluates the potential benefits that would produce such a choice for the users.
The application of greedy insertion algorithms on the node set to generate alignments presents two aspects with scope for improvement. One of them refers to advice given to the decision maker about the most favorable time to open a new transit line instead of extending the length of the current alignment indefinitely with the repeated addition of new nodes. The other point of improvement is the avoidance of zigzag designs for each of the individual alignments of the transport network.
Regarding the indefinite growth of the alignment, we can refer to the result obtained by Madras and Sokal (1988) [42] to generate a self-avoiding walk through a dynamic Monte Carlo algorithm for some values of parameter L. In [42] are shown the results for different configurationsfor different values of L, whose potential utility for being an infrastructure inside a transportation network.
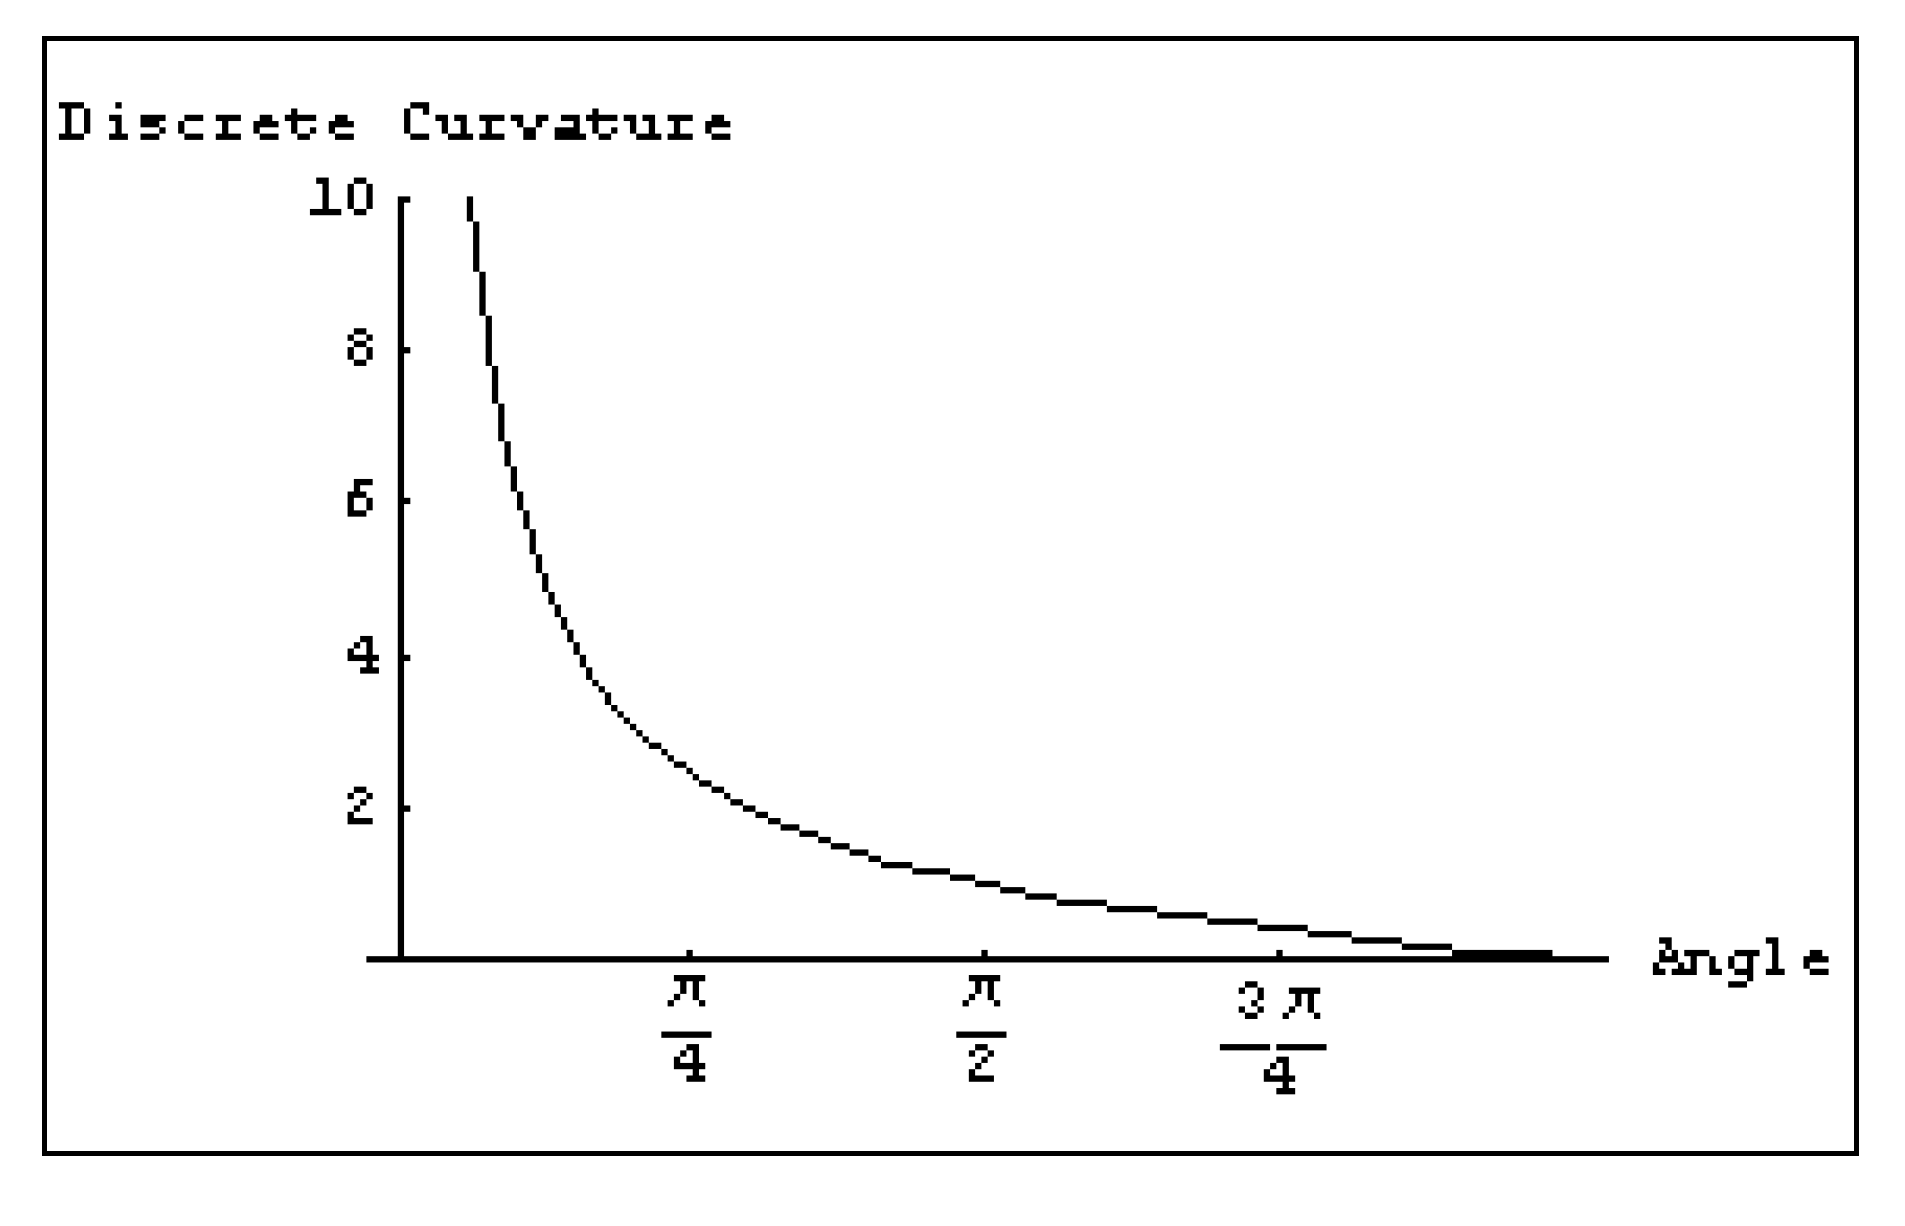
On the other hand, the evaluation of the zigzag effect in the design of the road can be carried out by means of a definition of curvature. Several formulae to directly calculate the curvature of a function on a point can be found. In particular, when the curve is expressed in the explicit Cartesian form y = y(x), the curvature k(x) is given by:
The linear nature of a polygonal alignment suggests that this notion of curvature is not useful in the evaluation of the zigzag effect since the second derivative, included in the definition of curvature, will always be zero. Hence, the sequence of three points Pi−1, Pi, Pi+1 generates an angle αi in vertex Pi whose discrete curvature Ki is given by the expression:
The following properties are satisfied:
Property 1:
Property 2:
Property 3:
takes non-negative values and must be increasing while is decreasing with respect to (the maximum value for the angle of a polygonal line).
Figure 1 shows the graph associated with discrete curvature function , for values of x in the interval
In this paper, the authors propose an algorithm to design a transit network that includes five contributions regarding the above mentioned works:
- (1)
- When designing the transportation network, the restriction of having to be subject to match a predetermined topological configuration is not required. Only connectivity between each pair of nodes in the network will be guaranteed at the end;
- (2)
- In each processing step of the algorithm, the most efficient edge (u, v) will be selected (the one that provides the greatest travel coverage). This edge can be incorporated into an existing alignment or, alternatively, will generate a new transit line in the network, depending on whether design constraints are satisfied;
- (3)
- Design restriction 1: The maximum number of alignments generated in the network is N;
- (4)
- Design restriction 2: The maximum length of any alignment is 2L;
- (5)
- Design restriction 3: The maximum permissible discrete curvature between two consecutive segments of the same alignment at any vertex corresponds to an angle of 45°.
By taking into account parameters N and L, the authors define an algorithm in order to determine the optimal design for a metro network by minimizing the zigzag effect, which is subject to constraints related to the maximum length of any alignment and the minimum angle between two consecutive segments of the same transit line at any vertex. The proposed approach was successfully applied to data from the city of Seville (Spain).
3. Model Formulation
3.1. Input Data
In order to design the transportation network, we assume a geographically located node set N of candidate stations: N = {i: i = 1…, I}. By means of N(i), we identify the set of nodes adjacent with node i.
Moreover, we already assume three known types of matrices:
- (a)
- Matrix of travel distances between pairs (i,j) of points of N on the projected transportation network. Note that the entries of matrix could correspond to (almost) Euclidean distances if the system were designed to be underground; otherwise, for a grade or an elevated system, the data of matrix should reflect distances along the street network. Additionally, another matrix of travel distances without privileges (one-way streets) must be considered in order to compare costs of routing between public and private modes;
- (b)
- Matrix of travel patterns given by the called origin–destination matrix, , where P is the set of ordered pairs of demand points;
- (c)
- Three-dimensional matrix of discrete curvatures , where represents the discrete curvature of the angle formed by edges (i,k) and (k,j) at vertex k.
3.2. Parameters
The following parameters are used in the formulation of the optimization model:
- Routing cost (under the demand point of view) incurred when the demand of pair is satisfied;
- Routing cost (under the demand point of view) incurred when the demand of pair is satisfied through the private network;
- Alignment set to be determined;
- Starting node of alignment l;
- Ending node of alignment l.
Max DC upper bound for the discrete curvature allowed when designing the corridor.
Variables
The following variables are required in the model:
- Binary variable that takes value 1 if node j is selected to belong to alignment l and value 0 otherwise;
- Binary variable that takes value 1 if edge (i,j) is selected to belong to alignment l and value 0 otherwise;
- Binary variable that takes value 1 if travel demand corresponding to pair p is satisfied by using the public mode instead of the private mode and value 0 otherwise;
- Binary variable that takes value 1 if travel demand corresponding to pair p is routed by using an alignment that contains edge (i,j) and value 0 otherwise.
3.3. Objective and Constraints
The problem we are dealing with consists of determining a set of L alignments covering as much of the travel demand between pairs of points of N as possible, which is subject to constraints caused by the construction cost and the maximum discrete curvature allowed. The following integer programming formulation determines the optimum alignments to be established:
Subject to:
The objective function maximizes the trip coverage of the network. Constraints (4) and (5) impose lower and upper bounds on the cost (in terms of line lengths) for each alignment and for the overall network, respectively. Constraints (6)–(8) guarantee that each line starts and ends at their specified origin and destination points. Constraint (9) establishes that the decision of connecting two nodes must involve flows in both directions. Constraint (10) imposes that each alignment is a path. Constraints (11)–(15) guarantee demand conservation. Constraint (16) ensures that variable zp is 1 when the demand of pair p goes through the public network and zp = 0 if it uses the private network. Constraint (17) guarantees that the trip demand of pair p can be routed through edge (i,j) only if such an edge belongs to the public system. Constraint (18) establishes an upper bound (i.e., 45°) on the discrete curvature on all vertices along the alignments. Finally, constraint (19) indicates the nature of the variables used in the model.
This optimization model is of a combinatorial nature and can be considered as an instance of a set covering problem, which is NP-hard. In [43], the problem is discussed in detail, and its complexity is proved. This fact justifies the use of algorithms that can provide a good heuristic solution. For this purpose, heuristic GreCon (greedy constructive insertion of edges) is proposed to produce good solutions in large networks.
3.4. Heuristic GreCon
- Read input data: N (location of nodes); distance matrices DPUB, DPRIV; origin–destination matrix F; number of alignments L (L > 1) and upper bounds for the different costs under consideration.
- Find the pair of nodes (i,j) that produces the most effective edge (in the case of a tie, consider the shortest edge). Let l = 1; E = {l}; Align(l) = {(i,j)}.
- While
- 3.1
- Find the most effective pair of nodes (i,j) not included in
- 3.2
- If it exists h such that and then Print “Trip demand is already covered. Improve the train frequency along corridor”.
- 3.3
- If it exists h such that but then
- 3.3.1.
- If node i is an extreme node of Align(h) then prolong this corridor (once checked cost constraints and the value of discrete curvature at node i):
- 3.3.2.
- If node i is not an extreme node of Align(h) then build new alignment (once checked cost constraints): . Align(h) = {(i,j)}.
- 3.4
- Otherwise, i.e., nodes i and j are outside from all alignments currently generated, then build new alignment (once checked cost constraints): . Align(h) = {(i,j)}. .
4. Results and Discussion for a Real Application
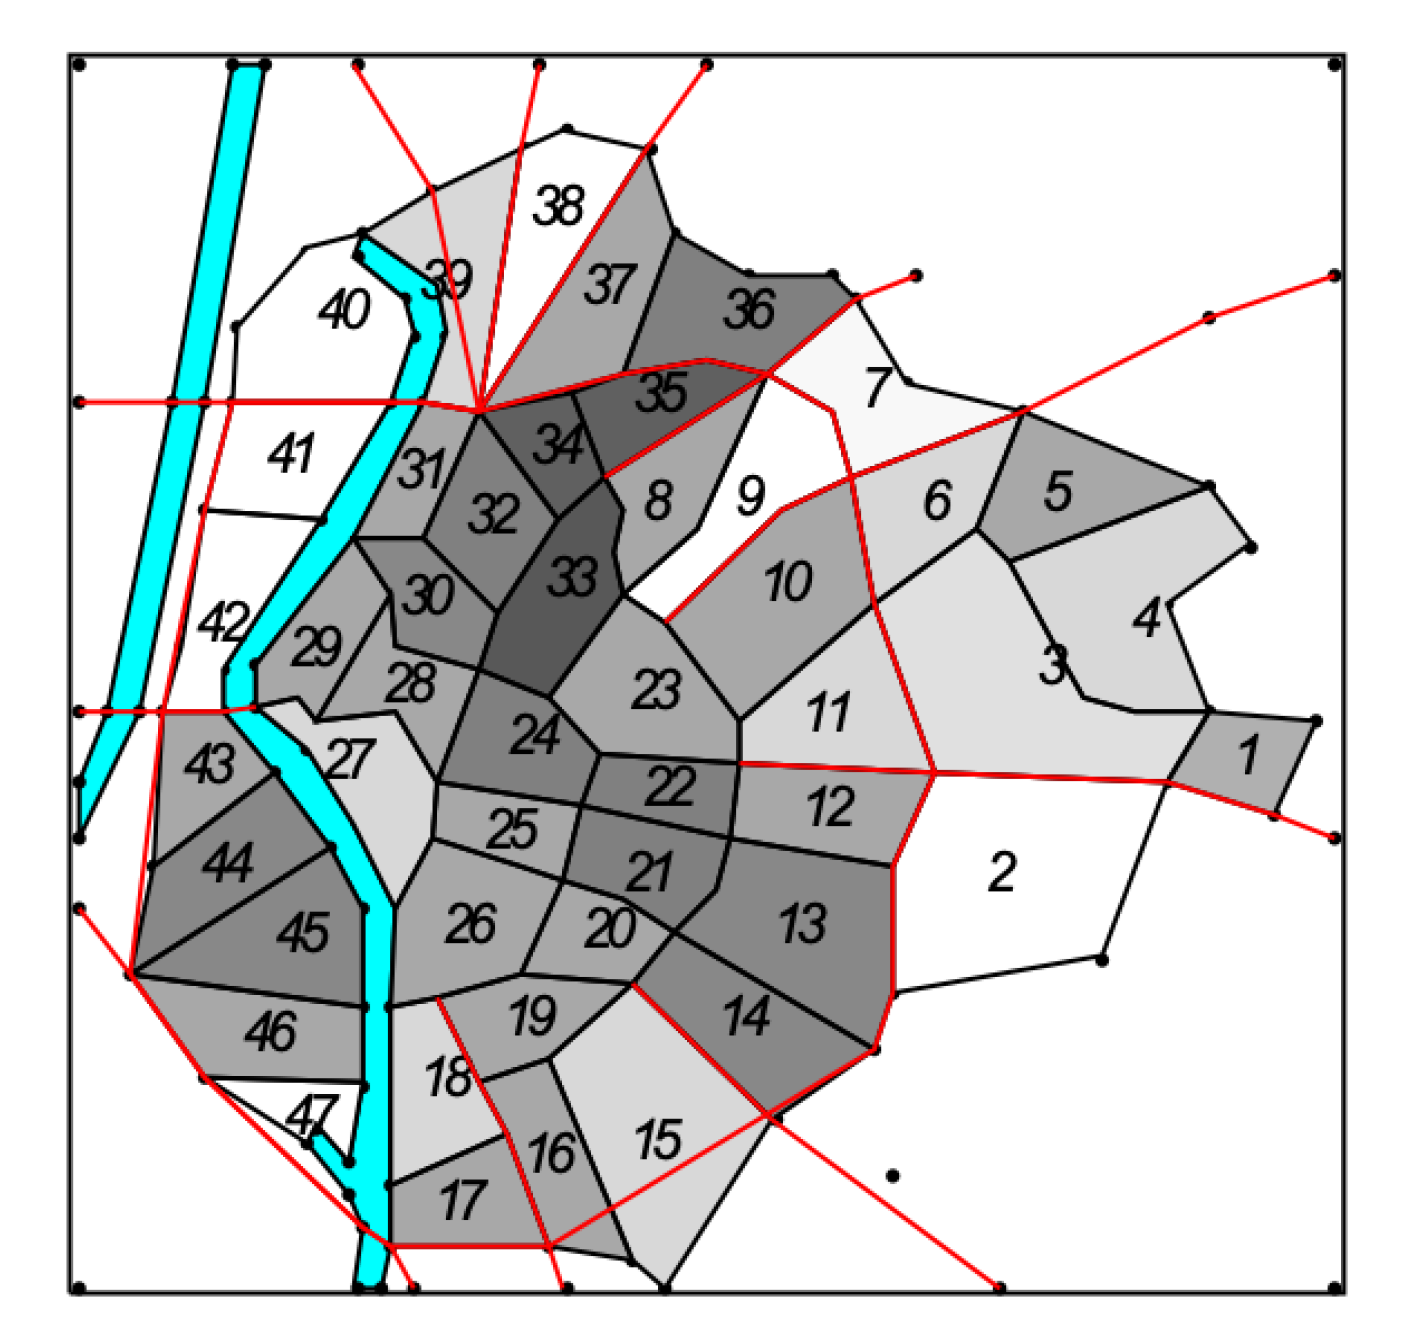
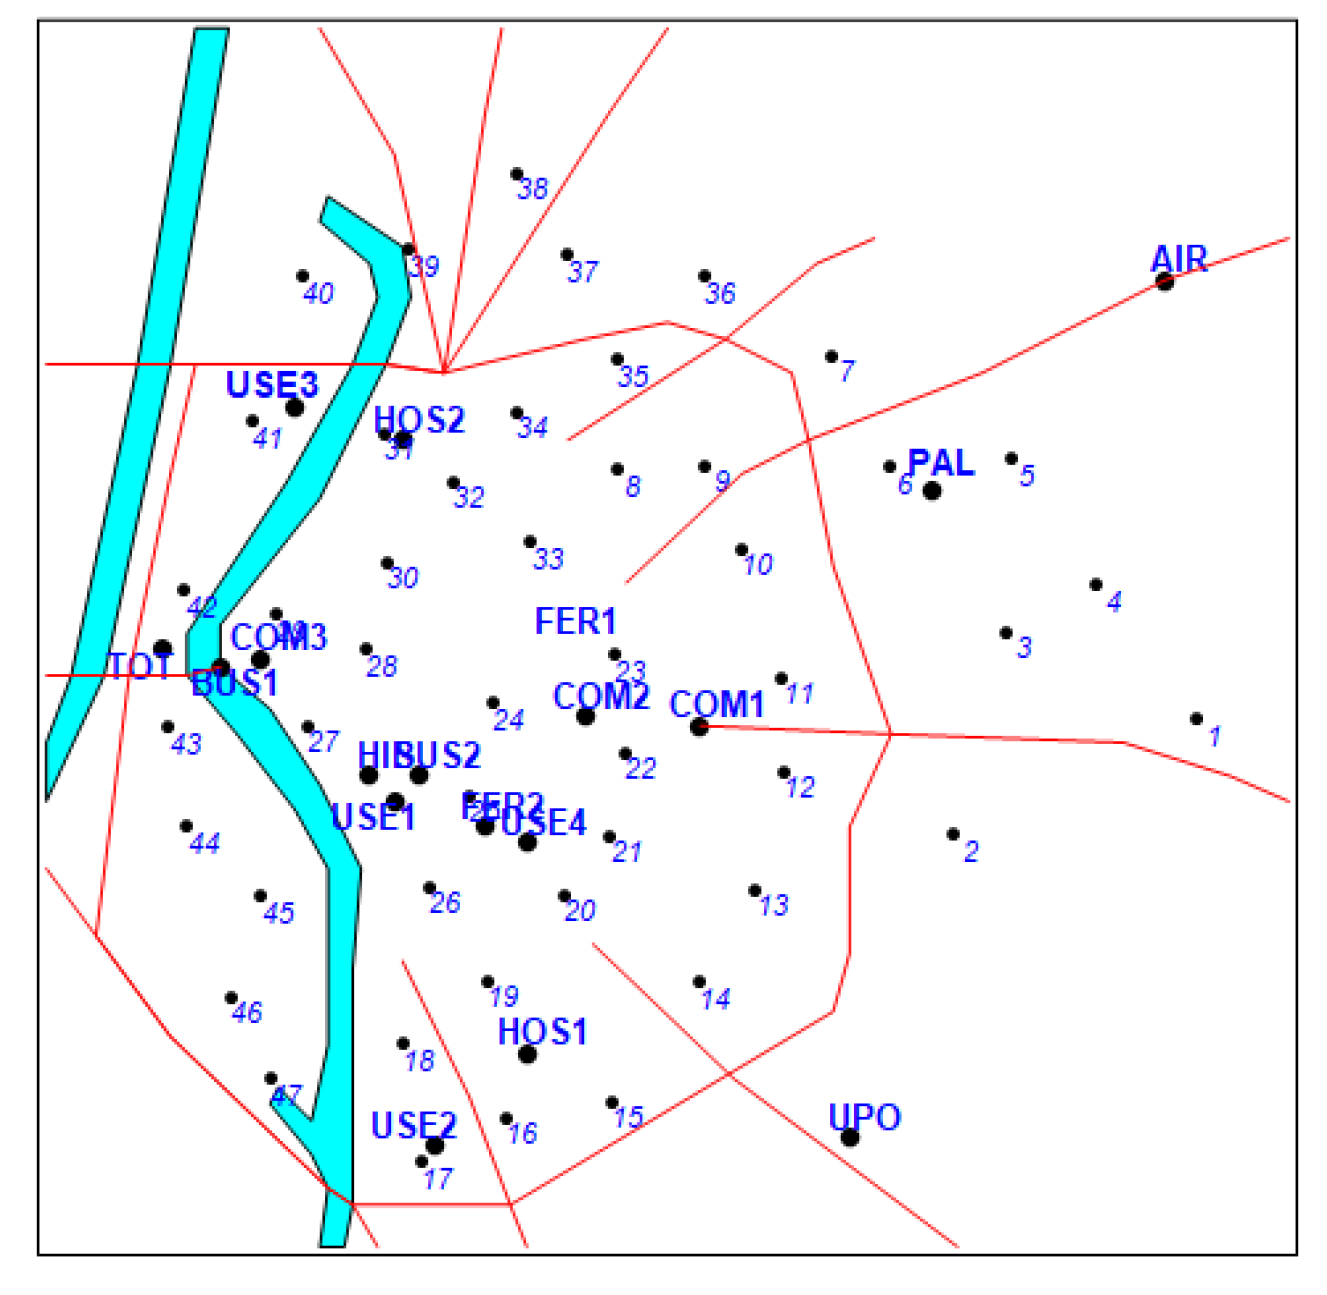
The methodology described in this paper was applied in the metropolitan area of Seville (Spain) to determine the most effective metro lines in terms of trip coverage. Input data were based on demography and mobility surveys conducted in 2002, with the purpose of comparing designs generated by our approach with those projected by the authorities. Parameter L was assumed to be 19 km. The current metro line in the metropolitan area of Seville has a similar length (19 km and 22 stations). The annual average of daily travelers during 2018 rose to 46.400 (in 2017, it was 43.917). Node set N contained 65 items (47 zone centroids plus 18 key nodes: bus stations, train stations, airport terminal, commercial centers, hospitals, university campus, etc.) in the urban area of Seville (Figure 2 and Figure 3). Total length of the network to be determined was constrained not to exceed 19 km. The network could be composed with a maximum of two lines; each of them would provide a number of travelers depending on the connected node pairs. Data concerning origin–destination trips were obtained from the Statistical Yearbook 2015 of Seville (available at http://www.sevilla.org/ayuntamiento/competencias-areas/area-de-h/anuario_2015).
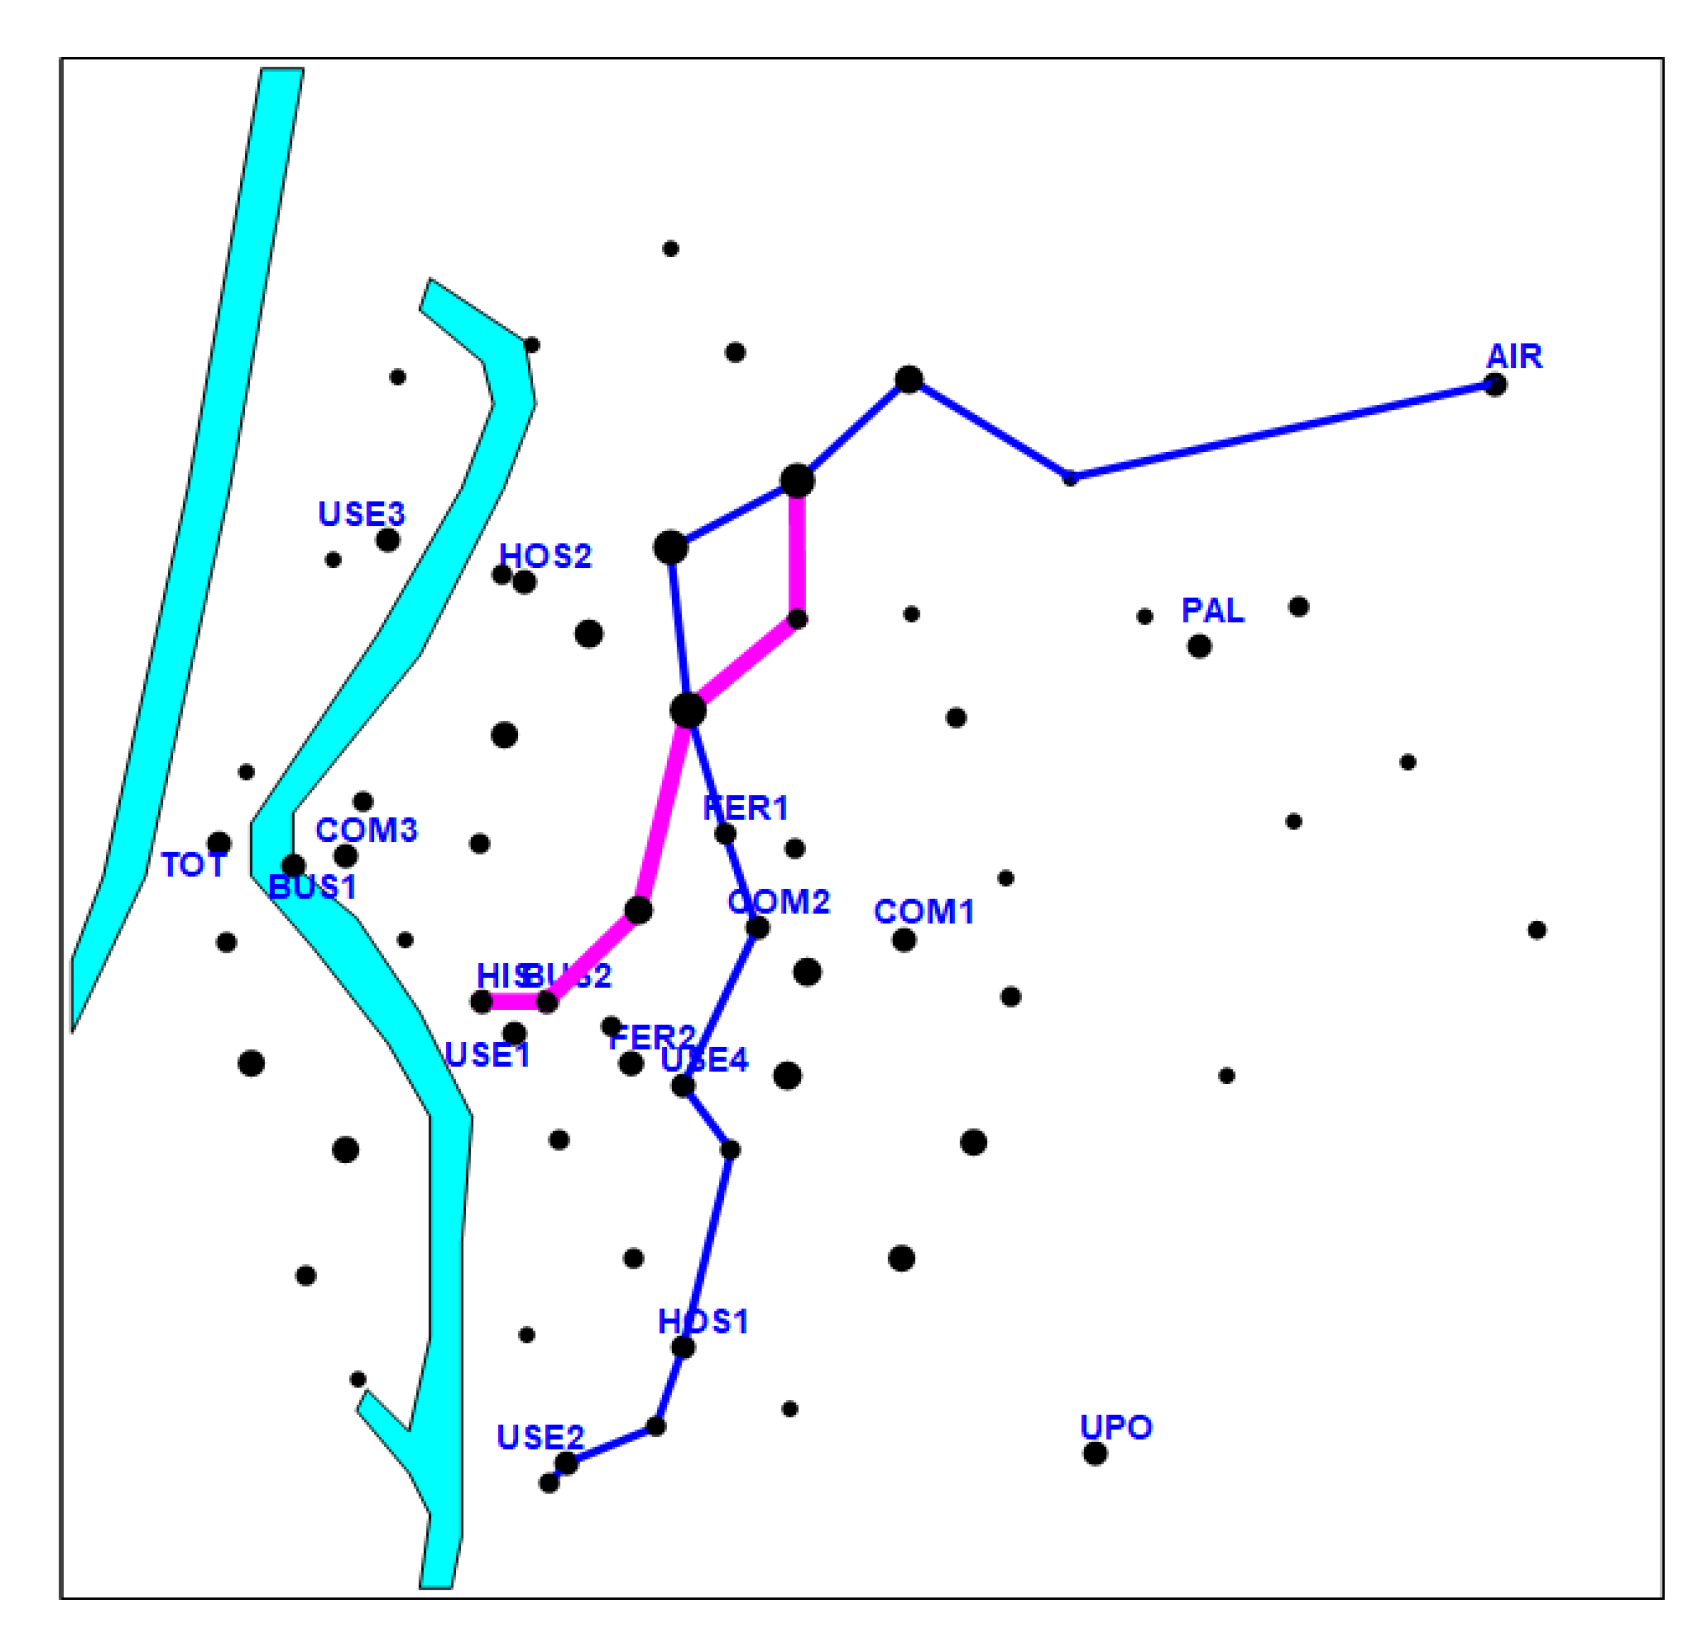
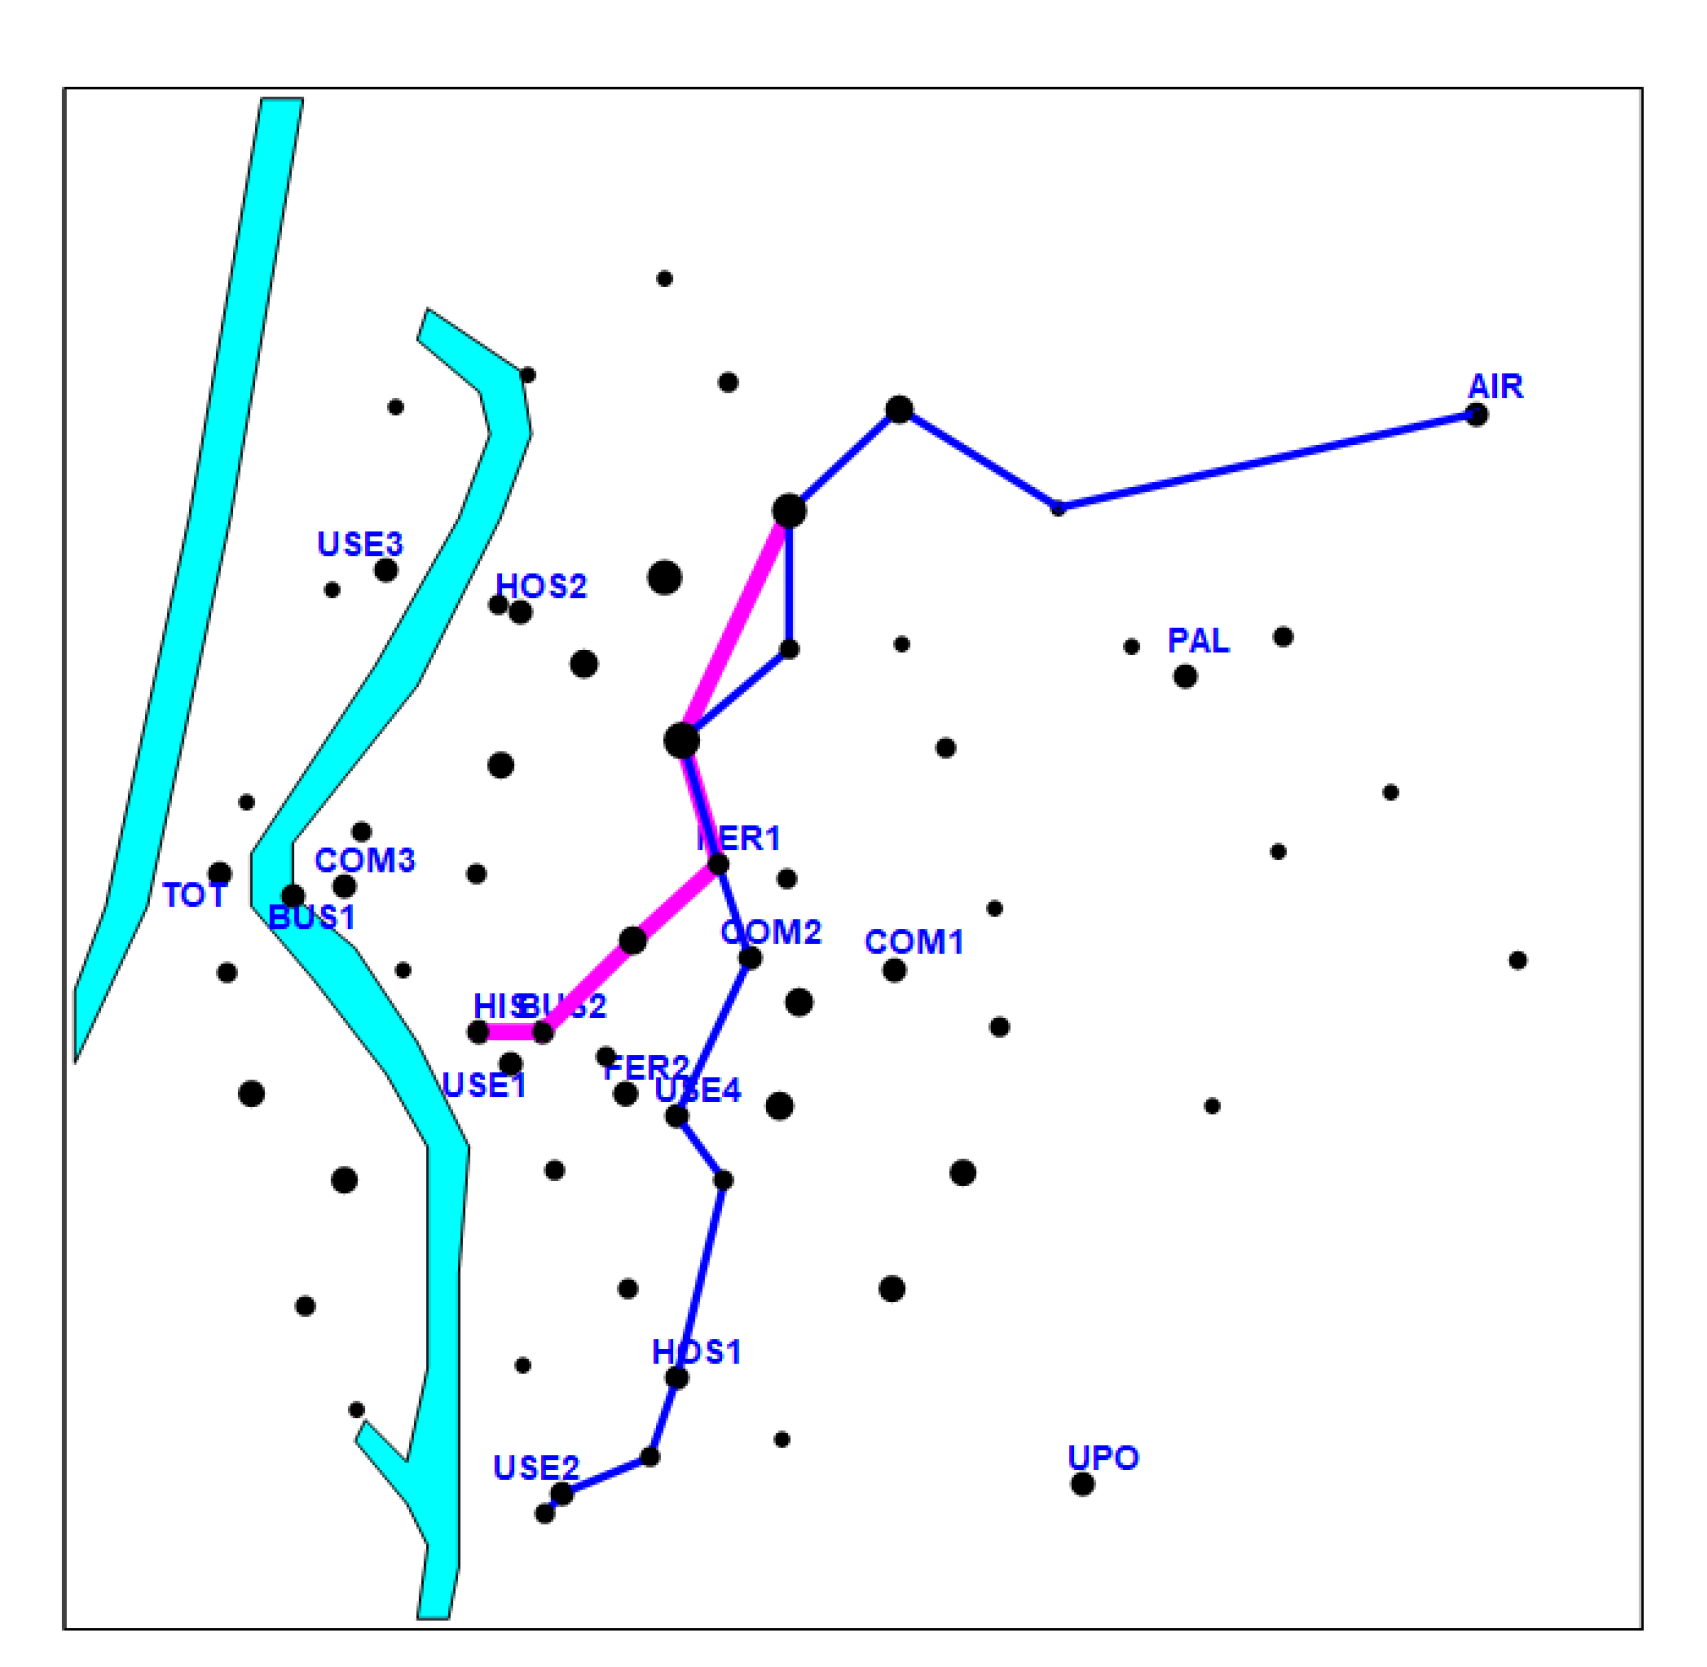
Scenario 1: If the network to be determined was composed of two transit lines, and the constraint of maximum discrete curvature was established in angles of 105° for all vertices of their alignments, the value of effectiveness would be 61.618 trips per day (Figure 4).
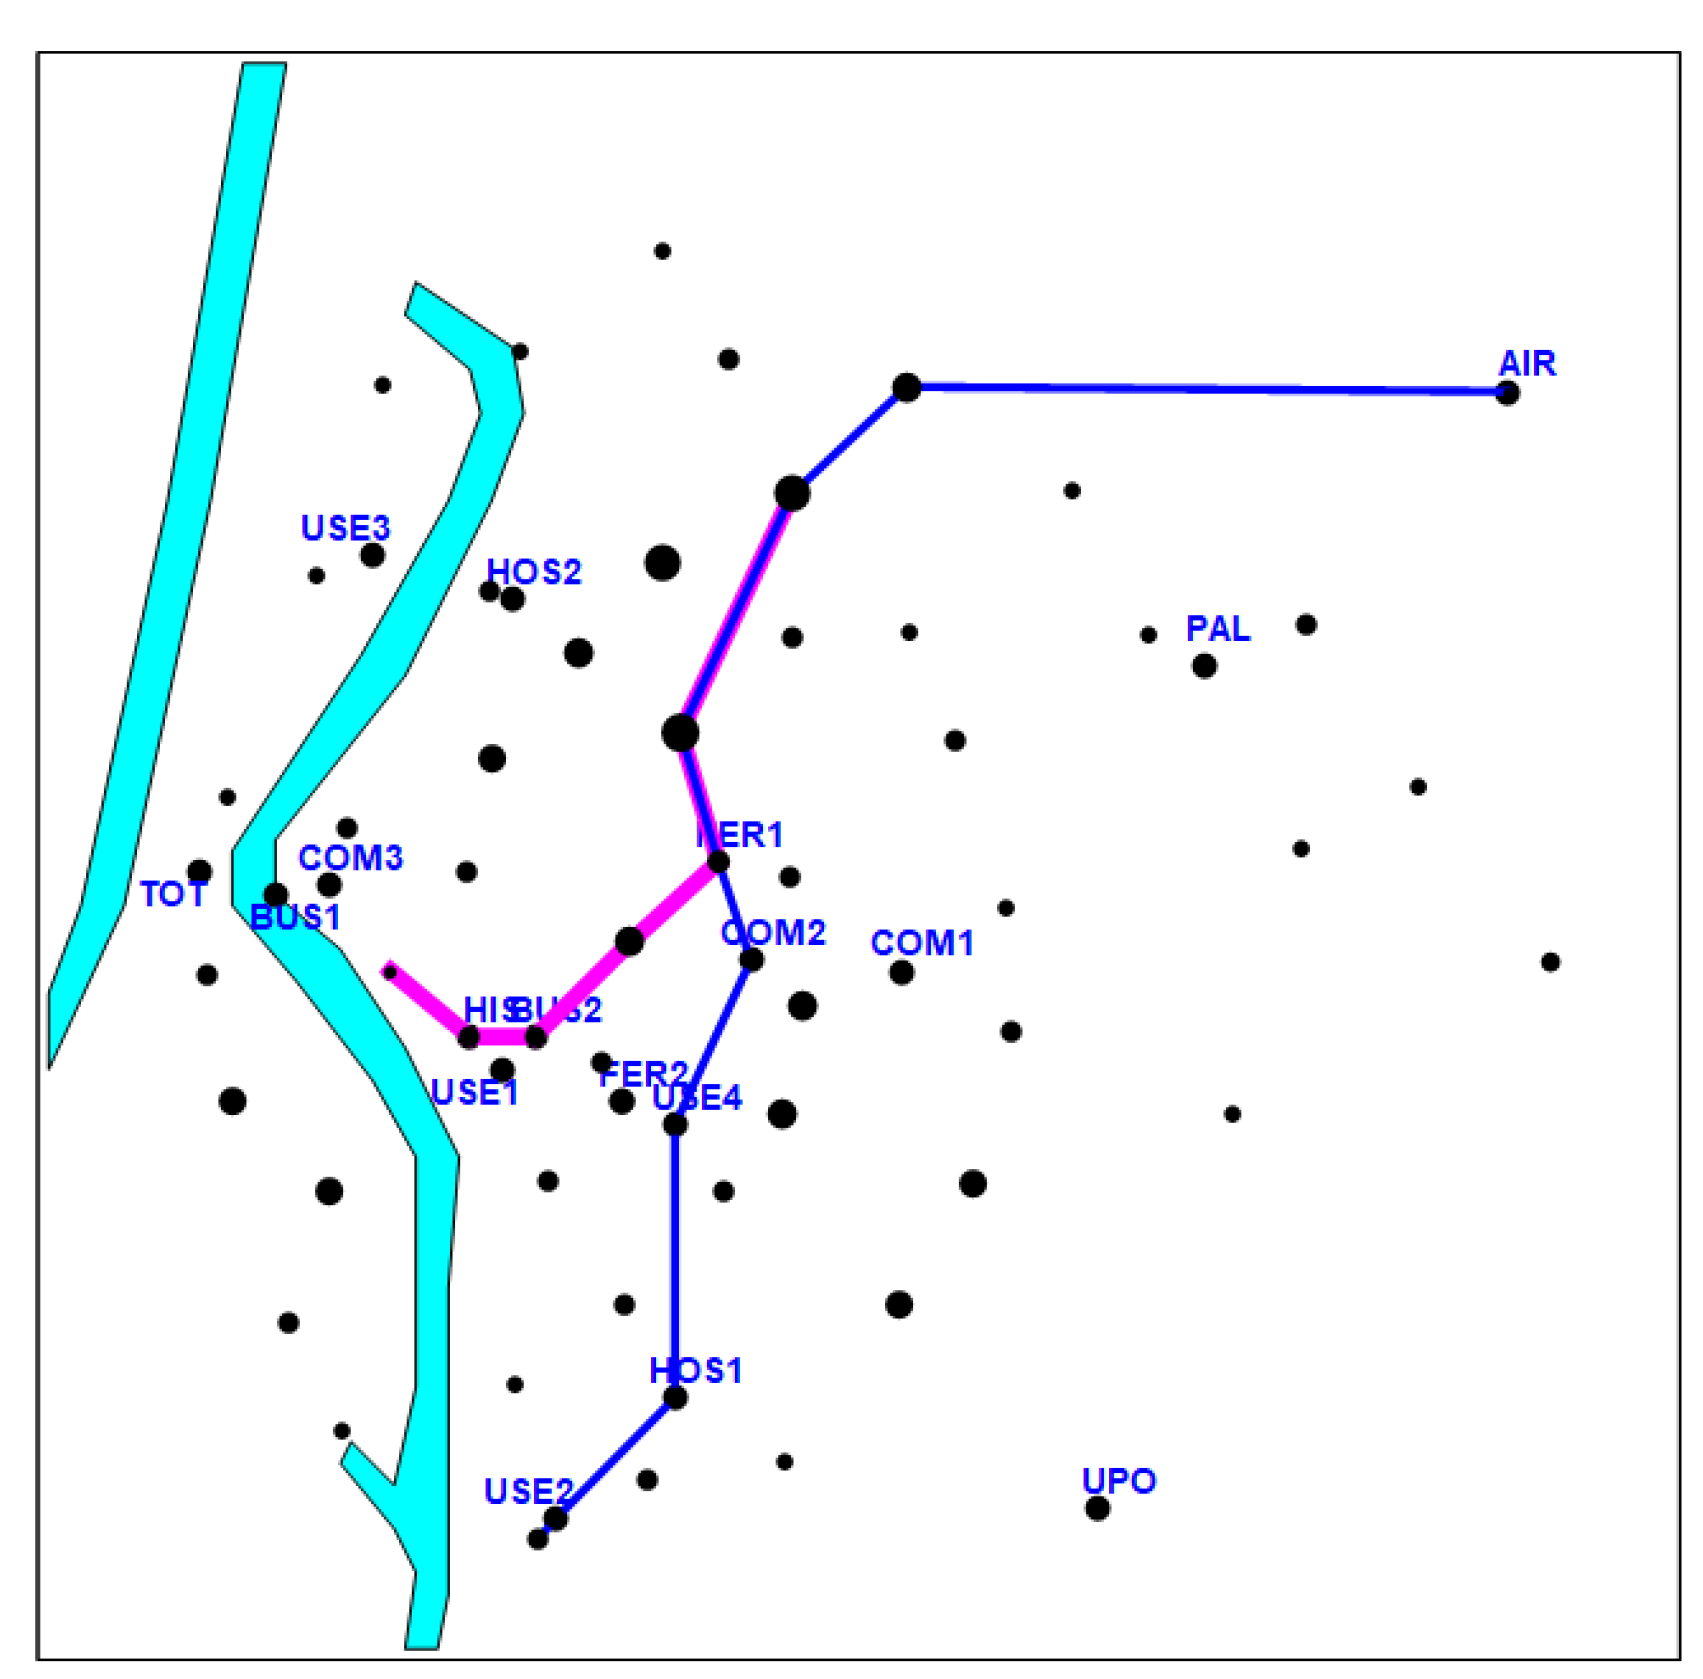
Scenario 2: If, under the same circumstances, the constraint of maximum discrete curvature was established in angles of 120° for all vertices along both alignments, the value of effectiveness would be 59.660 trips per day (Figure 5).
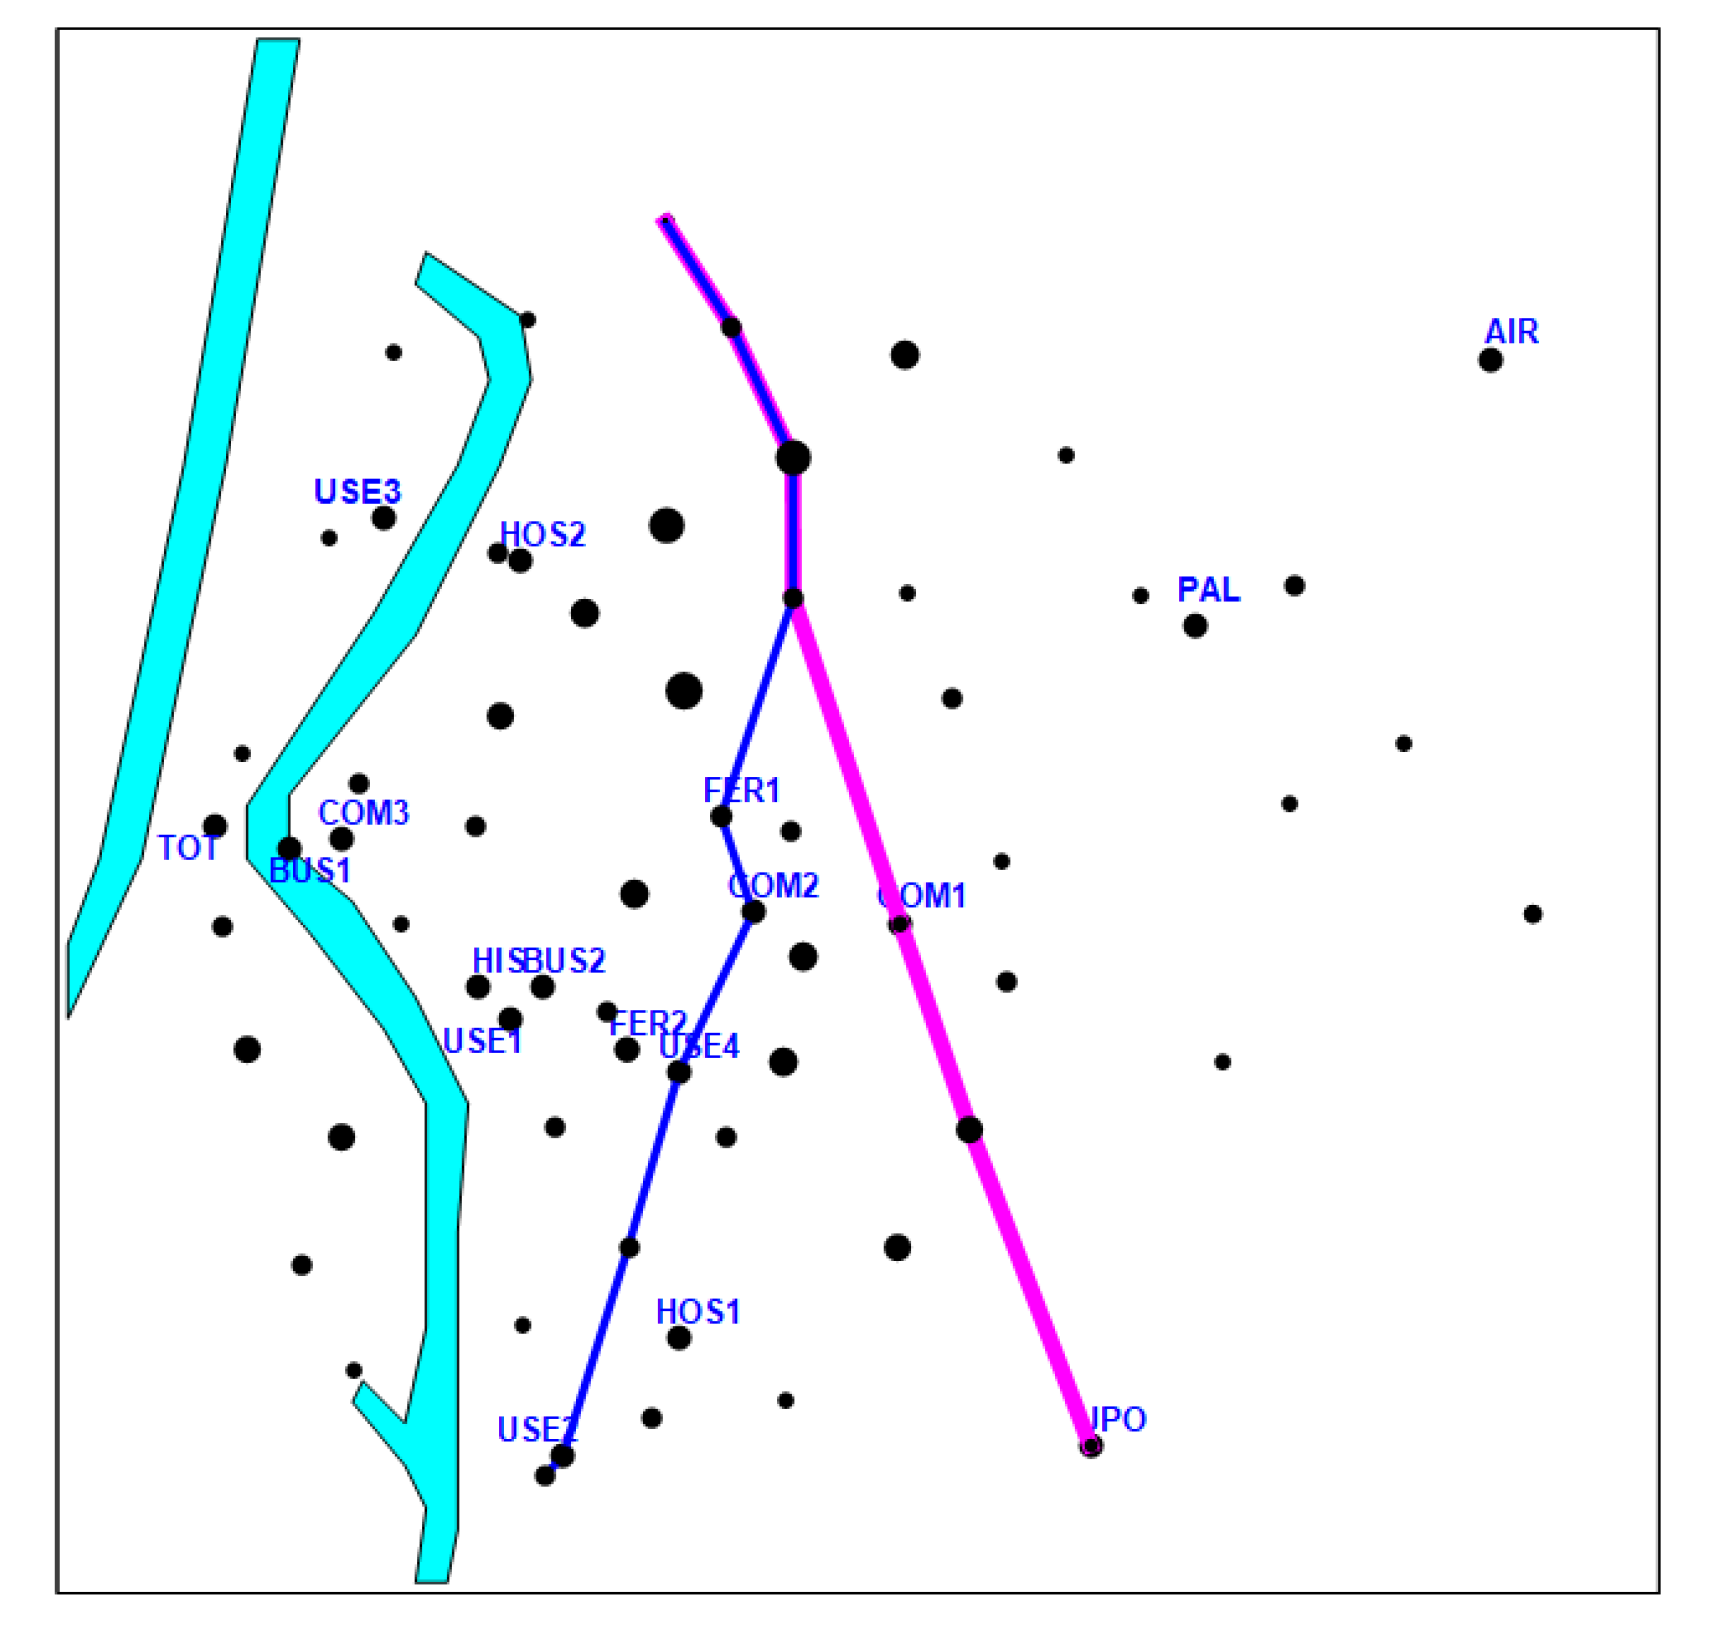
Scenario 3: For a maximum value of discrete curvature at the vertices of the alignments equivalent to that of the angle of 135°, the number of trips covered with a two-line network would be 50.665 trips per day, and its configuration would correspond to that shown in Figure 6.
Scenario 4: If the maximum value of discrete curvature was established for angles of 150°, the effectiveness of this two-line network would be 38.242 trips per day, and its configuration would correspond to that shown in Figure 7.
The different scenarios analyzed show that the non-consideration of a restriction on the maximum curvature allowed at the vertices generates long transit lines that absorb the entire budget projected for building the global network. The inclusion of a constraint on the permitted maximum angle at vertices of polygonal lines generated by the heuristic represents a methodology to establish an efficient rule that could halt the continuation of the current alignment and to suggest the generation of a new network alignment connected to the earlier line, which may lead to potential improvement in global effectiveness.
5. Conclusions and Future Perspectives
A methodology for the design of a transportation network composed of rapid transit alignments that optimizes the trip coverage for citizens was proposed in this article. A greedy algorithm was formulated to solve the proposed mathematical programming model, identified as a version of the well-known set covering problem. To evaluate the performance of the proposed methodology, a computational experience was carried out on an urban system composed of 47 districts with data from the metropolitan area of Seville (Spain) and 18 key nodes, which were mobility attractors/generators. The evaluation of the different scenarios shows that the inclusion of a constraint on the permitted maximum angle at vertices along polygonal lines meets the objective of designing efficient alignments that improve the total trip coverage provided by the network.
Further development can be based on the consideration of different variables in the potential travel demand in order to obtain an optimal prevision of the best cost–benefit analysis.
Author Contributions
G.M.: writing, investigation, methodology, data curation, formal analysis, conceptualization, writing review and editing, validation, software. F.A.O.: methodology, conceptualization, funding acquisition, software. C.M.M.: investigation. J.A.M.: investigation, funding acquisition.
Funding
This research received no external funding.
Acknowledgments
This research has been partially supported by the Spanish Ministry of Economy and Competitiveness through grant MTM2015-67706-P (MINECO/FEDER, UE). This support is gratefully a cknowledged. Authors would thank the Instituto de Matemáticas de la Universidad de Sevilla, (IMUS).
Conflicts of Interest
The authors declare no conflict of interest.
References
- Chen, D.; Sun, J. Fuel and emission reduction assessment for civil aircraft engine fleet on-wing washing. Transp. Res. Part D 2018, 65, 324–331. [Google Scholar] [CrossRef]
- Noce, T.; da Silva, R.R.; Morais, R.; Sales, L.C.M.; De Morais Hanriot, S.; Sodré, J.S. Energy factors for flexible fuel engines and vehicles operating with gasoline-ethanol blends. Transp. Res. Part D 2018, 65, 368–374. [Google Scholar] [CrossRef]
- Marseglia, G.; Rivieccio, E.; Medaglia, C.M. The dynamic role of Italian Energy strategies in the worldwide scenario. Kybernetes 2019, 48, 636–649. [Google Scholar] [CrossRef]
- Ortega, F.A.; Barrena, E.; Canca, D.; Laporte, G. Analyzing the theoretical capacity of railway networks with aradial-backbone topology. Transp. Res. Part A 2016, 84, 83–92. [Google Scholar] [CrossRef]
- Lu, Q.C.; Lin, S. Vulnerability analysis of urban rail transit network within multi-modal public transport networks. Sustainability 2019, 11, 2109. [Google Scholar] [CrossRef]
- Jia, G.L.; Ma, R.G.; Hu, Z.H. Urban transit network properties evaluation and optimization based on complex network theory. Sustainability 2019, 11, 2007. [Google Scholar] [CrossRef]
- García, R.; Marín, A. Urban multimodal interchange design methodology. In Mathematical Methods on Optimization in Transportation Systems; Pursula, M., Niittymäki, J., Eds.; Kluwer Academic Publishers: Dordrecht, The Netherlands, 2001; pp. 49–80. [Google Scholar]
- Newell, G. Some issue relating to the optimal design of bus lines. Transp. Sci. 1979, 13, 20–35. [Google Scholar] [CrossRef]
- Garey, M.R.; Johnson, D.S. Computers and Intractability: A Guide to the Theory of Np-Completeness; Freeman: New York, NY, USA, 1979. [Google Scholar]
- Fusco, G.; Gori, S.; Petrelli, M. A Heuristic Transit Network Design Algorithm for Medium Size Towns. In Proceedings of the 9th Euro Working Group on Transportation, Bari, Italy, 10–13 June 2002; pp. 652–656. [Google Scholar]
- Cantarella, G.E.; Pavone, G.; Vitetta, A. Heuristics for urban road network design: Lane layout and signal settings. Eur. J. Oper. Res. 2006, 175, 1682–1695. [Google Scholar] [CrossRef]
- Hertz, A.; Widmer, M. Guidelines for the use of Meta-Heuristics in combinatorial optimization. Eur. J. Oper. Res. 2003, 151, 247–252. [Google Scholar] [CrossRef]
- Ghannadpour, S.F.; Zarrabi, A. Multi-objective heterogeneous vehicle routing and scheduling problem with energy minimizing. Swarm Evol. Comput. 2019, 44, 728–747. [Google Scholar] [CrossRef]
- Hoff, A.; Andersson, H.; Christiansen, M.; Hasle, G.; Lokketagen, A. Industrial aspects and literature survey: Fleet composition and routing. Comput. Oper. Res. 2010, 37, 2041–2061. [Google Scholar] [CrossRef] [Green Version]
- Reihaneh, M.; Ghoniem, A. A branch-and-price algorithm for a vehicle routing with demand allocation problem. Eur. J. Oper. Res. 2019, 272, 523–538. [Google Scholar] [CrossRef]
- Zhen, L.; Li, M.; Laporte, G.; Wang, W. A vehicle routing problem arising in unmanned aerial monitoring. Comput. Oper. Res. 2019, 105, 1–11. [Google Scholar] [CrossRef]
- Breunig, U.; Baldacci, R.; Hartl, R.F.; Vidal, T. The electric two-echelon vehicle routing problem. Comput. Oper. Res. 2019, 103, 198–210. [Google Scholar] [CrossRef]
- Dell’Olmo, P.; Gentili, M.; Scozzari, A. On finding dissimilar Pareto-optimal paths. Eur. J. Oper. Res. 2005, 162, 70–82. [Google Scholar] [CrossRef]
- Ho, W.; Ho, G.T.S.; Ji, P.; Lau, H.C.W. A hybrid genetic algorithm for multi-depot and periodic vehicle routing problems. Eng. Appl. Artif. Intell. 2008, 21, 548–557. [Google Scholar] [CrossRef]
- De-Los-Santos, A.; Laporte, G.; Mesa, J.A.; Perea, F. Simultaneous frequency and capacity setting in uncapacitated metro lines in presence of a competing mode. Transp. Res. Procedia 2014, 3, 289–298. [Google Scholar] [CrossRef]
- Tu, W.; Fang, Z.; Li, O.; Shaw, S.L.; Chen, B.Y. A bi-level Voronoi diagram-based metaheuristic for a large-scale multi-depot vehicle routing problema. Transp. Res. Part E 2014, 61, 84–97. [Google Scholar] [CrossRef]
- Laporte, G.; Mesa, J.A.; Ortega, F.A.; Pozo, M.A. Locating a metro line in a historical city centre: Application to Sevilla. J. Oper. Res. Soc. 2009, 60, 1462–1466. [Google Scholar] [CrossRef]
- Kroon, L.G.; Schöbel, A.; Wagner, D. Report from Dagstuhl Seminar 16171. Algorithmic Methods for Optimization in Public Transport. Dagstuhl Rep. 2016, 6, 139–160. [Google Scholar] [CrossRef]
- Laporte, G.; Ortega, F.A.; Pozo, M.A.; Puerto, J. Multi-objective integration of timetables, vehicle schedules and user routings in a transit network. Transp. Res. Part B 2017, 98, 94–112. [Google Scholar] [CrossRef]
- Canca, D.; Barrena, E. The integrated rolling stock circulation and depot location problem in railway rapid transit systems. Transp. Res. Part E 2018, 109, 115–138. [Google Scholar] [CrossRef]
- Delso, J.; Martín, B.; Ortega, E.; Otero, I. A Model for Assessing Pedestrian Corridors. Application to Vitoria-Gasteiz City (Spain). Sustainability 2017, 9, 434. [Google Scholar] [CrossRef]
- You, H. Quantifying Urban Fragmentation under Economic Transition in Shanghai City, China. Sustainability 2016, 8, 21. [Google Scholar] [CrossRef]
- Nie, T.; Ye, K. Demystifying the Barriers to Transport Infrastructure Project Development in Fast Developing Regions: The Case of China. Sustainability 2017, 9, 1915. [Google Scholar] [CrossRef]
- Simpson, G.D.; Parker, J. Data on Peer-Reviewed Papers about Green Infrastructure, Urban Nature, and City Liveability. Sustainability 2018, 3, 51. [Google Scholar] [CrossRef]
- Sinclair, M.; Sheldrick, L.; Moreno, M.; Dewberry, E. Consumer Intervention Mapping—A Tool for Designing Future Product Strategies within Circular Product Service Systems. Sustainability 2017, 9, 34. [Google Scholar] [CrossRef]
- Cigu, E.; Agheorghiesei, D.T.; Gavrilut, A.C.; Toader, E. Transport Infrastructure Development, Public Performance and Long-Run Economic Growth: A Case Study for the Eu-28 Countries. Sustainability 2019, 11, 67. [Google Scholar] [CrossRef]
- Noland, R. Relationships Between Highway Capacity and Induced Vehicle Travel. Transp. Res. Part A Policy Pract. 2001, 35, 47–72. [Google Scholar] [CrossRef]
- Lee, D.B., Jr.; Klein, L.A.; Camus, G. Induced Traffic and Induced Demand. Transp. Res. Rec. 1999, 1659, 68–75. [Google Scholar] [CrossRef] [Green Version]
- Van der Loop, H.; Haaijer, R.; Willigers, J. New findings in the Netherlands about induced demand and the benefits of new road infrastructure. Transp. Res. Procedia 2016, 13, 72–80. [Google Scholar] [CrossRef]
- Transportation in the San Francisco Bay Arena. Available online: https://en.wikipedia.org/wiki/Transportation_in_the_San_Francisco_Bay_Area#/media/File:SF_Bay_Rail_Transit.svg (accessed on 15 February 2019).
- Musso, A.; Vuchic, V.R. Characteristic of metro networks and methodology for their evaluation. Transp. Res. Rec. 1988, 1162, 22–33. [Google Scholar]
- Laporte, G.; Mesa, J.A.; Ortega, F. Assessing topological configurations for rapid transit networks. Stud. Locat. Anal. 1994, 7, 105–121. [Google Scholar]
- Aldous, D.; Barthelemy, M. Optimal geometry of transportation networks. Phys. Rev. E 2019, 99, 052303. [Google Scholar] [CrossRef] [Green Version]
- Dufourd, H.; Gendreau, M.; Laporte, G. Locating a transit line using tabu search. Locat. Sci. 1996, 4, 1–19. [Google Scholar] [CrossRef]
- Bruno, G.; Gendreau, M.; Laporte, G. A heuristic for the location of a rapid transit line. Comput. Oper. Res. 2002, 29, 1–12. [Google Scholar] [CrossRef]
- Bruno, G.; Laporte, G. An interactive decision support system for the design of rapid public transit networks. INFOR Inf. Syst. Oper. Res. 2002, 40, 111–118. [Google Scholar] [CrossRef]
- Madras, N.; Sokal, A.D. The pivot algorithm: A highly efficient Monte Carlo method for the self-avoiding walk. J. Stat. Phys. 1988, 50, 109–186. [Google Scholar] [CrossRef]
- Chvatal, V. A Greedy Heuristic for the Set-Covering Problem. Math. Oper. Res. 1979, 4, 233–235. [Google Scholar] [CrossRef]
Figure 1.
Shape of discrete curvature function.

Figure 2.
Urban area analyzed.

Figure 3.
Zone centroids and key nodes.

Figure 4.
Two-line optimal network for 105°.

Figure 5.
Two-line optimal network for 120°.

Figure 6.
Two-line optimal network for 135°.

Figure 7.
Two-line optimal network for 150°.

© 2019 by the authors. Licensee MDPI, Basel, Switzerland. This article is an open access article distributed under the terms and conditions of the Creative Commons Attribution (CC BY) license (http://creativecommons.org/licenses/by/4.0/).
Share and Cite
MDPI and ACS Style
Marseglia, G.; Medaglia, C.M.; Ortega, F.A.; Mesa, J.A. Optimal Alignments for Designing Urban Transport Systems: Application to Seville. Sustainability 2019, 11, 5058. https://doi.org/10.3390/su11185058
AMA Style
Marseglia G, Medaglia CM, Ortega FA, Mesa JA. Optimal Alignments for Designing Urban Transport Systems: Application to Seville. Sustainability. 2019; 11(18):5058. https://doi.org/10.3390/su11185058
Chicago/Turabian StyleMarseglia, Guido, Carlo Maria Medaglia, Francisco A. Ortega, and Juan A. Mesa. 2019. "Optimal Alignments for Designing Urban Transport Systems: Application to Seville" Sustainability 11, no. 18: 5058. https://doi.org/10.3390/su11185058
Note that from the first issue of 2016, this journal uses article numbers instead of page numbers. See further details here.