Dual Institutional Pressures, Sustainable Supply Chain Practice and Performance Outcome


Abstract
:1. Introduction
2. Literature Review and Hypotheses Development
2.1. Related Literature Review
2.1.1. Research on the Definition of SSCM
2.1.2. SSCP
2.1.3. Research on the Performance of Sustainable Supply Chain
2.1.4. The Research on the Institutional Pressure of Sustainable Supply Chain
2.2. Theoretical Analysis and Hypotheses
2.2.1. Hypothesis on the Relationship between Institutional Pressure and Performance Outcome of Sustainable Supply Chain
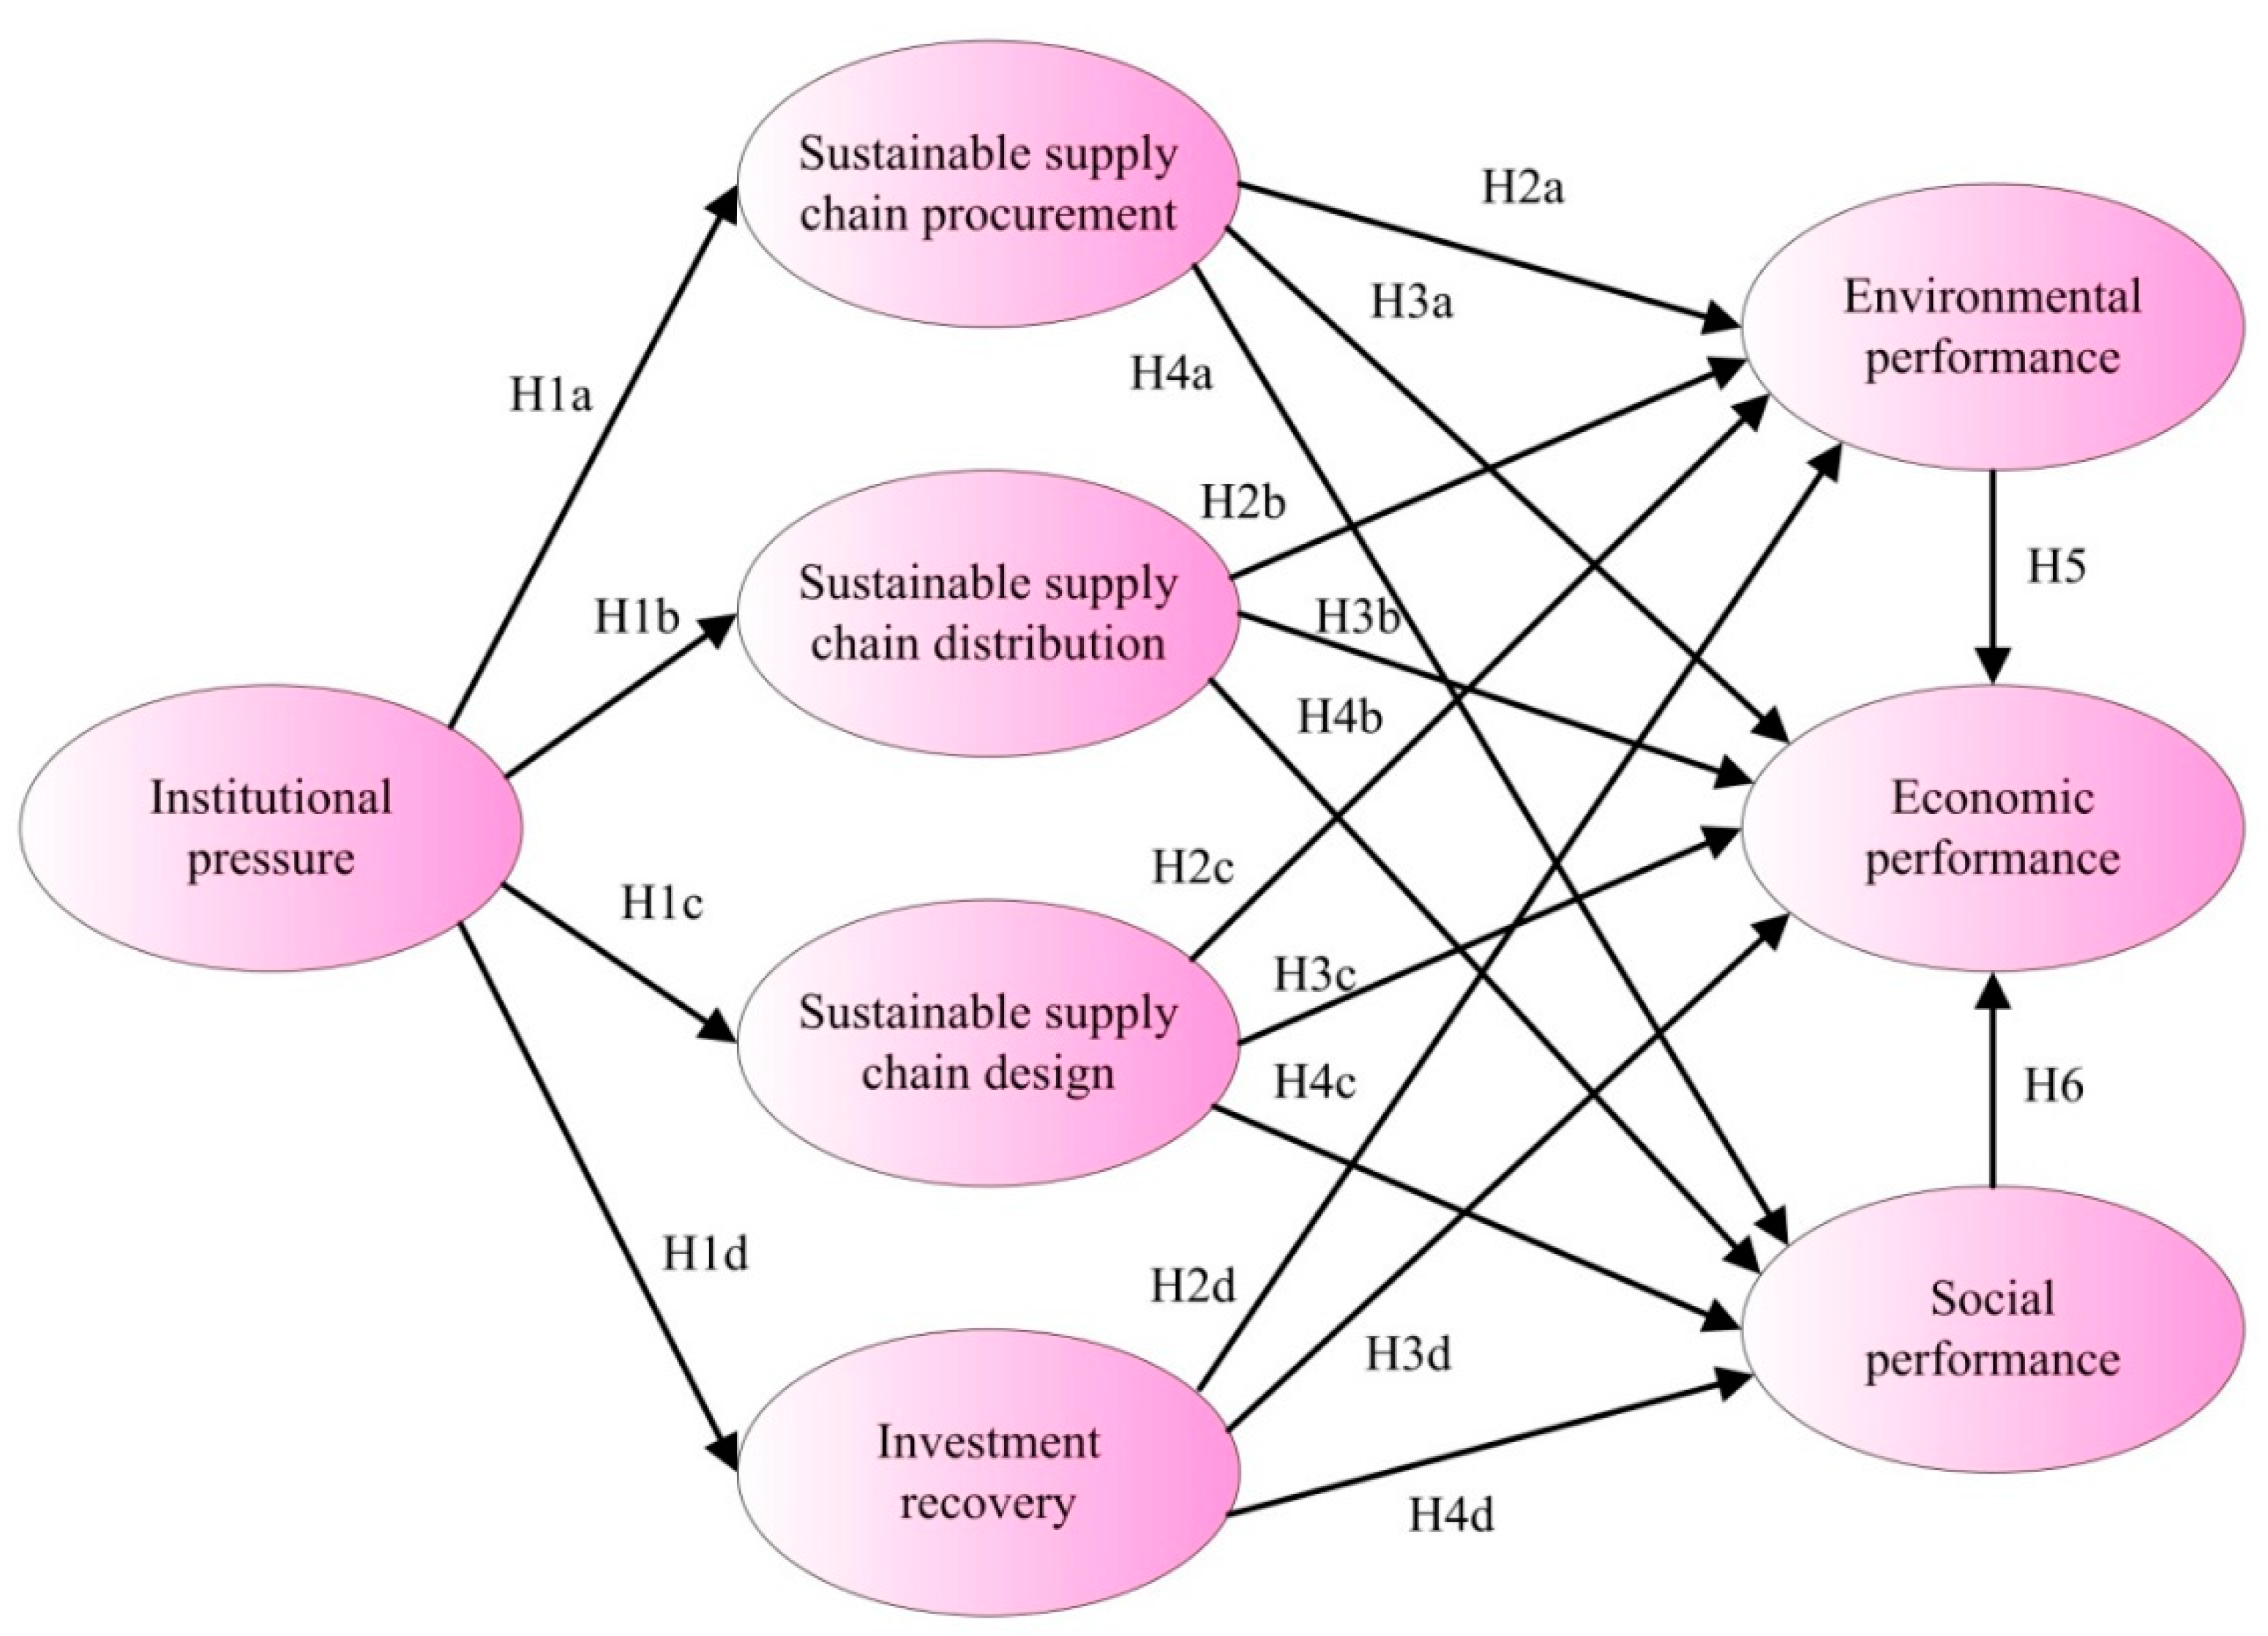
2.2.2. Theoretical Model of the Relationship between Institutional Pressure and Performance Outcome of Sustainable Supply Chain
3. Research on Scale Development and Data Collection
3.1. Scale Development and Questionnaire Design
3.1.1. Scale Development
3.1.2. Questionnaire Design
3.2. Distribution and Collection of Questionnaires
- ①
- Enterprise managers of university-enterprise cooperation enterprise make an investigation and distribute the paper questionnaires.
- ②
- Contact with enterprises through introduction by teachers, colleagues, students, and relatives, and distribute the questionnaires on the Internet.
3.3. Reliability and Validity Analysis
3.3.1. Reliability Analysis
3.3.2. Validity Analysis
4. Research on the Relationship between Institutional Pressure and Performance Outcome of Sustainable Supply Chain
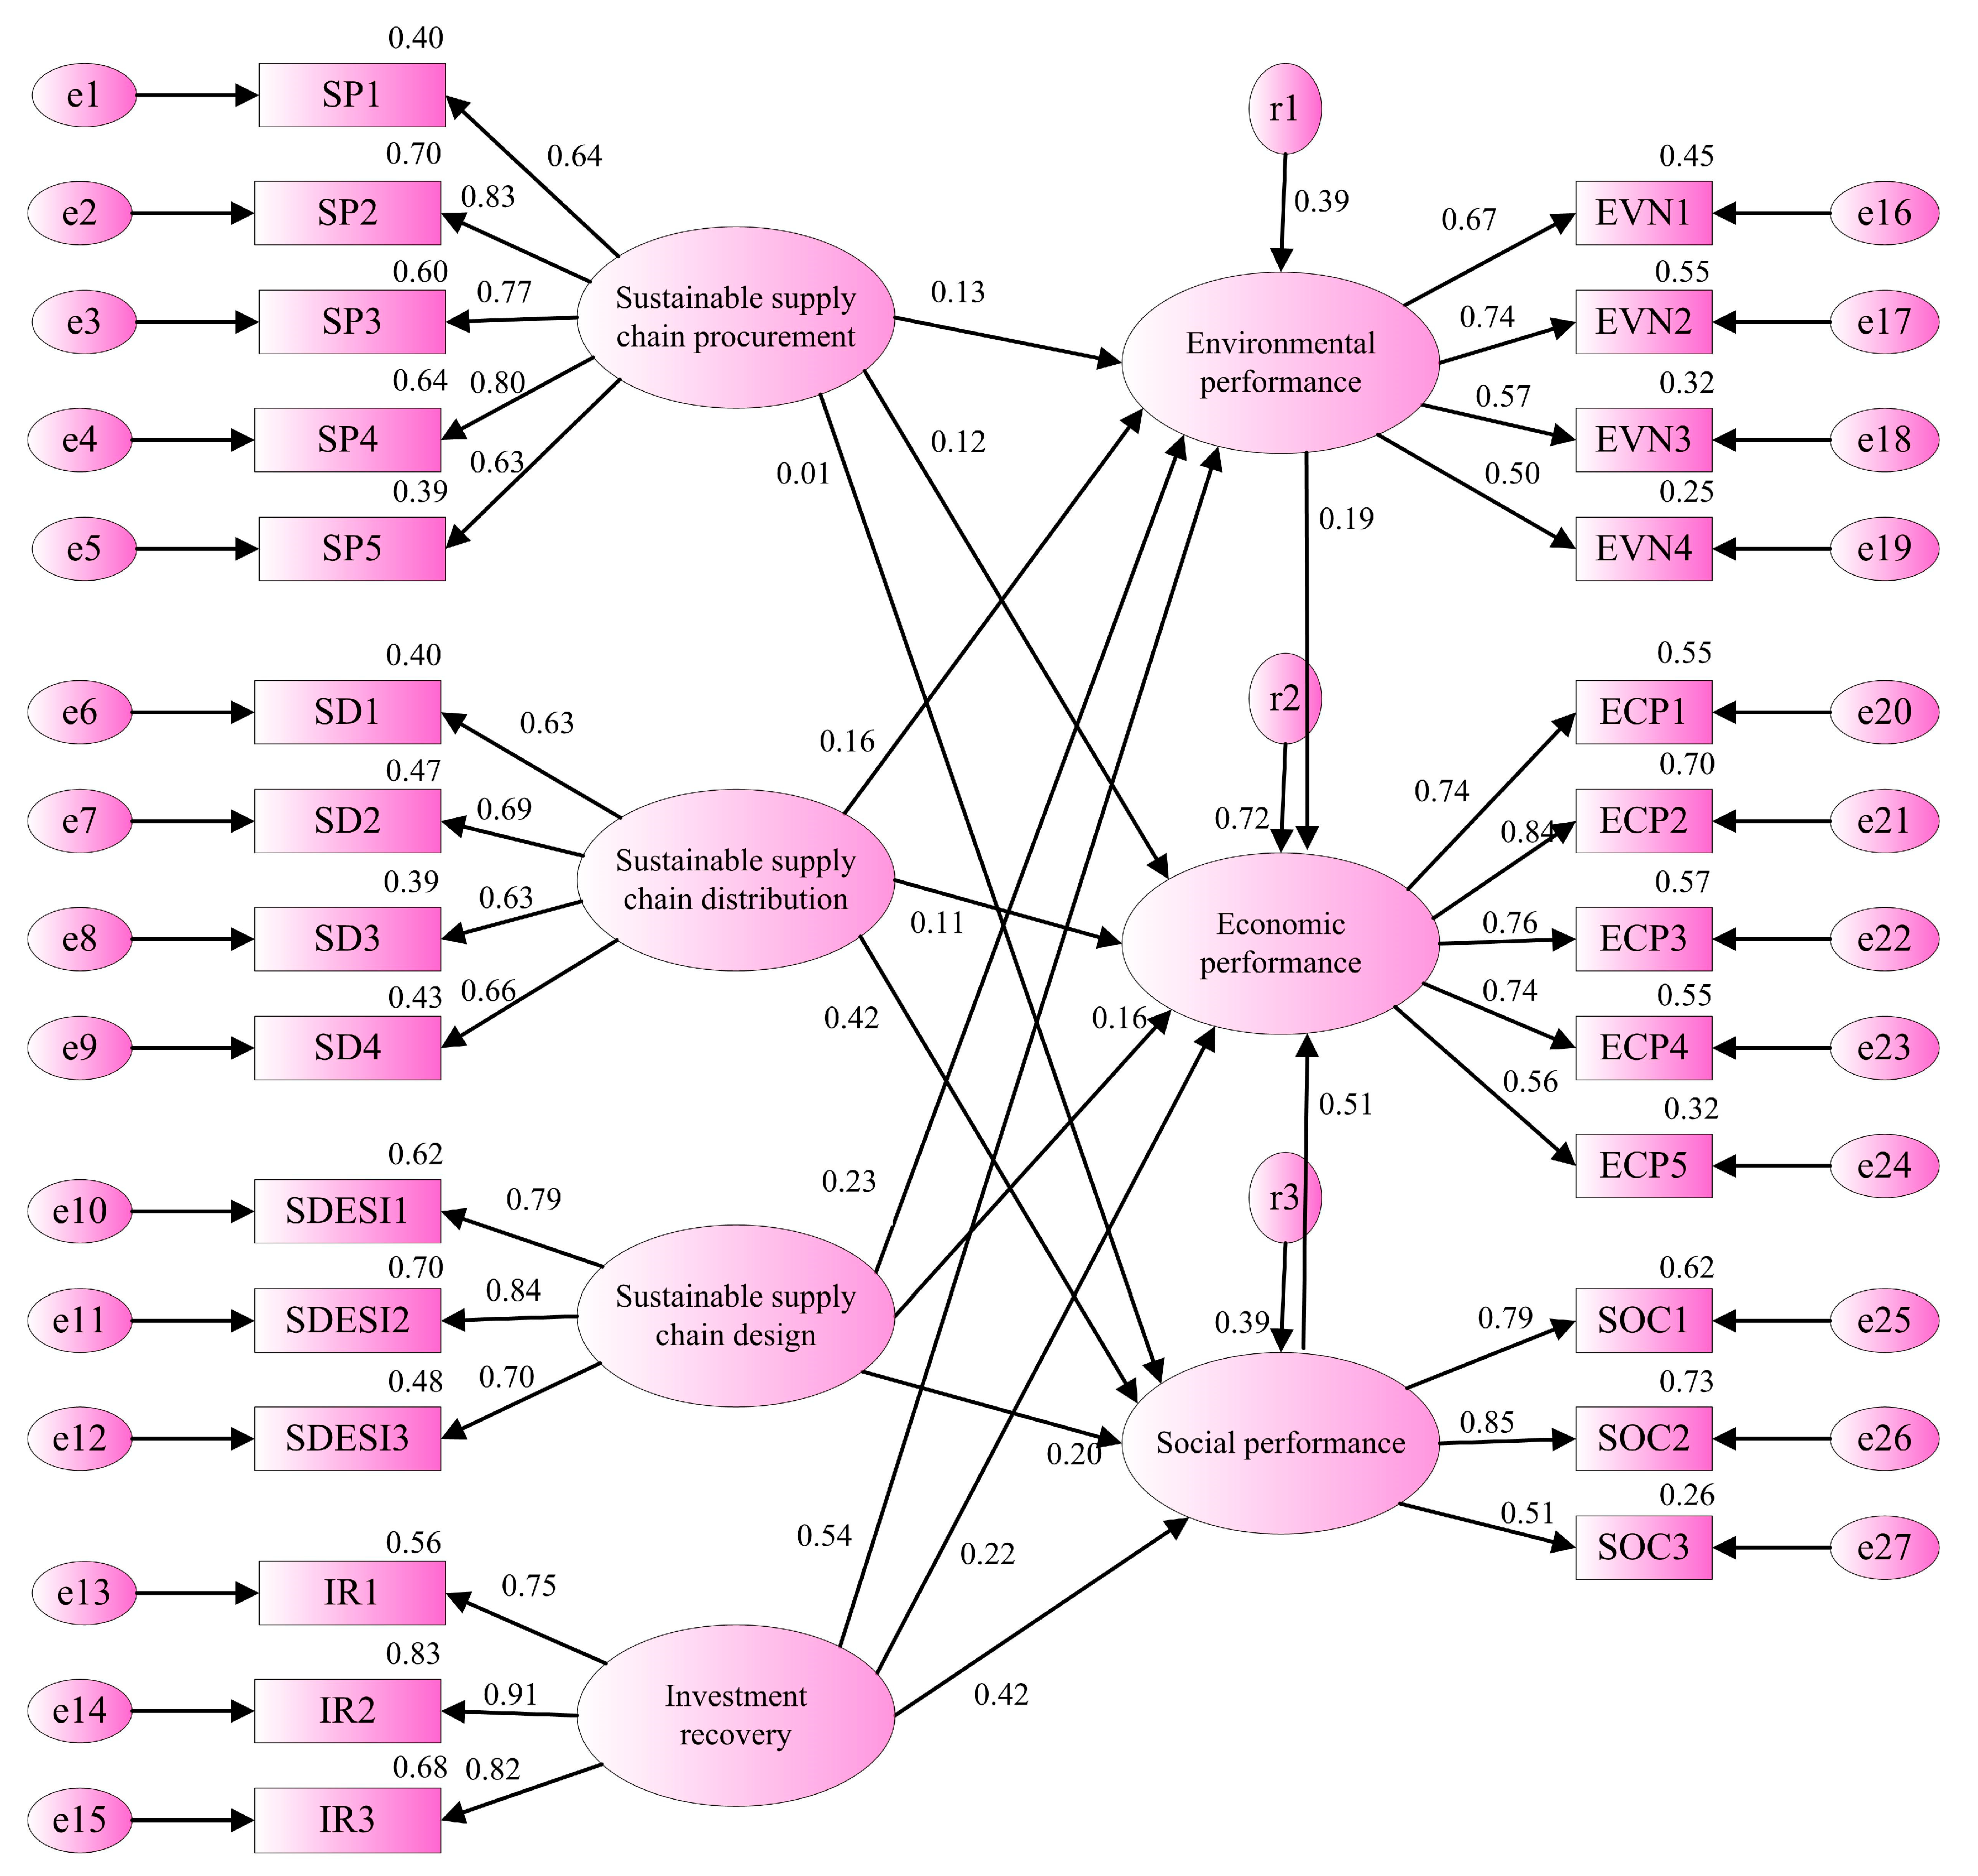
4.1. Fitting Analysis on Structural Equation Model
4.1.1. Fitting of Original Structural Equation Model
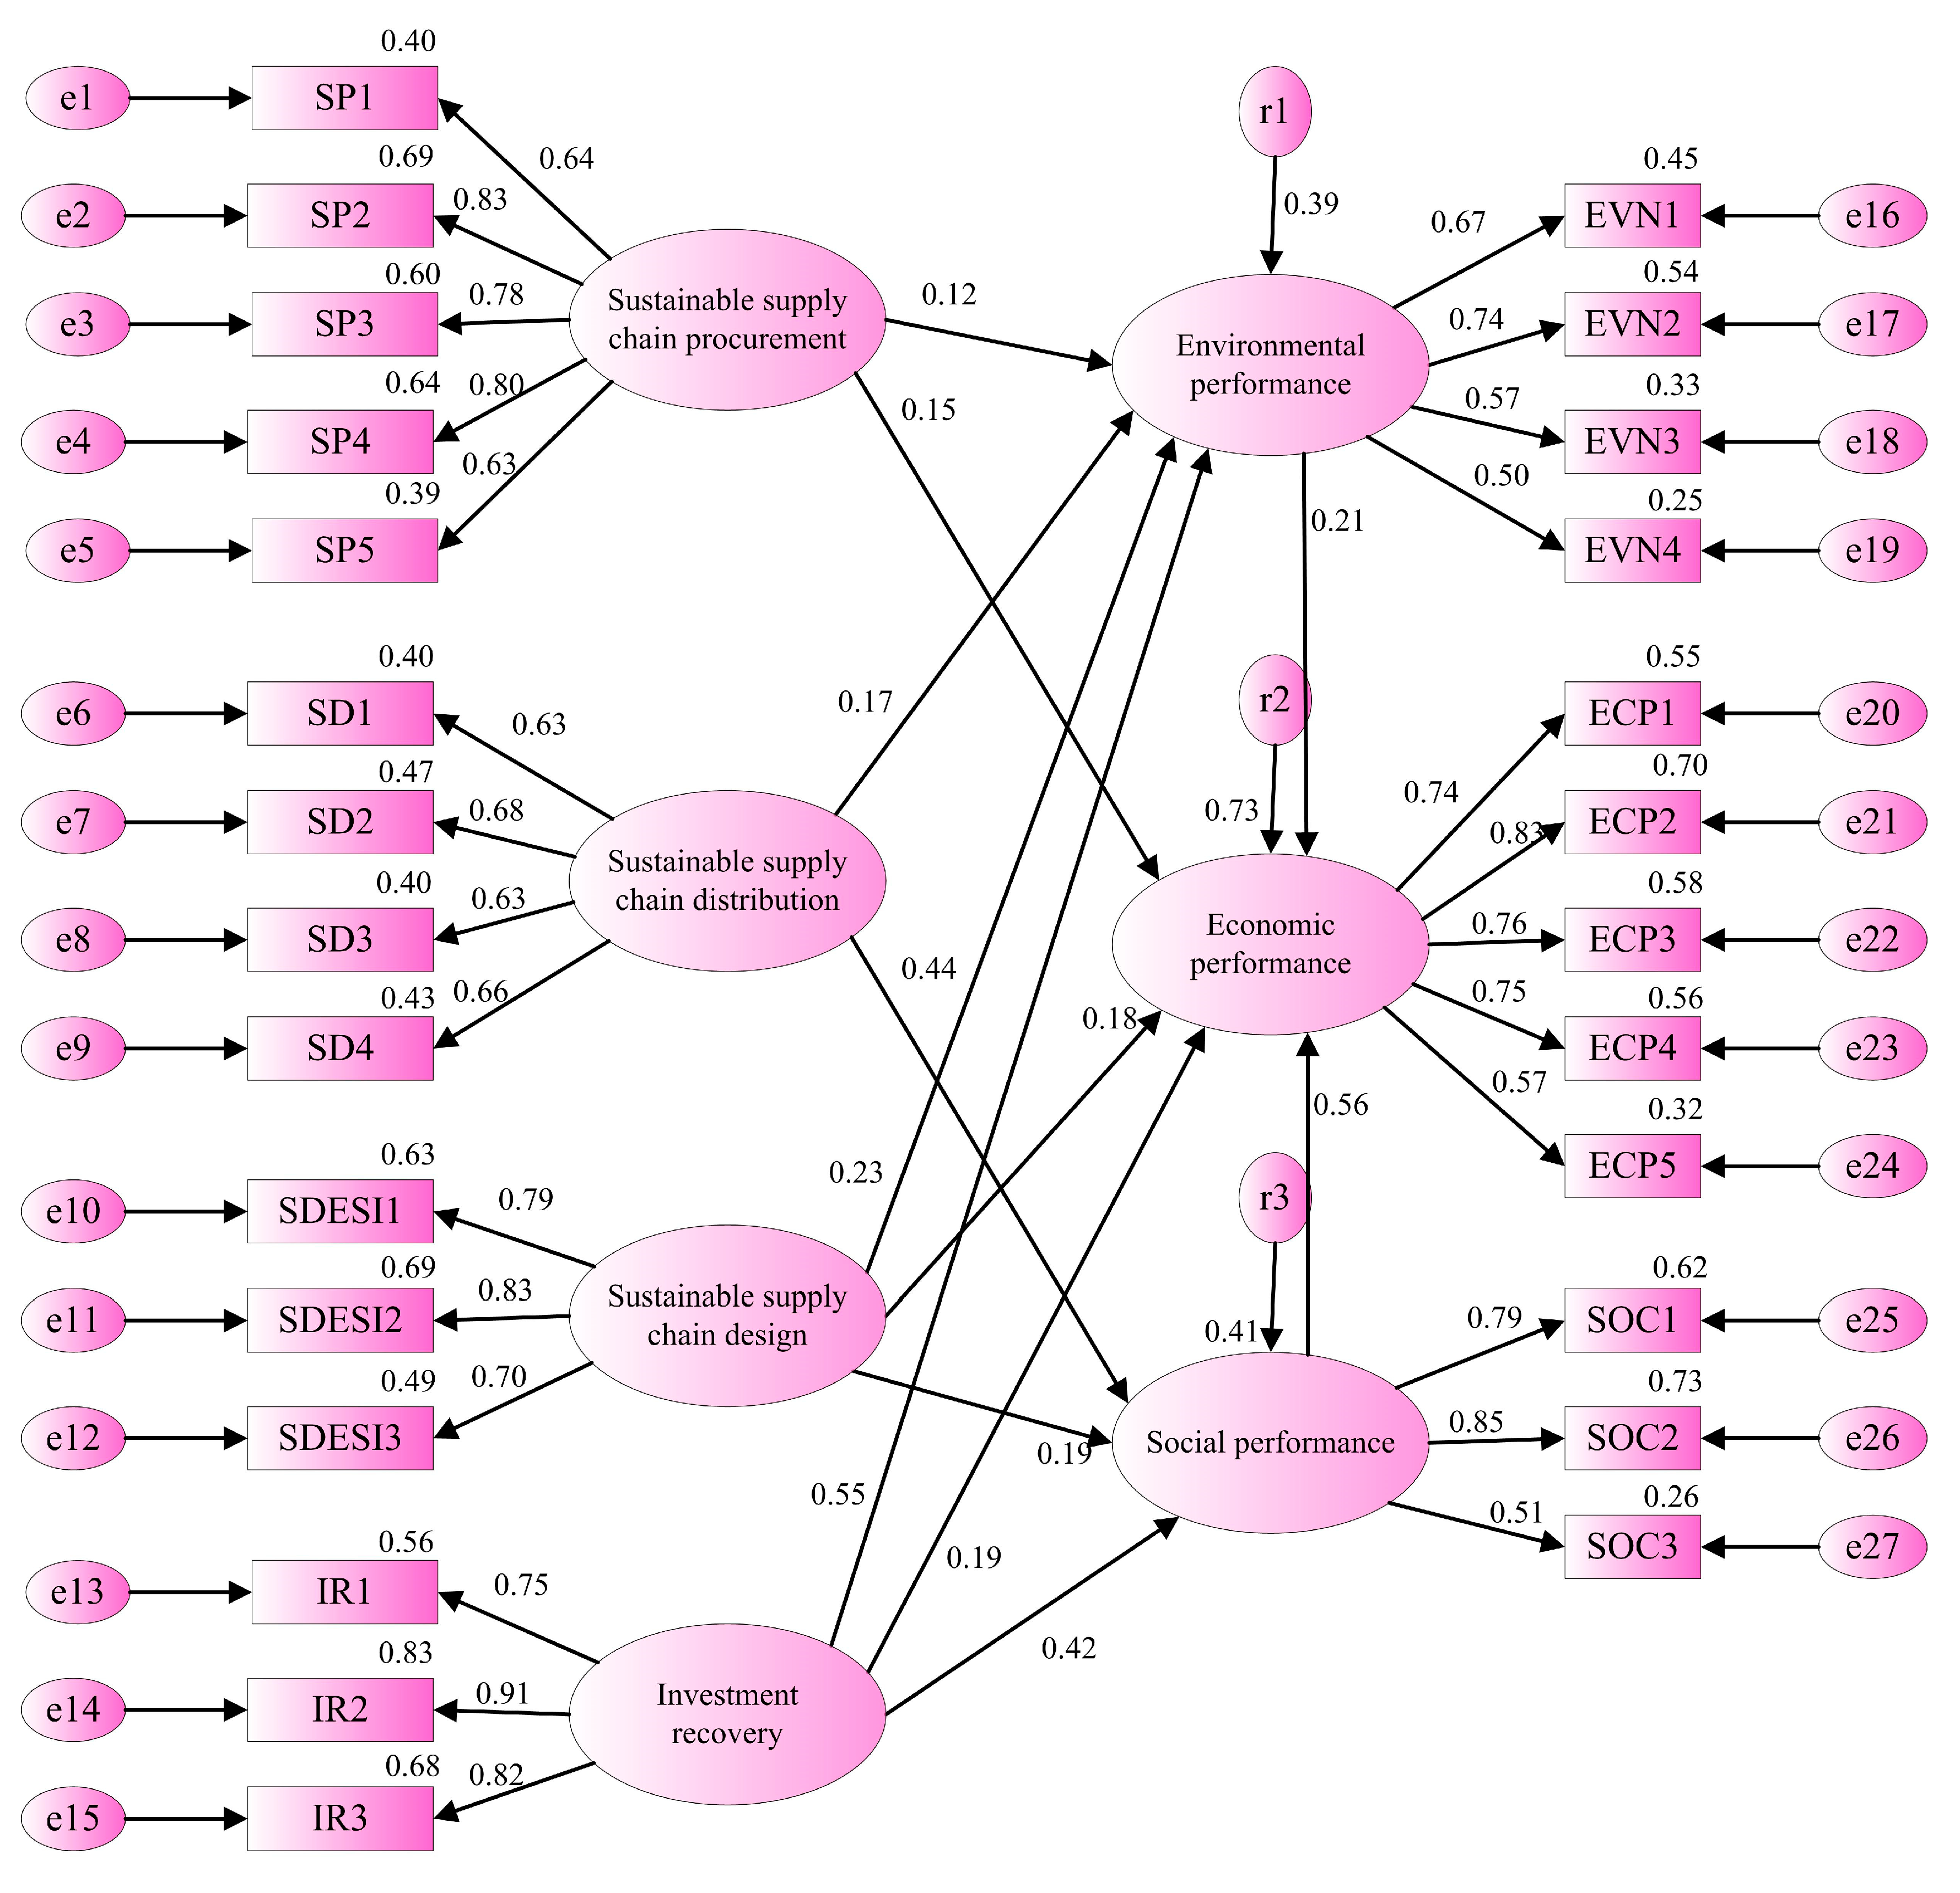
4.1.2. Modification of Model
4.2. Hypothesis Testing
4.3. Result Analysis of Model and Countermeasures
4.3.1. Institutional Pressure and SSCP
4.3.2. Sustainable Supply Chain Procurement and Enterprise Performance
4.3.3. Sustainable Supply Chain Distribution and Enterprise Performance
4.3.4. Sustainable Supply Chain Design and Enterprise Performance
4.3.5. Investment Recovery and Enterprise Performance
4.3.6. Enterprise Performance
5. Conclusions and Prospect
5.1. Research Conclusions
5.2. Research Prospect
- (1)
- The relationship between SSCP and performance outcome of enterprises is researched herein under the institutional pressure. However, enterprises are still faced with the pressures of supply chain, market demands, and competitors, etc. in the real life, while they implement SSCP. Therefore, other pressures can be taken into consideration in the future research to study the relationship among the above three pressures.
- (2)
- It is concluded herein that institutional pressure can promote the implementation of SSCP and such practices can, in turn, improve enterprise performance. However, it is also an important research direction whether the improvement of enterprise performance can reversely promote SSCP.
- (3)
- SSCP of Chinese manufacturing enterprises are researched herein. Due to lack of comparisons with developed countries, it may make further research on SSCP in the developed and other developing countries in the future, thereby the influence of potential factors, such as the differences in market scale, economic development, and legal institutions, etc. may be eliminated on the conclusion. Therefore, in order to improve the universality of research, it will be another research direction to repeat the research and compare, analyze the differences of different countries.
- (4)
- The research mainly focuses on the manufacturing industry rather than other industries, such as service industry etc. Therefore, future research may be carried out on other industries.
- (5)
- The research selected limited indicators of the social performance; therefore, future research should draw on various indicators according to the GRI framework for social sustainability performance to carry out in-depth study.
Author Contributions
Funding
Acknowledgments
Conflicts of Interest
References
- Zailani, S.; Jeyaraman, K.; Vengadasan, G.; Premkumar, R. Sustainable supply chain management (SSCM) in Malaysia: A survey. Int. J. Prod. Econ. 2012, 140, 330–340. [Google Scholar] [CrossRef]
- Xu, X.; Zend, H. Sustainable supply chain management and circular economy capability: Based on the perspective of institutional pressure. Syst. Eng. Theory Pract. 2017, 37, 1793–1802. [Google Scholar]
- Varsei, M.; Soosay, C.; Fahimnia, B.; Sarkis, J. Framing sustainability performance of supply chains with multidimensional indicators. Supply Chain Manag. Int. J. 2014, 19, 242–257. [Google Scholar] [CrossRef]
- Elkington, J. Partnerships from cannibals with forks: The Triple Bottom Line of 21st-century business. Environ. Qual. Manag. 1998, 8, 37–51. [Google Scholar] [CrossRef]
- Marconi, M.; Marilungo, E.; Papetti, A.; Germani, M. Traceability as a means to investigate supply chain sustainability: The real case of a leather shoe supply chain. Int. J. Prod. Res. 2017, 55, 6638–6652. [Google Scholar] [CrossRef]
- Koeksal, D.; Straehle, J.; Mueller, M. Social Sustainable Supply Chain Management in the Textile and Apparel Industry-A Literature Review. Sustainability 2017, 9, 100. [Google Scholar] [CrossRef]
- Ahi, P.; Searcy, C. An analysis of metrics used to measure performance in green and sustainable supply chains. J. Clean. Prod. 2015, 86, 360–377. [Google Scholar] [CrossRef]
- Qorri, A.; Mujkić, Z.; Kraslawski, A. A conceptual framework for measuring sustainability performance of supply chains. J. Clean. Prod. 2018, 189, 570–584. [Google Scholar] [CrossRef]
- Hanim Mohamad Zailani, S.; Eltayeb, T.K.; Hsu, C.C.; Choon Tan, K. The impact of external institutional drivers and internal strategy on environmental performance. Int. J. Oper. Prod. Manag. 2012, 32, 721–745. [Google Scholar] [CrossRef]
- Lozano, R; Carpenter, A.; Huisingh, D. A review of ‘theories of the firm’ and their contributions to Corporate Sustainability. J. Clean. Prod. 2014, 106, 430–442. [Google Scholar] [CrossRef]
- Boström, M.; Jönsson, A.M.; Lockie, S.; Mol, A.P.; Observer, P. Sustainable and responsible supply chain governance: Challenges and opportunities. J. Clean. Prod. 2015, 107, 1–7. [Google Scholar] [CrossRef]
- Zeng, H.; Chen, X.; Xiao, X.; Zhou, Z. Institutional pressures, sustainable supply chain management, and circular economy capability: Empirical evidence from Chinese eco-industrial park firms. J. Clean. Prod. 2017, 155, 54–65. [Google Scholar] [CrossRef]
- Esfahbodi, A.; Zhang, Y.; Watson, G.; Zhang, T. Governance pressures and performance outcomes of sustainable supply chain management—An empirical analysis of UK manufacturing industry. J. Clean. Prod. 2016, 155, 146–163. [Google Scholar] [CrossRef]
- Ahi, P.; Searcy, C. A comparative literature analysis of definitions for green and sustainable supply chain management. J. Clean. Prod. 2013, 52, 329–341. [Google Scholar] [CrossRef]
- Seuring, S.; Muller, M. From a literature review to a conceptual framework for sustainable supply chain management. J. Clean. Prod. 2008, 16, 1699–1710. [Google Scholar] [CrossRef]
- Beske, P.; Land, A.; Seuring, S. Sustainable supply chain management practices and dynamic capabilities in the food industry: A critical analysis of the literature. Int. J. Prod. Econ. 2014, 152, 131–143. [Google Scholar] [CrossRef]
- Jian, X.; Yu, T. An evaluation on sustainable supply chain risks based on social responsibility of enterprises by taking automobile industry as an example. J. Hunan Univ. 2015, 29, 71–78. [Google Scholar]
- Yang, X.; Jiang, Y. Optimal model for sustainable supply chain based on TBL theory. Mod. Manag. 2016, 63, 62–64. [Google Scholar]
- Dimitrios, B.; Naoum, T.; Dimitrios, V.; Eleftherios, I. Sustainable supply chain management in the digitalization era: The impact of automated guided vehicles. J. Clean. Prod. 2017, 142, 3970–3984. [Google Scholar]
- Zhu, Q. Collaborative management and innovation of sustainable supply chain. Chin. J. Manag. 2017, 14, 775–780. [Google Scholar]
- Morali, O.; Searcy, C. A review of sustainable supply chain management practices in Canada. J. Bus. Ethics 2013, 117, 635–658. [Google Scholar] [CrossRef]
- Paulraj, A.; Chen, I.J.; Blome, C. Motives and performance outcomes of sustainable supply chain management practices: A multi-theoretical perspective. J. Bus. Ethics 2015, 25, 299–318. [Google Scholar] [CrossRef]
- Li, X.; Ting, W.; Jun, D. The impact of sustainable supply chain management practices on firm performance: An empirical study from china. J. Appl. Stat. Manag. 2017, 36, 693–702. [Google Scholar]
- Esfahbodi, A.; Zhang, Y.; Watson, G. Sustainable supply chain management in emerging economies: Trade-offs between environmental and cost performance. Int. J. Prod. Econ. 2016, 181, 350–366. [Google Scholar] [CrossRef]
- Wang, J.; Yang, J. Evaluation model and algorithm of sustainable supply chain performances based on structural entropy weight method and improved TOPSIS method. Chin. Mark. 2013, 15, 15–20. [Google Scholar]
- De Sousa Jabbour, A.B.L.; de Oliveira Frascareli, F.C.; Jabbour, C.J.C. Green Supply Chain Management and Firms’ Performance: Understanding Potential Relationships and the Role of Green Sourcing and Some Other Green Practices. Resour. Conserv. Recycl. 2015, 104, 366–374. [Google Scholar] [CrossRef]
- Dai, J.; Jia, Q.; Xie, L.; Wang, J. Research of Performance Evaluation on Sustainable Supply Chain Based on Structural Equation Modeling. Ecol. Econ. 2015, 31, 86–89. [Google Scholar]
- Haghighi, S.M.; Torabi, S.A.; Ghasemi, R. An Integrated Approach for Performance Evaluation in Sustainable Supply Chain Networks (with a Case Study). J. Clean. Prod. 2016, 137, 579–597. [Google Scholar] [CrossRef]
- Deepak, M.; Kannan, G.; Noorul, A. Exploring the Impact of Dynamic Capabilities on the Performance of Sustainable Supply Chain Firmsby Using Grey-Analytical Hierarchy Process. J. Clean. Prod. 2017, 147, 637–653. [Google Scholar]
- Erhun, M.O. A Legal Framework of Sustainable Environmental Governance in Nigeria. Front. Legal Res. 2016, 3, 24–38. [Google Scholar]
- Ojo, A.; Mellouli, S. Deploying governance networks for societal challenges. Gov. Inf. Q. 2016. [Google Scholar] [CrossRef]
- Edwards, D.B., Jr.; Brehm, W.C. The emergence of Cambodian civil society within global educational governance: A morphogenetic approach to agency and structure. J. Educ. Policy 2015, 30, 275–293. [Google Scholar] [CrossRef]
- Setchfield, B.; Abbott, J. Planning and developing the North Lakes master planned community: Governance and the public interest in the network society. Aust. Plan. 2015, 52, 1–12. [Google Scholar] [CrossRef]
- Thynne, I.; Peters, B.G. Addressing the Present and the Future in Government and Governance: Three approaches to Organising Public Action. Public Admin. Dev. 2015, 35, 73–85. [Google Scholar] [CrossRef]
- Kutay, A. Limits of Participatory Democracy in European Governance. Eur. Law J. 2015, 21, 803–818. [Google Scholar] [CrossRef]
- Sang, M.L.; Kim, S.T.; Choi, D. Green Supply Chain Management and Organizational Performance. Ind. Manag. Data Syst. 2012, 112, 1148–1180. [Google Scholar]
- Taylor, A.; Taylor, M. Antecedents of Effective Performance Measurement System Implementation: An Empirical Study of UK Manufacturing Firms. Int. J. Prod. Res. 2013, 51, 5485–5498. [Google Scholar] [CrossRef]
- Zhu, Q.; Sarkis, J.; Lai, K. Examining the Effect of Green Supply Chain Management Practices and Their Mediation on Performance Improvement. Int. J. Prod. Res. 2012, 50, 1377–1394. [Google Scholar] [CrossRef]
- Tan, K.H. Managing the Indirect Effects of Environmental Regulation and Performance Measurement. Ind. Eng. Manag. Syst. 2014, 13, 148–153. [Google Scholar] [CrossRef] [Green Version]
- Lonzano, R. Envisioning sustainability three-dimensionally. J. Clean. Prod. 2008, 16, 1838–1846. [Google Scholar] [CrossRef]
- Norazlan, A.N.I.; Habidin, N.F.; Roslan, M.H.; Zaini, M.; Zainudin, M.Z. The development of sustainable supply chain management practices and sustainable performance in malaysian healthcare industry. Int. J. Ethics Eng. Manag. Educ. 2014, 1, 51–55. [Google Scholar]
- Green, K.W. Environmental collaboration and Monitoring Enhance Organizational Performance. Ind. Manag. Data Syst. 2012, 112, 186–205. [Google Scholar] [CrossRef]
- Mania, V.; Gunasekaranb, A. Four forces of supply chain social sustainability adoption in emerging economies. Int. J. Prod. Econ. 2018, 199, 150–161. [Google Scholar] [CrossRef]
- Chardine-Baumann, E.; Botta-Genoulaz, V. A framework for sustainable performance assessment of supply chain management practices. Comput. Ind. Eng. 2014, 76, 138–147. [Google Scholar] [CrossRef]
- Reefke, H.; Sundaram, D. Key themes and research opportunities in sustain-able supply chain management eidentification and evaluation. Omega 2017, 66, 195–211. [Google Scholar] [CrossRef]
- Laari, S.; Töyli, J.; Solakivi, T.; Ojala, L. Firm performance and customer-driven green supply chain management. J. Clean. Prod. 2016, 112, 1960–1970. [Google Scholar] [CrossRef]
- Wu, M. Operation and Application of Structural Equation Model—AMOS; Publishing House of Chongqing University: Chongqing, China, 2010; pp. 37–52. [Google Scholar]
- Zhang, Y.; Hou, D.; Xiong, G.; Duan, Y.; Cai, C.; Wang, X.; Li, J.; Tao, S.; Liu, W. Structural equation modeling of PAHs in ambient air, dust fall, soil, and cabbage in vegetable bases of Northern China. Environ. Pollut. 2018, 239, 13–20. [Google Scholar] [CrossRef] [PubMed]
- Flygansvær, B.; Dahlstrom, R.; Nygaard, A. Exploring the pursuit of sustainability in reverse supply chains for electronics. J. Clean. Prod. 2018, 189, 472–484. [Google Scholar] [CrossRef]
- Liu, M. The analysis of affecting impacts on environmental behavior Based on structural equation model. Dongbei Univ. Financ. Econ. 2017, 11, 19–20. [Google Scholar]
- Hong, J.; Zhang, Y.; Dinga, M. Sustainable supply chain management practices, supply chain dynamic capabilities and enterprise performance. J. Clean. Prod. 2018, 172, 3508–3519. [Google Scholar] [CrossRef]


| Company | Classification of SSCP; (Practice Contents) |
|---|---|
| IBM | (1) Certified by ISO 140001; (design) (2) More concerned about the content of harmful substances in products; (procurement) (3) Batteries and plastic products comply with WEEE regulations; (procurement) |
| HP | (1) Certified by ISO 14001; (procurement) (2) Harmful substances are limited in products; (procurement) (3) The corporate social responsibility, environmental rules and other requirements are clarified to suppliers; (procurement) (4) The environmental report should be based on the standard of European recycling platform; (design) |
| SONY | (1) Certified by ISO 14001; (design) (2) Formulating medium-term and long-term plan; (design and investment; (Recovery) (3) Restriction of harmful substances in products based on sustainable supply chain procurement standards; (procurement) |
| SAMSUNG | (1) Certified by ISO 14001; (design) (2) The use of hazardous substances are controlled according to “OQA-2049”; (design) (3) Providing environmental reports in conjunction with “eco partners”; (distribution) |
| Shanghai General Motors | (1) Requires suppliers to reduce energy consumption by 5–10%; (procurement) (2) Requires suppliers to reduce water consumption and waste by 5–10%; (procurement) (3) Requires greenhouse gas and non-greenhouse gas pollution to be reduced by 5–10%; (procurement) |
| Haier | (1) Product design should take into account the repeated utilization and recovery of raw materials; (design and investment recovery) (2) Reducing the use of toxic and harmful materials; (procurement) (3) Construction of an ecological industrial park for home appliance recycling; (distribution) (4) An assessment tool for researching and Manufacturing the carbon footprint of white electric products in accordance with international standards; (distribution) |
| Huawei | (1) Develop product projects with customers; (design and investment recovery) (2) Improve the sustainability of supplier certification and performance evaluation; (procurement) (3) Regular review of supplier environmental performance; (procurement) (4) Optimizing internal management process; (design and investment recovery) (5) Formulating IPC1401 Practice Guide; (procurement) |
| Structure | Definition | Sources |
|---|---|---|
| Institutional pressure | Laws and regulations to strengthen the company’s environmental adjustment; | [9,25,30,34] |
| Sustainable supply chain procurement | Sustainable supply chain procurement lays emphasis on cooperation with suppliers, aiming to develop environmental sustainable products; | [24] |
| Sustainable supply chain distribution | Sustainable supply chain distribution refers to the transportation mode of any products or services from suppliers to manufacturers and final customers, aiming to reduce negative influences on environment; | [24] |
| Sustainable supply chain design | Sustainable supply chain design requires that the products designed by manufacturers should be produced with as few materials and little energy as possible for the convenience of recovery and recycling. Besides, harmless substances shall be used; | [24] |
| Investment recovery | Investment recovery is a process of recovering unused value and selling lifelong assets through effective recycling or surplus. Therefore, redundant inventory, wastes and equipment etc. need selling; | [24] |
| Environmental performance | Environmental performance refers to the ability of manufacturing enterprises to reduce the emissions of exhaust gas, waste water and solid waste as well as risks and the consumption of toxic substances; | [21,22] |
| Economic performance | Economic performance refers to the reduction of purchased materials, energy consumption, waste discharge and disposal, and fines of environmental accidents; | [21,22] |
| Social performance | Social performance refers to the ability of manufacturing enterprises to improve the satisfactions of employees and customers as well as the reputation of enterprises. | [21,22] |
| Variables | Measurement Items |
|---|---|
| Institutional pressure (CP) | CP1 National environmental laws and regulations (such as waste discharge and clean production etc.) CP2 Regional environmental laws and regulations (such as waste discharge and clean production etc.) CP3 Environmental legislation of exporters CP4 Potential conflicts of products and laws (such as cyclic economy, EPR and EHS etc.) |
| Sustainable supply chain procurement (SP) | SP1 Ecological labels of products SP2 Cooperation of environmental objectives with suppliers SP3 Environmental audit of internal management of suppliers SP4 ISO14001 certification of suppliers SP5 Evaluation on environmental protection practices of second-tier suppliers |
| Sustainable supply chain distribution (SD) | SD1 Use less energy during the distribution of products SD2 Use renewable energy in the transportation mode of any products SD3 Update freight logistics and transportation system (both software and hardware, such as reducing aeronautical miles and the weight of containers, improving refrigeration etc.) SD4 Track and monitor the emission (carbon footprint) during the distribution |
| Sustainable supply chain design (SDESI) | SDESI1 Decrease the consumption of materials and raw materials in the design of products SDESI2 Re-utilize the designed products and recycle the raw materials, parts and semi-finished products SDESI3 The designed products shall avoid or reduce the utilization of hazardous substances in the manufacturing process |
| Investment recovery (IR) | IR1 Recycle or sell excessive inventory or materials IR2 Sell waste materials or byproducts IR3 Sell idle equipment assets |
| Environmental performance (EVN) | EVN1 Reduce the discharge of exhaust gas, waste water and solid waste EVN2 Decrease the consumption of harmful/toxic substances EVN3 Reduce the frequency of environmental accidents EVN4 Improve enterprise environment |
| Economic performance (ECP) | ECP1 Decrease the costs of purchased materials ECP2 Decrease the costs of energy consumption ECP3 Reduce waste handling charges ECP4 Reduce pollutant charges ECP5 Reduce the fines of environmental accidents |
| Social performance (SOC) | SOC1 Improve employee satisfaction SCO2 Improve customer satisfaction SOC3 Improve corporate reputation |
| Position | Frequency | Percent | Cumulative Percentage |
|---|---|---|---|
| Top managers | 21 | 13.5% | 13.5% |
| Middle managers | 65 | 41.7% | 55.2% |
| First-line managers | 70 | 44.9% | 100.0% |
| Total | 156 | 100.0% |
| Enterprise Type | Frequency | Percent | Cumulative Percentage |
|---|---|---|---|
| Thermoelectric | 19 | 12.2% | 12.2% |
| Chemical/petrochemical | 22 | 14.1% | 26.3% |
| Food processing | 42 | 26.9% | 53.2% |
| Electronic/electrical | 34 | 21.8% | 75.0% |
| Automobile and parts | 21 | 13.5% | 88.5% |
| Others | 18 | 11.5% | 100.0% |
| Total | 156 | 100.0% |
| Term | Frequency | Percent | Cumulative Percentage |
|---|---|---|---|
| Less than 2 years | 64 | 41.0% | 41.0% |
| 2~5 years | 59 | 37.8% | 78.8% |
| At least 5 years | 33 | 21.2% | 100.0% |
| Total | 156 | 100.0% |
| Cronbach’ a Coefficients | Institutional Pressure | SSCP | Performance Outcome | |||||
|---|---|---|---|---|---|---|---|---|
| CP | SP | SD | SDESI | IR | EVN | ECP | SOC | |
| a coefficient of subscale | 0.789 | 0.862 | 0.747 | 0.794 | 0.863 | 0.773 | 0.886 | 0.782 |
| a coefficient of total scale | 0.789 | 0.882 | 0.915 | |||||
| Grade I Index | Grade II Index | Factor Load | AVE |
|---|---|---|---|
| Institutional pressure | CP1 | 0.59 | 0.612 |
| CP2 | 0.66 | ||
| CP3 | 0.71 | ||
| CP4 | 0.75 | ||
| Sustainable supply chain procurement | SP1 | 0.65 | 0.714 |
| SP2 | 0.86 | ||
| SP3 | 0.75 | ||
| SP4 | 0.78 | ||
| SP5 | 0.63 | ||
| Sustainable supply chain distribution | SD1 | 0.66 | 0.604 |
| SD2 | 0.72 | ||
| SD3 | 0.61 | ||
| SD4 | 0.62 | ||
| Sustainable supply chain design | SDESI1 | 0.78 | 0.704 |
| SDESI2 | 0.83 | ||
| SDESI3 | 0.65 | ||
| Investment recovery | IR1 | 0.75 | 0.785 |
| IR2 | 0.90 | ||
| IR3 | 0.82 | ||
| Environmental performance | ENV1 | 0.67 | 0.543 |
| ENV2 | 0.74 | ||
| ENV3 | 0.57 | ||
| ENV4 | 0.50 | ||
| Economic performance | EPC1 | 0.74 | 0.667 |
| EPC2 | 0.84 | ||
| EPC3 | 0.76 | ||
| EPC4 | 0.74 | ||
| EPC5 | 0.56 | ||
| Social performance | SOC1 | 0.79 | 0.708 |
| SOC2 | 0.85 | ||
| SOC3 | 0.51 |
| Path | Standardized Path Coefficient | p-Value | t-Value | Whether SIGNIFICANT OR NOT (t > 1.96) | ||
|---|---|---|---|---|---|---|
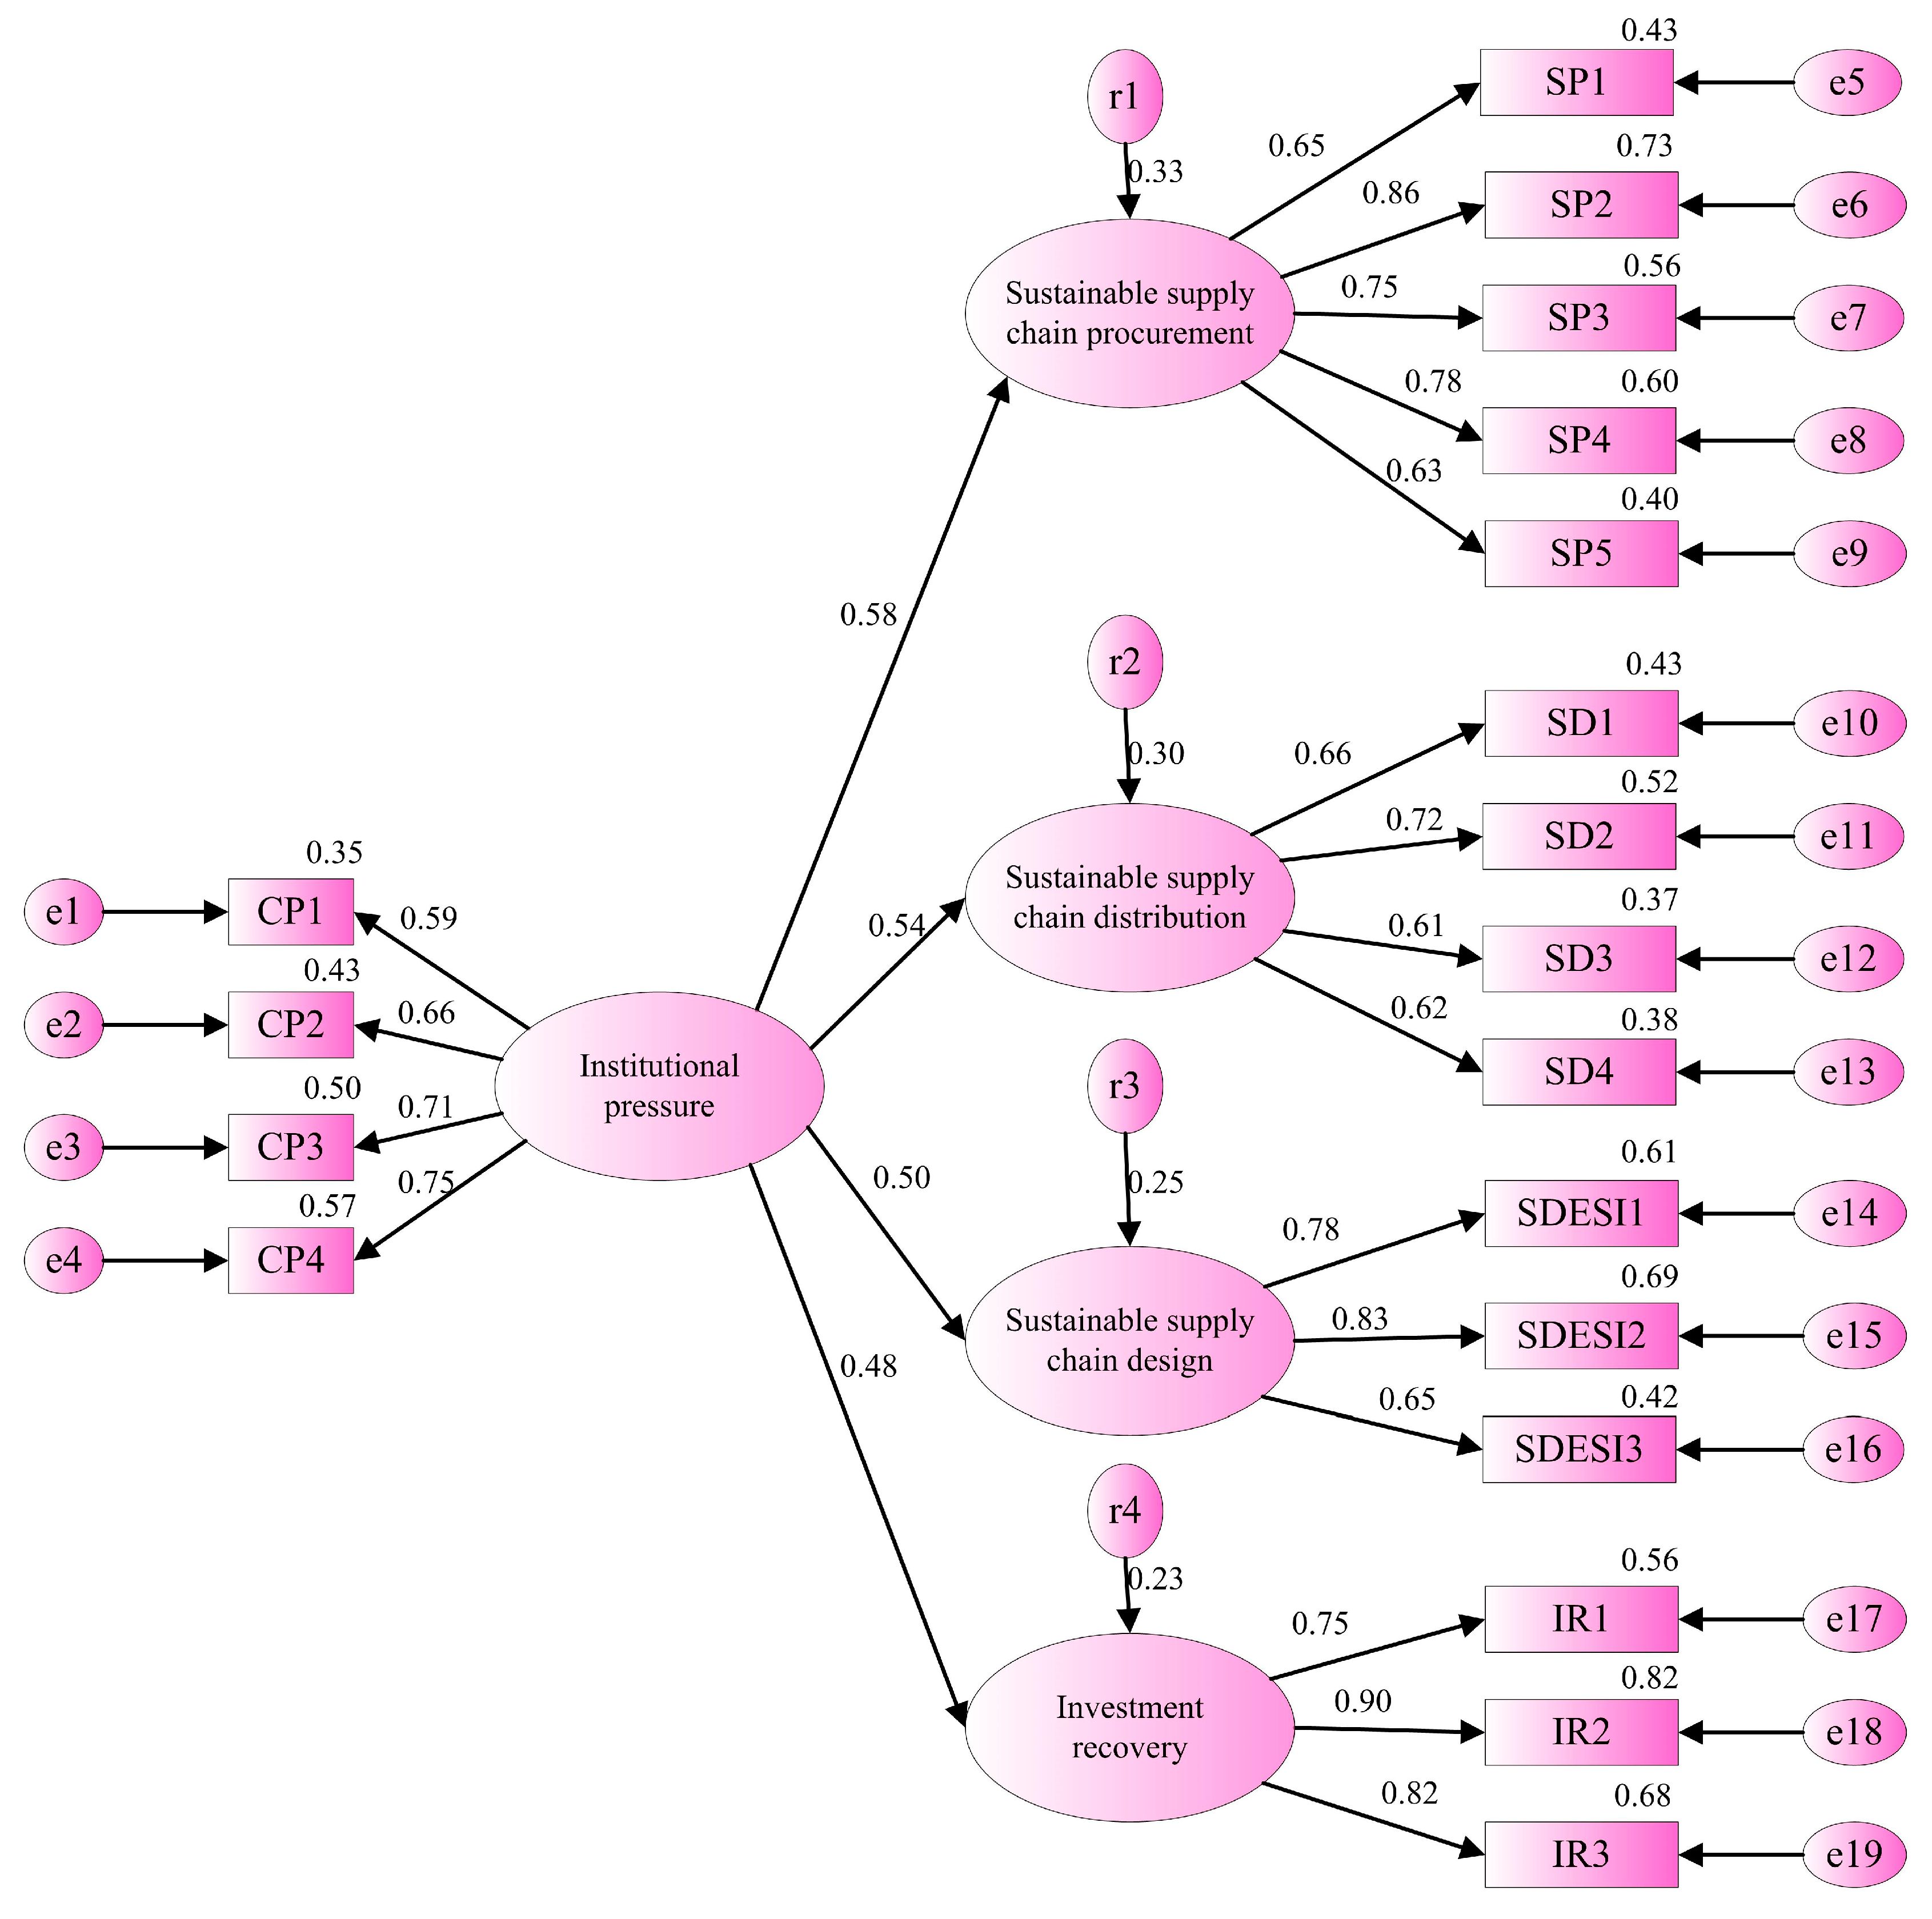
| Sustainable supply chain procurement | <--- | institutional pressure | 0.58 | *** | 5.298 | Yes |
| Sustainable supply chain distribution | <--- | institutional pressure | 0.54 | *** | 4.735 | Yes |
| Sustainable supply chain design | <--- | institutional pressure | 0.50 | *** | 4.800 | Yes |
| Investment recovery | <--- | institutional pressure | 0.48 | *** | 4.813 | Yes |
| Goodness-of-Fit Index | CMIN/DF | GFI | AGFI | NFI | CFI | RMSEA | PGFI |
|---|---|---|---|---|---|---|---|
| Standard value | <3 | >0.8 | >0.8 | >0.8 | >0.8 | <0.08 | >0.5 |
| Statistical value | 2.873 | 0.881 | 0.819 | 0.824 | 0.897 | 0.071 | 0.608 |
| Whether the standards are met or not | Yes | Yes | Yes | Yes | Yes | Yes | Yes |
| Path | Path Coefficient | p-Value | t-Value | Whether Significant or Not (t > 1.96) | ||
|---|---|---|---|---|---|---|
| Environmental performance | <--- | Sustainable supply chain procurement | 0.13 | 0.044 | 1.973 | Yes |
| Social performance | <--- | Sustainable supply chain procurement | 0.01 | 0.866 | 0.169 | No |
| Environmental performance | <--- | sustainable supply chain distribution | 0.16 | 0.041 | 1.981 | Yes |
| Social performance | <--- | sustainable supply chain distribution | 0.42 | *** | 4.094 | Yes |
| Environmental performance | <--- | sustainable supply chain design | 0.23 | 0.012 | 2.506 | Yes |
| Social performance | <--- | sustainable supply chain design | 0.20 | 0.018 | 2.365 | Yes |
| Environmental performance | <--- | investment recovery | 0.54 | *** | 5.233 | Yes |
| Social performance | <--- | investment recovery | 0.42 | *** | 4.771 | Yes |
| Economic performance | <--- | environmental performance | 0.19 | 0.021 | 2.019 | Yes |
| Economic performance | <--- | social performance | 0.51 | *** | 4.934 | Yes |
| Economic performance | <--- | Sustainable supply chain procurement | 0.12 | 0.045 | 1.963 | Yes |
| Economic performance | <--- | sustainable supply chain distribution | 0.11 | 0.188 | 1.316 | No |
| Economic performance | <--- | sustainable supply chain design | 0.16 | 0.029 | 2.178 | Yes |
| Economic performance | <--- | investment recovery | 0.22 | 0.021 | 2.303 | Yes |
| Goodness-of-Fit Index | CMIN/DF | GFI | AGFI | NFI | CFI | RMSEA | PGFI |
|---|---|---|---|---|---|---|---|
| Standard value | <3 | >0.8 | >0.8 | >0.8 | >0.8 | <0.08 | >0.5 |
| Statistical value | 2.856 | 0.879 | 0.808 | 0.845 | 0.817 | 0.073 | 0.557 |
| Whether the standards are met or not | Yes | Yes | Yes | Yes | Yes | Yes | Yes |
| Goodness-of-Fit Index | CMIN/DF | GFI | AGFI | NFI | CFI | RMSEA | PGFI |
|---|---|---|---|---|---|---|---|
| Standard value | <3 | >0.8 | >0.8 | >0.8 | >0.8 | <0.08 | >0.5 |
| Statistical value | 2.723 | 0.881 | 0.811 | 0.847 | 0.816 | 0.073 | 0.558 |
| Whether the standards are met or not | Yes | Yes | Yes | Yes | Yes | Yes | Yes |
| Path | Path Coefficient | p-Value | t-Value | Whether Significant or Not (t > 1.96) | ||
|---|---|---|---|---|---|---|
| Environmental performance | <--- | Sustainable supply chain procurement | 0.12 | 0.048 | 1.971 | Yes |
| Environmental performance | <--- | sustainable supply chain distribution | 0.17 | 0.018 | 2.62 | Yes |
| Social performance | <--- | sustainable supply chain distribution | 0.44 | *** | 4.318 | Yes |
| Environmental performance | <--- | sustainable supply chain design | 0.23 | 0.013 | 2.475 | Yes |
| Social performance | <--- | sustainable supply chain design | 0.19 | 0.023 | 2.281 | Yes |
| Environmental performance | <--- | investment recovery | 0.55 | *** | 5.224 | Yes |
| Social performance | <--- | investment recovery | 0.42 | *** | 4.791 | Yes |
| Economic performance | <--- | environmental performance | 0.21 | 0.032 | 2.149 | Yes |
| Economic performance | <--- | social performance | 0.56 | *** | 6.108 | Yes |
| Economic performance | <--- | Sustainable supply chain procurement | 0.15 | 0.021 | 2.308 | Yes |
| Economic performance | <--- | sustainable supply chain design | 0.18 | 0.013 | 2.471 | Yes |
| Economic performance | <--- | investment recovery | 0.19 | 0.027 | 2.215 | Yes |
| Goodness-of-Fit Index | CMIN/DF | GFI | AGFI | NFI | CFI | RMSEA | PGFI |
|---|---|---|---|---|---|---|---|
| Standard value | <3 | >0.8 | >0.8 | >0.8 | >0.8 | <0.08 | >0.5 |
| Statistical value | 2.593 | 0.894 | 0.847 | 0.850 | 0.829 | 0.064 | 0.560 |
| Whether the standards are met or not | Yes | Yes | Yes | Yes | Yes | Yes | Yes |
| Goodness-of-Fit Index | CMIN/DF | GFI | AGFI | NFI | CFI | RMSEA | PGFI |
|---|---|---|---|---|---|---|---|
| Standard value | <3 | >0.8 | >0.8 | >0.8 | >0.8 | <0.08 | >0.5 |
| Statistical value of original model | 2.856 | 0.879 | 0.808 | 0.845 | 0.817 | 0.073 | 0.557 |
| Statistical value of modified model I | 2.723 | 0.881 | 0.810 | 0.847 | 0.816 | 0.071 | 0.558 |
| Statistical value of modified model II | 2.593 | 0.894 | 0.847 | 0.850 | 0.829 | 0.064 | 0.560 |
| Hypothesis | Testing Status |
|---|---|
| H1a. Institutional pressure has a significantly positive influence on sustainable supply chain procurement. | Support |
| H1b. Institutional pressure has a significantly positive influence on sustainable supply chain distribution. | Support |
| H1c. Institutional pressure has a significantly positive influence on sustainable supply. | Support |
| H1d. Institutional pressure has a significantly positive influence on investment recovery. | Support |
| H2a. Sustainable supply chain procurement has a significantly positive influence on environmental performance. | Support |
| H2b. Sustainable supply chain design has a significantly positive influence on environmental performance. | Support |
| H2c. Sustainable supply chain distribution has a significantly positive influence on environmental performance. | Support |
| H2d. Investment recovery has a significantly positive influence on environmental performance. | Support |
| H3a. Sustainable supply chain procurement has a significantly positive influence on economic performance. | Support |
| H3b. Sustainable supply chain design has a significantly positive influence on economic performance. | Support |
| H3c. Sustainable supply chain distribution has a significantly positive influence on economic performance. | Not support |
| H3d. Investment recovery has a significantly positive influence on economic performance. | Support |
| H4a. Sustainable supply chain procurement has a significantly positive influence on social performance. | Not support |
| H4b. Sustainable supply chain design has a significantly positive influence on social performance. | Support |
| H4c. Sustainable supply chain distribution has a significantly positive influence on social performance. | Support |
| H4d. Investment recovery has a significantly positive influence on social performance. | Support |
| H5. Environmental performance has a significantly positive influence on economic performance. | Support |
| H6. Social performance has a significantly positive influence on economic performance. | Support |
© 2018 by the authors. Licensee MDPI, Basel, Switzerland. This article is an open access article distributed under the terms and conditions of the Creative Commons Attribution (CC BY) license (http://creativecommons.org/licenses/by/4.0/).
Share and Cite
Lu, Y.; Zhao, C.; Xu, L.; Shen, L. Dual Institutional Pressures, Sustainable Supply Chain Practice and Performance Outcome. Sustainability 2018, 10, 3247. https://doi.org/10.3390/su10093247
Lu Y, Zhao C, Xu L, Shen L. Dual Institutional Pressures, Sustainable Supply Chain Practice and Performance Outcome. Sustainability. 2018; 10(9):3247. https://doi.org/10.3390/su10093247
Chicago/Turabian StyleLu, Yali, Chenyang Zhao, Leimeng Xu, and Lei Shen. 2018. "Dual Institutional Pressures, Sustainable Supply Chain Practice and Performance Outcome" Sustainability 10, no. 9: 3247. https://doi.org/10.3390/su10093247