GIS-Based Energy Consumption and Spatial Variation of Protected Grape Cultivation in China

1
College of Information and Electrical Engineering, China Agricultural University, 209# No.17 Qinghuadonglu, Haidian District, Beijing 100083, China
2
The key laboratory of Viticulture and Enology, Ministry of Agriculture, Beijing 100083, China
*
Author to whom correspondence should be addressed.
Sustainability 2018, 10(9), 3248; https://doi.org/10.3390/su10093248
Submission received: 26 July 2018
/
Revised: 17 August 2018
/
Accepted: 4 September 2018
/
Published: 12 September 2018
Abstract
:This paper compares the difference in energy consumption in different sub-patterns and features of energy consumption structures used in protected grape production systems using statistical data. Then, spatial characteristics between different production modes based on geographic information systems are also analyzed. The results reveal that the types of energy consumption include steel, iron wire, water, chemical fertilizer, pesticides, electric power, organic fertilizer, plastic films, and labor. The total energy consumption for protected grape production was 210,534.3 MJ ha−1 in 2011, 211,504.6 MJ ha−1 in 2012, and 222,571.8 MJ ha−1 in 2013. From the perspective of cultivation modes, early ripening production and late ripening production consumed more energy than rain-shelter production; in terms of facility types, the total energy input of both vinyl tunnels and solar greenhouses were always higher than rain-shelter greenhouses. Indirect and non-renewable energy consumption were higher than that of direct and renewable energy, which accounted for 90% of energy consumption. Spatial analysis showed that the values of Moran’s I were all positive for the three years, which means protected grape input had a positive spatial autocorrelation. Therefore, we should adjust the energy input structure and choose more sustainable production modes to improve the sustainability of the production of protected grapes.
1. Introduction
Agricultural production systems are open, thermodynamic, and comprehensive life systems. They are a combination of ecological and economic systems, associated with transmission, transformation, and circulation processes, and flows of material cash and energy. The differences in energy consumption and efficiency of agricultural production are caused by a variety of factors, such as crop growth, soil type, field farming methods, organic manure and fertilizers, plant protection measures, production levels, etc. [1].
Protected grape cultivation provides relatively controllable and suitable temperature, humidity, and other environmental conditions for grape production. With the adoption of modern agricultural engineering technology, protected grape cultivation breaks the seasonal and regional restrictions of grape production and significantly improves the adaptability of grape production. Consequently, protected grape cultivation has been rapidly developing in China. The protected grape production system is a special agricultural system composed of natural and socio-economic production systems. The system maintains itself through exchanging matter and energy with the outside environment, so it has poor self-adjusting ability and feedback mechanisms for maintaining ecological balance—the success of the system strongly depends on human management activities. The system can be divided into three subsystems: biological, environment, and protected structure system. There are relationships between subsystems, such as control, dependency, and feedback as displayed in Figure 1.
According to different classification criteria, protected grape cultivation can be classified into different sub-patterns in China. Table 1 lists the main classifications of protected cultivation and the descriptions. The greenhouse structure, agricultural operations, cost of investment, and energy consumption are different for each sub-pattern, so analysing and comparing the energy consumption of each protected viticulture mode are meaningful for adjusting the energy input structure and optimizing energy consumption. Agricultural production uses large quantities of energy, both directly and indirectly, in the form of machinery, diesel fuels, seeds, fertilizer, manure, chemicals, electricity, and water for irrigation. For protected grapes, the high levels of energy can protect grapes away natural disaster, plant diseases, and insect pests. It is commonly thought that protected agriculture is a highly intensive mode of agricultural production with greater economic benefits, supporting the development of protected grape cultivation by vine growers. However, high output may arise from the considerable consumption of financial resources, manpower, energy, and other resources, which lead to increasing economic and environmental pressure. As the world is facing a resource shortage crisis and energy is becoming increasingly expensive, production processes that consume high levels of energy are obviously not sustainable. As a developing country, per capita resources in China are scarce, and the gap in energy consumption continues to widen [2]. Therefore, in the future, Chinese agricultural production must be sustainable, environmentally friendly, and characterized by high efficiency, resource conservation, energy saving, and low emissions.
Furthermore, China has a vast territory, and there are significant differences in resource availability, production level, and labor quality in each production region. Producers in some regions adopted protected grape cultivation without considering the local or their own situation, which has led to various problems including high investments and lower production efficiency. The low efficiency of energy and resources has caused a serious waste, which is undoubtedly aggravating the environmental cost of production systems, resulting in apparent or potential environmental damage and ecological pollution, finally affecting the sustainable development of production systems. Therefore, efficient utilization of energy is one of the core components of sustainable agricultural production, and the effectiveness of energy utilization is recognized as an important index of production efficiency and environmental impact assessment of the production system. It is therefore urgent and necessary to optimize the energy consumption of protected grape production from the perspective of spatial variation.
In recent years, scholars have conducted many studies on energy consumption in agricultural production. The research object involved planting systems [4,5,6], livestock breeding systems [7,8,9], and aquaculture systems [10,11].
Ozkan et al. analysed the energy use patterns and the cost of production in greenhouse and open-field grape production in Turkey, and found that the production cost of greenhouse production was more profitable than open-field production due to higher prices for greenhouse grapes [12]. Hamedani et al. examined the energy use patterns and the relationship between energy input and yield for grape production in Hamadan Province in Iran and found that direct energy and non-renewable energy use were rather high [13]. Khoshroo et al. found the association of energy efficiency and performance that explained farmers’ specific characteristics [14]. In addition, some researchers studied other protected crops or fields. Salehi et al. examined the energy balance between the input and the output for button mushroom production in the Isfahan province of Iran [15]. Xue et al. researched total energy consumption efficiency in the construction industry in China [16].
Most existing studies focused on the energy consumption of macro-industries, whereas there is a lack of the research on micro-agricultural production systems. As a result, the research on energy consumption by the protected grape production system is lacking, and in these studies, they ignored the energy consumption distinction between different protected cultivation modes and different regions [4,17,18]. Many factors lead to differences in the energy consumption of agricultural production systems. Therefore, it is necessary to study the spatial differences in energy consumption. However, analysis of geographical spatial differences based on production systems is relatively rare. Geographic information system (GIS) tools have a powerful role in spatial analysis. Therefore, based on the analysis of energy consumption, this study explored GIS-based spatial variation in protected grape cultivation.
This paper aimed to investigate energy consumption features of protected grape production; we also focused on the differences in energy consumption and its spatial characteristics between different production modes to improve the level of sustainable development by adjusting energy input structure and choosing more sustainable production modes and production areas.
The rest of the paper is organized as follows: Section 2 outlines protected grape cultivation systems, a spatial variation analysis model, and data collection and analysis. Energy consumption quantity, energy consumption structure, and spatial variation of energy consumption are discussed, taking data from 2011 to 2013 as an example, in Section 3. Conclusions are provided in the last section.
2. Materials and Methods
2.1. Protected Grape Cultivation System Analysis
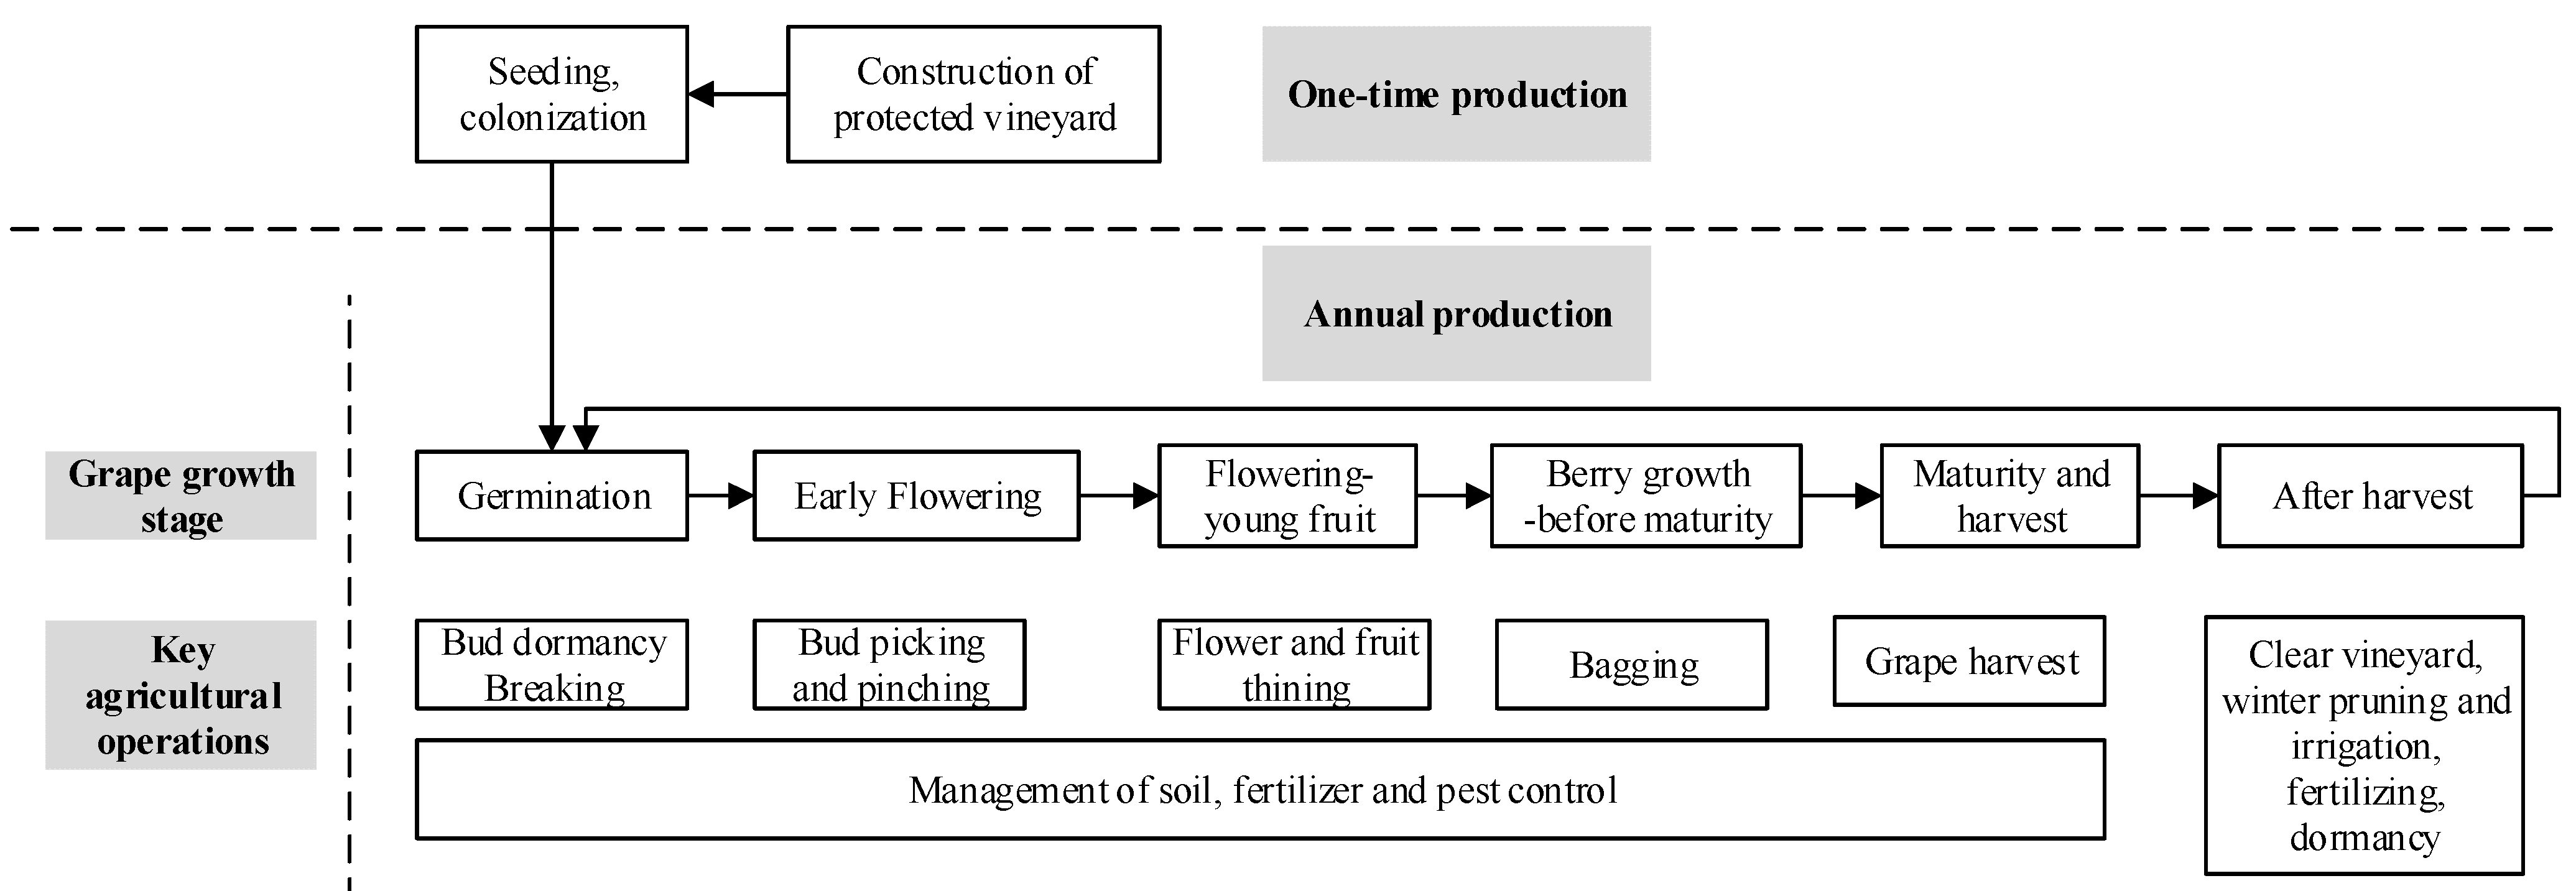
2.1.1. Production Flow
The protected grape cultivation system production process is described in Figure 2 based on field investigations. The first stage is the one-time production process, which involves the construction of a protected vineyard and seeding colonization. It consumes various energies during the one-time fixed-asset investment and should be shared according to the lifetime of the vineyard. The second stage is the annual production process, which involves management techniques and agricultural operations at different stages of grape growth. It requires an abundance of energy consumption [19].
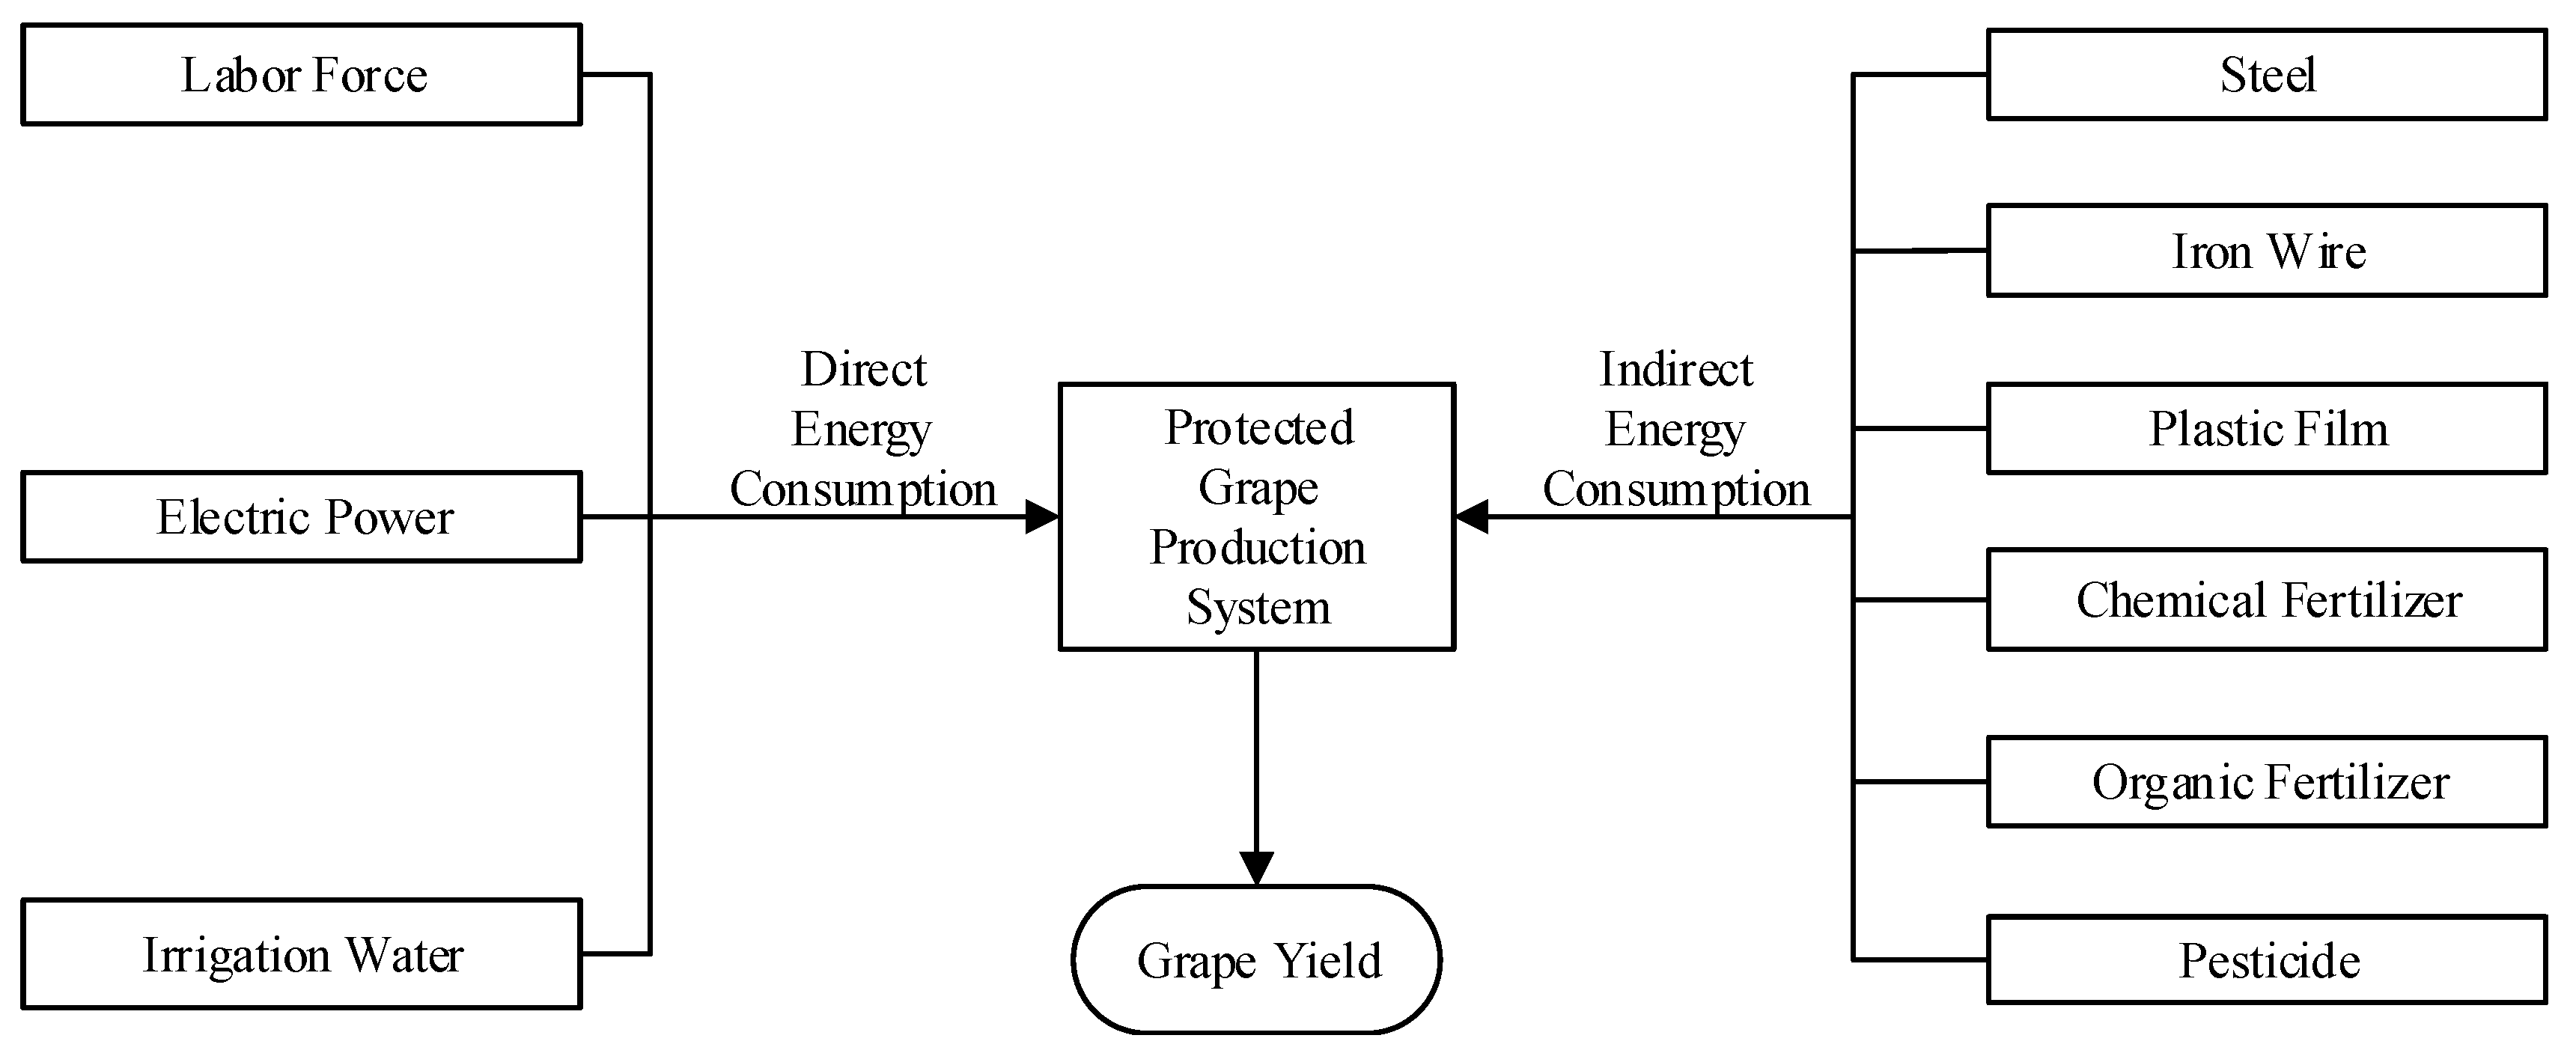
2.1.2. Energy Input and Output Index
For the energy analysis of the protected grape production process, the main items of energy input and output were extracted based on the analysis of the production system and flow.
In general, energy consumption of the system could be divided into two parts: one-time energy consumption when producers build the protected greenhouse, so the energy data should be shared throughout the lifetime of the vineyard; and the energy consumed in the annual process of grape cultivation, and these energies can be multidimensionally classified according to the direct or indirect consumption, renewable or non-renewable energy sources. Accordingly, the energy input and output index are indicated in Figure 3. Some energy items that accounted for an insignificant proportion in the total were omitted to simplify the research.
2.2. Spatial Variation Analysis Model
The spatial variation in energy consumption was evaluated using a spatial autocorrelation model. Spatial autocorrelation is a measure of spatial dependency that quantifies the degree of spatial clustering or dispersion in the values of a variable measured across a set of locations [20,21]. There are two basic models of spatial autocorrelation statistics: the global measures identify whether the values of a variable can exhibit a significant overall pattern of regional clustering, and the local measures identify the location of significant high- and low-value clusters.
In order to determine if the values of a variable possess significant spatial clustering across a set of locations, global Moran’s I can be used to test for significant levels of positive or negative global spatial autocorrelation [22]. The value of Moran’s I ranges from −1 to +1, where a significant negative value indicates that nearby locations tend to have different values (i.e., spatial dispersion), a significant positive value indicates that nearby locations tend to have similar values (i.e., spatial clustering), and an insignificant value (the value is close to 0) indicates that nearby locations tend to have random values. In order to calculate global Moran’s I, the following formula was used:
where n is the number of spatial units; i and j are nearby two units that represent the value of variable in the i-th or j-th unit, respectively; is the mean of variable x; and wij is an element of a matrix of spatial weights [23].
Correspondingly, the local Moran’s I was calculated by the following formula:
where Zi and Zj are deviations between the observed and the mean of xi and xj, , ; wij is the spatial weight matrix after row normalization.
When , it indicates that a high value area is surrounded by high values (H-H), or a low value area is surrounded by low values (L-L). When , a low value area is surrounded by high values (L-H), or a high value area is surrounded by low values (H-L). Detailed meanings can be described as follows:
H-H: The values of the area itself and the surrounding area are relatively high, and the positive spatial difference is smaller.
L-H: The area itself is relatively low, but the value of the surrounding area is generally higher, and the positive spatial difference is greater.
L-L: The value of the area itself and the value of the surrounding area are relatively low, and there is also little spatial difference.
H-L: The value of the area itself is relatively high, while the value of the surrounding area is relatively low, so there is a large degree of spatial variation between them.
2.3. Data Collection and Analysis
2.3.1. Data Collection
The data were collected through the vine grower’s production logs, which were designed based on our literature review, expert interviews, and a field survey. The production logs cover four aspects of information:
- (1)
- The basic information of the vineyard including the vineyard location, the year of vineyard construction, the energy consumption for constructing the vineyard, etc.
- (2)
- Production information including the grape varieties, the specific sub-pattern of protected cultivation.
- (3)
- Energy input information in grape cultivation including the detailed type and quantity information of each type of energy consumption during the period of protected grape growth.
- (4)
- Energy output information including the output of protected grape production, which only refers the grape in this research.
With the support of the Chinese Agricultural Research System (CARS-9), which is a nationwide research team focused on the grape and wine industry, 21 main protected grape production provinces in five major production regions in North China, Northeast China, South China, Southwest China, and Northwest China were identified. Then, 25 vineyards in each province were randomly selected as the samples. At the beginning of each production season, printed and bound production logs (questions in the production log meant to obtain the information about energy input and output in grape production, so the questions were the detailed descriptions of four aspects information in production log) were distributed to the vineyard owners. The producers filled out the information according to their production practices throughout the season. Finally, they delivered the production logs to the researchers at the end of each production season. The survey began in 2011 and lasted for 3 years. In the meantime, the researchers conducted field surveys periodically to ensure that the information was filled in truthfully and in a timely manner.
2.3.2. Data Processing and Analysis
Due to some producers not completing the production records as required, fewer final questionnaires were received than expected. In 2011, 212 production records were collected, 277 in 2012, and 257 in 2013. After screening and deleting questionnaires for which the key items were incomplete or logic errors existed between the data, the number valid records was 183 in 2011, 273 in 2013, and 218 in 2013, and the valid rates for the three years were 86.23, 98.55, and 84.8%, respectively.
The energy consumption data relevant to the vineyard construction were shared by the expectant lifetime of the vineyard. The original energy input data was obtained from the production logs, then the raw data were converted into the energy data through energy equivalent according to the equation as follows [5,24,25]:
where EC is the specific energy consumption in the production of protected grapes in unit area, PC is the quantity of energy input and output indicators in the process of protected grape production, and EE is the energy coefficient of each index.
EC = PC × EE
In data processing, energy consumption in the vineyards was calculated as energy input and output per hectare, and the value of each energy indicator was expressed by the average. In order to highlight the differences in energy consumption of different cultivation modes, a comparative study was conducted. Every sampled vineyard was classified into different sub-patterns, and all data in the same sub-pattern group were averaged to represent the energy consumption of this sub-pattern cultivation.
The basic data processing and analysis were implemented in Microsoft Excel 2010. ArcGIS 10.0 (Environmental Systems Research Institute, Inc., RedLands, CA, USA) was adopted to evaluate the spatial variation of energy consumption.
3. Results and Discussion
3.1. General Situation of Energy Consumption
The energy consumed by protected grape cultivation is displayed in Table 2. The energy consumption was similar in the three years; and the energy input is obviously greater than the energy output. The energy input in 2013 increased by 12,037.5 MJ ha−1 compared to 2011. Overall, the energy input presented a slow ascending trend. However, from the perspective of energy output, the highest occurred in 2012, and the energy output did not show a regular trend. It can be seen that the standard deviations of energy inputs and outputs were huge, which indicates that the energy consumption in the sampled vineyards varied considerably, so the energy data were discrete.
It is worth noting that the difference between total output and total input was large, and the total output was much smaller than the total input. The comparison of energy input and output from the perspectives of different countries and different fruits is shown in Table 3. There were obvious differences between previous findings and those of this study. The reason for this may lie in two aspects. Different energy input indexes were used: this study accounted for the energy consumption of vineyard construction in the energy input index whereas other studies did not, which may have resulted in the significant increase in energy input. The other reason is the differences in cultural practices in different countries. For example, many Chinese vineyard owners nowadays reduce the grape output to ensure the grape quality, which leads to the decrease in energy output in China.
3.2. Energy Consumption Structure
3.2.1. General Energy Items Structure
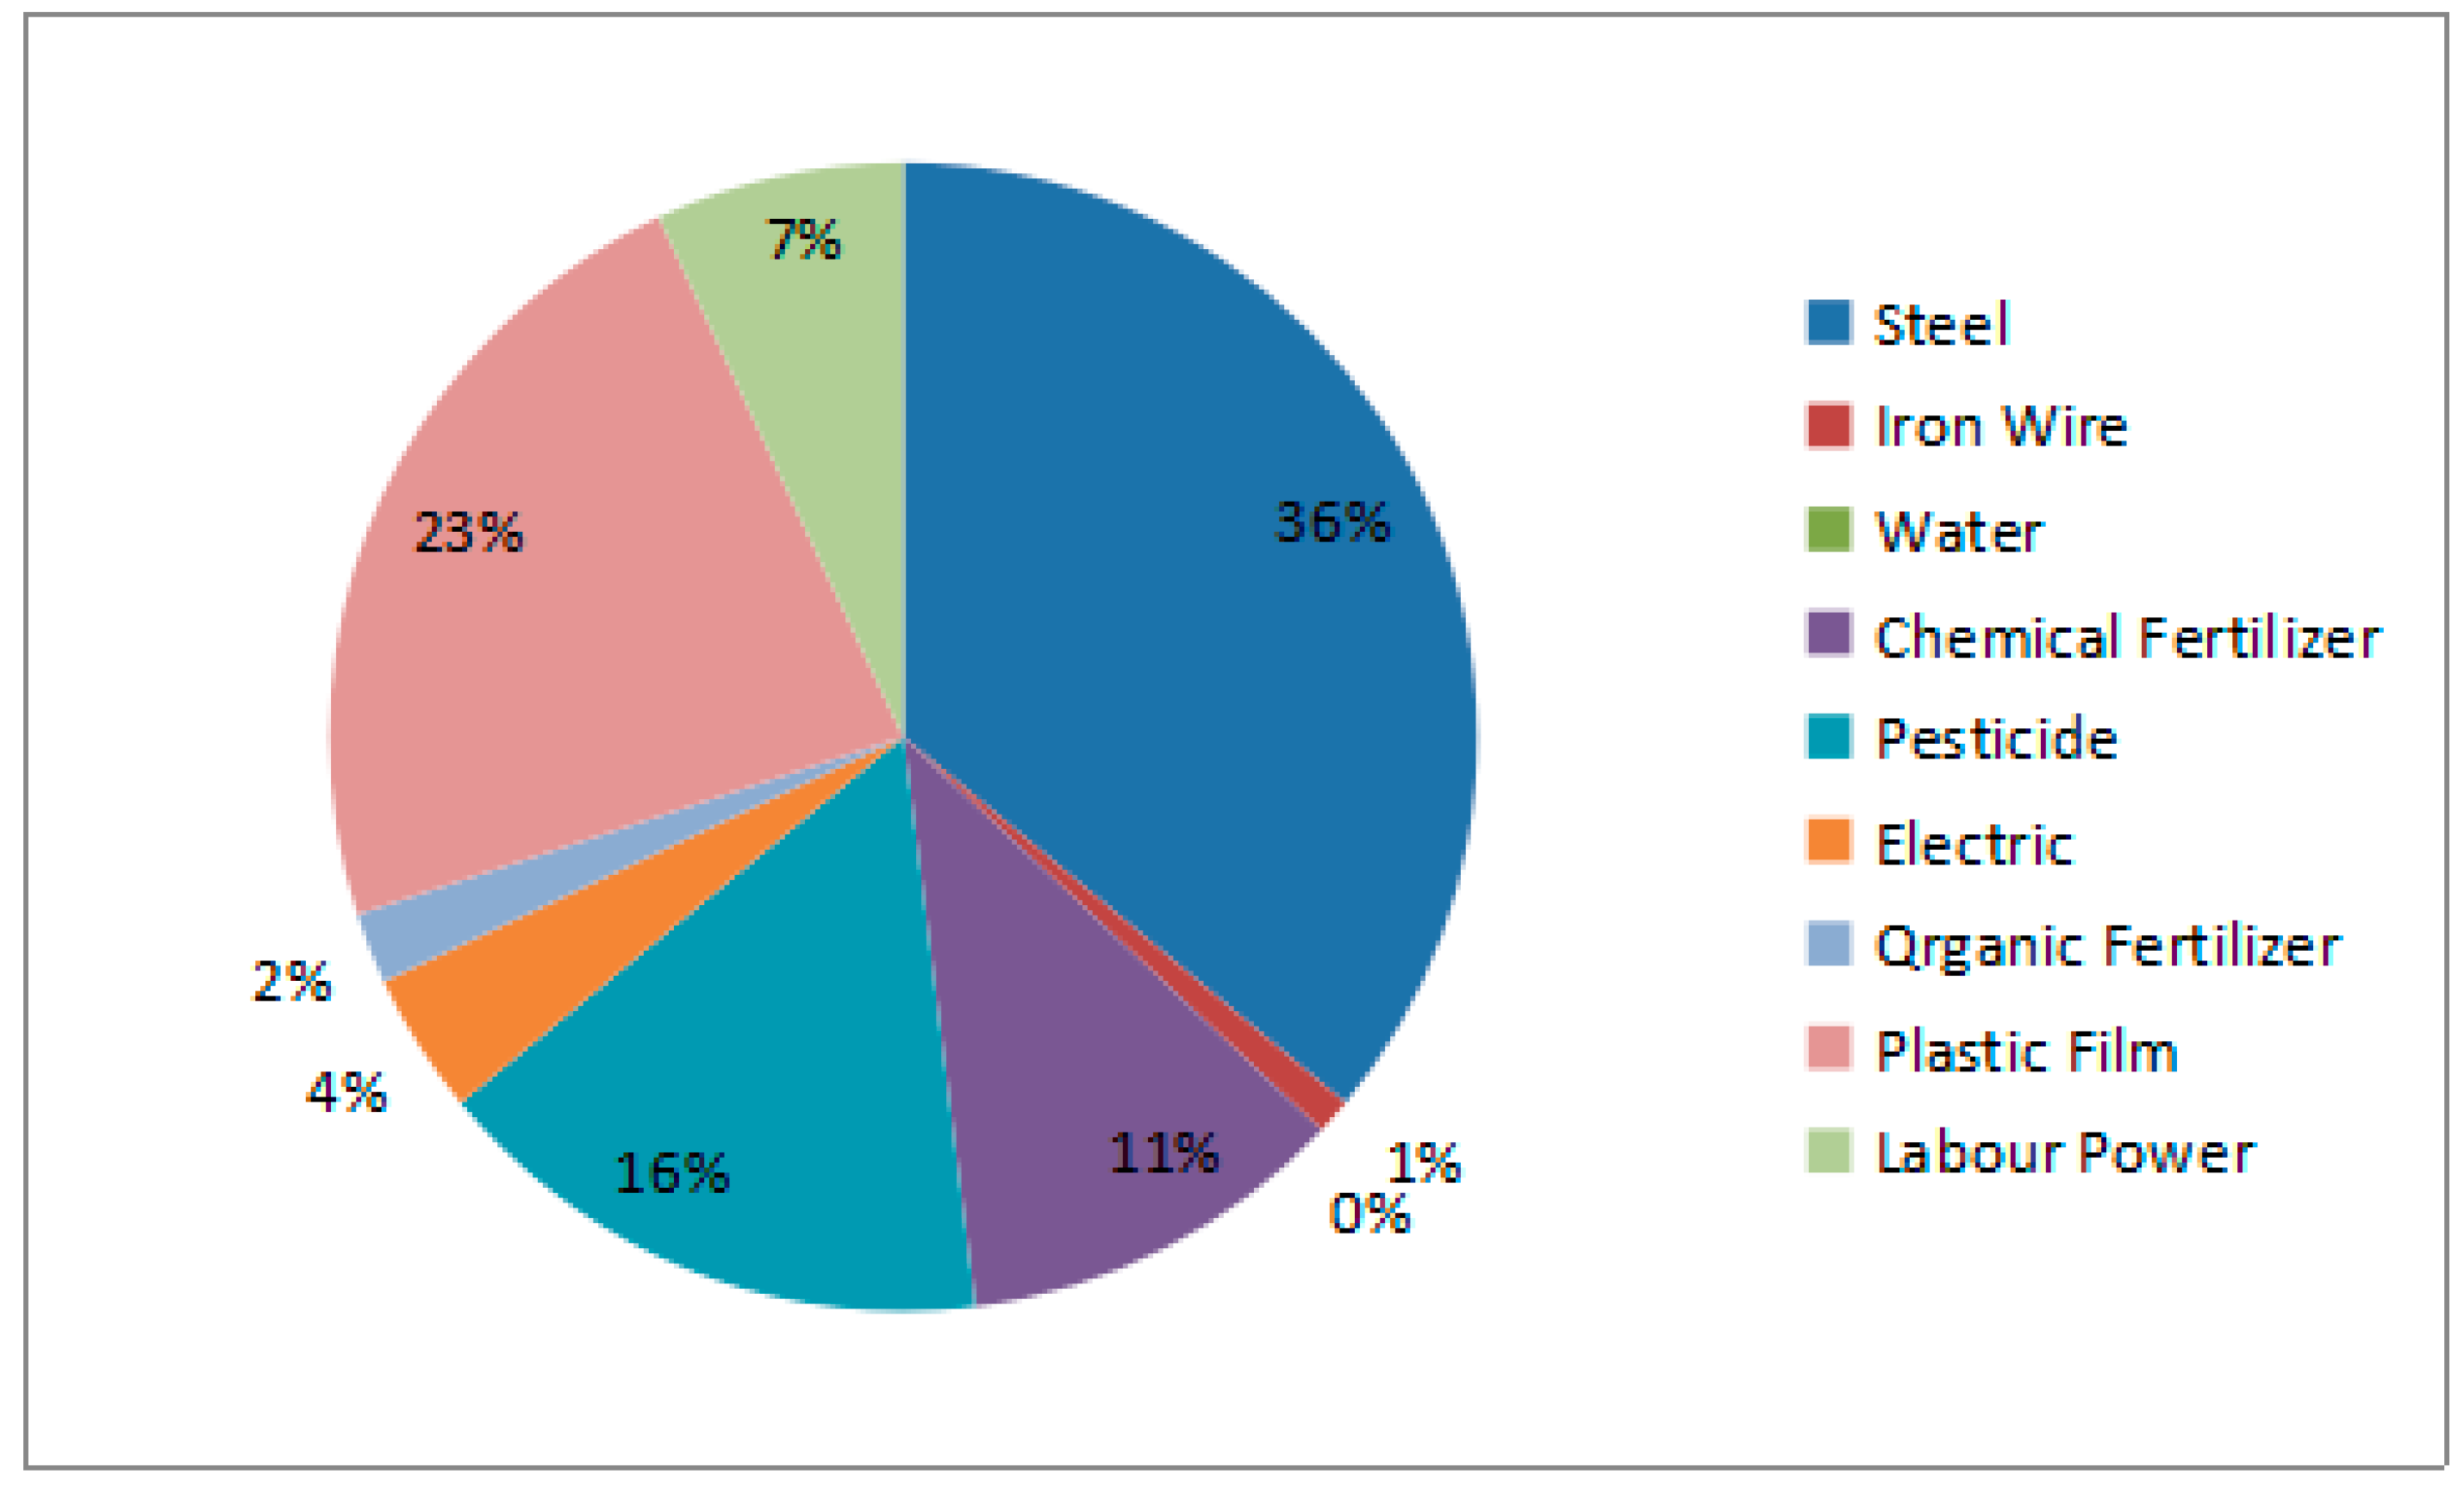
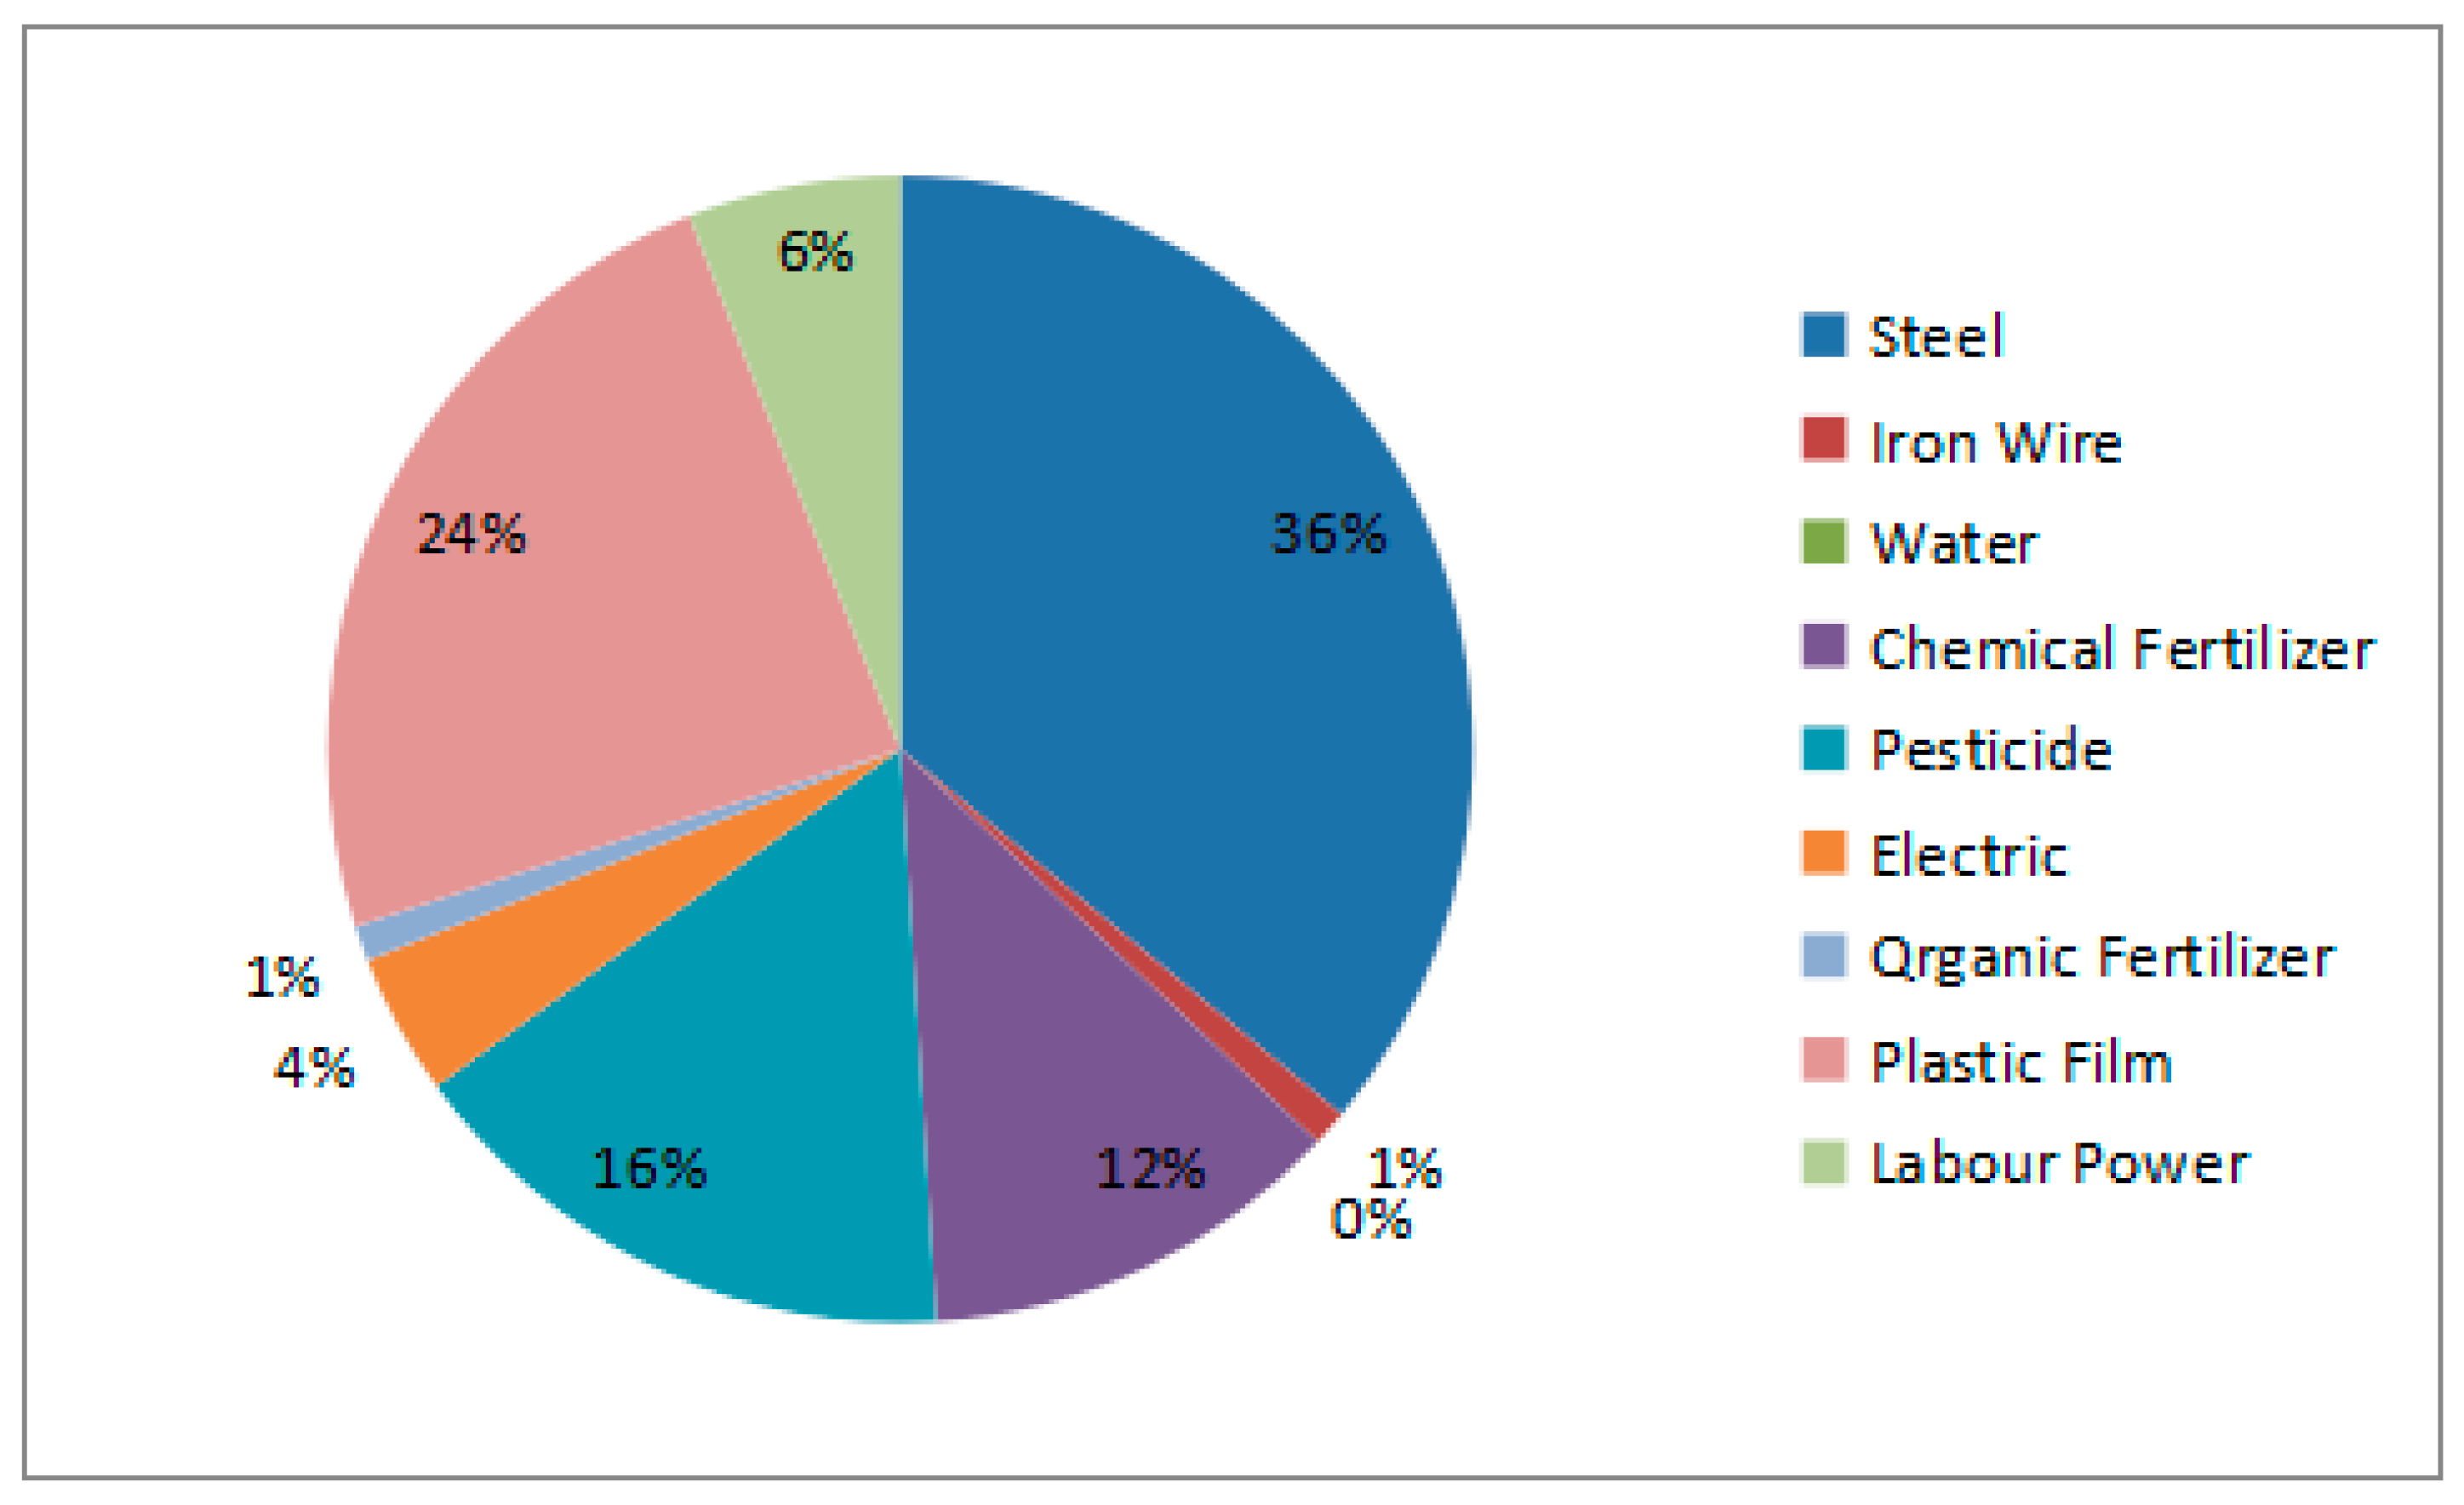
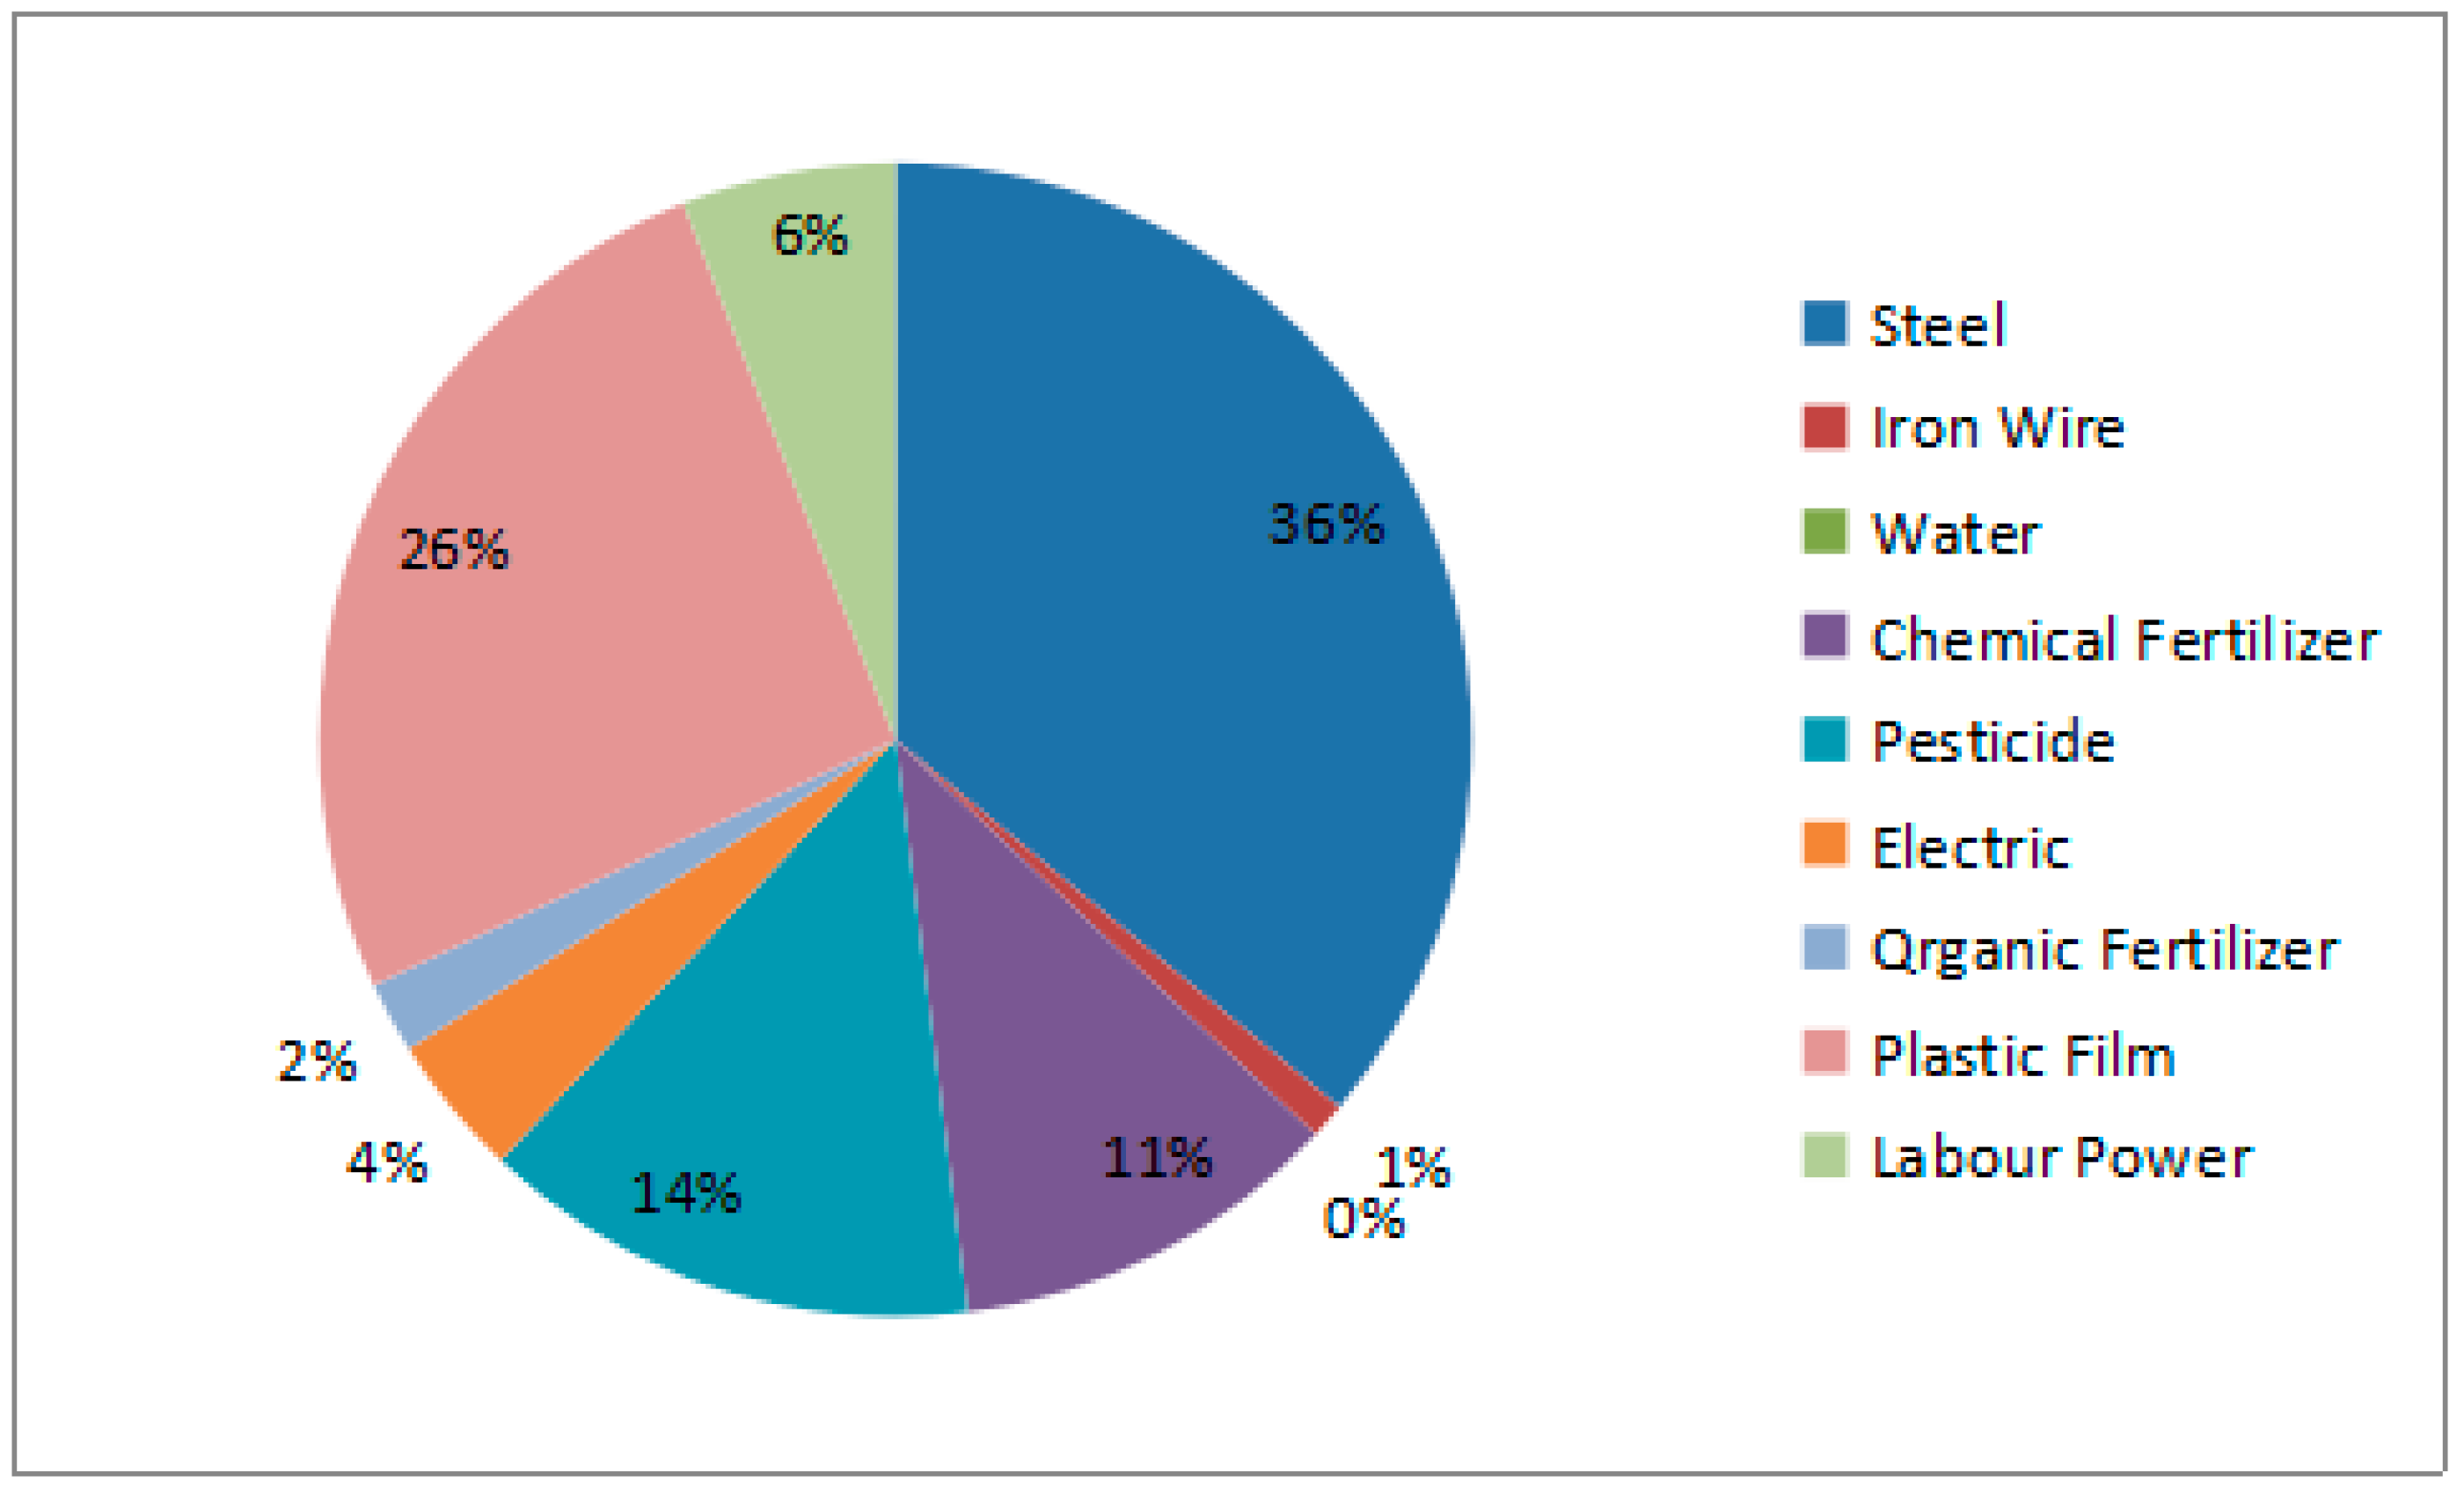
Comparing energy input data from the three years in Figure 4, Figure 5 and Figure 6, we found that energy inputs had a similar structure in 2011, 2012, and 2013. Steel consumed the most energy, which accounted for 36% of the total energy input in the three years. Plastic film consumed the second highest amount of energy, with rising shares of 23%, 24%, and 26% in 2011, 2012, and 2013, respectively. On the contrary, pesticide energy consumption decreased from 16% in 2011 to 14% in 2013. The reason could be connected with the higher attention to food safety and environmental protection, and biological measures being used to control diseases and pests. The changes were not so obvious in terms of fertilizer and labor power inputs. The shares were quite stable at 12% and 6%, respectively. However, the absolute quantity of chemical fertilizer decreased during the three years. In addition, organic fertilizer, irrigation water, electricity, and iron wire shared a low proportion of total energy consumption in the production process.
In conclusion, energy input was similar and stable in the three years, and we found that the energy items that cause heavy environmental pollution, such as pesticides and fertilizers, were decreasing in use. The analysis showed that protected grape cultivation was developing toward green ecological agriculture in China.
3.2.2. Classification Structure
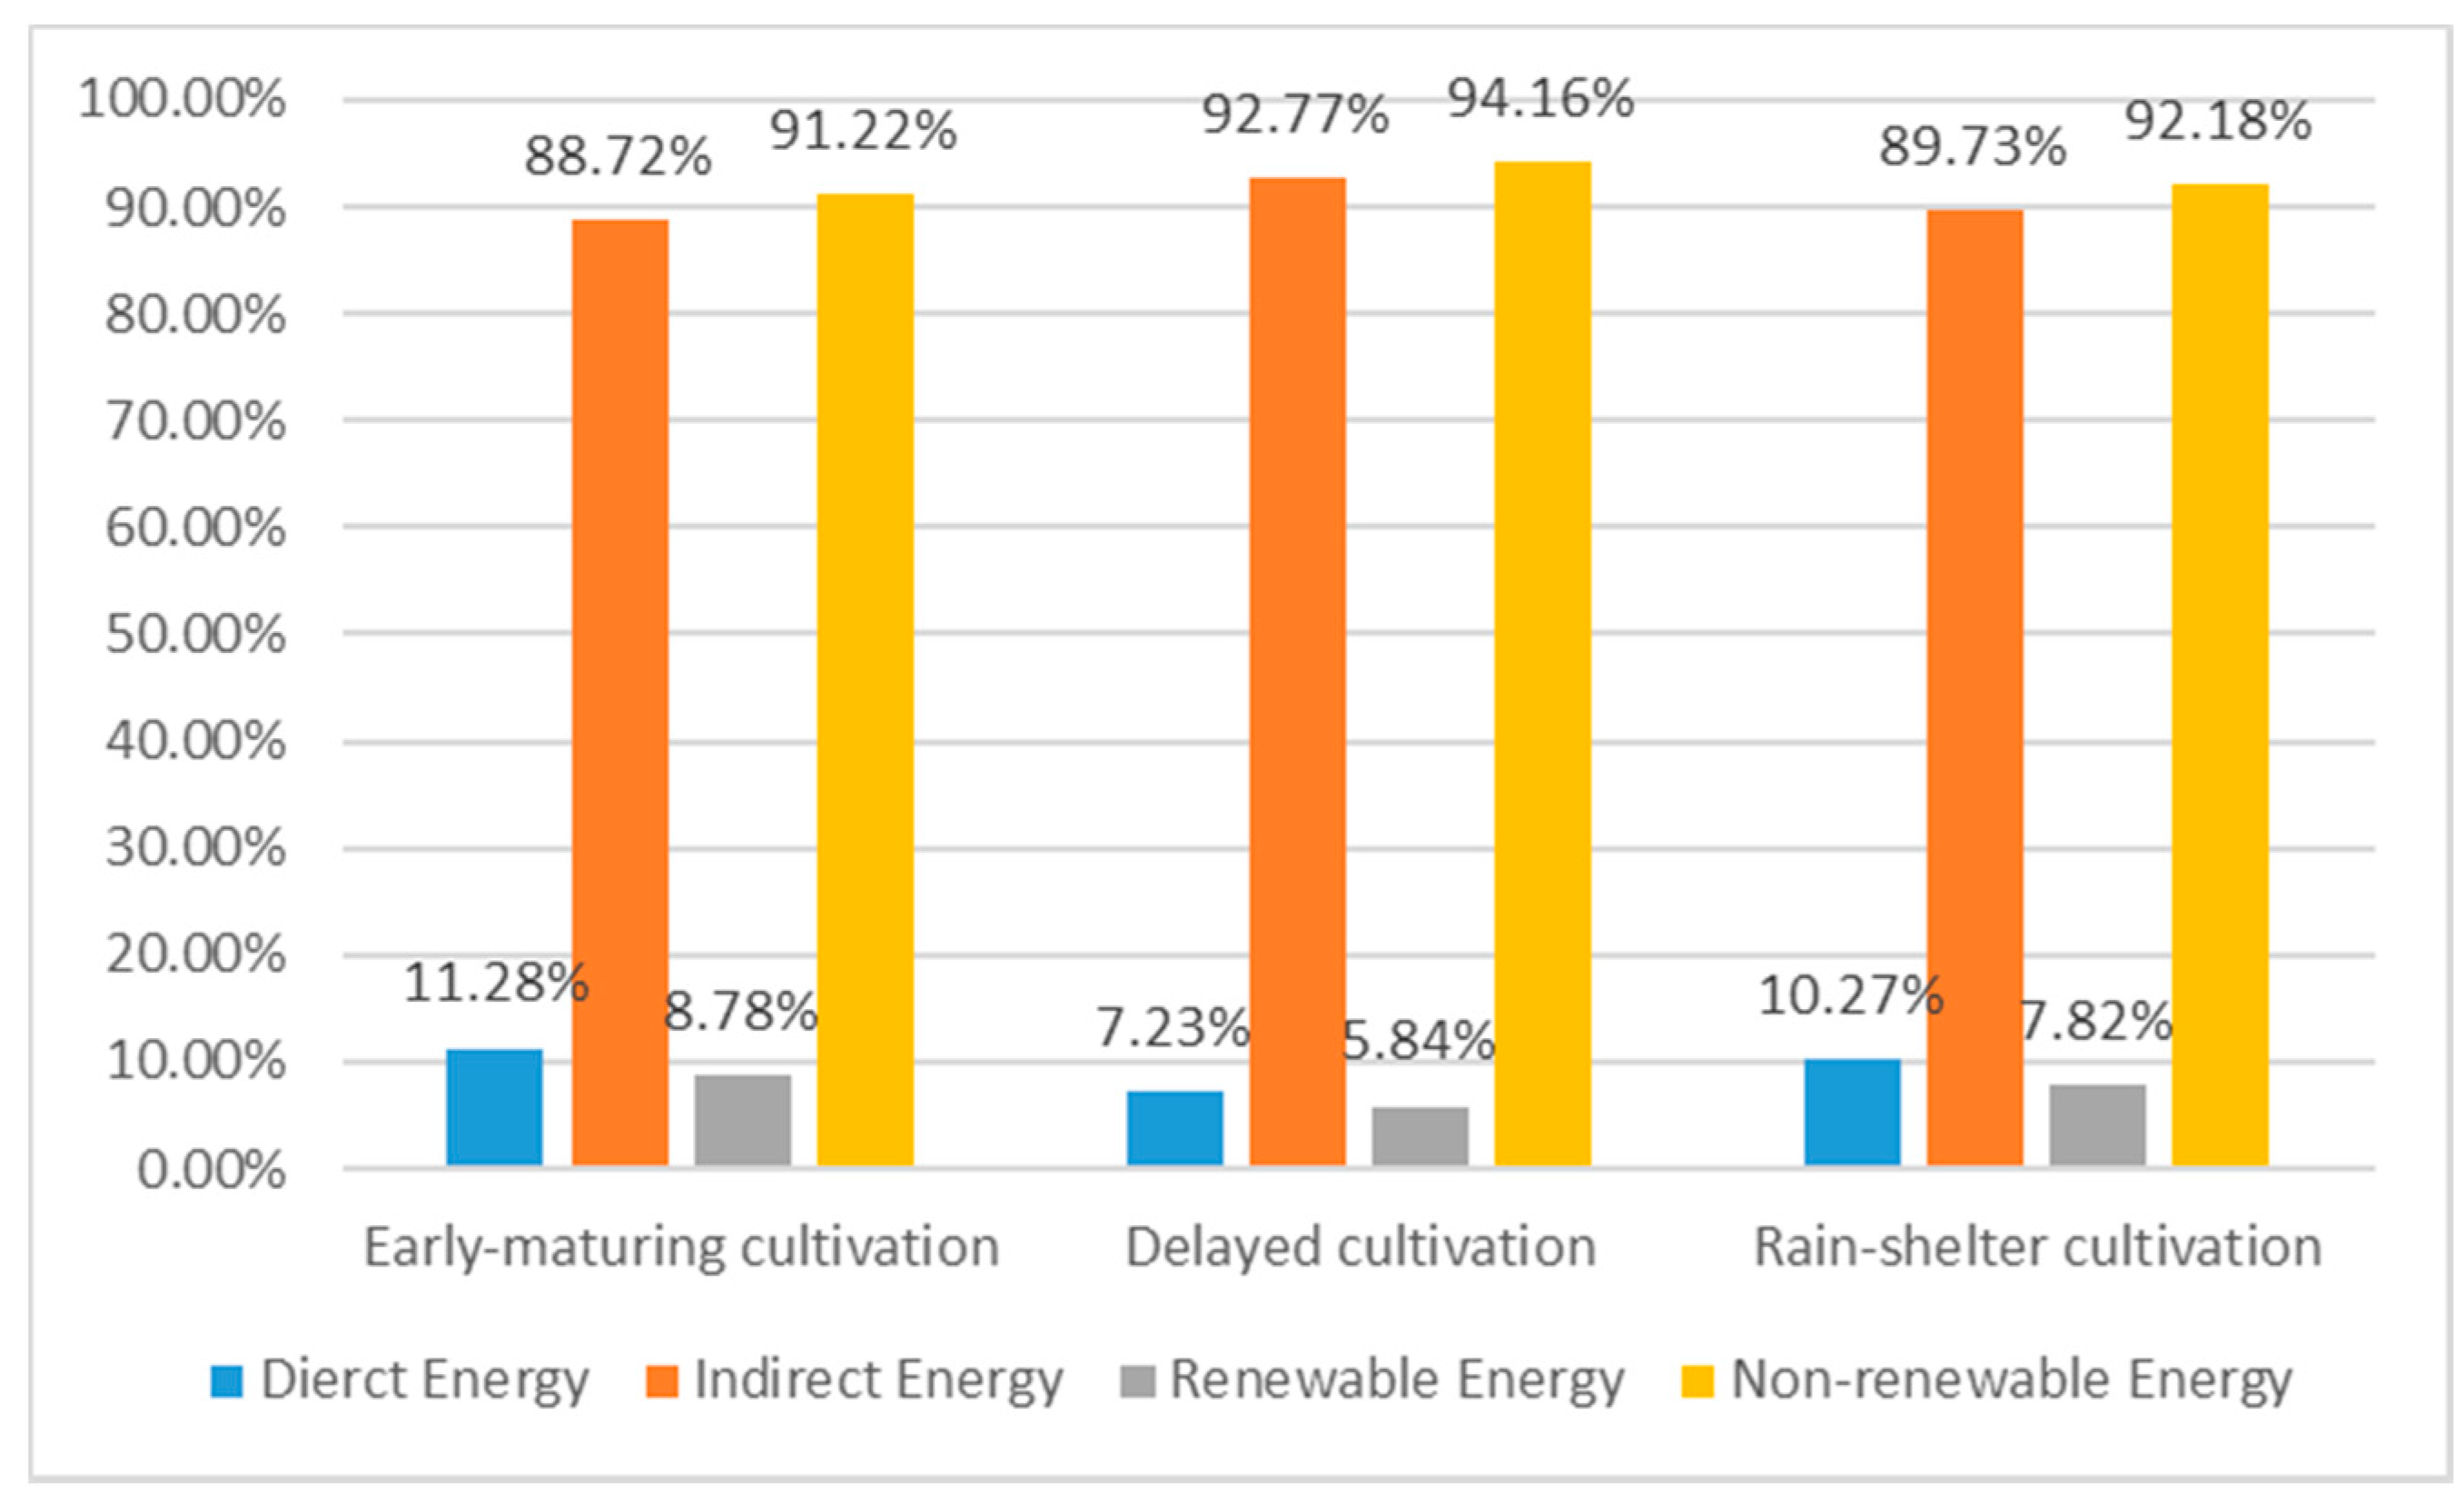
The energy consumption in protected grape cultivation can be classified in two ways: direct energy and indirect energy (Figure 3) and renewable energy and non-renewable energy [32,33,34]. Figure 7 displays the results of energy structure by classification.
The protected grape cultivation system consumed about 10% direct energy and nearly 90% indirect energy, about 8% renewable energy and 92% non-renewable energy. We concluded that the protected grape production system depends more heavily on indirect and non-renewable energy. The changes were not obvious in the three years.
Similar results of energy consumption structure were found in different sub-patterns of protected production (Figure 8 and Figure 9).
Our findings revealed that the energy structure in protected vineyards is not reasonable or sustainable in terms of the ecological effect, so more measures should be taken to reduce the proportion of indirect and non-renewable energy consumed. For example, the greenhouse structure consumes more steel and polyethylene film, which are indirect and non-renewable energy sources, the application and consumption of steel products should be reduced and bamboo should be substituted for steel products, as operational improvements. Developing a complex agricultural system including plants and livestock, and improving the energy utilization efficiency may be another solution [35].
3.3. Difference of Energy Consumption in Different Sub-Patterns of Protected Grape Cultivation
3.3.1. Differences in Early Ripening, Late Ripening, and Rain-Shelter Production Systems
The analysis in Table 4 shows that the total energy input of early ripening production and late ripening production were higher than the rain-shelter production system. However, there was no considerable difference among the three kinds of protected grape cultivation systems. The reason why the total energy consumption of early ripening production and late ripening production was higher than that of the rain-shelter production system is that early ripening production and late ripening production mainly use solar greenhouses and vinyl tunnel constructions, which consume more energy in the form of steel, whereas the greenhouse for the rain-shelter production system is much simpler and consumes less energy.
Variance was calculated based on the average of each type of energy consumption to reflect the difference in energy consumption between different cultivation models. The variance analysis results for the different cultivation functions over the three years showed that the variance in steel and plastic film were both less than 0.05, which means there were significant differences between at least two of the three production systems in the consumption of steel and plastic film in 2011, 2012, and 2013. In fact, the differences were mainly distributed between early ripening production and rain-shelter production. Additionally, the consumption of organic fertilizer was also different in 2012 and 2013, due to the early ripening production and others.
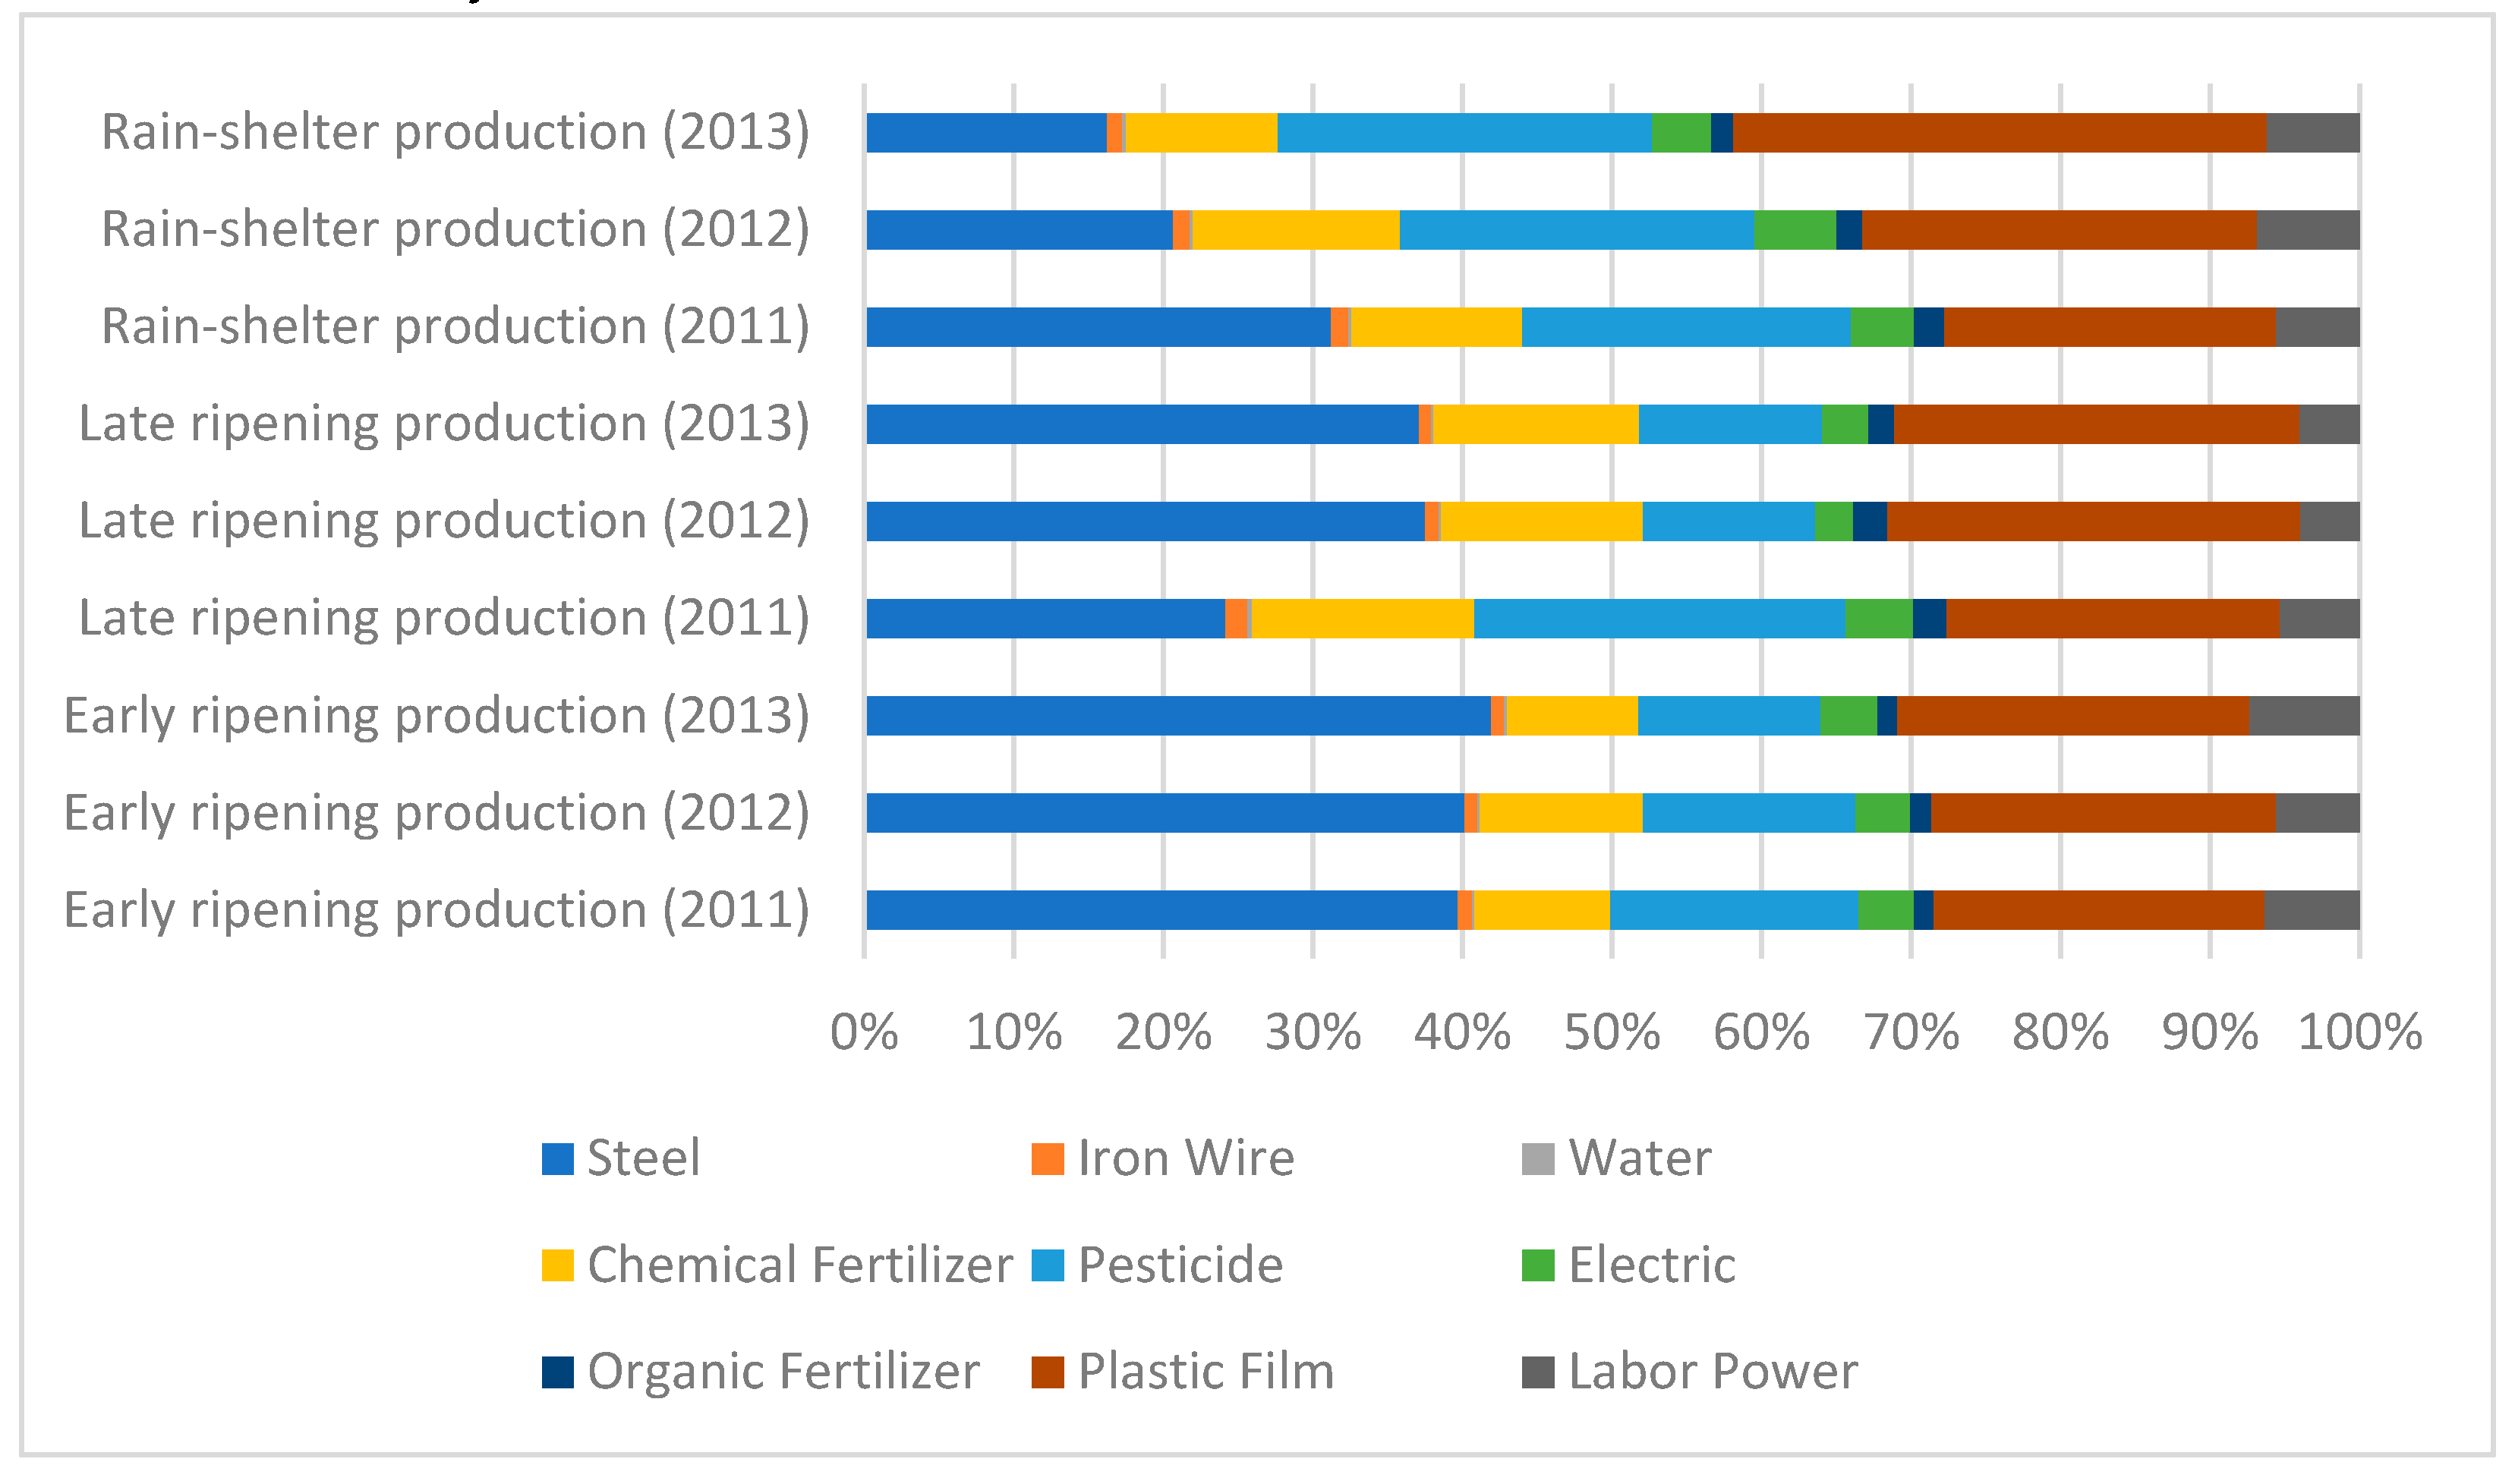
Figure 10 shows the item structure of energy consumption in different cultivation systems over three years. The results show that early ripening production most-needed steel, followed by the late ripening production system. Late ripening production had the largest iron wire consumption. The rain-shelter production system is widespread in Southern China with higher annual precipitation rate, which caused the water demand in this system to be lower than in early ripening production and late ripening production systems in other regions. Early ripening production and late ripening production systems had similar consumption of electric power, but higher than the rain-shelter production system. The rain-shelter production system applied more pesticides in comparison to the other two cultivation systems.
Figure 10 also shows the differences among the three years. Lower variability in various energy input items was observed in the early ripening production system. Major changes were observed in steel, chemical fertilizer, and pesticides. In recent years, producers have paid more attention to the sustainable development of agriculture and environmental protection, so many producers are attempting to protect the environmental via healthy and sustainable production. Therefore, the energy input in the form of pesticide and chemical fertilizer was decreasing.
It was obvious that energy input structure during late ripening production changed over the three years. The biggest changes observed were steel, pesticide, and plastic film; steel and plastic film input increased and pesticide input decreased.
The rain-shelter production system recorded significant changes in steel, pesticide, and plastic film. Pesticide quantity declined similarly as in other protected grape cultivation modes.
3.3.2. Differences in Vinyl Tunnel, Solar, and Rain-Shelter Cultivations
The analysis in Table 5 shows that the total energy input for vinyl tunnels was higher than solar greenhouses and rain-shelter greenhouses. There was an obvious difference among the three kinds of protected grape cultivation systems. Variance analysis results for different cultivation structures over the three years showed that the variance of steel was less than 0.05, which means there are significant differences between at least two of three production systems in the consumption of steel in 2011, 2012, and 2013. The consumption of steel in rain-shelter houses was obviously less than that of vinyl tunnels and solar greenhouses, since the structure of the rain-shelter greenhouse is simpler. Additionally, the consumption of pesticides was also obviously different in 2011 and 2013. In short, the differences in energy consumption were closely related to the cultivation structure.
Figure 11 depicts the differences between energy consumption of vinyl tunnel, solar greenhouse, and rain-shelter greenhouse structural systems.
In the case of steel, the energy inputs of vinyl tunnel and solar greenhouse cultivation were higher than that of rain-shelter greenhouses. Another obvious difference in the energy input index was observed in terms of plastic film. Rain-shelter greenhouses had somewhat higher plastic film consumption than vinyl tunnel and solar greenhouse cultivation.
Rain-shelter greenhouses are mainly suitable for shelter cultivation, and its characteristics had similar trends with the change in energy input structure in the rain-shelter cultivation model. Electric power, irrigation water, labor, and organic fertilizer did not reveal obvious changes. Steel and plastic film inputs increased, and conversely, the utilization of fertilizer and pesticide constantly decreased.
The energy input for vinyl tunnel and solar greenhouse structures have many common points. The highest energy input items were steel and plastic film, and the lower-input items were iron wire, water, electricity, and organic fertilizer. Energy input decreased significantly in chemical fertilizer and pesticide. From an environmental protection and sustainability perspective, the reduction in energy input helps mitigate the environmental problems, which promotes the sustainable development of the protected grape industry in China.
3.4. Spatial Variation of Energy Consumption
3.4.1. Spatial Distribution Characteristics of Energy Consumption
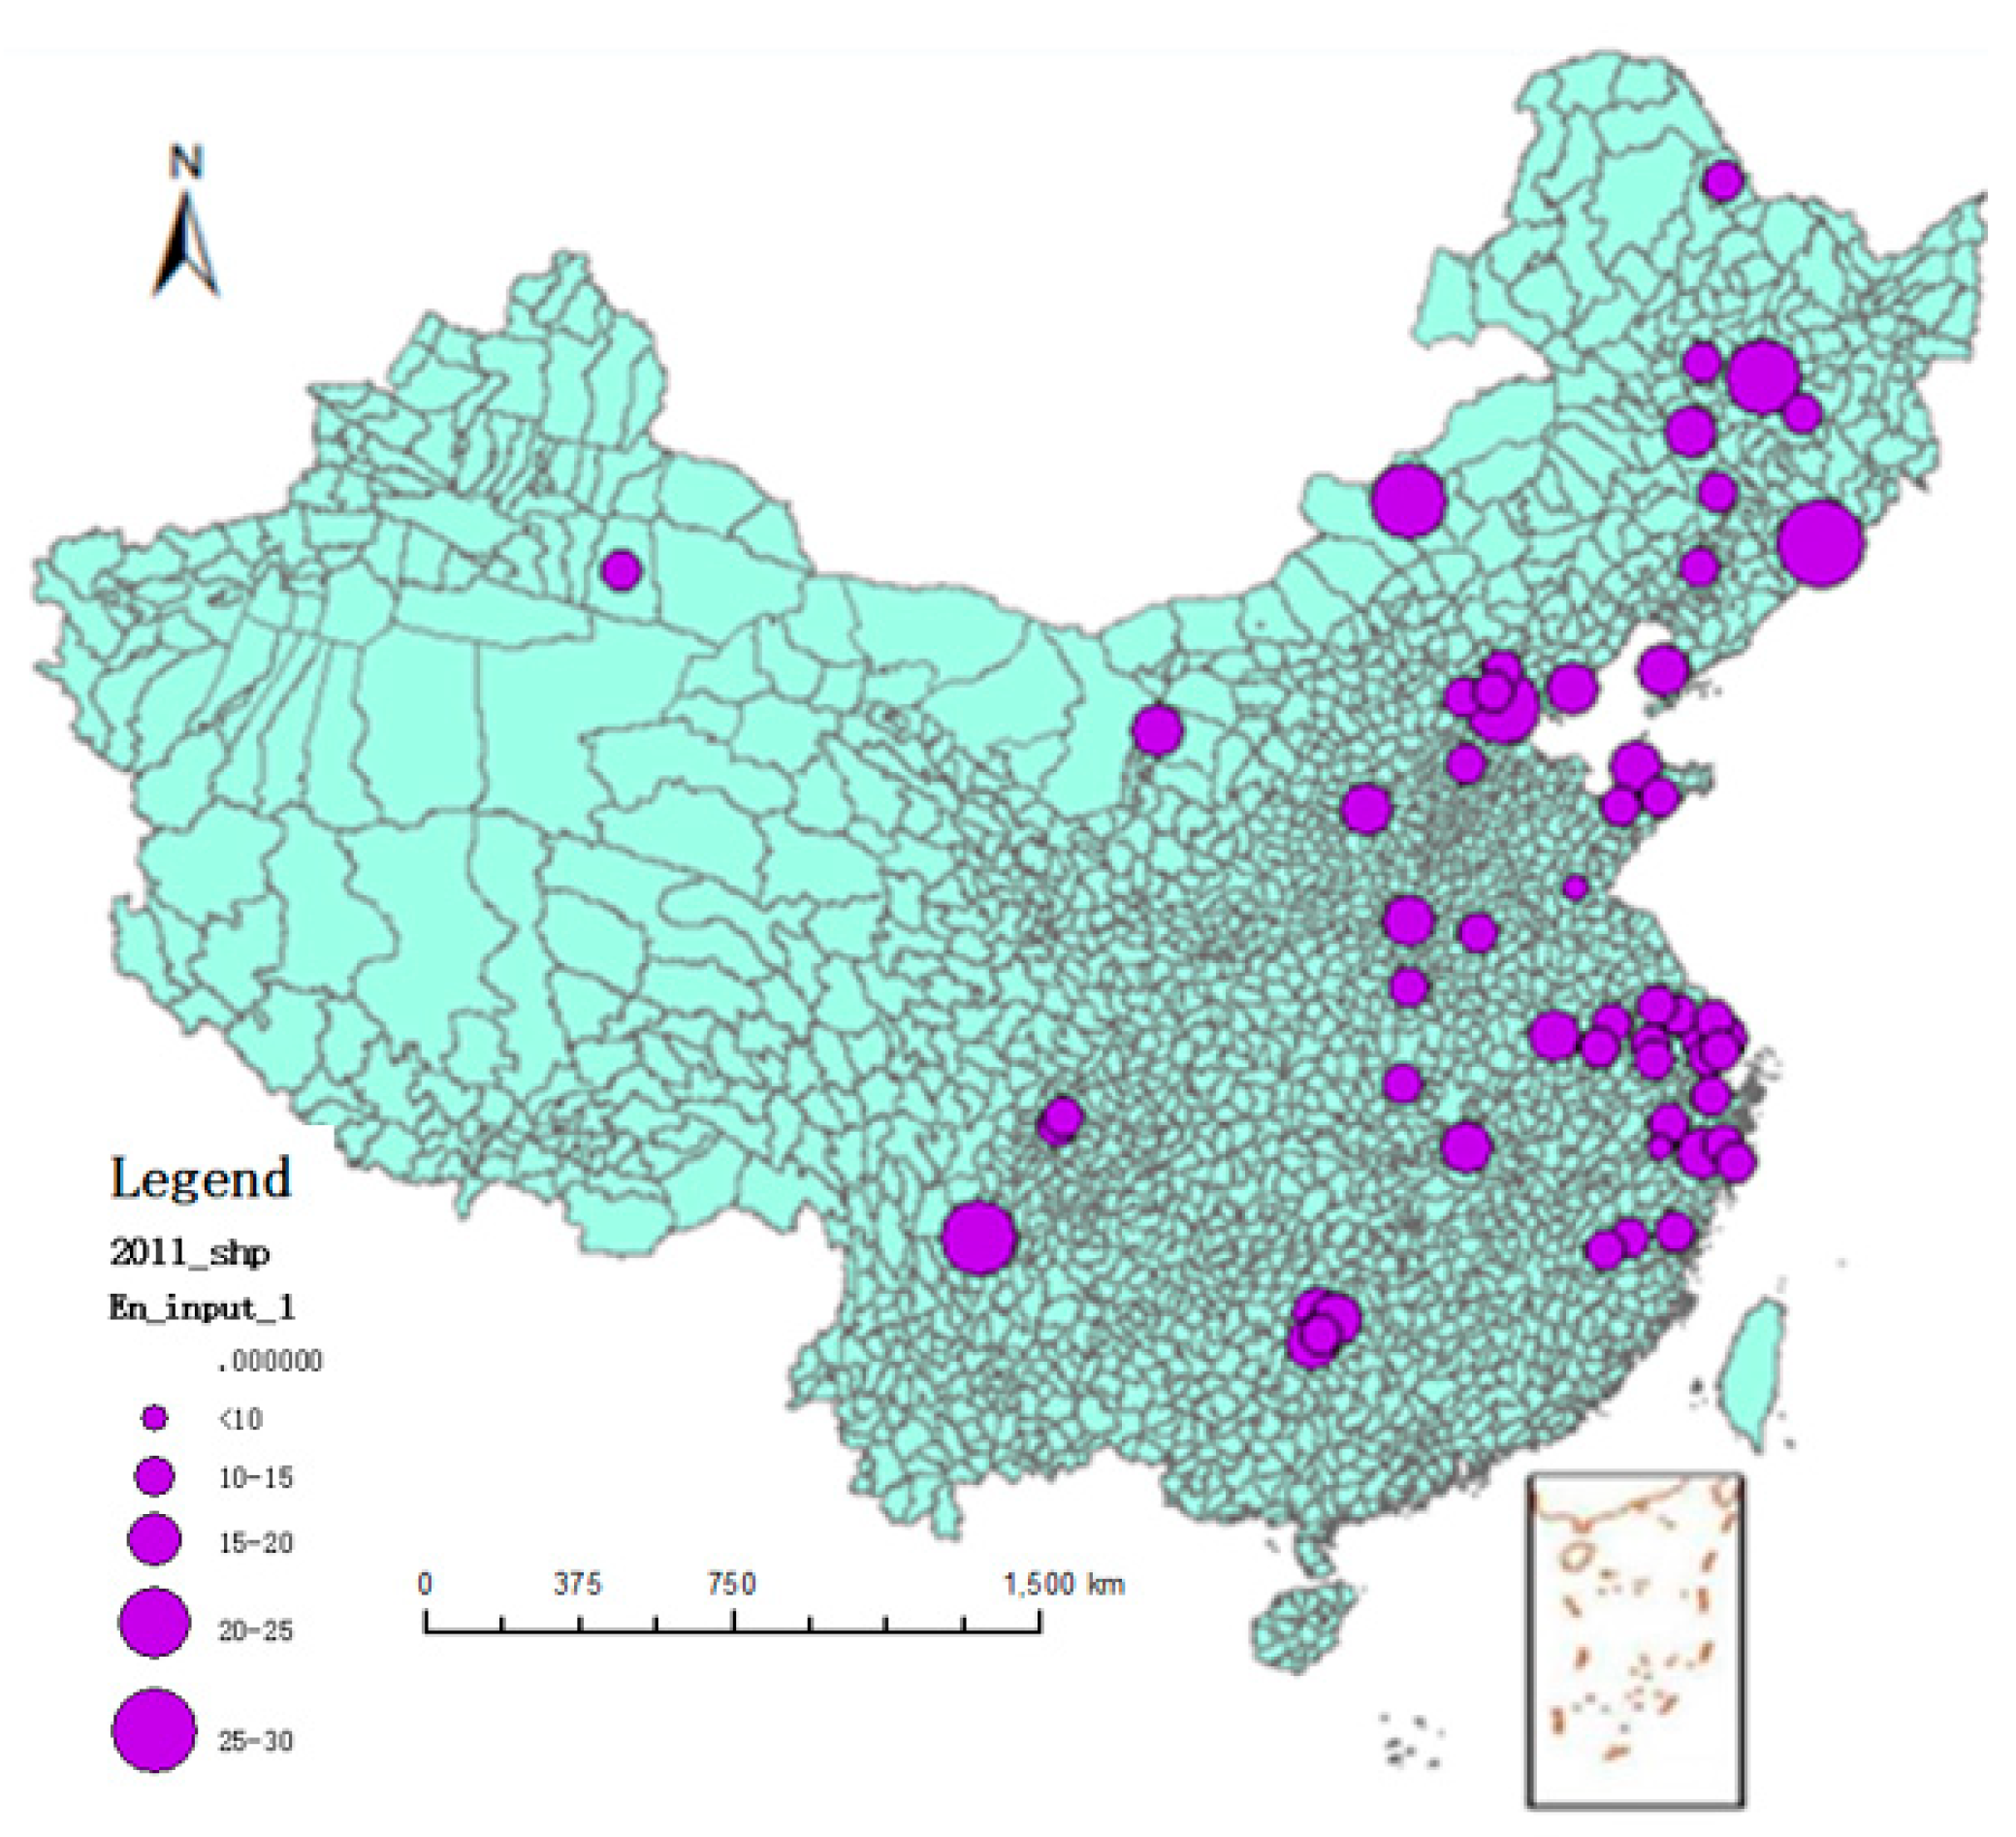
In the spatial analysis, each county was treated as the assessment unit, and the data for vineyards in the same county were averaged to represent the energy consumption level of protected grape cultivation in this county. The spatial distribution of energy consumption, which sampled protected cultivation vineyards during 2011–2013, are shown in Figure 12, Figure 13 and Figure 14, respectively.
Comparing spatial maps, the regional distribution characteristics of energy consumption were found. Generally, energy input in North China was higher than in South China, and energy input in Northeast China was higher than other regions. For example, energy input in Liaoning Province and Jilin Province was obviously high, whereas Jiangsu Province and Hubei Province were relatively low.
3.4.2. Global Spatial Correlation Analysis of Energy Consumption
The global spatial correlation analysis conducted through ArcGIS 10.0 is displayed in Table 6.
Except the energy input in 2011, the p values were less than 1%, which shows that the probability of random distribution of energy inputs and outputs is very low, so the energy consumption in protected grape cultivation is spatially correlated. The values of Moran’s I were all positive, indicating that the energy consumption is characteristically positively spatially autocorrelated. The Z-value and Moran’s I index both show that similar samples were spatially clustered.
The main reason for this phenomenon may be that the natural and socio-economic factors in geographically adjacent regions tend to be similar, so the vine growers are inclined to adopt the same or similar production modes and agricultural practices, which results in a similar energy consumption situation.
3.4.3. Local Spatial Autocorrelation Analysis of Energy Consumption
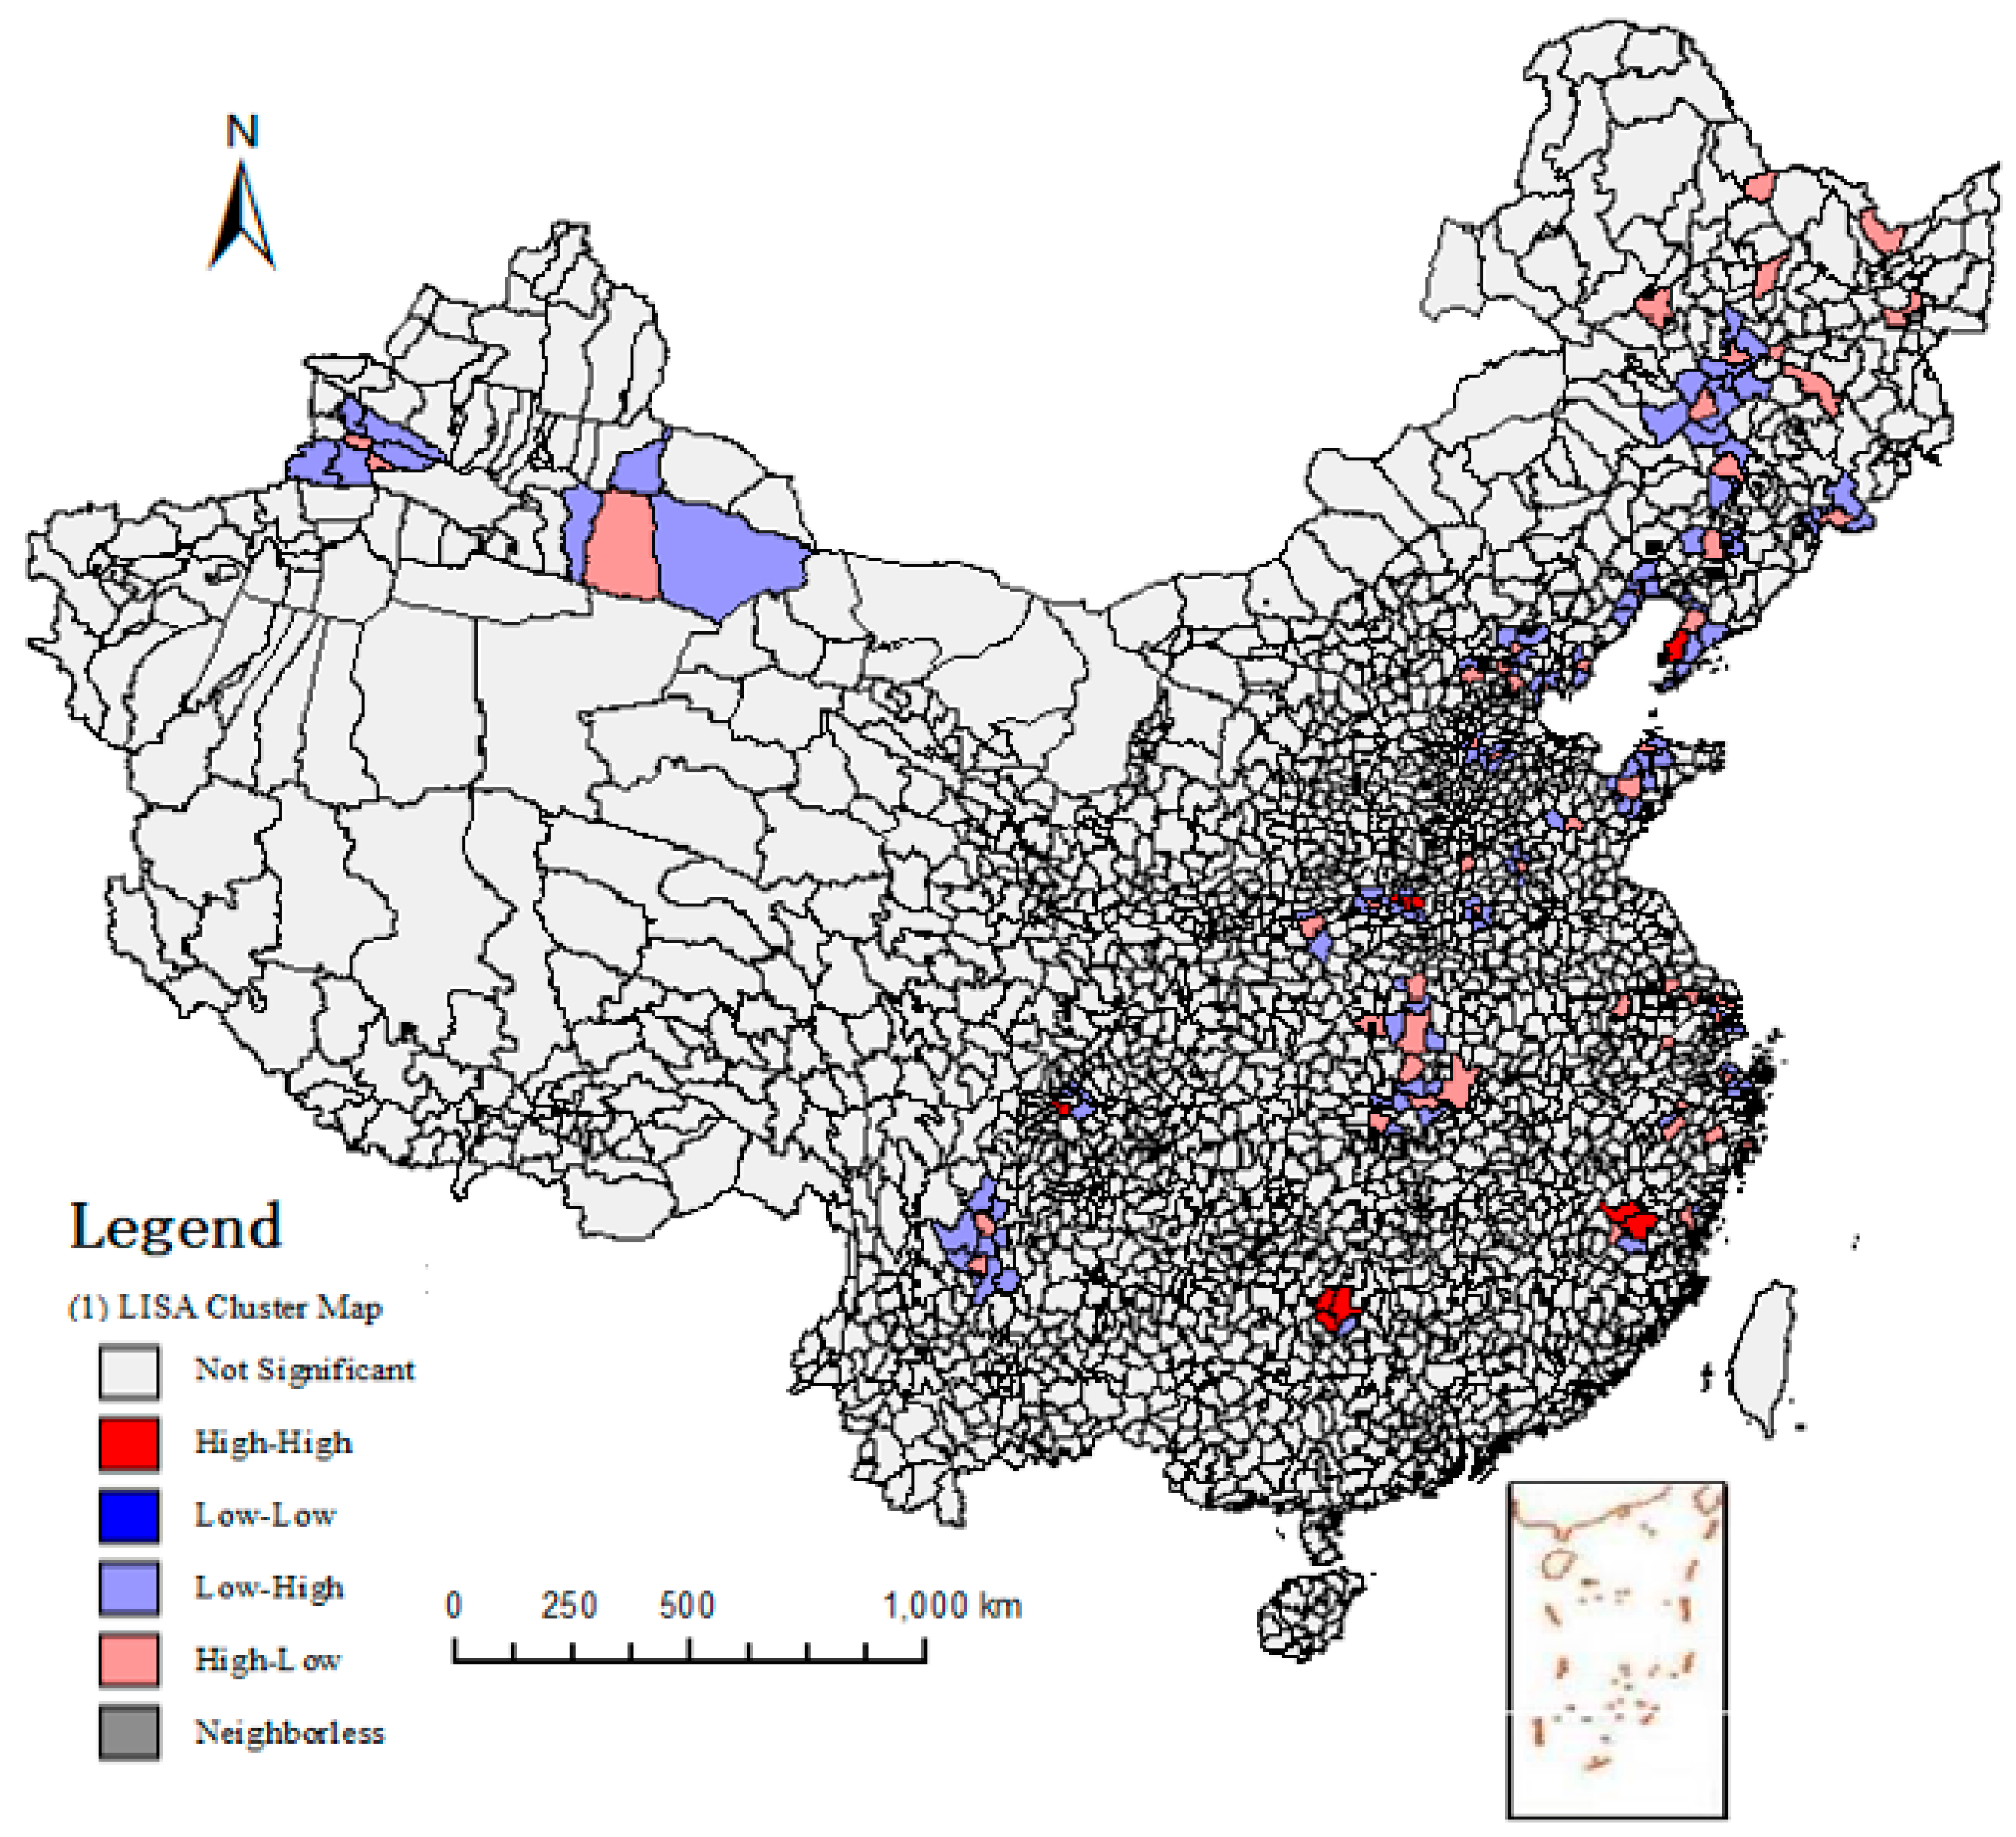
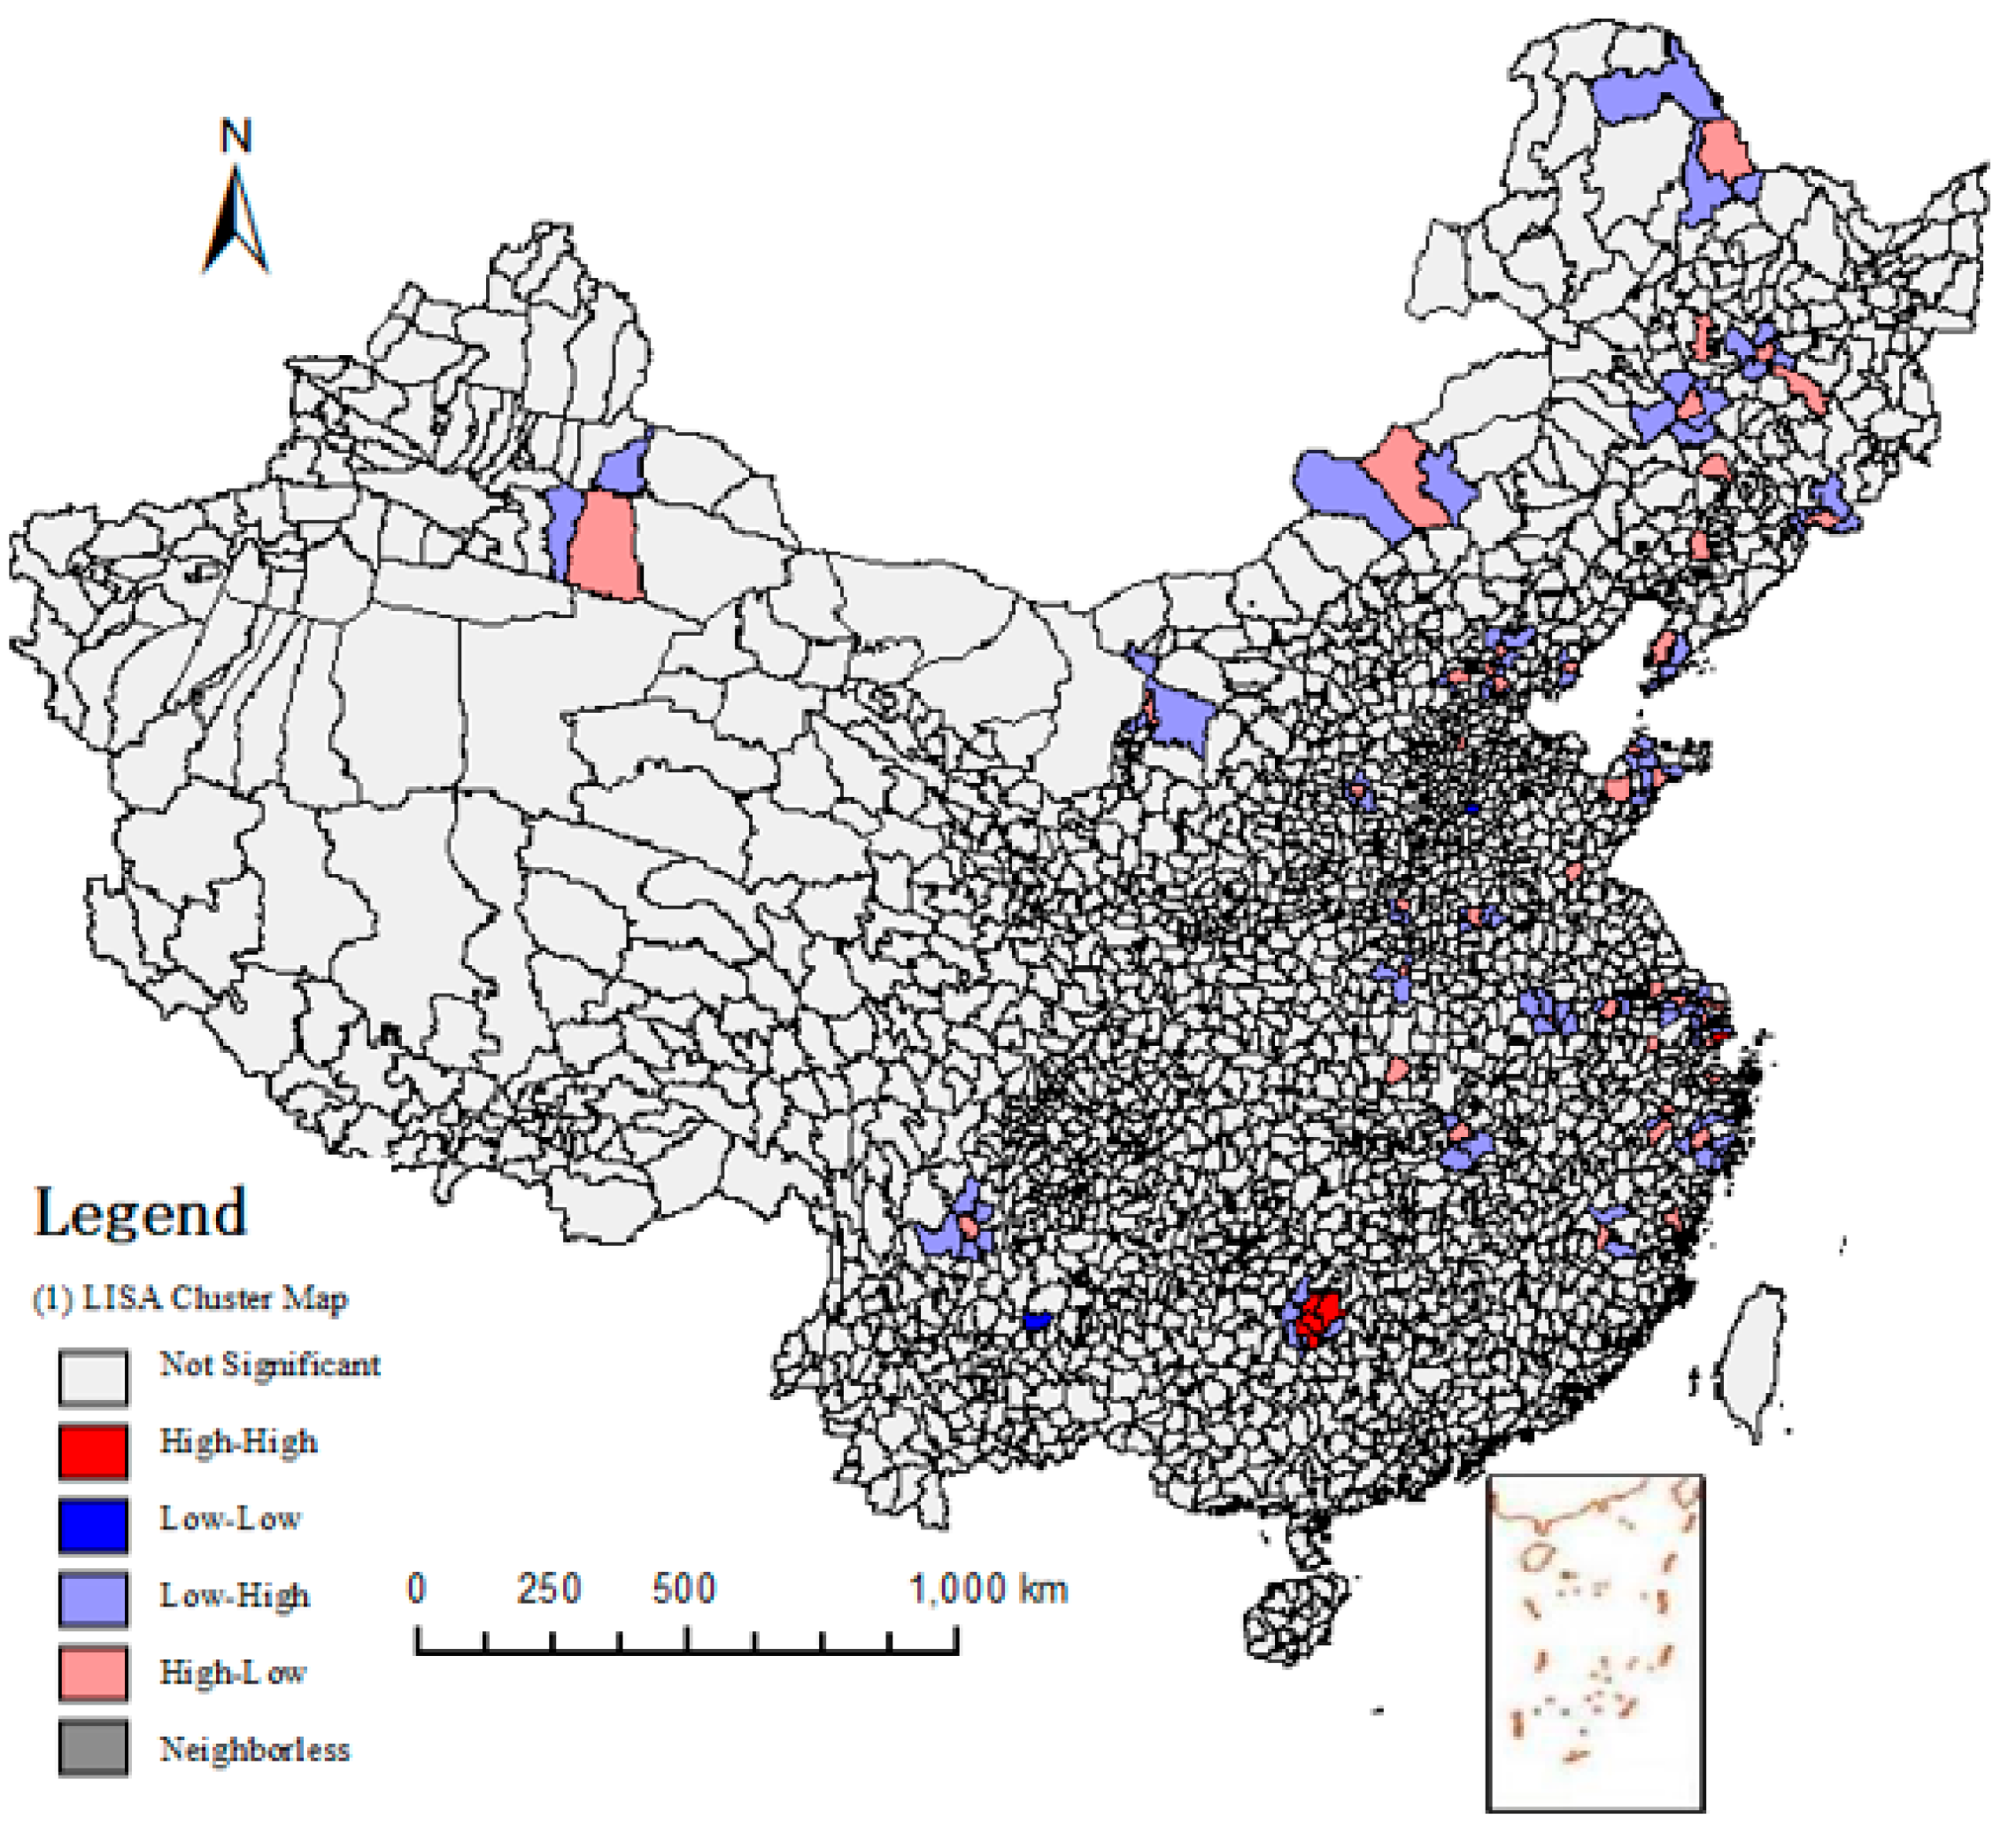
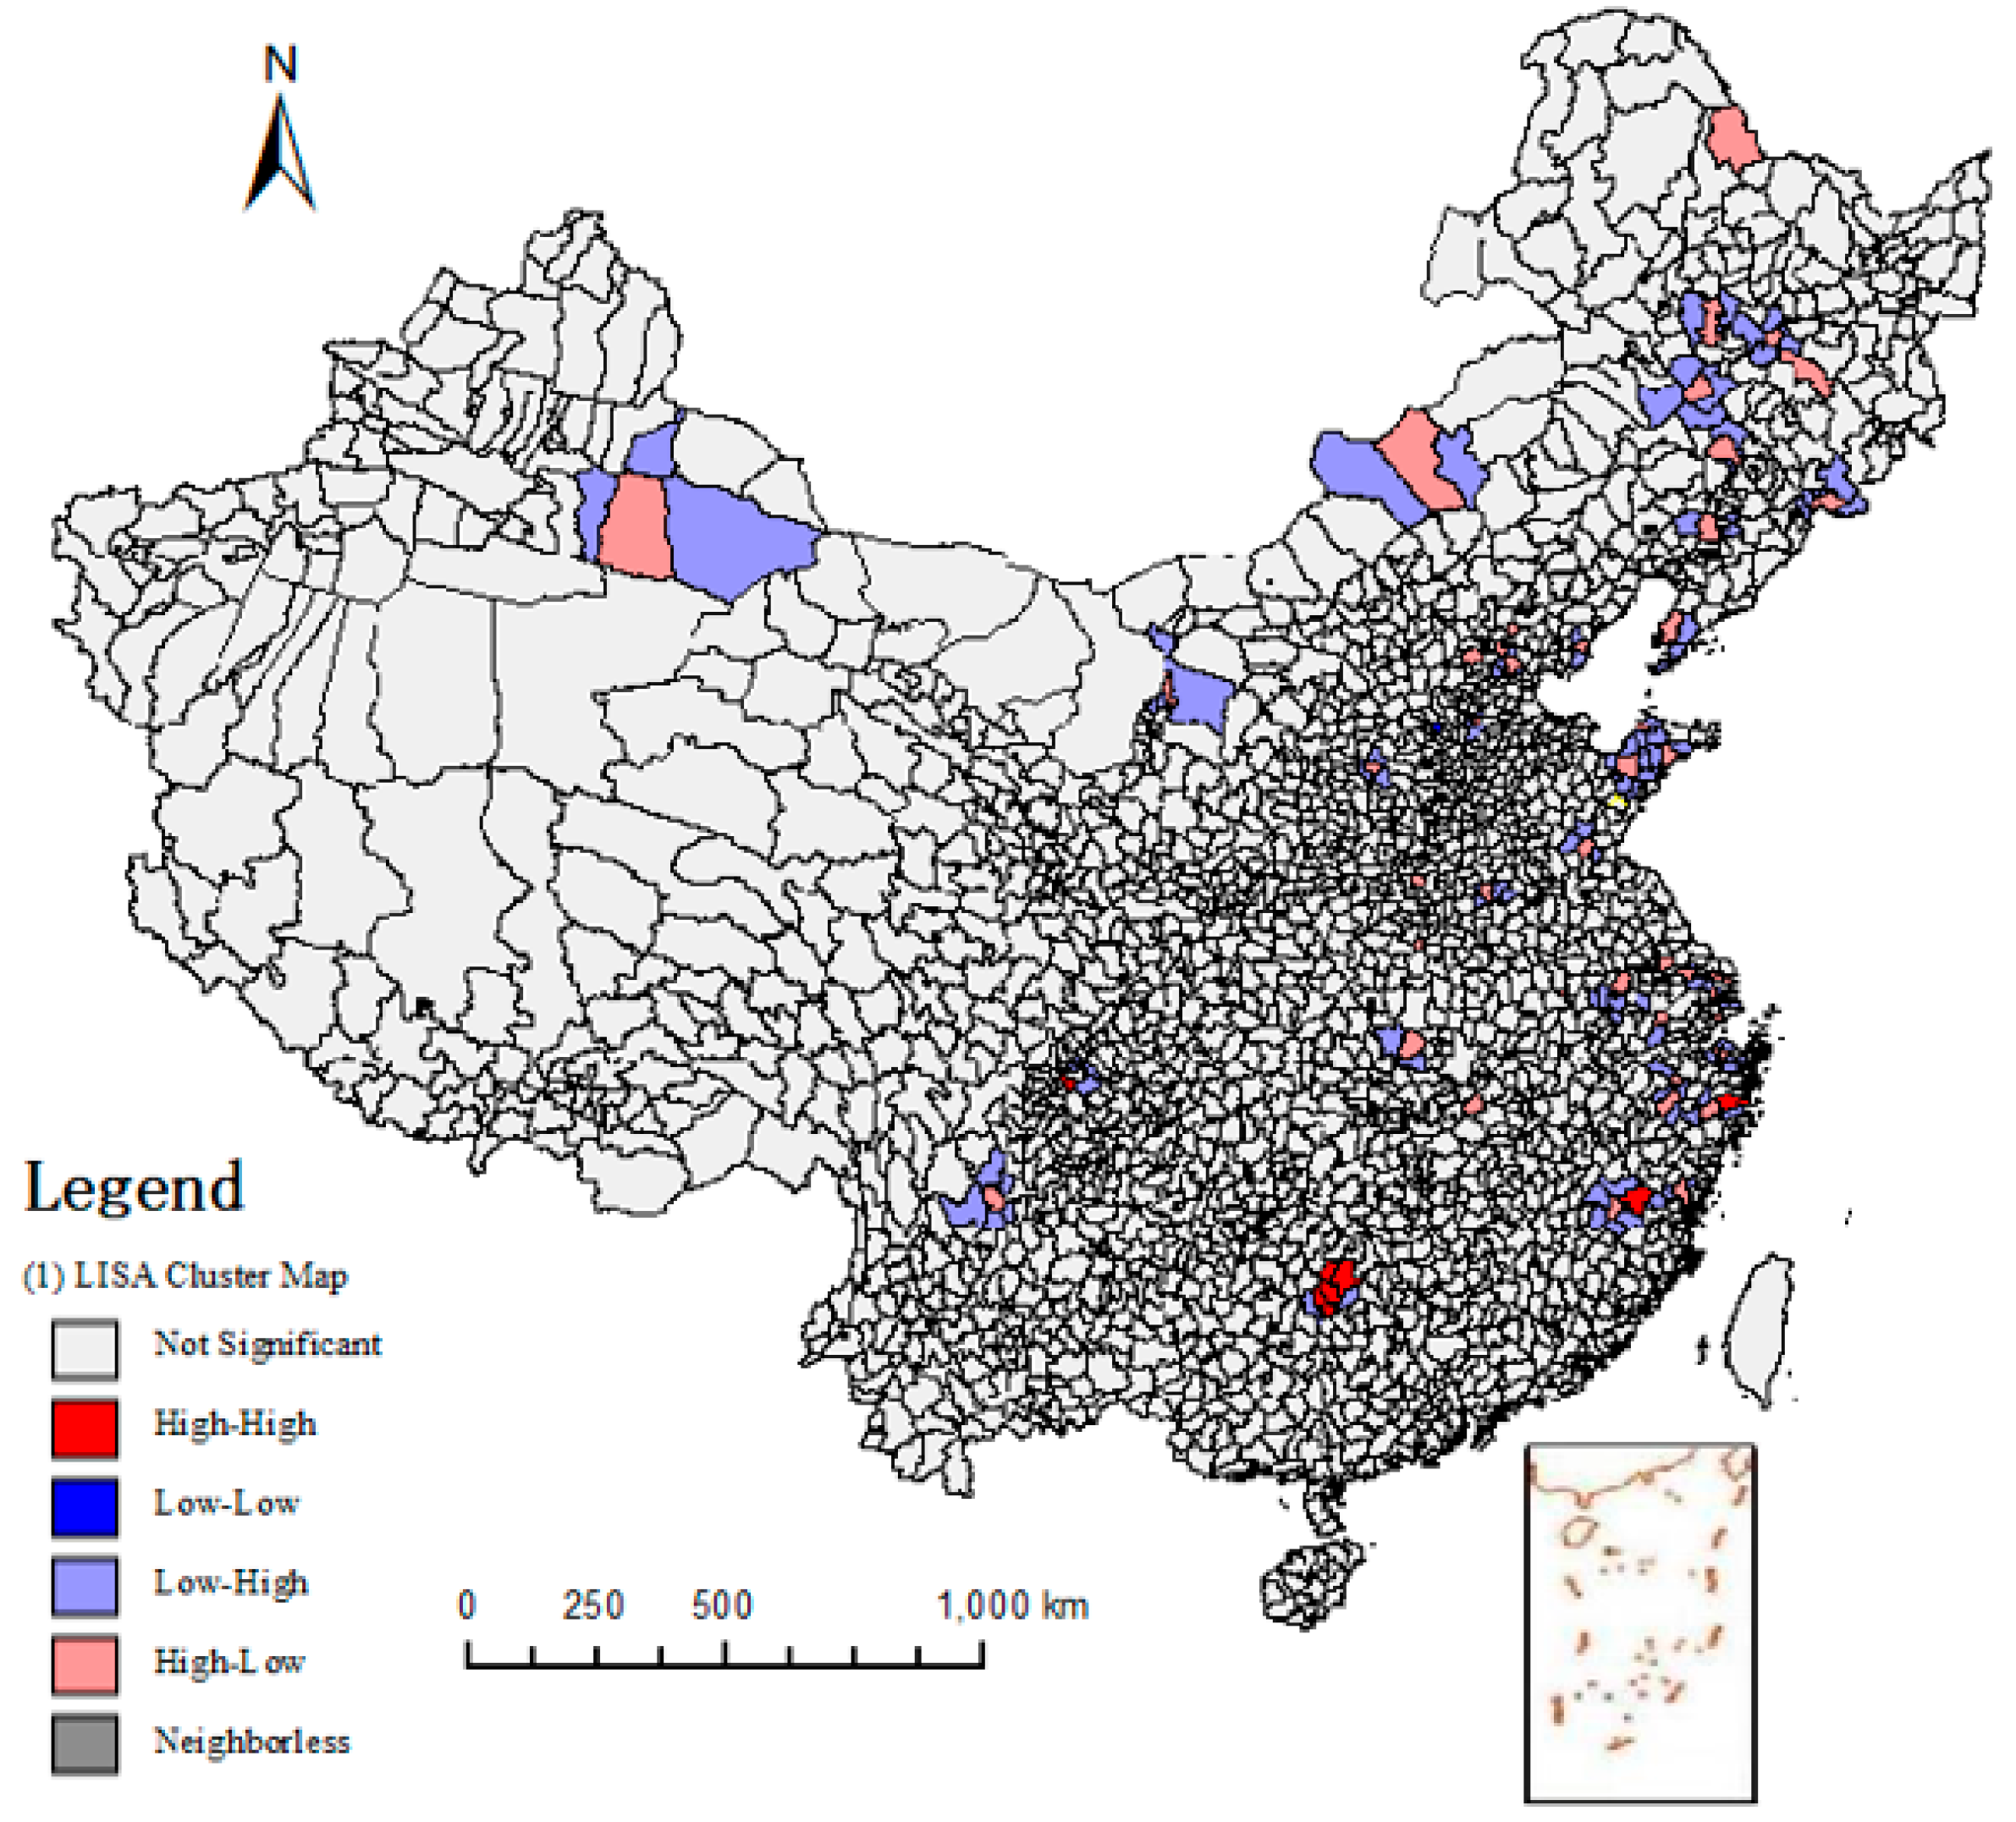
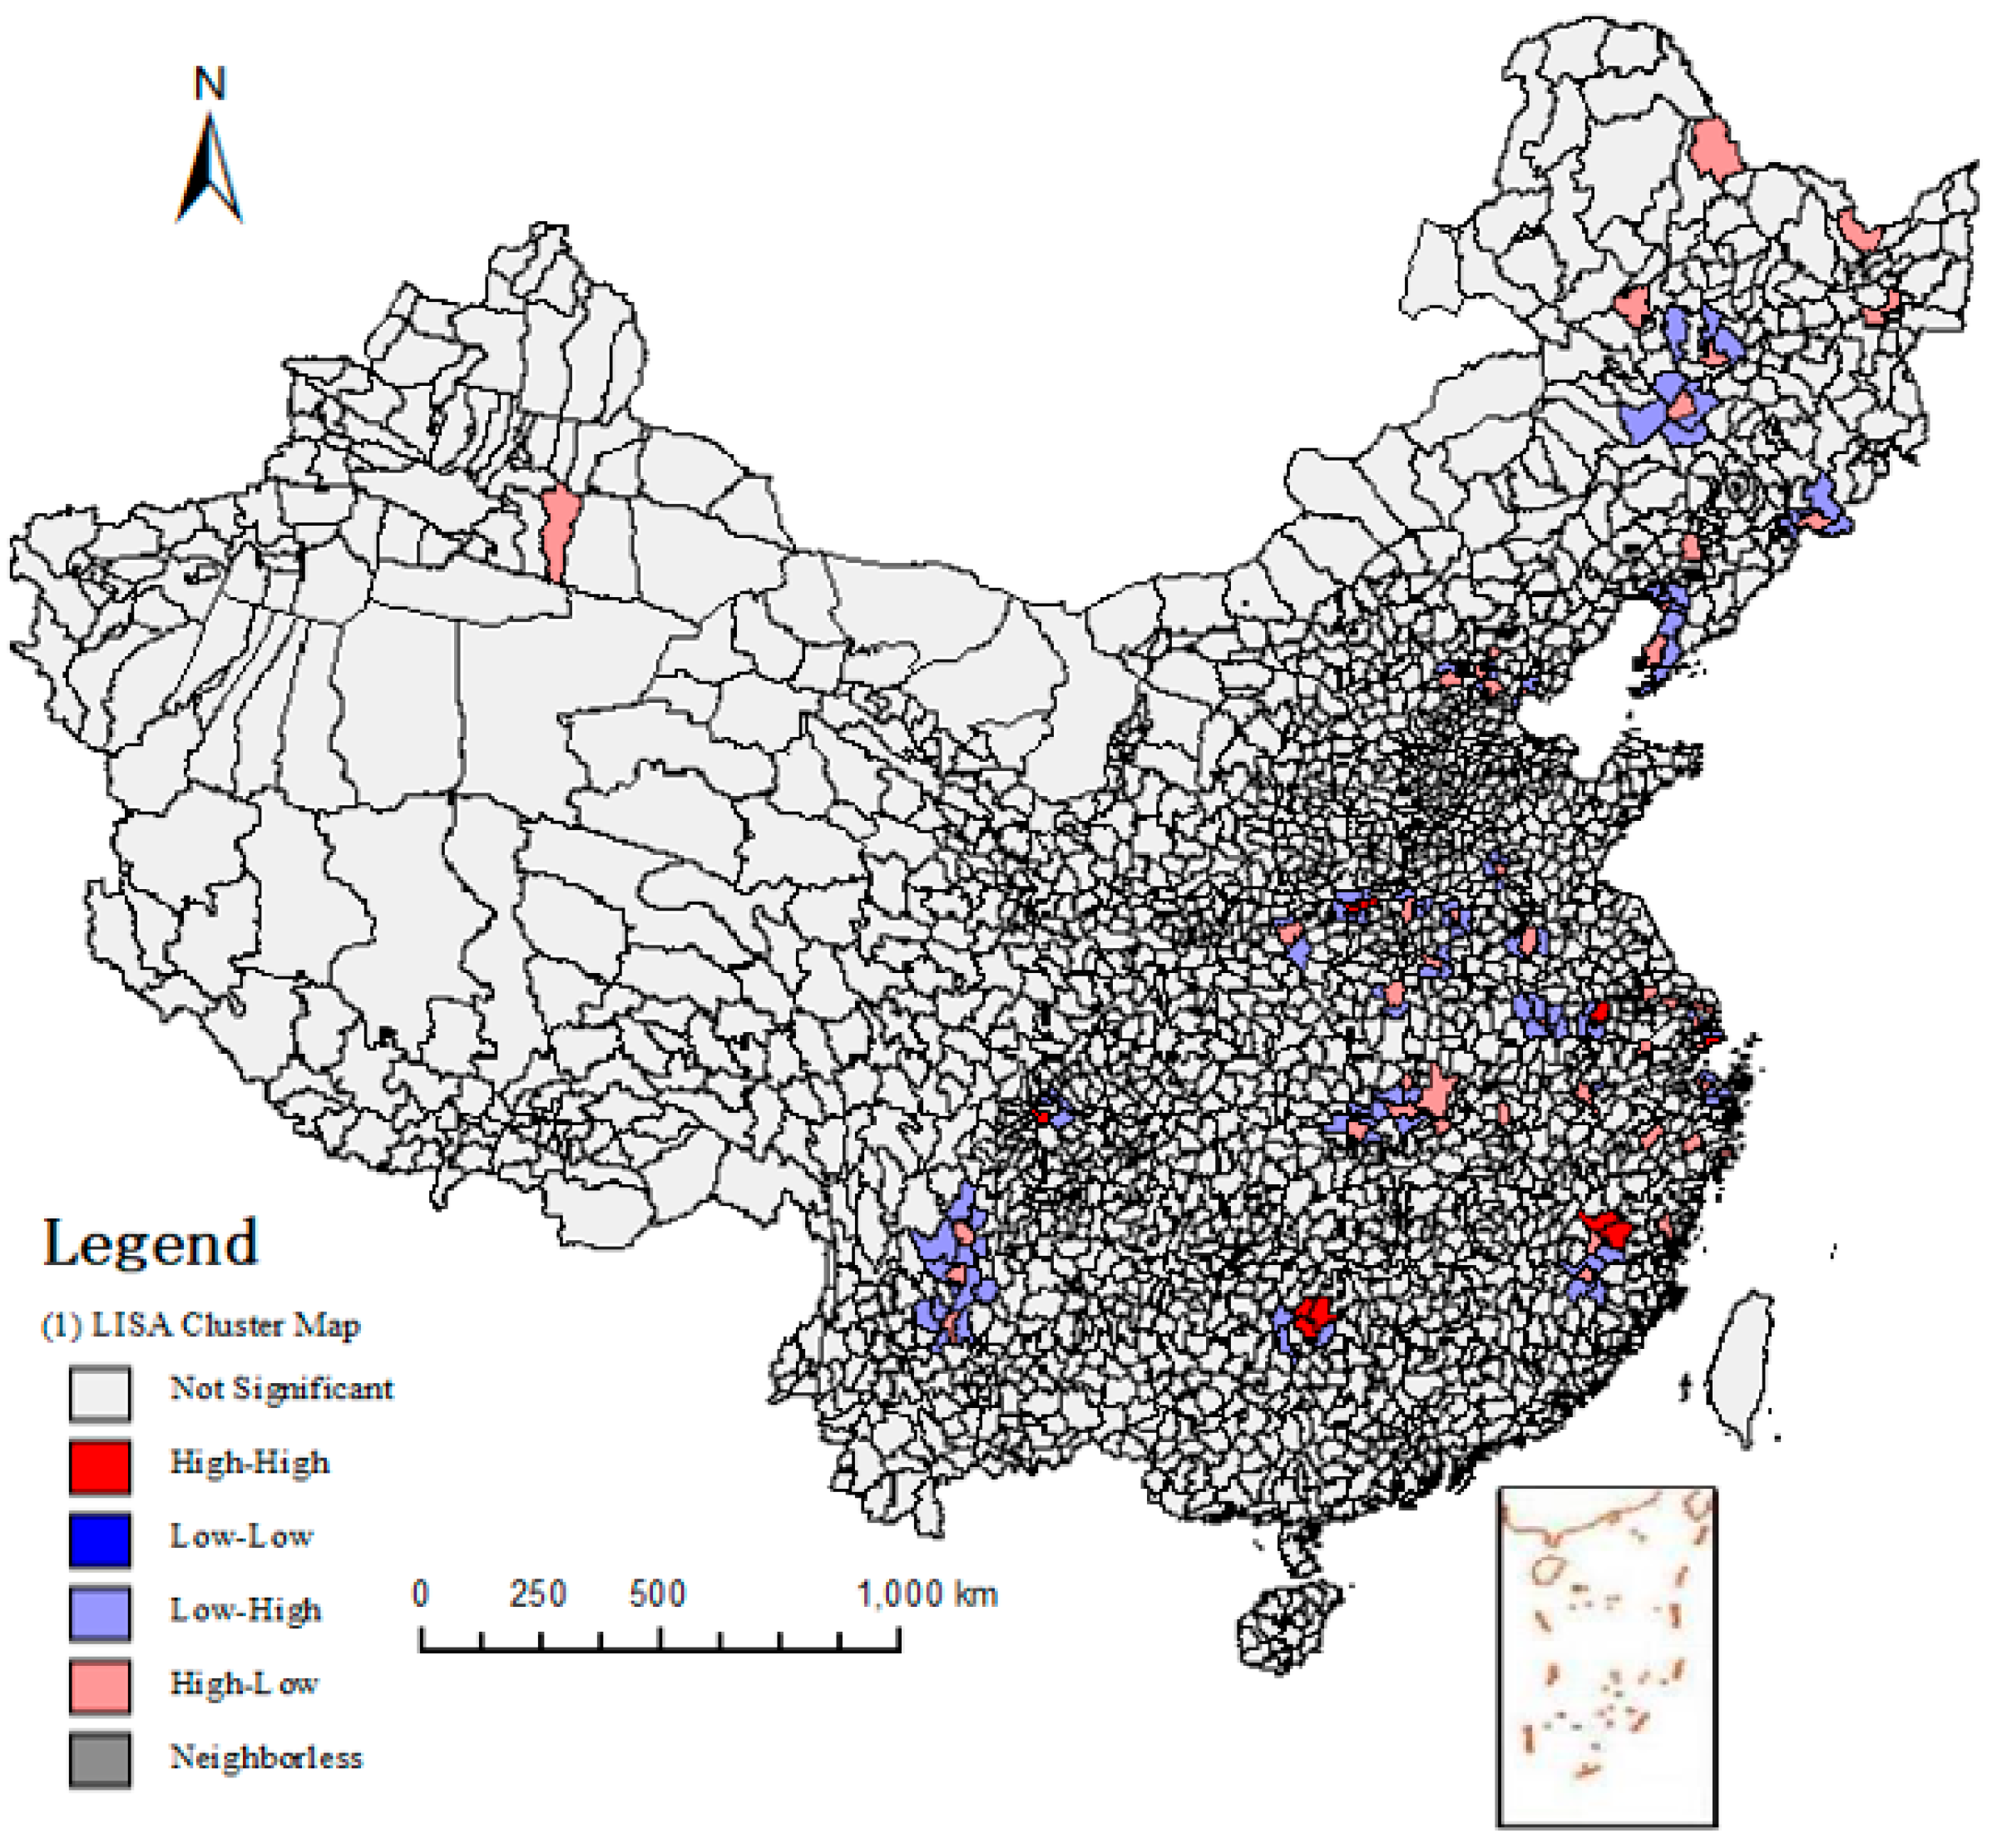
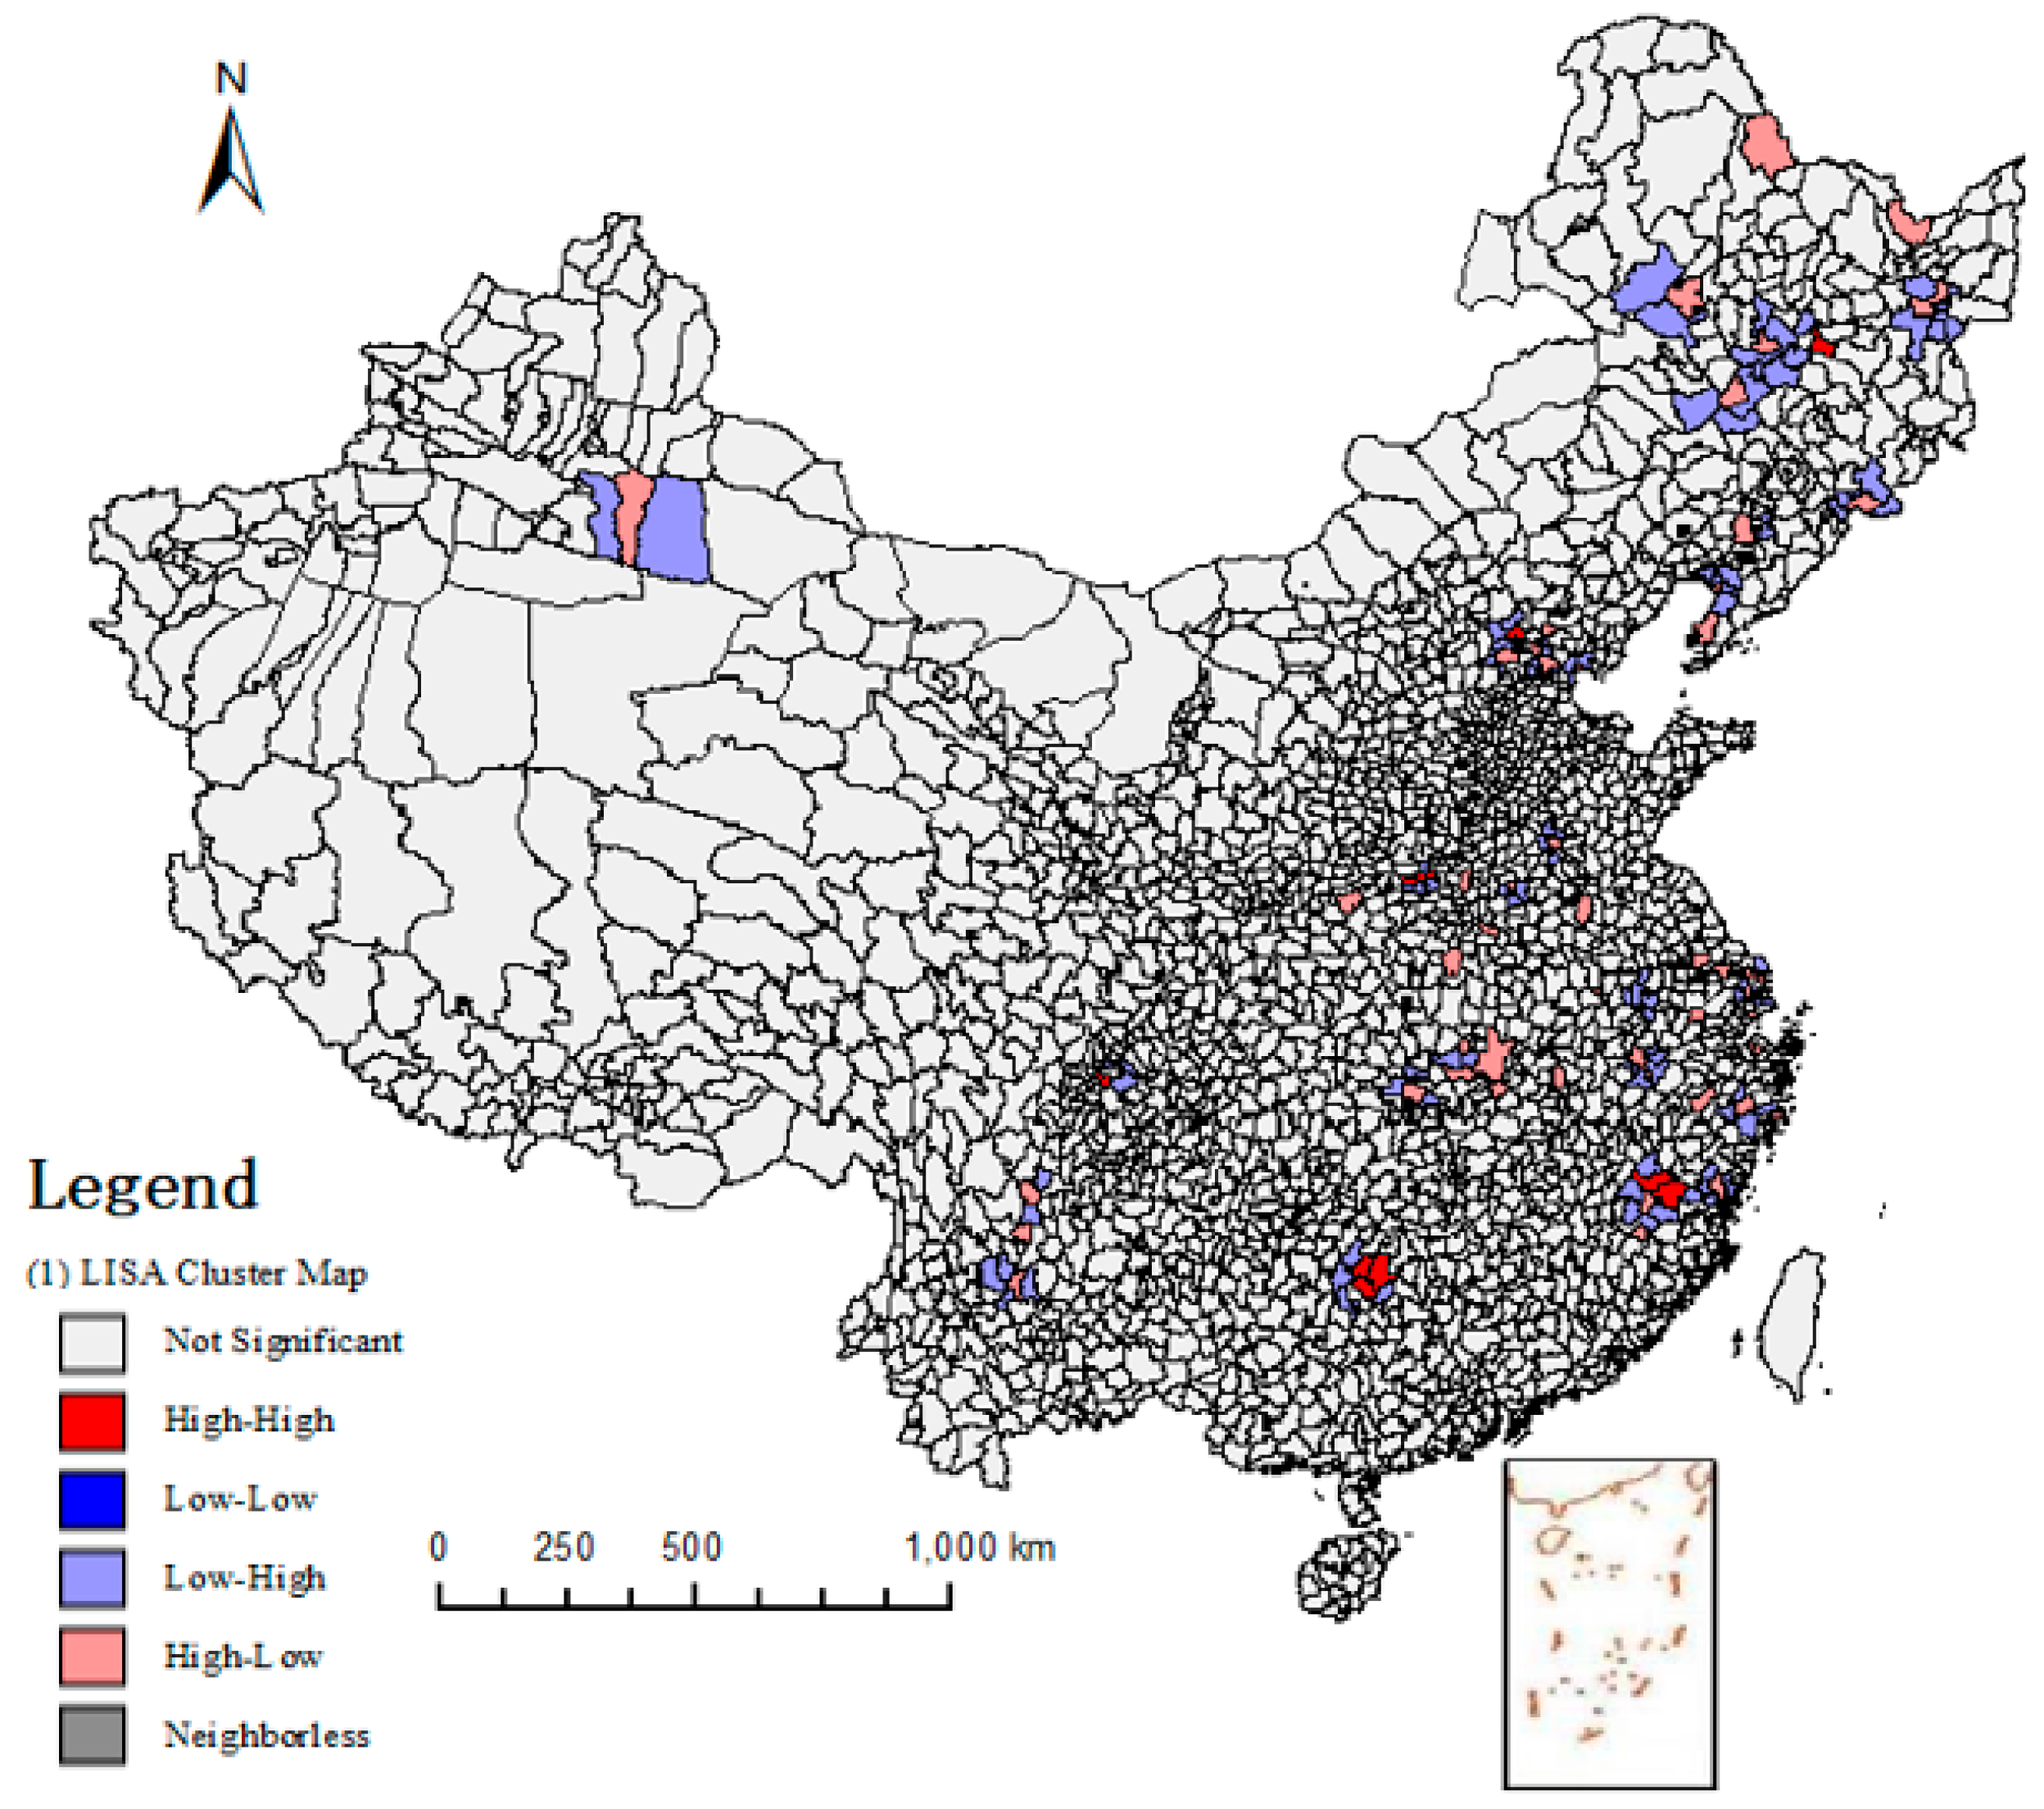
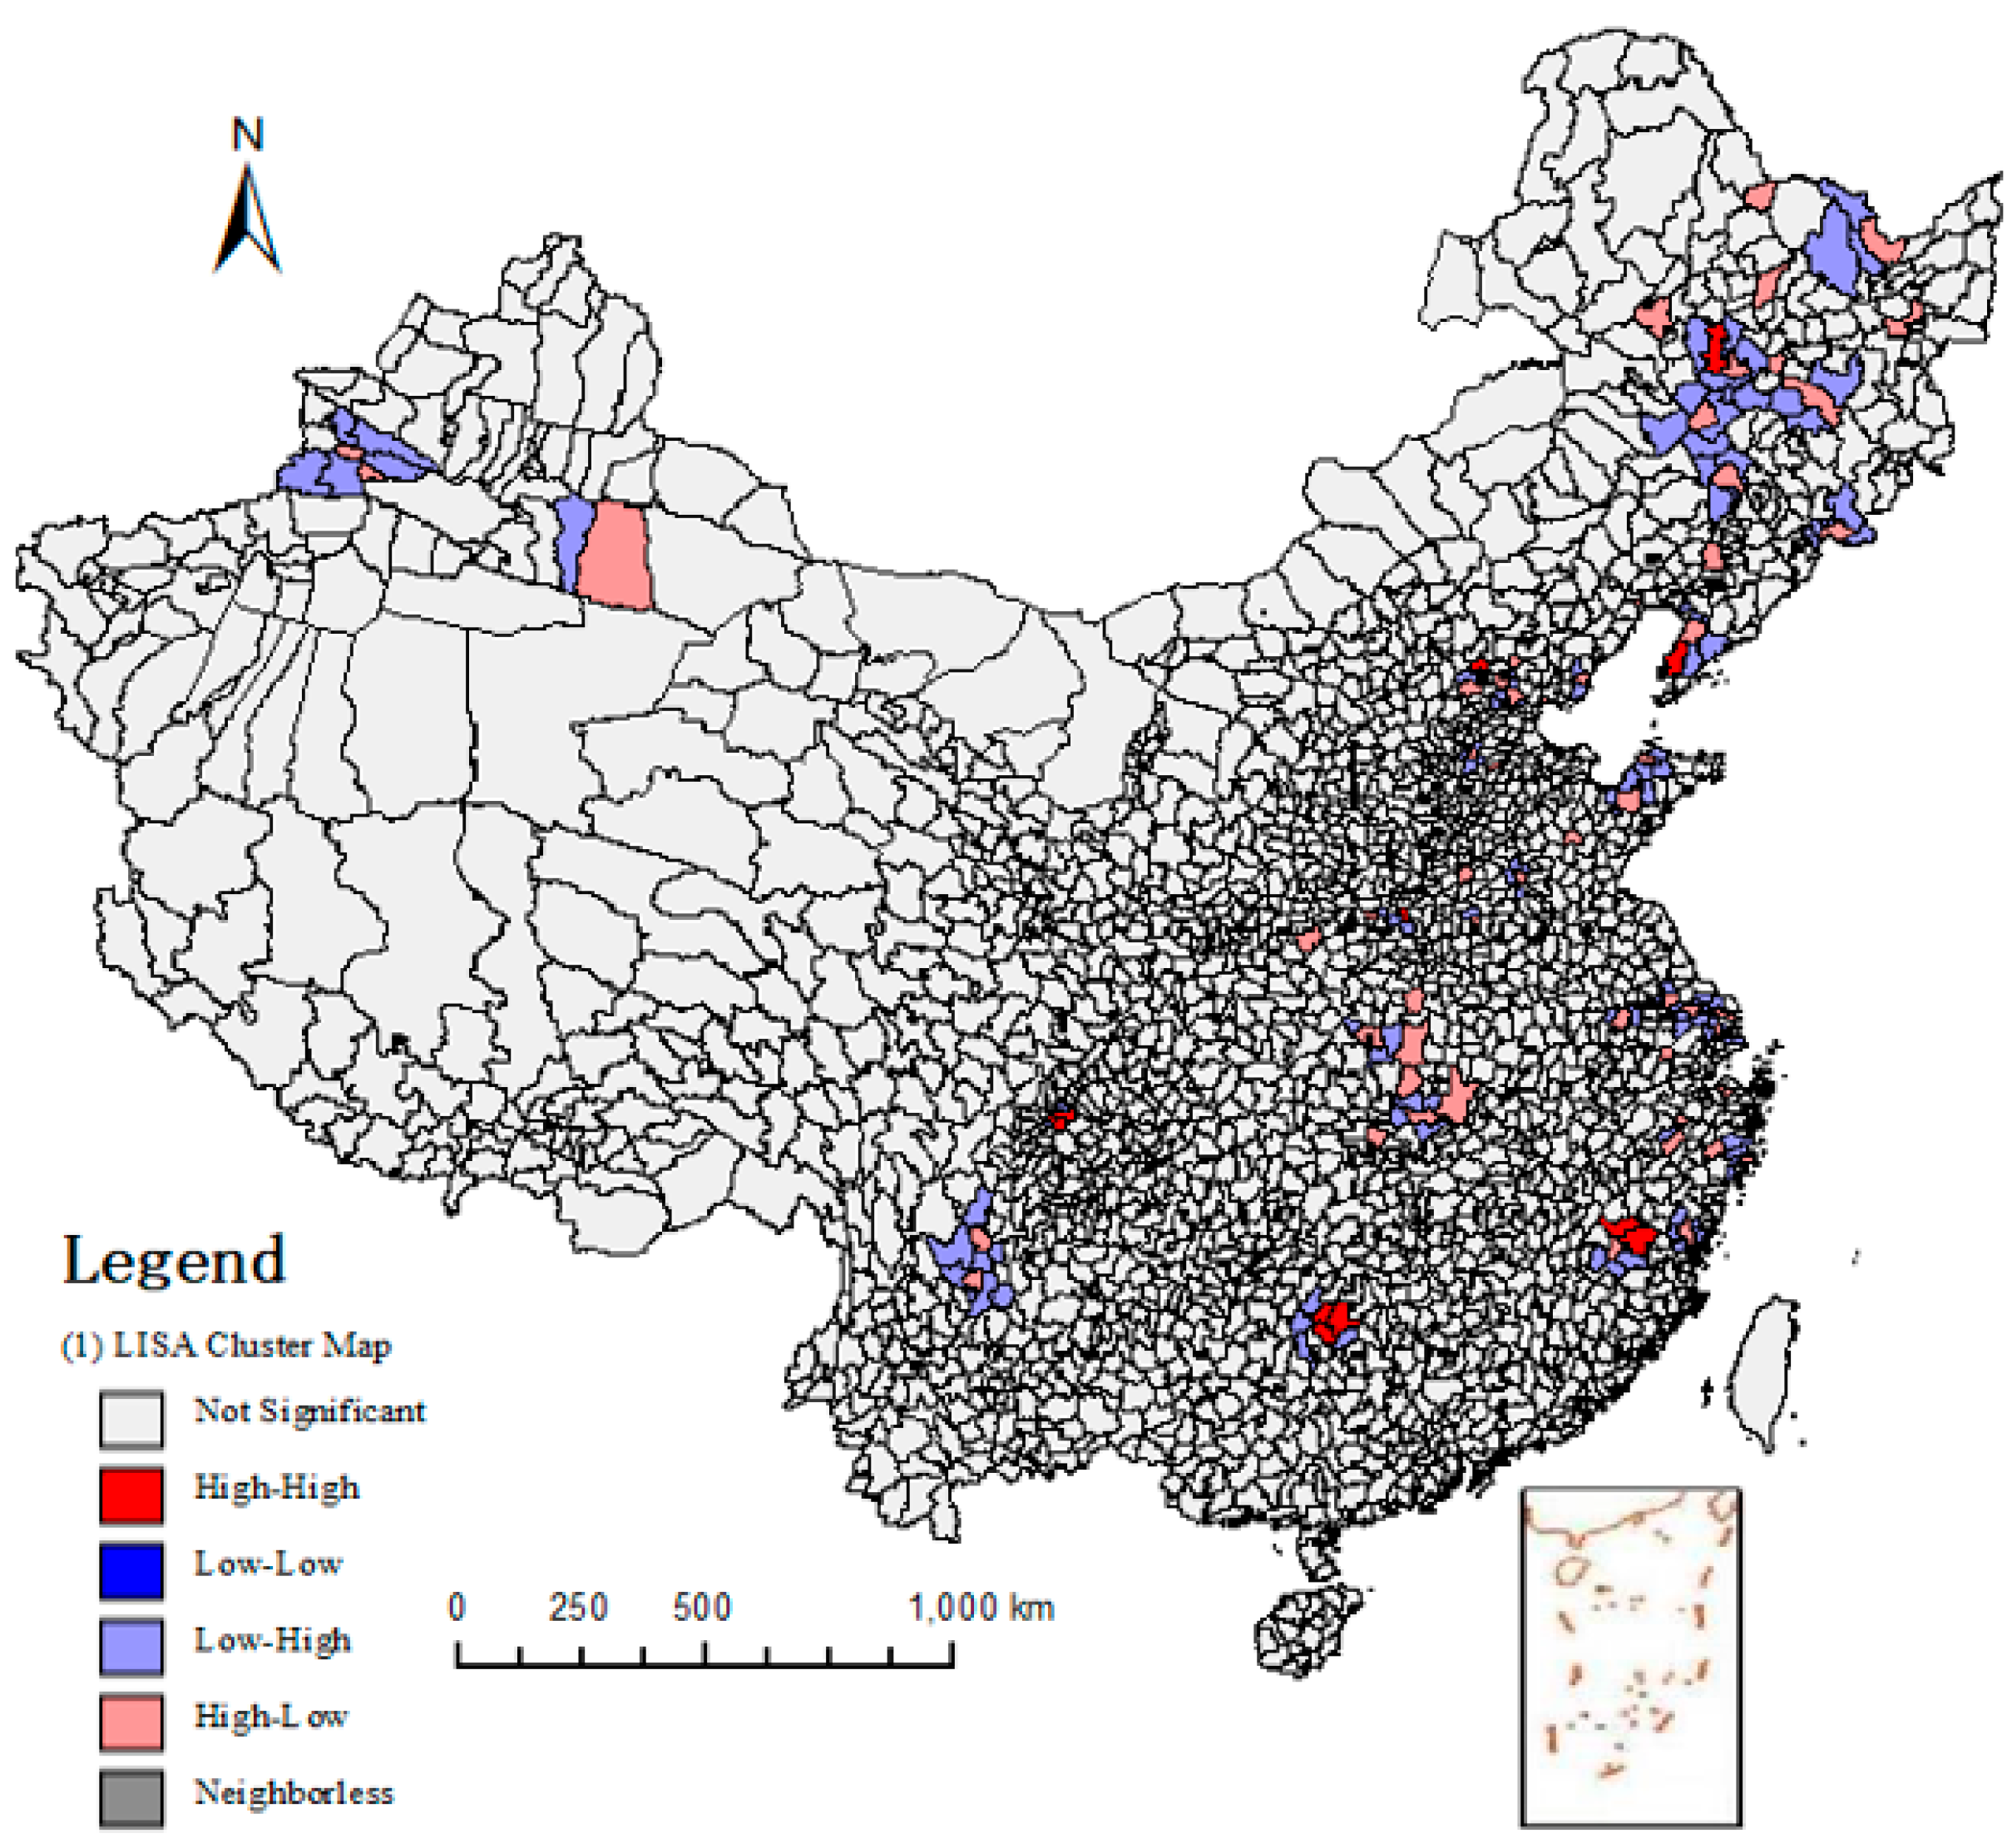
Local spatial autocorrelation generally uses local indicators of spatial association (LISA) cluster map for analysis. LISA cluster maps were used to evaluate the spatially-related contact of locally relevant energy consumption. It was more intuitive to show local Moran’s I. The results of local spatial autocorrelation are presented in Figure 15, Figure 16, Figure 17, Figure 18, Figure 19 and Figure 20.
Figure 15 and Figure 16 show the LISA cluster map of energy input and output in 2011. H-H type was only found in five counties in Guangxi province, whereas other areas were L-H and H-L types, and there was no L-L type of area. The results indicated that the five surrounding counties in Guangxi had similar attributes. H-L types shown by the reddish areas, such as some parts in Northeast China, are areas where energy consumption was relatively high, whereas the surroundings areas were relatively low. On the contrary, the L-H type areas described in light purple are areas where energy consumption was relatively low, but the surrounding areas were relatively high. Figure 16 shows the LISA cluster map of energy output in 2011.The red areas in the map represent the H-H type, which covers some parts of Guangxi, Fujian, and Zhejiang provinces. Other areas are mostly H-L types and L-H types.
A similar analysis can be conducted in Figure 17, Figure 18, Figure 19 and Figure 20. In summary, for energy input, the H-H type mainly occurs in Guangxi Province, Heilongjiang Province, Fujian Province, and Beijing City. The reason for this finding is that protected grape cultivation in these counties inputs more energy, affecting one another, and better production models will be imitated and promoted by growers to achieve a higher yield of grape.
4. Conclusions
The main objectives of this study were to examine energy consumption and develop a function relationship in different protected cultivation modes and regions for protected grape cultivation in China. Based on the present study, the following conclusions were drawn:
(1) The kinds of energy consumed were steel, iron wire, water, chemical fertilizer, pesticide, electric power, organic fertilizer, plastic film, and labor power. The average total energy input and output of protected grape cultivation were calculated as 21.1 and 4.9 MJm−2 in 2011, 21.2 and 5.3 MJm−2 in 2012, and 22.3 and 5.2 MJm−2 in 2013, respectively.
(2) The data for the three years showed that the main energy consumption was due to steel, plastic film, and pesticides. Furthermore, the analysis of the total investment ratio and total energy input ratio showed that early ripening production and late ripening production consumed more energy than rain-shelter production.
(3) In the protected grape cultivation production system, the share of indirect and non-renewable energies was higher than direct and renewable energy. Indirect and non-renewable energy input accounted for 90% of total energy consumption.
(4) Spatial analysis showed that the values of Moran’s I were all positive for the three years, and the significance of p test values and Z values both passed the significance test. Thus protected grape energy input and energy output were positively spatially autocorrelated.
Author Contributions
Conceptualization, D.T. and M.Z.; Methodology, D.T. and X.W.; Software, J.W.; Validation, D.T., W.M. and J.F.; Formal Analysis, D.T.; Investigation, M.Z.; Resources, W.M.; Data Curation, M.Z., X.W. and J.W.; Writing-Original Draft Preparation, D.T., X.W. and J.W.; Writing-Review & Editing, D.T., M.Z. and J.F.; Visualization, J.W.; Supervision, W.M. and J.F.; Project Administration, D.T. and J.F.; Funding Acquisition, W.M.
Funding
This research was supported by the Natural Science Foundation of China under Grant No. 41501585, China Agriculture Research System (CARS-29).
Conflicts of Interest
The authors declare no conflict of interest.
References
- Heidari, M.D.; Omid, M.; Mohammadi, A. Measuring productive efficiency of horticultural greenhouses in Iran: A data envelopment analysis approach. Expert Syst. Appl. 2012, 39, 1040–1045. [Google Scholar] [CrossRef]
- Islam, F.; Shahbaz, M.; Ahmed, A.U.; Alam, M.M. Financial development and energy consumption nexus in Malaysia: A multivariate time series analysis. Econ. Model. 2013, 30, 435–441. [Google Scholar] [CrossRef] [Green Version]
- Feng, J. Evaluation on the Technical Benefits of the Protected Grape Cultivation; China Agricultural University: Beijing, China, 2013. [Google Scholar]
- Pishgar-Komleh, S.H.; Sefeedpari, P.; Rafiee, S. Energy and economic analysis of rice production under different farm levels in Guilan province of Iran. Energy 2011, 36, 5824–5831. [Google Scholar] [CrossRef]
- Khoshnevisan, B.; Rafiee, S.; Omid, M.; Mousazadeh, H. Applying data envelopment analysis approach to improve energy efficiency and reduce GHG (greenhouse gas) emission of wheat production. Energy 2013, 58, 588–593. [Google Scholar] [CrossRef]
- Mohammadi, A.; Rafiee, S.; Jafari, A.; Dalgaard, T.; Knudsen, M.T.; Keyhani, A.; Mousavi-Avval, S.H.; Hermansen, J.E. Potential greenhouse gas emission reductions in soybean farming: A combined use of Life Cycle Assessment and Data Envelopment Analysis. J. Clean. Prod. 2013, 54, 89–100. [Google Scholar] [CrossRef]
- Dong, X.; Gao, W.; Sui, P.; Yan, M. Energy analysis on typical peasants household system in the ecotone between agriculture and pasture in north china. J. Arid Land Resour. Environ. 2006, 4, 78–82. [Google Scholar] [CrossRef]
- Jia, J.W. On Cost-Benefit of Different Breeding Models of Beef Cattle in China; Inner Mongolia Agricultural University: Hohhot, China, 2010. [Google Scholar]
- Castellini, C.; Bastianoni, S.; Granai, C.; Bosco, A.D.; Brunetti, M. Sustainability of poultry production using the emergy approach: Comparison of conventional and organic rearing systems. Agric. Ecosyst. Environ. 2006, 114, 343–350. [Google Scholar] [CrossRef] [Green Version]
- Li, L.; Lu, H.; Ren, H.; Kang, W.; Chen, F. Emergy evaluations of three aquaculture systems on wetlands surrounding the Pearl River Estuary, China. Ecol. Indic. 2011, 11, 526–534. [Google Scholar] [CrossRef]
- Ren, J.S.; Stenton-Dozey, J.; Plew, D.R.; Fang, J.; Gall, M. An ecosystem model for optimising production in integrated multitrophic aquaculture systems. Ecol. Model. 2012, 246, 34–46. [Google Scholar] [CrossRef]
- Ozkan, B.; Fert, C.; Karadeniz, C.F. Energy and cost analysis for greenhouse and open-field grape production. Energy 2007, 32, 1500–1504. [Google Scholar] [CrossRef]
- Rajabi Hamedani, S.; Keyhani, A.; Alimardani, R. Energy use patterns and econometric models of grape production in Hamadan province of Iran. Energy 2011, 36, 6345–6351. [Google Scholar] [CrossRef]
- Khoshroo, A.; Mulwa, R.; Emrouznejad, A.; Arabi, B. A non-parametric Data Envelopment Analysis approach for improving energy efficiency of grape production. Energy 2013, 63, 189–194. [Google Scholar] [CrossRef]
- Salehi, M.; Ebrahimi, R.; Maleki, A.; Ghasemi Mobtaker, H. An assessment of energy modeling and input costs for greenhouse button mushroom production in Iran. J. Clean. Prod. 2014, 64, 377–383. [Google Scholar] [CrossRef]
- Xue, X.; Wu, H.; Zhang, X.; Dai, J.; Su, C. Measuring energy consumption efficiency of the construction industry: The case of China. J. Clean. Prod. 2014, 107, 509–515. [Google Scholar] [CrossRef]
- Rahman, S.; Rahman, M.S. Energy productivity and efficiency of maize accounting for the choice of growing season and environmental factors: An empirical analysis from Bangladesh. Energy 2013, 49, 329–336. [Google Scholar] [CrossRef]
- Mousavi-Avval, S.H.; Rafiee, S.; Mohammadi, A. Optimization of energy consumption and input costs for apple production in Iran using data envelopment analysis. Energy 2011, 36, 909–916. [Google Scholar] [CrossRef]
- Feng, J.; Wang, J.; Zhang, X.; Zhao, F.; Kanianska, R.; Tian, D. Design and Implementation of Emergy-Based Sustainability Decision Assessment System for Protected Grape Cultivation. Sustainability 2015, 7, 14002–14025. [Google Scholar] [CrossRef] [Green Version]
- Chen, Y.G. Reconstructing the mathematical process of spatial autocorrelation based on Moran’s statistics. Geogr. Res. 2009, 27, 90–98. [Google Scholar]
- Curran, P. Spatial autocorrelation: Odland, J. London: Sage, 1988. 88 pp. £14.95 hardback; £7.95 paperback. Appl. Geogr. 1988, 9, 138–139. [Google Scholar] [CrossRef]
- Moran, P.A.P. The interpretation of statistical maps. J. R. Stat. Soc. 1948, 10, 243–251. [Google Scholar]
- Melecky, L. Spatial autocorrelation method for local analysis of the EU. Procedia Econ. Financ. 2015, 23, 1102–1109. [Google Scholar] [CrossRef]
- Bolandnazar, E.; Keyhani, A.; Omid, M. Determination of efficient and inefficient greenhouse cucumber producers using Data Envelopment Analysis approach, a case study: Jiroft city in Iran. J. Clean. Prod. 2014, 79, 108–115. [Google Scholar] [CrossRef]
- Lu, H.; Bai, Y.; Ren, H.; Campbell, D.E. Integrated emergy, energy and economic evaluation of rice and vegetable production systems in alluvial paddy fields: Implications for agricultural policy in China. J. Environ. Manag. 2010, 91, 2727–2735. [Google Scholar] [CrossRef] [PubMed]
- Luo, S. Agricultural Ecology; China Agricultural Press: Beijing, China, 2011. [Google Scholar]
- Koctürk, O.M.; Engindeniz, S. Energy and cost analysis of sultana grape growing: A case study of Manisa, west Turkey. Afr. J. Agric. Res. 2009, 4, 938–943. [Google Scholar]
- Kizilaslan, H. Input–output energy analysis of cherries production in Tokat Province of Turkey. Appl. Energy 2009, 86, 1354–1358. [Google Scholar] [CrossRef]
- Rafiee, S.; Avval, S.H.M.; Mohammadi, A. Modeling and sensitivity analysis of energy inputs for apple production in Iran. Energy 2010, 35, 3301–3306. [Google Scholar] [CrossRef]
- Torki-Harchegani, M.; Ebrahimi, R.; Mahmoodi-Eshkaftaki, M. Almond production in Iran: An analysis of energy use efficiency (2008–2011). Renew. Sustain. Energy Rev. 2015, 41, 217–224. [Google Scholar] [CrossRef]
- Mohammadshirazi, A.; Akram, A.; Rafiee, S.; Avval, S.H.M.; Kalhor, E.B. An analysis of energy use and relation between energy inputs and yield in tangerine production. Renew. Sustain. Energy Rev. 2012, 16, 4515–4521. [Google Scholar] [CrossRef]
- Nabavi-Pelesaraei, A.; Abdi, R.; Rafiee, S.; Mobtaker, H.G. Optimization of energy required and greenhouse gas emissions analysis for orange producers using data envelopment analysis approach. J. Clean. Prod. 2014, 65, 311–317. [Google Scholar] [CrossRef]
- Nabavi-Pelesaraei, A.; Abdi, R.; Rafiee, S. Energy use pattern and sensitivity analysis of energy inputs and economical models for peanut production in Iran. Int. J. Agric. Crop Sci. 2013, 5, 2193–2202. [Google Scholar]
- Tabatabaie, S.M.H.; Rafiee, S.; Keyhani, A.; Ebrahimi, A. Energy and economic assessment of prune production in Tehran province of Iran. J. Clean. Prod. 2013, 39, 280–284. [Google Scholar] [CrossRef]
- Petre, M.; Teodorescu, A.; Giosanu, D.; Bejan, C. Enhanced cultivation of mushrooms on organic wastes from wine-making industry. J. Environ. Prot. Ecol. 2012, 13, 1488–1492. [Google Scholar]
Figure 1.
Structure of the protected grape cultivation system.
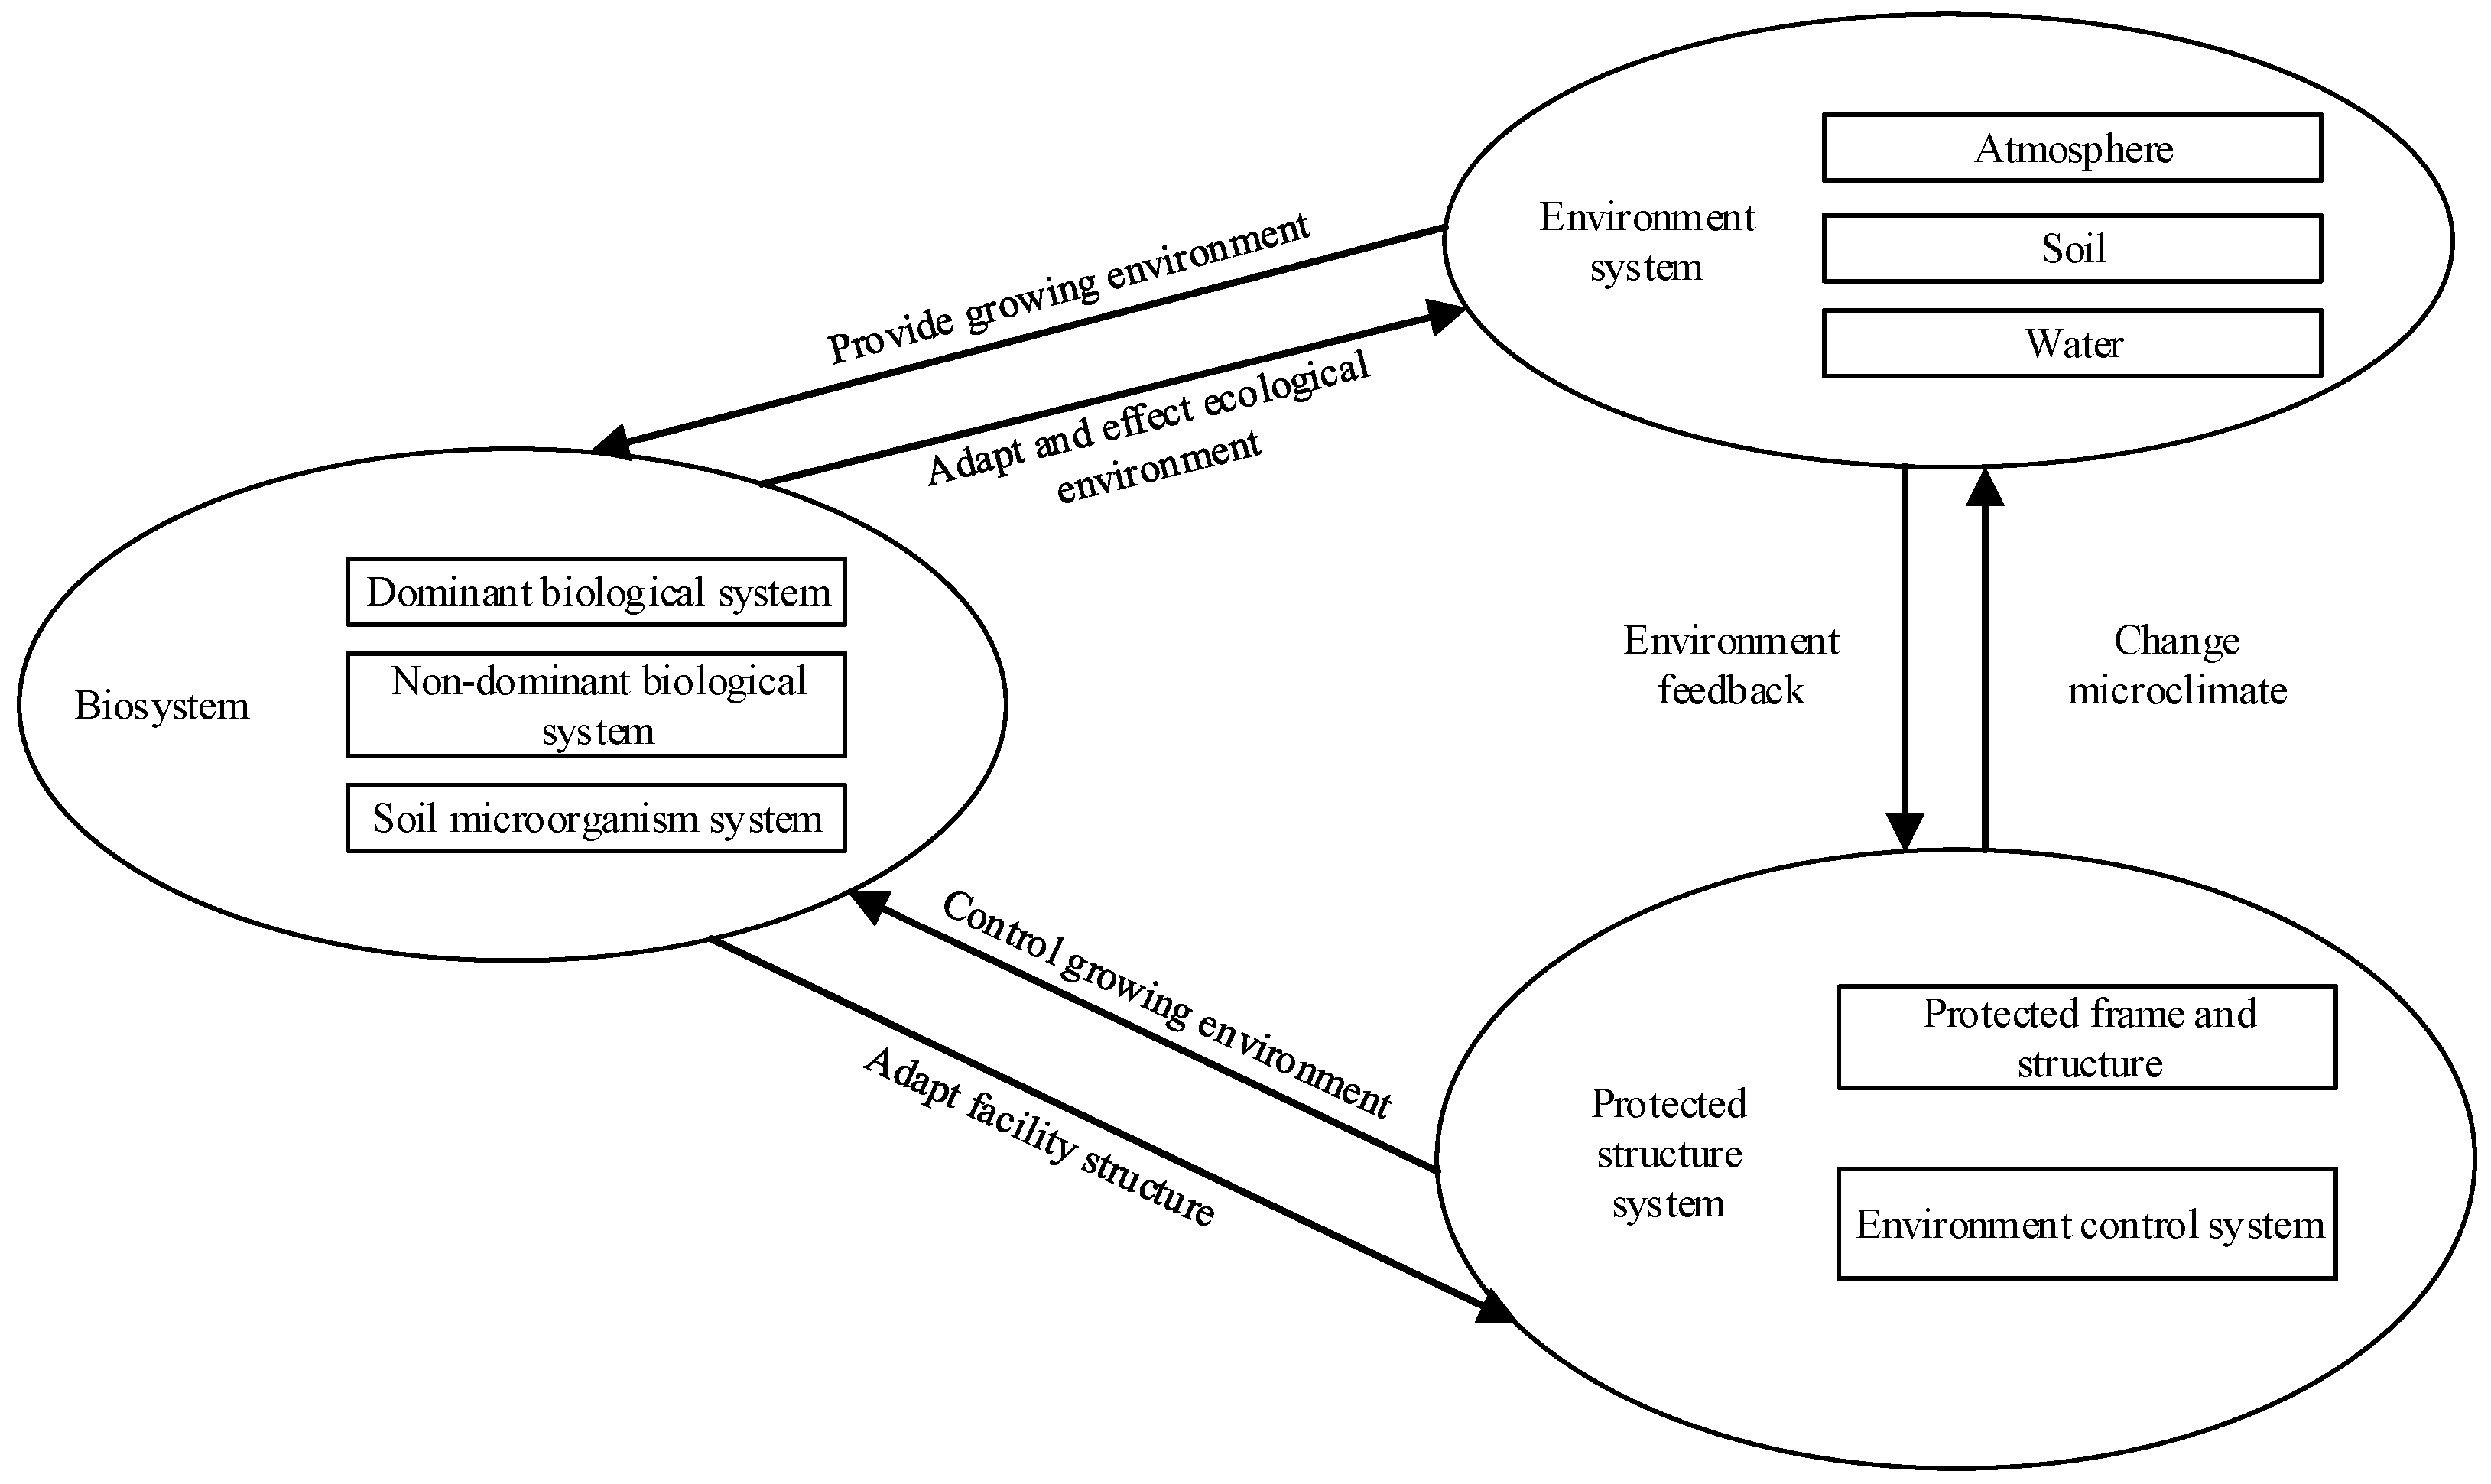
Figure 2.
Production process of protected grape cultivation system.

Figure 3.
Energy input and output index of protected grape cultivation.

Figure 4.
The proportion of energy input for protected grape production in 2011.
Figure 5.
The proportion of energy input for protected grape production in 2012.

Figure 6.
The proportion of energy input for protected grape production in 2013.
Figure 7.
Energy consumption structure comparison of protected grape production.
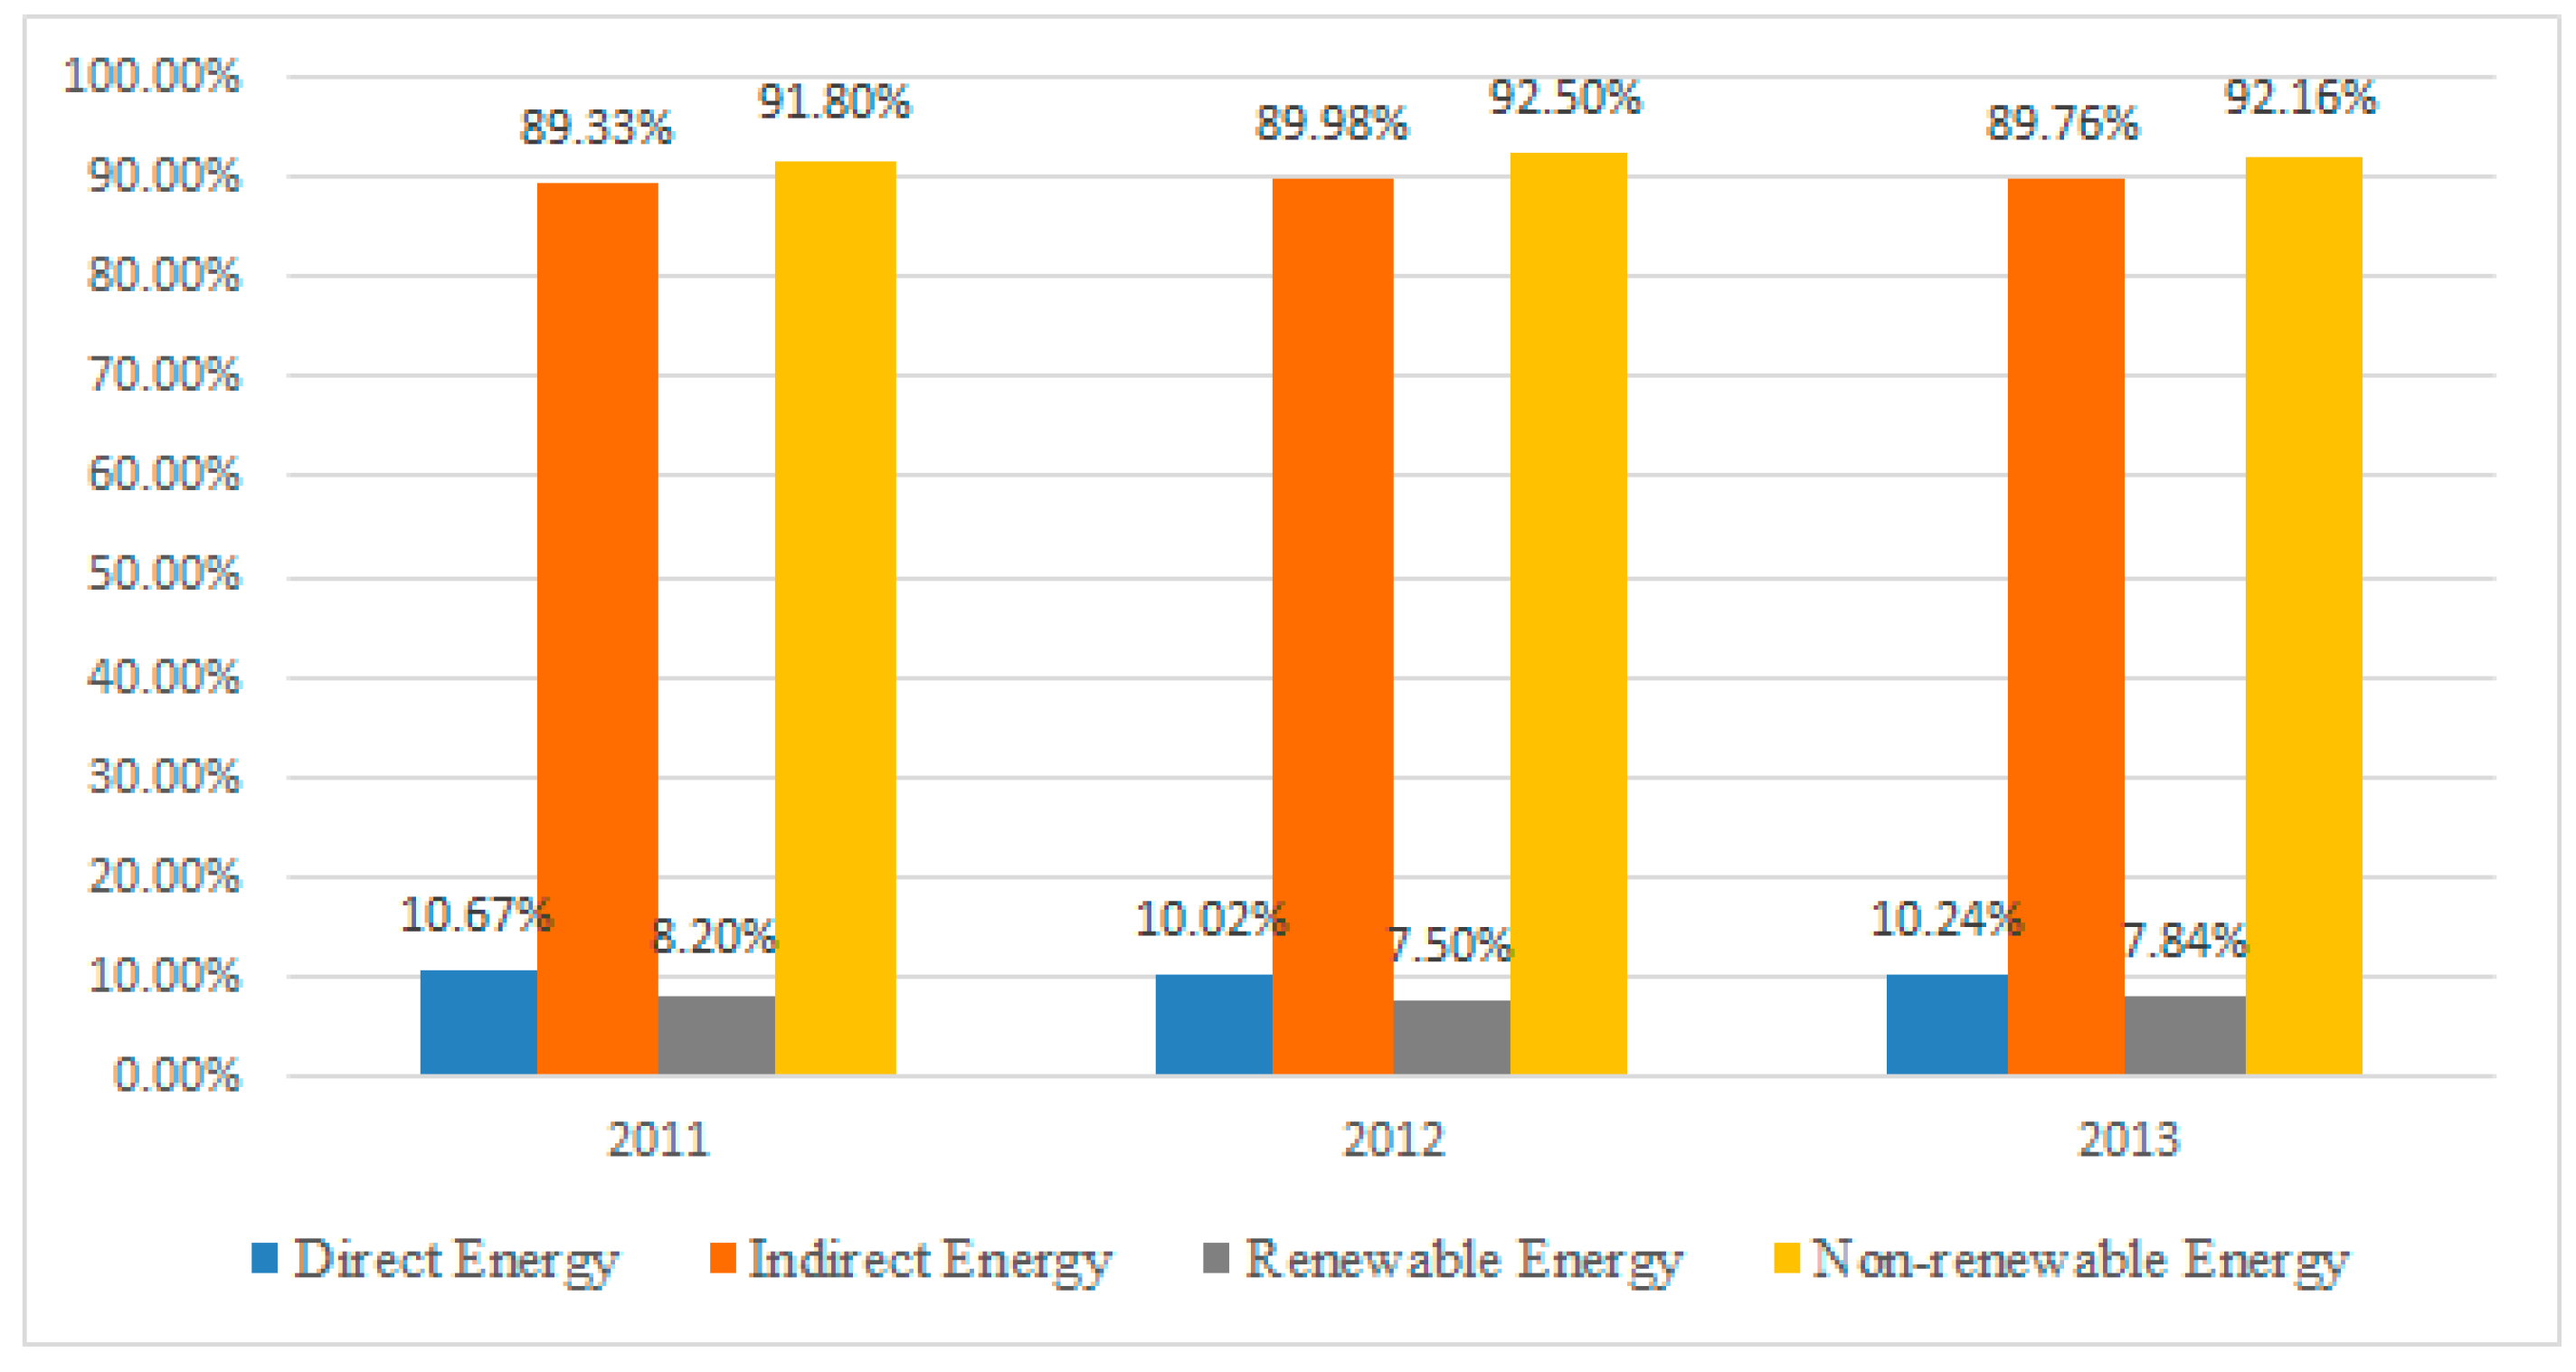
Figure 8.
Energy consumption structure comparison of different cultivation modes.
Figure 9.
Energy consumption structure comparison of different cultivation structures.
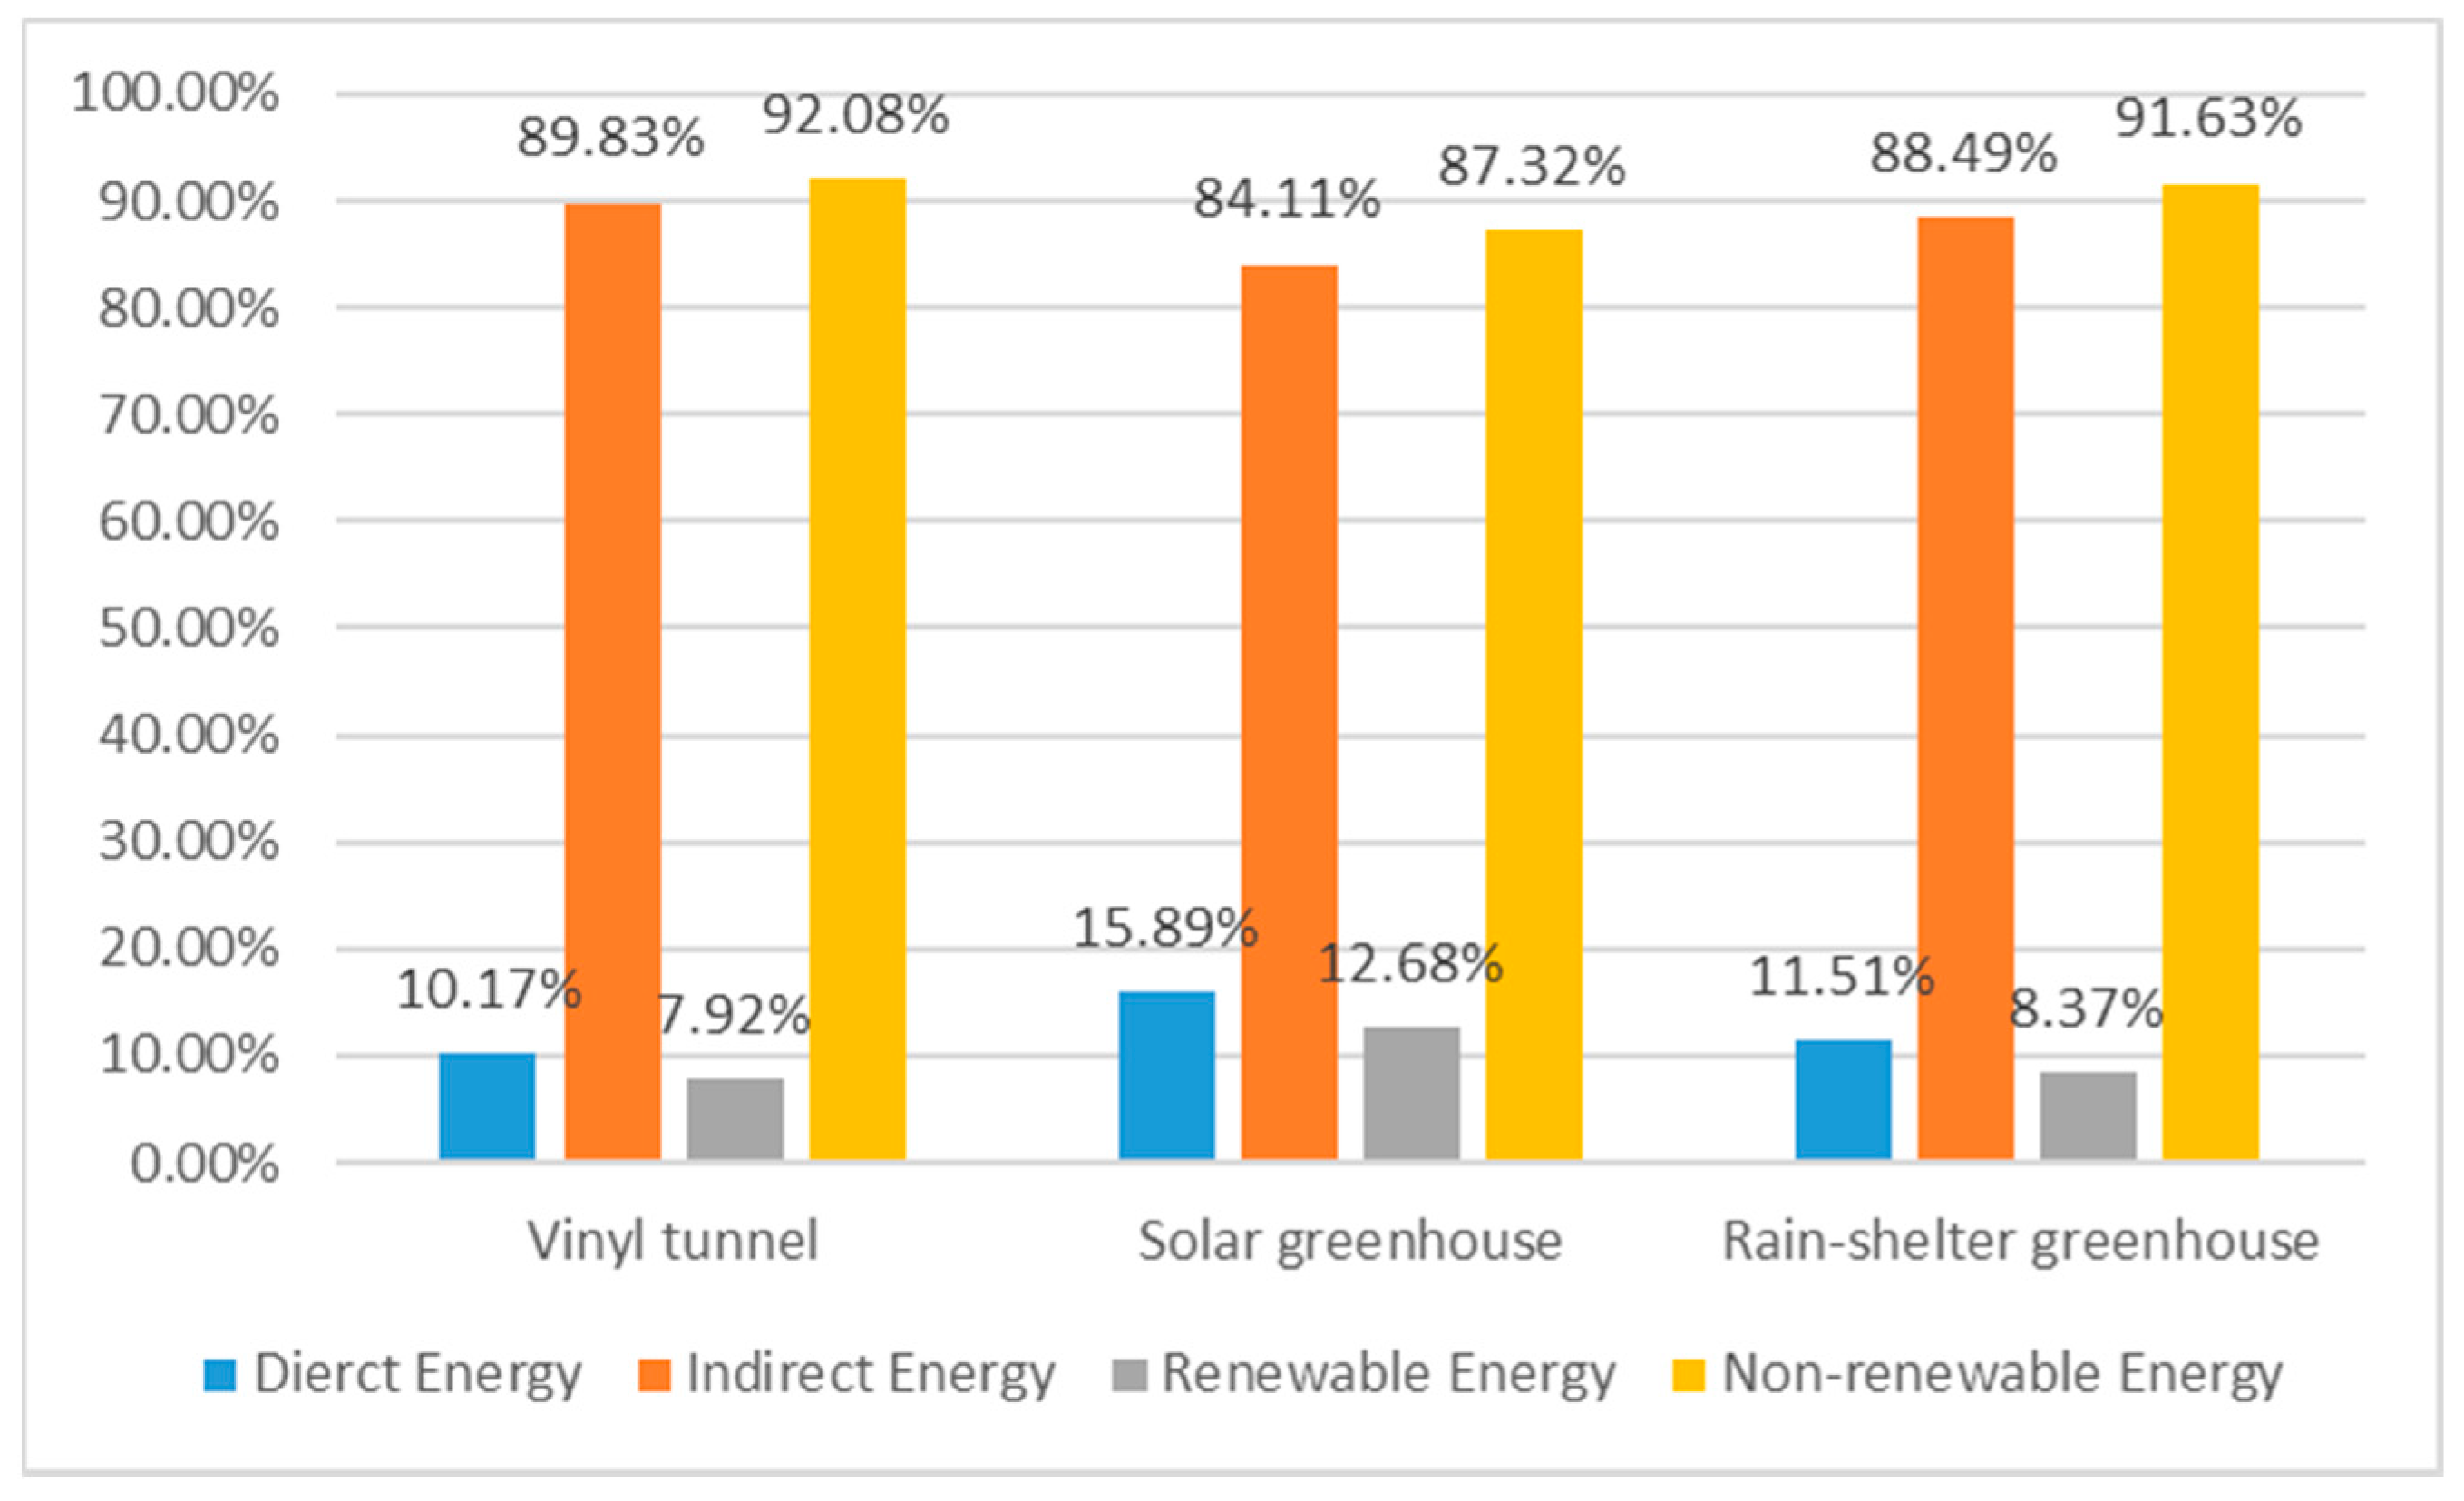
Figure 10.
Energy input comparison of different functional sub-patterns.

Figure 11.
Energy input comparison of different structural sub-pattern.
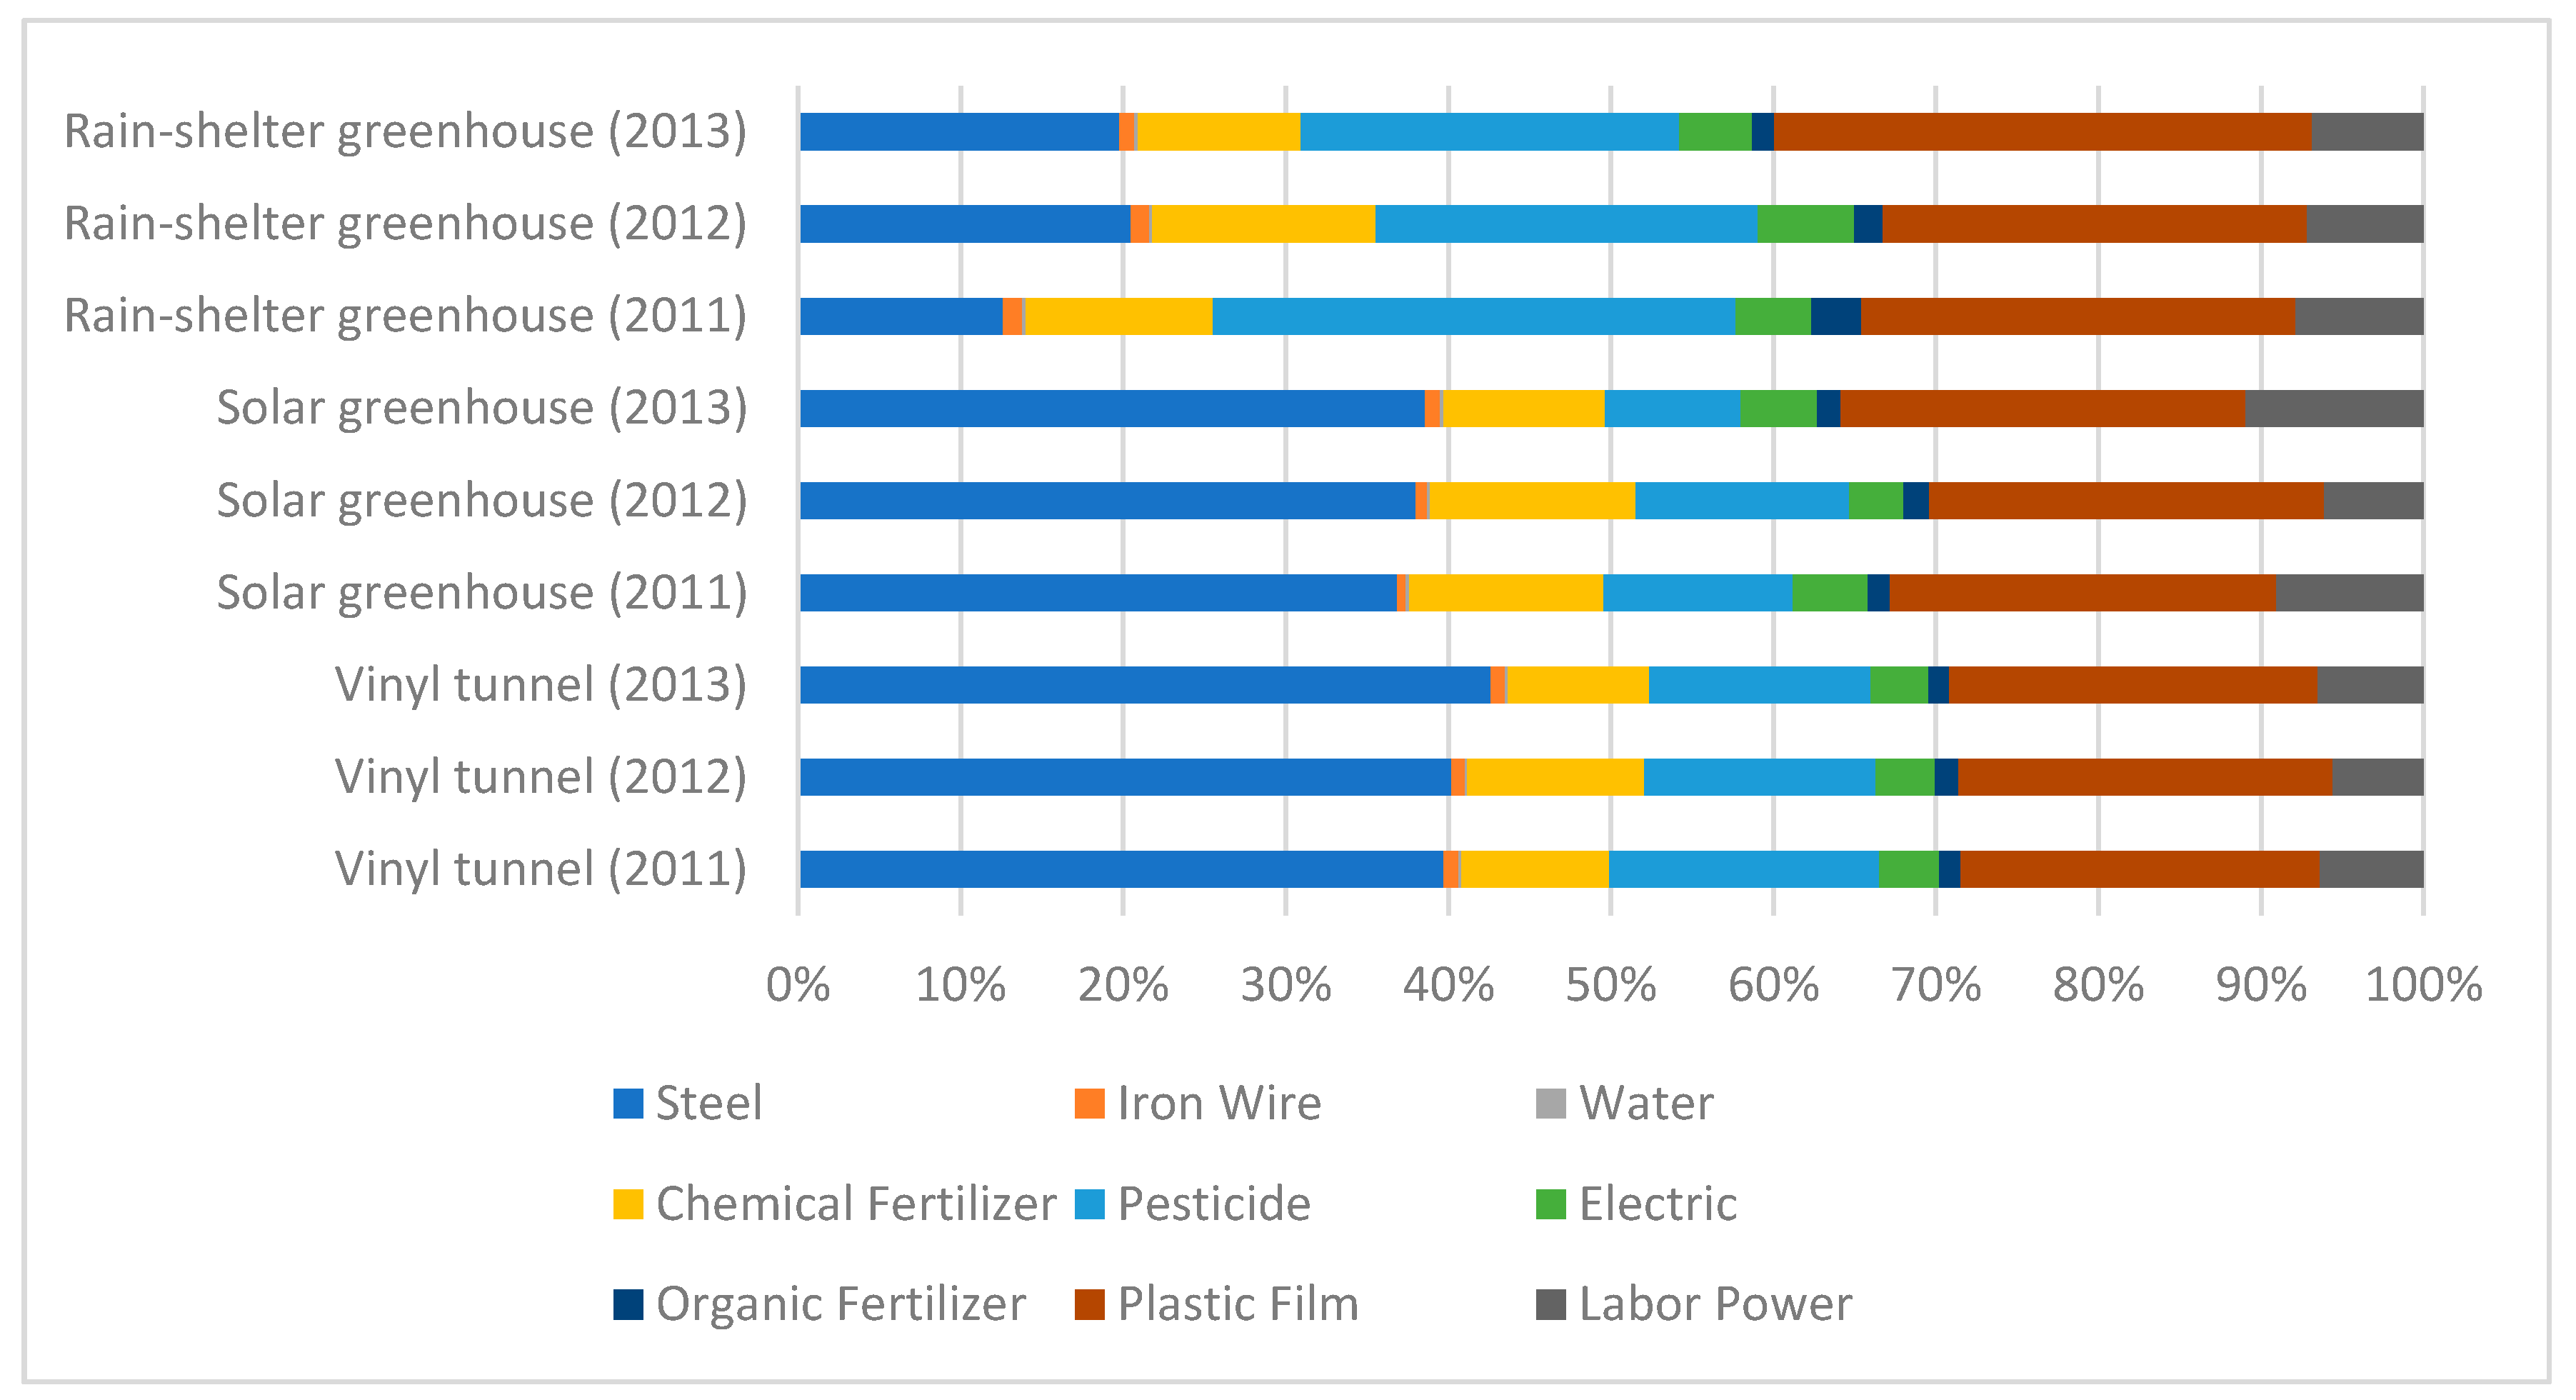
Figure 12.
Spatial distribution of energy input in 2011.

Figure 13.
Spatial distribution of energy input in 2012.
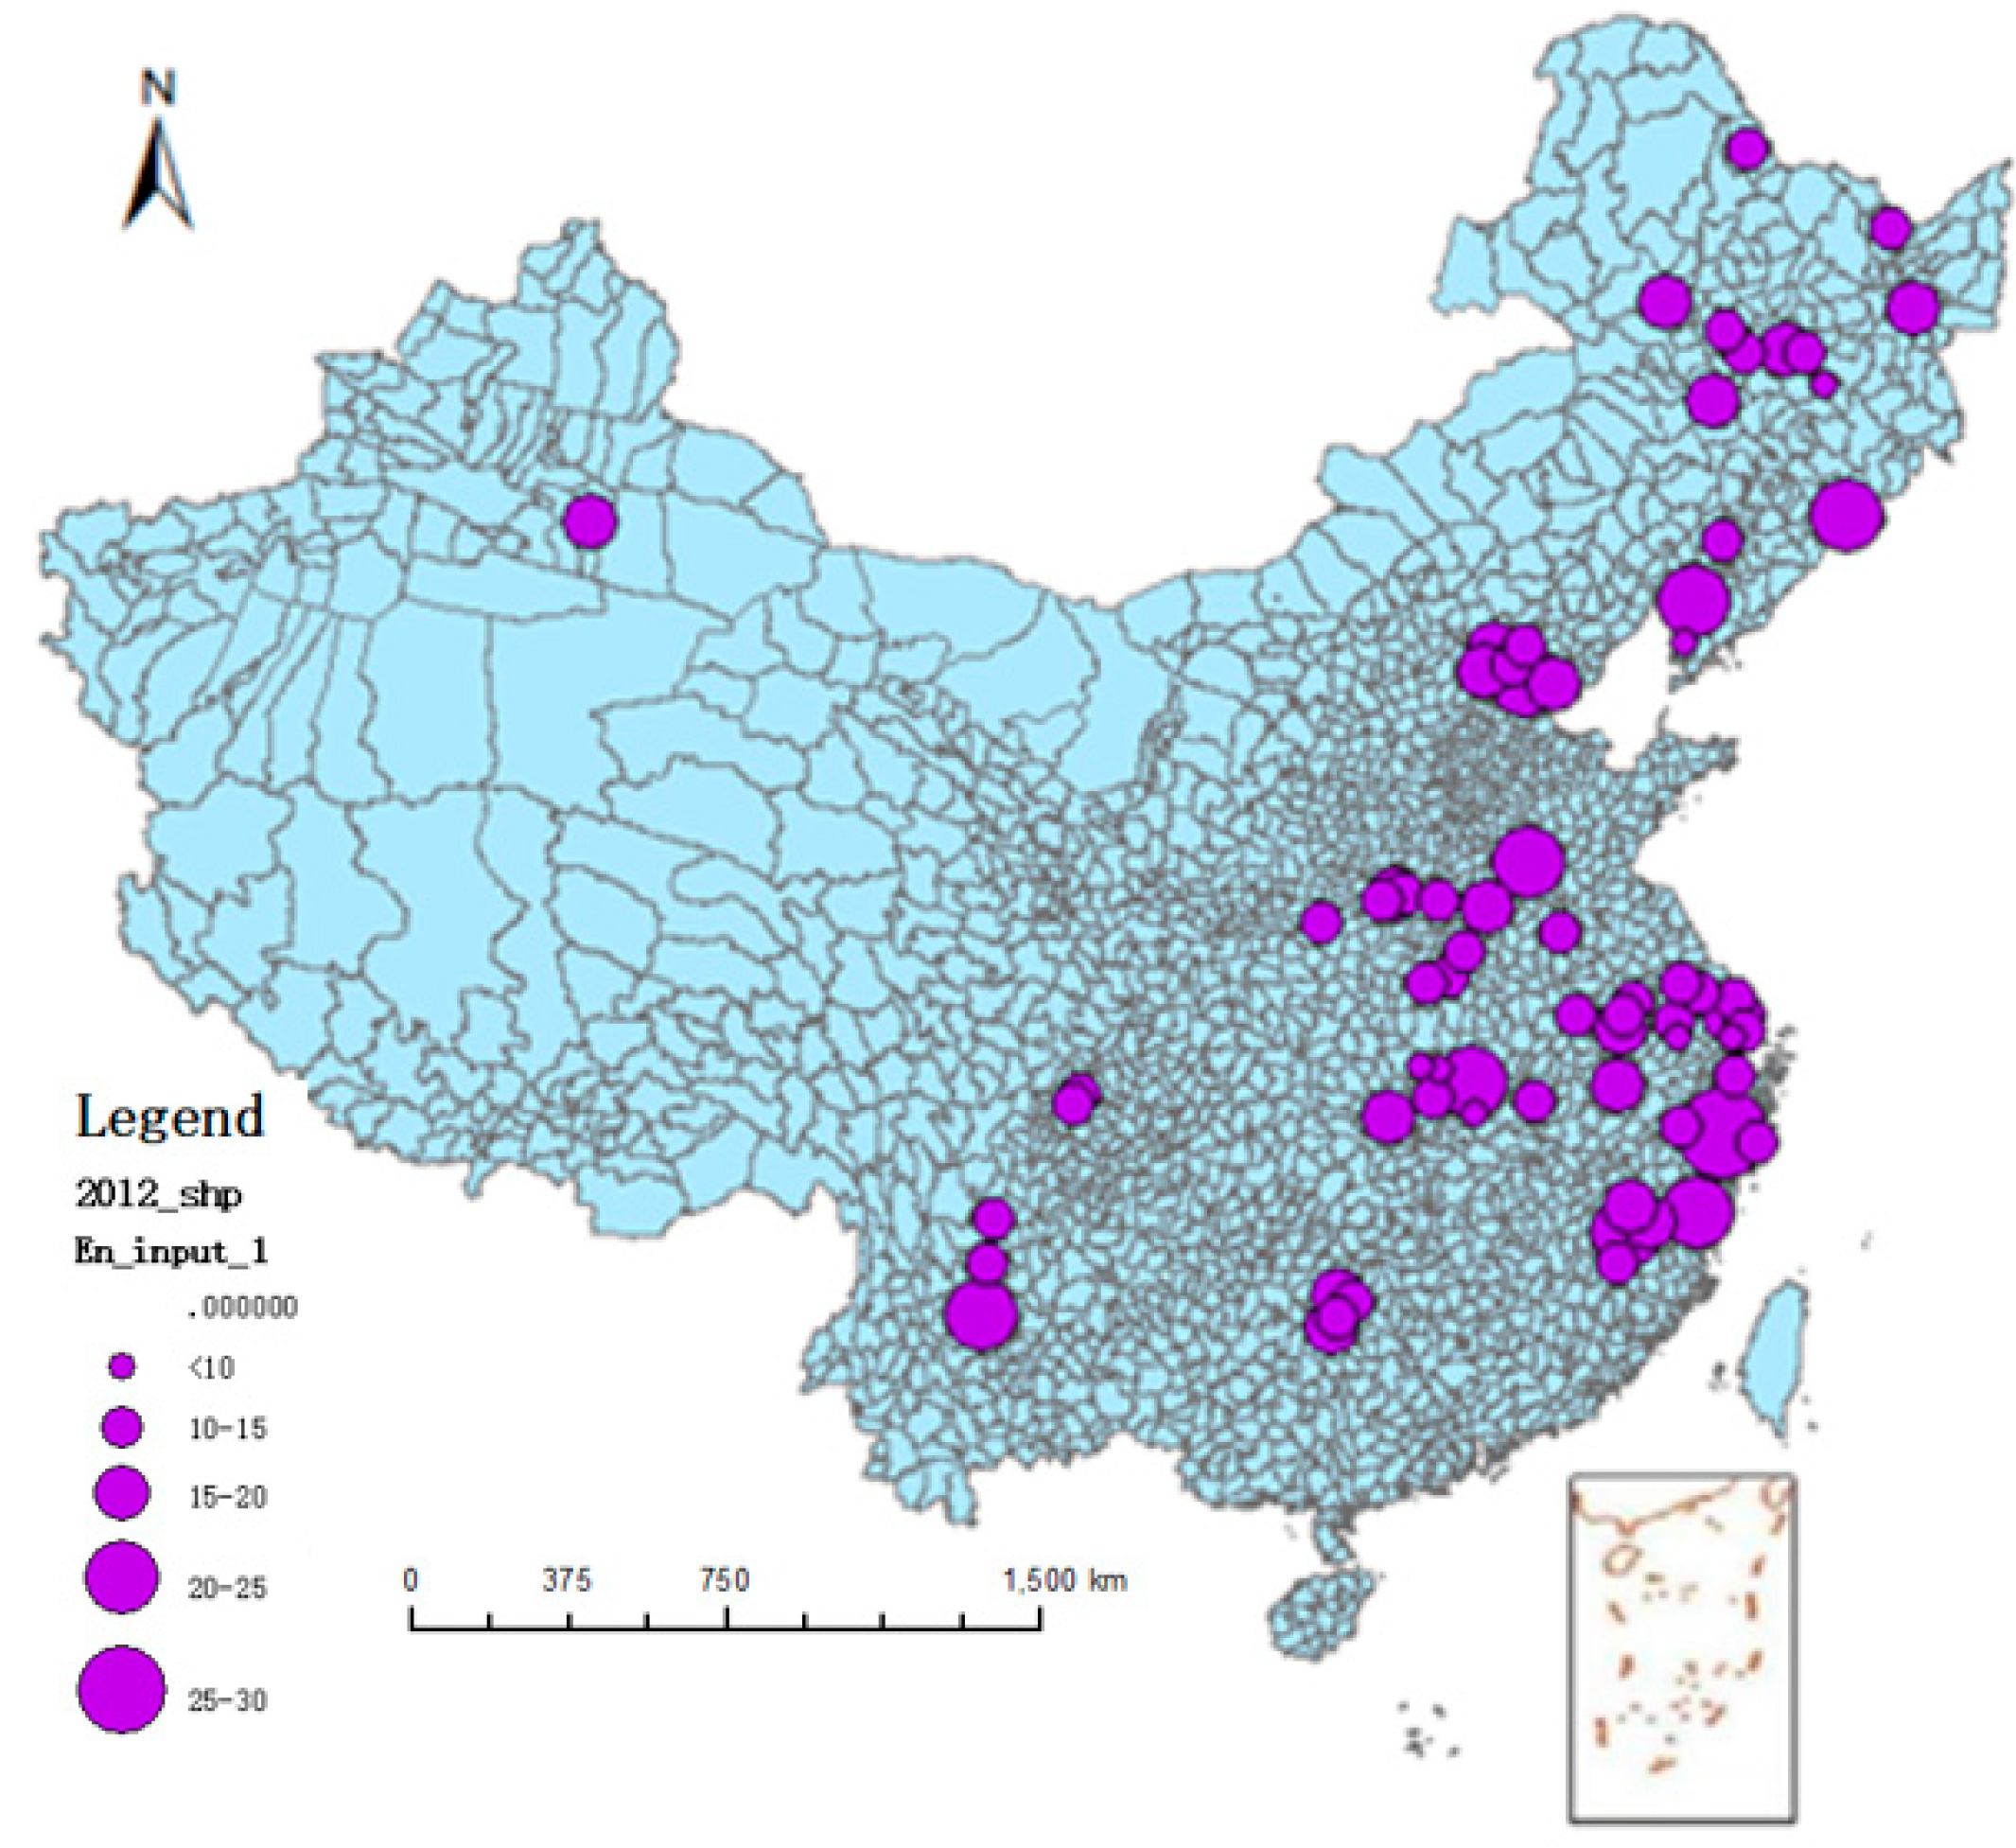
Figure 14.
Spatial distribution of energy input in 2013.
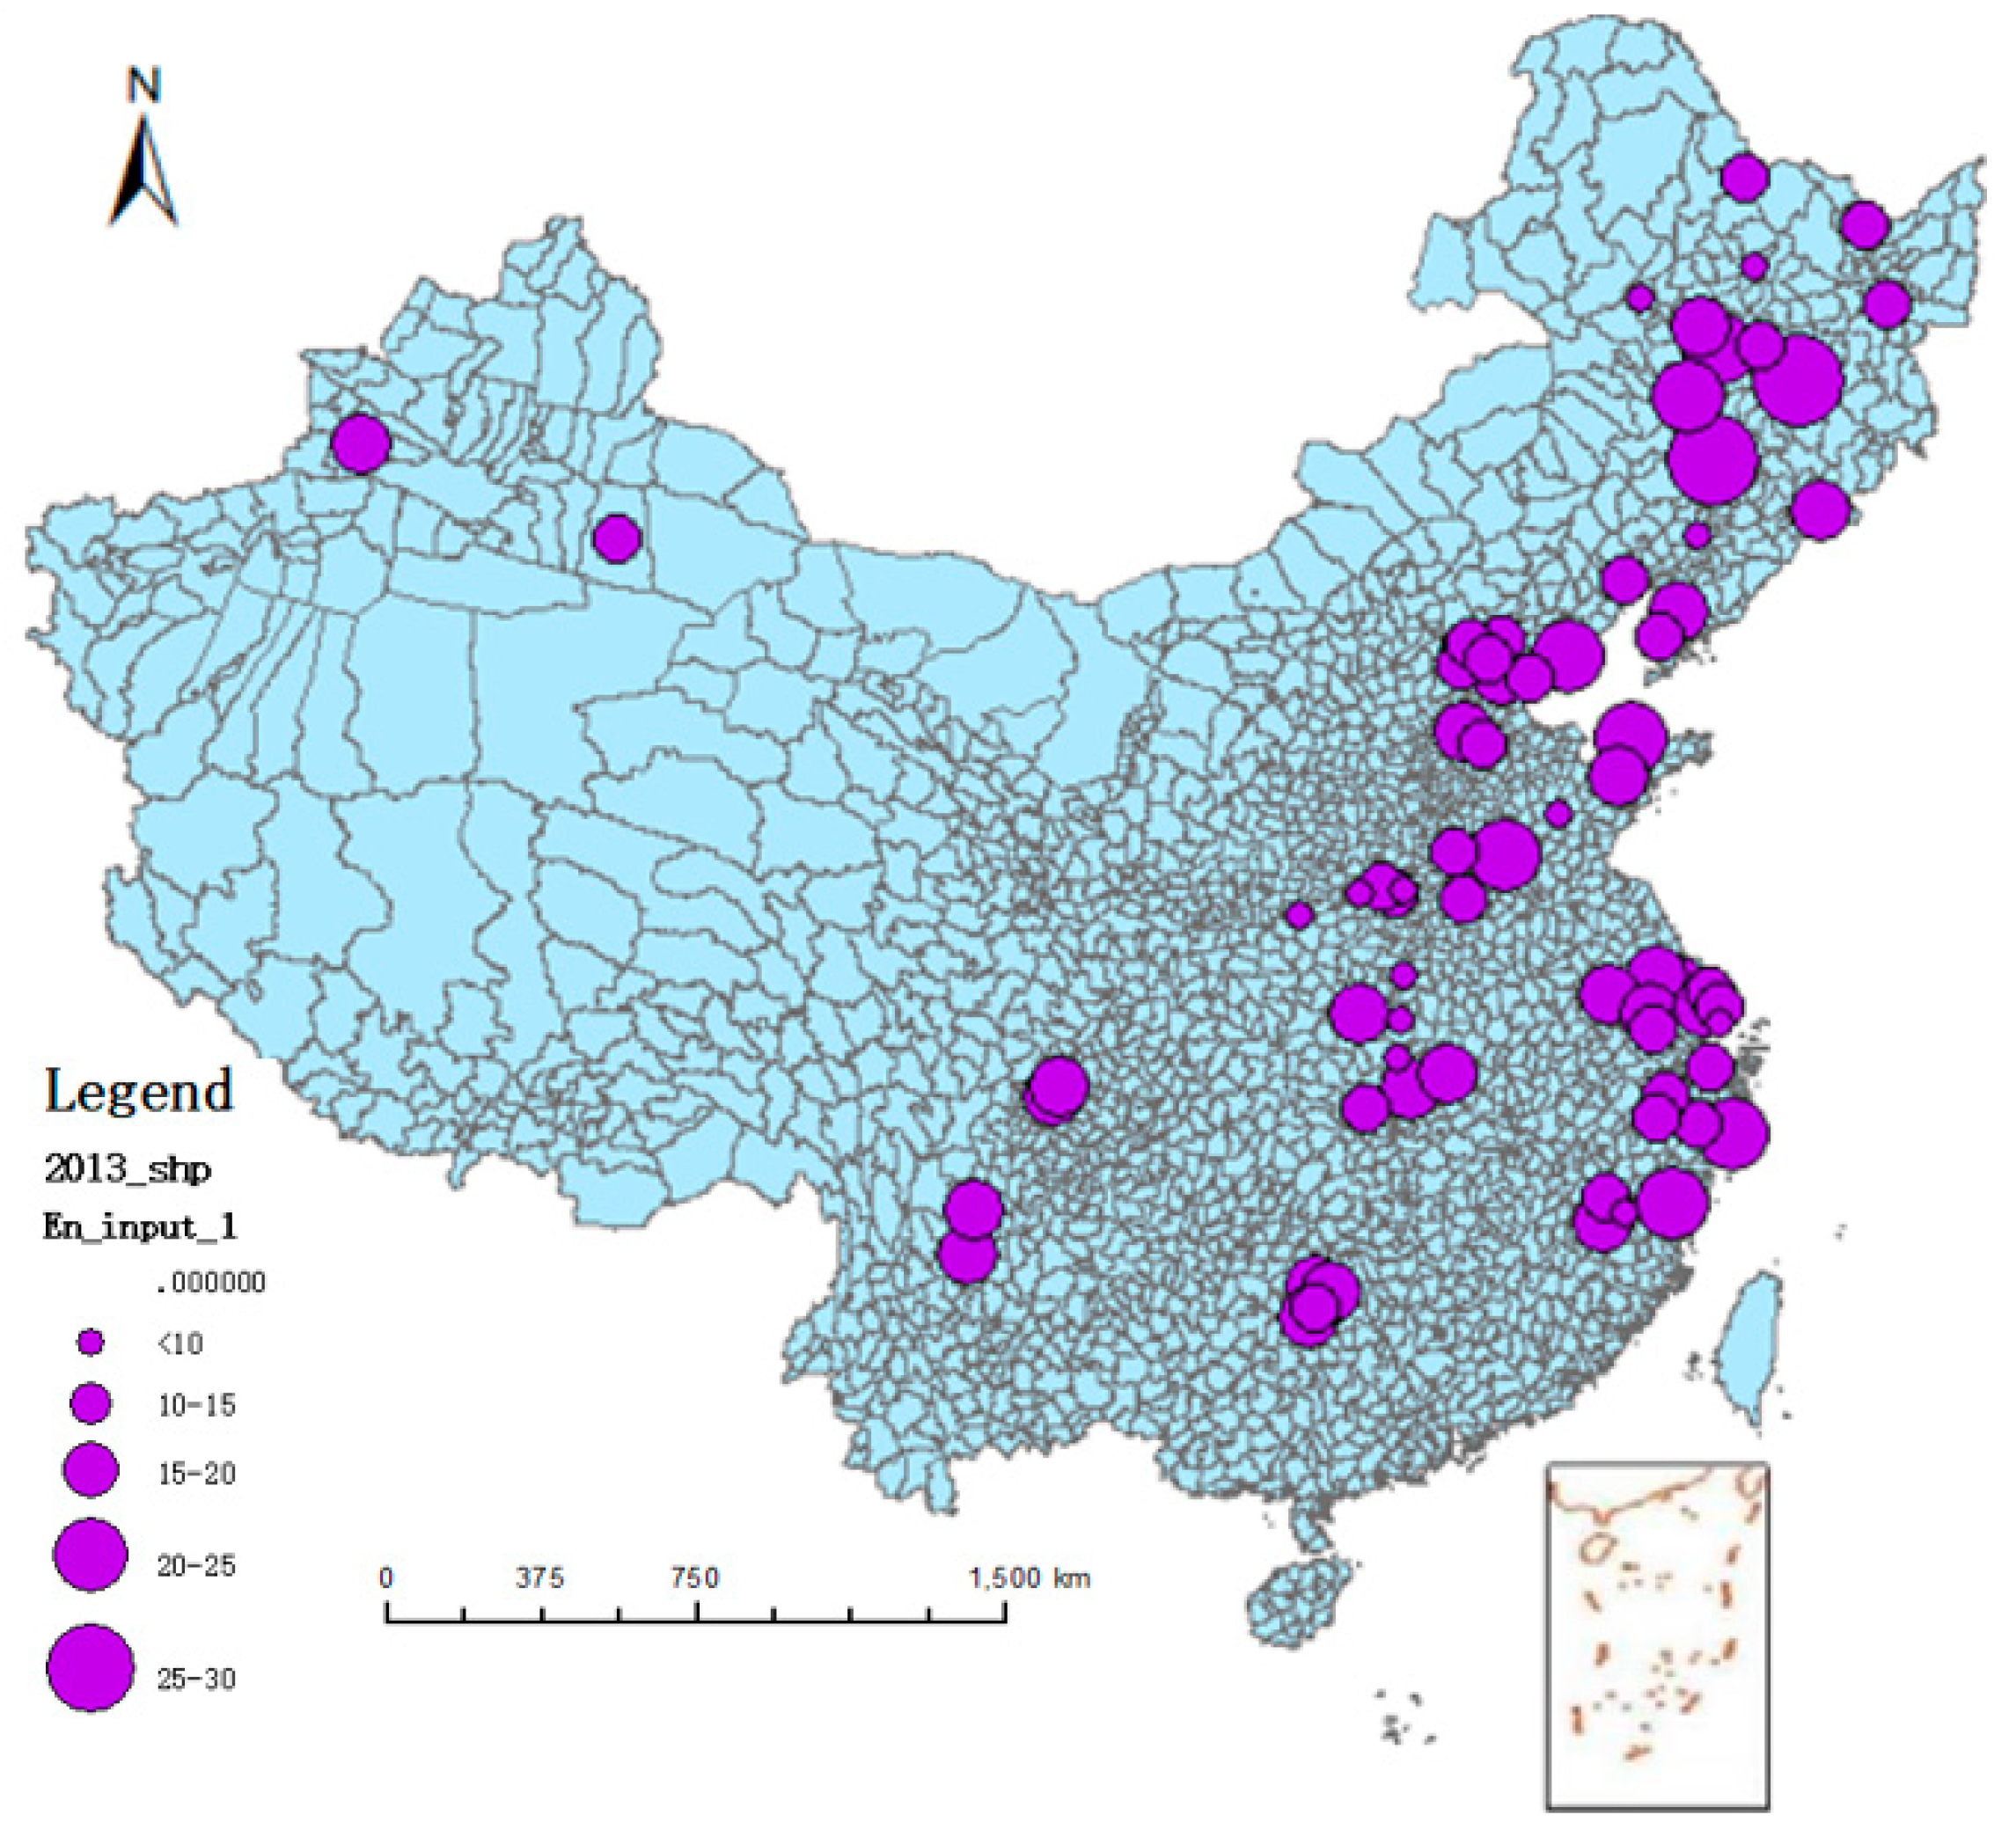
Figure 15.
Local indicators of spatial association (LISA) cluster map of energy input (2011).

Figure 16.
LISA cluster map of energy output (2011).

Figure 17.
LISA cluster map of energy input (2012).
Figure 18.
LISA cluster map of energy output (2012).
Figure 19.
LISA cluster map of energy input (2013).

Figure 20.
LISA cluster map of energy output (2013).

Table 1.
The definition of different protected grape cultivation sub-patterns [3].
Table 1.
The definition of different protected grape cultivation sub-patterns [3].
| Classification Standard | Classified Sub-Pattern | Definition and Description |
|---|---|---|
| Greenhouse structures | Vinyl tunnel | The arched shed is made up of scaffolding and plastic film covering. There is no wall to the north, east, or west, which can make full use of solar energy on all sides. It is applied in China widely. |
| Solar greenhouse | Relies on the sun to maintain the temperature level in the greenhouse to meet the needs of grape growth. Building walls with bricks or adobe in the north, east, and west. It is usually used in the northern region. | |
| Rain-shelter greenhouses | It can be seen as a simpler vinyl tunnel, on the basis of open-field cultivation. A shed structure is added to the grape support, and a plastic film is placed on it to prevent the adverse effects of excessive rain on the growth of the grapes. It is mainly used in the southern region. | |
| Greenhouse Functions | Early ripening production | According to the effect of the covering material for temperature and humidity, the suitable conditions for the growth of the grape are created, so that it can geminate, grow, develop, and mature earlier than in conventional open-field cultivation. |
| Late ripening production | Using a variety of techniques to delay the maturity and harvesting time of grapes. | |
| Rain-shelter production | Using protection facilities to prevent excessive rain from affecting grape growth in yield and quality. |
Table 2.
The energy consumed by protected grape cultivation in 2011, 2012, and 2013 in MJ/ha/year.
| Energy Items | Energy Equivalent | 2011 | 2012 | 2013 | |||
|---|---|---|---|---|---|---|---|
| Mean | SD | Mean | SD | Mean | SD | ||
| Steel | 46,860.80 (Kj/Kg) [26] | 75,681.8 | 50,346.3 | 75,882.9 | 70,232.8 | 80,529.1 | 72,918.9 |
| Iron Wire | 15,815.52 (Kj/Kg) [26] | 1862.0 | 1173.9 | 1833.4 | 1165.3 | 1909.9 | 920.9 |
| Water | 1020 (Kj/m3) [26] | 371.0 | 111.5 | 336.2 | 73.9 | 406.2 | 101.2 |
| Chemical Fertilizer | 38,213.87 (Kj/Kg) [26] | 23,996.3 | 15,174.7 | 25,151.1 | 16,562.6 | 23,809.1 | 14,743.6 |
| Pesticide | 1,020,896.90 (Kj/Kg) [26] | 34,601.8 | 25,817.9 | 33,648.1 | 28,784.7 | 32,026.6 | 25,025.4 |
| Electric | 3598.24 (Kj/KWh) [26] | 8520.9 | 5255.3 | 8581.2 | 5618.9 | 8586.7 | 6026.7 |
| Organic Fertilizer | 300 (Kj/Kg) [27] | 3336.1 | 1678.7 | 3254.3 | 1855.5 | 3238.6 | 1732.4 |
| Plastic Film | 51,931.81 (Kj/Kg) [26] | 48,597.7 | 18,225.7 | 50,543.0 | 17,180.4 | 58,269.2 | 15,779.9 |
| Labor Power | 12,600 (Kj/d) [27] | 13,566.7 | 27,684.1 | 12,274.4 | 12,869.2 | 13,796.4 | 12,665.2 |
| Total Input | -- | 210,534.3 | 66,482.9 | 211,504.6 | 89,254.6 | 222,571.8 | 82,674.2 |
| Total Output | 2205.80 (Kj/Kg) [26] | 48,894.7 | 16,859.7 | 53,304.2 | 26,002.8 | 51,630.0 | 20,455.5 |
Table 3.
Comparison of energy input and output (MJ/ha).
| Production System | Energy Input | Energy Output | Reference | |
|---|---|---|---|---|
| Country | Grape in China | 222,572 | 51,630 | -- |
| Grape in Turkey | 24,510 | 73,396 | [12] | |
| Grape in Iran | 45,303 | 181,066 | [14] | |
| Fruit | Cherry | 48,667 | 88,922 | [28] |
| Apple | 42,819 | 49,857 | [29] | |
| Almond | 62,483 | 140,200 | [30] | |
| Tangerine | 62,261 | 54,060 | [31] |
Table 4.
The energy consumption of different cultivation functions in 2011, 2012, and 2013 (MJ/ha/year).
Table 4.
The energy consumption of different cultivation functions in 2011, 2012, and 2013 (MJ/ha/year).
| Input Index | Statistical Parameter | 2011 | 2012 | 2013 | ||||||
|---|---|---|---|---|---|---|---|---|---|---|
| Early Ripening Production | Late Ripening Production | Rain-Shelter Production | Early Ripening Production | Late Ripening Production | Rain-Shelter Production | Early Ripening Production | Late Ripening Production | Rain-Shelter Production | ||
| Steel | SD | 55,392 | 28,023 | 56,411 | 60,796 | 38,008 | 80,824 | 91,219 | 33,318 | 47,496 |
| Variance | 0.005 | 0.00 | 0.00 | |||||||
| Iron Wire | SD | 1053 | 1530 | 1824 | 849 | 922 | 1692 | 1078 | 748 | 571 |
| Variance | 0.416 | 0.669 | 0.086 | |||||||
| Water | SD | 108 | 103 | 126 | 83 | 43 | 41 | 97 | 104 | 72 |
| Variance | 0.070 | 0.00 | 0.201 | |||||||
| Chemical Fertilizer | SD | 14,098 | 15,427 | 13,394 | 16,474 | 11,141 | 19,140 | 14,734 | 11,871 | 12,086 |
| Variance | 0.720 | 0.543 | 0.00 | |||||||
| Pesticide | SD | 23,310 | 15,745 | 31,409 | 31,315 | 16,096 | 29,188 | 21,781 | 25,019 | 39,204 |
| Variance | 0.410 | 0.021 | 0.494 | |||||||
| Electric | SD | 5813 | 3182 | 4385 | 5579 | 494 | 6858 | 5948 | 5175 | 4297 |
| Variance | 0.087 | 0.001 | 0.078 | |||||||
| Organic Fertilizer | SD | 1754 | 1126 | 2000 | 1904 | 1514 | 1625 | 1830 | 938 | 1814 |
| Variance | 0.197 | 0.00 | 0.00 | |||||||
| Plastic Film | SD | 17,239 | 10,835 | 18,255 | 16,248 | 19,055 | 15,840 | 17,291 | 6986 | 20,736 |
| Variance | 0.003 | 0.00 | 0.0032 | |||||||
| Labor Power | SD | 18,941 | 6192 | 7394 | 16,091 | 2388 | 7748 | 16,421 | 5736 | 7266 |
| Variance | 0.265 | 0.033 | 0.001 | |||||||
| Total Input | Mean | 221,742 | 176,184 | 177,870 | 224,567 | 206,735 | 160,381 | 234,866 | 237,953 | 171,528 |
| SD | 66,722 | 32,904 | 50,957 | 80,278 | 53,166 | 100,980 | 104,016 | 38,762 | 12,009 | |
| Variance | 0.001 | 0.00 | 0.001 | |||||||
| Total Output | Mean | 49,037 | 44,998 | 44,827 | 54,639 | 56,088 | 51,203 | 53,822 | 40,962 | 51,809 |
| SD | 16,291 | 2718 | 15,060 | 32,297 | 10,995 | 34,733 | 21,014 | 11,075 | 16,571 | |
| Variance | 0.329 | 0.641 | 0.000 | |||||||
Table 5.
The energy consumption of different cultivation structures in 2011, 2012, and 2013 (MJ/ha/year).
Table 5.
The energy consumption of different cultivation structures in 2011, 2012, and 2013 (MJ/ha/year).
| Input Index | Statistical Parameter | 2011 | 2012 | 2013 | ||||||
|---|---|---|---|---|---|---|---|---|---|---|
| Vinyl Tunnel | Solar Greenhouse | Rain-Shelter Greenhouse | Vinyl Tunnel | Solar Greenhouse | Rain-Shelter Greenhouse | Vinyl Tunnel | Solar Greenhouse | Rain-Shelter Greenhouse | ||
| Steel | SD | 56,859 | 24,558 | 57,660 | 71,158 | 45,822 | 65,329 | 97,289 | 46,489 | 50,324 |
| Variance | 0.00 | 0.00 | 0.00 | |||||||
| Iron Wire | SD | 1476 | 346 | 1042 | 1346 | 708 | 958 | 1109 | 898 | 725 |
| Variance | 0.041 | 0.325 | 0.08 | |||||||
| Water | SD | 114 | 81 | 142 | 79 | 69 | 39 | 97 | 104 | 85 |
| Variance | 0.067 | 0.00 | 0.611 | |||||||
| Chemical Fertilizer | SD | 14,047 | 13,414 | 5720 | 16,228 | 11,999 | 16,439 | 15,878 | 11,937 | 14,102 |
| Variance | 0.172 | 0.071 | 0.519 | |||||||
| Pesticide | SD | 21,638 | 18,731 | 35,462 | 31,215 | 15,939 | 29,656 | 23,329 | 11,454 | 34,916 |
| Variance | 0.013 | 0.355 | 0.002 | |||||||
| Electric | SD | 5122 | 7128 | 3363 | 4989 | 5143 | 6984 | 5621 | 6261 | 4680 |
| Variance | 0.273 | 0.191 | 0.731 | |||||||
| Organic Fertilizer | SD | 1706 | 918 | 2024 | 2008 | 1717 | 1477 | 1709 | 2411 | 2008 |
| Variance | 0.00 | 0.065 | 0.113 | |||||||
| Plastic Film | SD | 17,778 | 16,524 | 20,374 | 17,211 | 15,016 | 15,725 | 16,452 | 18,855 | 20,808 |
| Variance | 0.131 | 0.00 | 0.106 | |||||||
| Labor Power | SD | 18,544 | 31,488 | 9034 | 15,521 | 19,390 | 8374 | 16,599 | 12,919 | 8150 |
| Variance | 0.506 | 0.657 | 0.062 | |||||||
| Total Input | Mean | 222,893 | 176,184 | 177,870 | 224,567 | 206,735 | 160,381 | 234,866 | 237,953 | 171,528 |
| SD | 67,738 | 62,675 | 72,169 | 89,263 | 59,483 | 93,268 | 108,397 | 62,257 | 69,124 | |
| Variance | 0.00 | 0.00 | 0.001 | |||||||
| Total Output | Mean | 47,442 | 47,590 | 50,261 | 56,341 | 48,053 | 51,203 | 54,215 | 51,764 | 55,903 |
| SD | 15,430 | 21,640 | 14,217 | 30,529 | 18,199 | 17,714 | 20,347 | 25,109 | 16,091 | |
| Variance | 0.767 | 0.126 | 0.751 | |||||||
Table 6.
Global correlation analysis of protected grape energy input from 2011 to 2013.
| 2011 | 2012 | 2013 | ||||
|---|---|---|---|---|---|---|
| Index | Energy input | Energy output | Energy input | Energy output | Energy input | Energy output |
| Global Moran’s I | 0.039 | 0.048 | 0.056 | 0.065 | 0.045 | 0.035 |
| P | 0.03 | <1% | <1% | <1% | <1% | <1% |
| Z | 2.904 | 3.587 | 4.177 | 4.810 | 3.331 | 2.601 |
The Z-value is used to test the significant degree of spatial correlation. If , it shows the global Moran’s I is significant at the 1% significance level, and when , it shows the positive spatial autocorrelation; , indicates negative spatial autocorrelation.
© 2018 by the authors. Licensee MDPI, Basel, Switzerland. This article is an open access article distributed under the terms and conditions of the Creative Commons Attribution (CC BY) license (http://creativecommons.org/licenses/by/4.0/).
Share and Cite
MDPI and ACS Style
Tian, D.; Zhang, M.; Wei, X.; Wang, J.; Mu, W.; Feng, J. GIS-Based Energy Consumption and Spatial Variation of Protected Grape Cultivation in China. Sustainability 2018, 10, 3248. https://doi.org/10.3390/su10093248
AMA Style
Tian D, Zhang M, Wei X, Wang J, Mu W, Feng J. GIS-Based Energy Consumption and Spatial Variation of Protected Grape Cultivation in China. Sustainability. 2018; 10(9):3248. https://doi.org/10.3390/su10093248
Chicago/Turabian StyleTian, Dong, Min Zhang, Xuejian Wei, Jing Wang, Weisong Mu, and Jianying Feng. 2018. "GIS-Based Energy Consumption and Spatial Variation of Protected Grape Cultivation in China" Sustainability 10, no. 9: 3248. https://doi.org/10.3390/su10093248
Note that from the first issue of 2016, this journal uses article numbers instead of page numbers. See further details here.