3.2. Control Group Selection and Treatment Effects Estimation
We synthesized a counter-factual China to uncover a hypothetical outcome in the absence of interventions to the “One Belt, One Road” initiative. Nations that display strong correlations should share common latent factors; we, thus, apply Equation (1) to estimate the correlations between the treatment and control nations based on pre-treatment data.
In selection of control economies, we looked for those that not only share common factors with the Chinese economy, but are also relatively independent of the OBOR in the post-treatment period 2014q1–2018q1. More specifically, to examine the trade relationships between China and potential control economies and to satisfy the assumption of policy intervention exogenesis to the control group [
15]. Common time-varying factors
, individual specific effects
and a random component
drive trade balances varying over time in Equation (1). We assume that idiosyncratic components
and
are uncorrelated across countries. Lasso2 package in Stata/MP 13.1, developed by Ahrens et al. in early 2018, was used. Lasso2 package is a program for Lasso, Square-Root Lasso, Elastic-Net, Ridge, Adaptive Lasso and Post-estimation Ordinary Least Square (available at
http://ideas.repec.org/c/boc/bocode/s458458.html).
Countries such as Australia and New Zealand do not hesitate in participating in Chinese initiatives, which are also welcomed by China’s Asian neighbors. We, thus, exclude these participants and the neighboring countries as control units, to avoid treatment contamination. Applying the Elastic-Net method, the machinery learning selection results identify the select countries: Columbia, UK, Romania, Swiss, Egypt, Austria, Ecuador, Nigeria, Finland, Chile, Israel, Bolivia, Czech Republic, Iceland, Bulgaria, Sweden, Georgia, Holland, Lebanon, Tunisia, Jordan, Peru, Malta, Azerbaijan, Hungary, Sri Lanka, India, Luxembourg, Russia, Uruguay, Turkey, Estonia, Norway, Portugal and France, which is consistent with our illustrated artificial selection criteria.
In another counter-factual analysis study, Billmeier et al. [
18] adopted the synthetic control approach to describe the trade-liberalization effects. They included Asian countries such as India, Pakistan, Nepal, Philippines, Bangladesh, Nepal, China; African countries such as Morocco, Nigeria, Rwanda, South Africa, Ivory Coast, Cameroon, Uruguay, Zambia, Zimbabwe, Egypt, Tunisia; and Latin American countries such as Argentina, Colombia, Costa Rica, Chile, Paraguay, Peru and Brazil in the control group to synthesize developed Asian countries such as South Korea, Japan, and Singapore. Unlike their selection criteria, our control group is majorly composed of East European countries. Focusing on our research objective and also taking reality into account, Asian countries near China that have active trading partnerships were removed from the control group. Meanwhile, the rational of selecting a control group is to keep them clear of policy contamination, and thus it is best to choose remote countries to synthesize a counter-factual China.
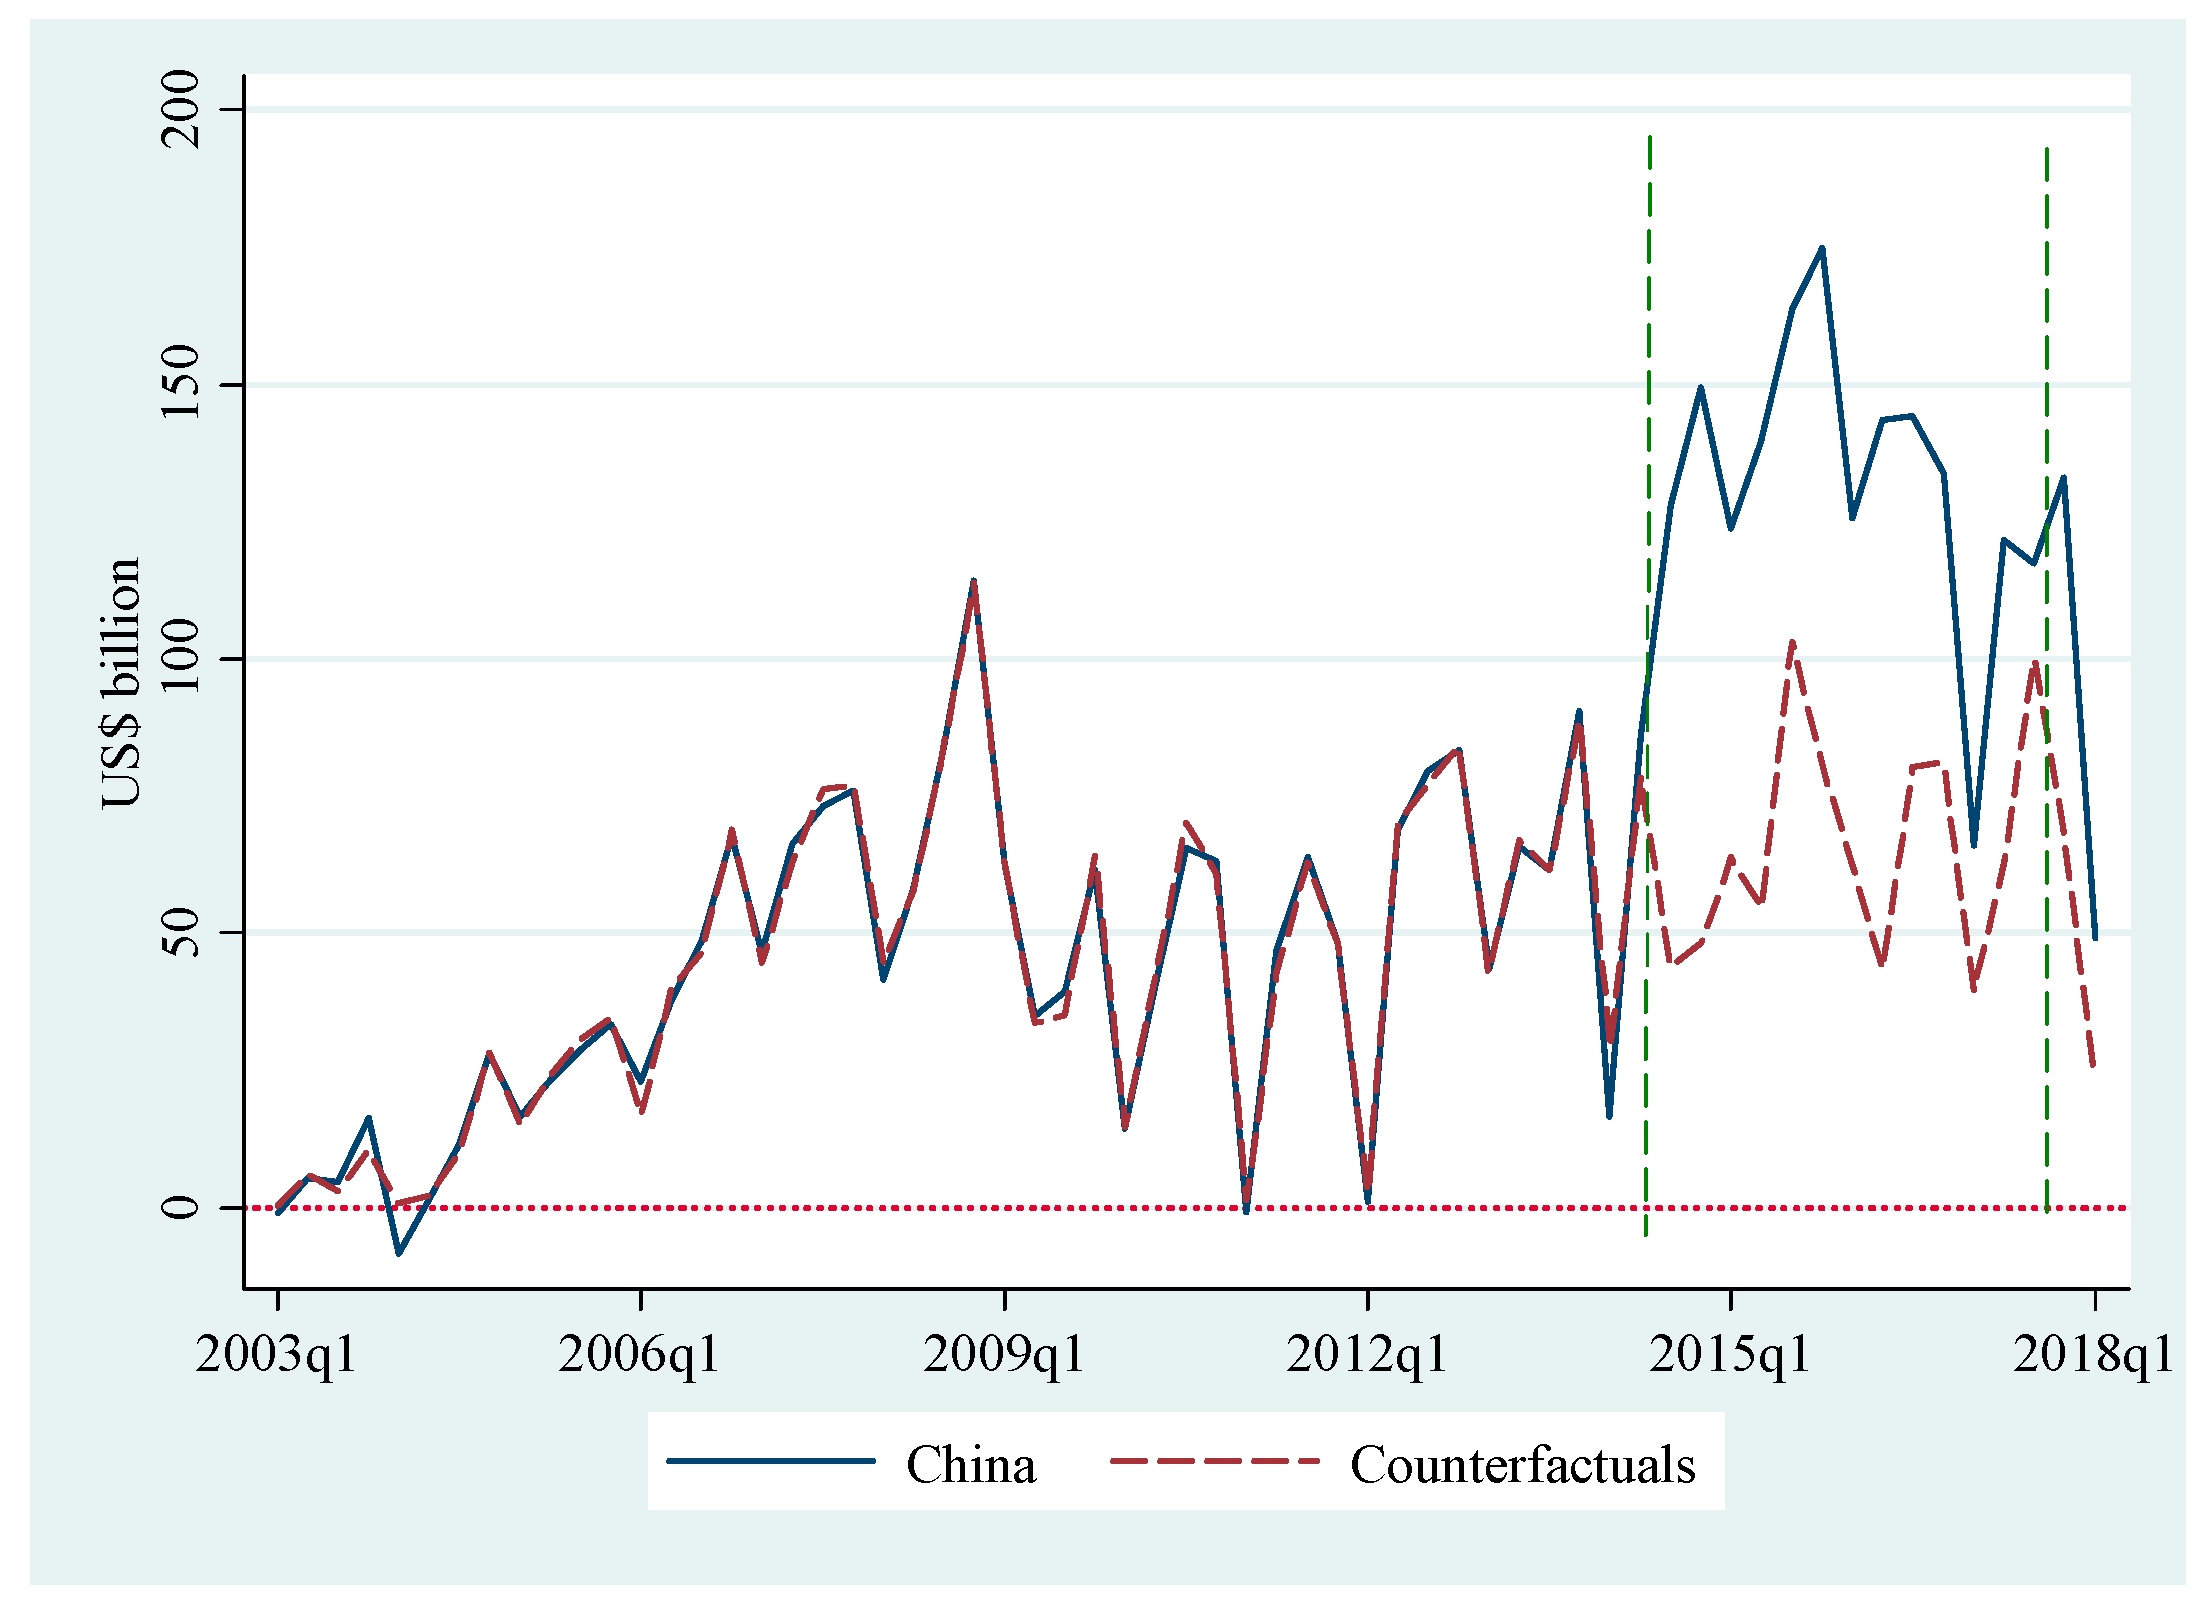
The trade surplus of China appears to be well approximated by the chosen controls before treatment. Our real data analysis below (
Figure 1) confirms this point. The control group produces a counter-factual path that closely traces the actual path of China before the implementation of the OBOR initiative with a
of 0.9478. The OLS estimated weights are listed in
Table 1, the estimated counterfactuals of China before the policy intervention are listed in
Table 2; we have only listed statistics of the last quarter in each year for counterfactuals before treatment (
Table 2).
The counterfactuals of China, constructed on the control group after the OBOR initiative was implemented, are reported in
Table 3; the estimated quarterly treatment effects are simply the difference of the actuals and the counterfactuals. Statistics summary of treatment effects listed in
Table 3 are highly positive. The pre- and post-intervention actual and predicted outcomes with a significant gap are plotted in
Figure 1.
In
Figure 1, the hypothetical line tracks the solid line quite closely before treatment, suggesting a good fit by estimation settings. Starting from the treatment quarter, the hypothetical line separates from the actual line: actual growth moves above the hypothetical counterfactual trade balance, implying that there is positive treatment effect.
Four years after the initiative was announced, the actual trade surplus averaged at 130 billion US$; the estimated counterfactual trade surplus of China in the absence of the OBOR is about 60 billion US$ quarterly, on average. The treatment effect of the initiative would be valued as doubling Chinese net exports.
Several remarks should be made regarding the timing of the treatment effects. The hypothetical line moves close to the solid line and tracks it closely again towards the end of 2017 (on the right side of the second dashed vertical line), suggesting that the treatment effect is getting weaker due to the recent trade war. Our estimates suggest that, in the absence of this enormous trade promotion, net exports could be cut in half with President Trump initiating the US-Sino trade war in 2017. Although trade surplus showed a declining trend in the beginning of 2018, there is no reason to believe that the influence of the OBOR economic integration cannot last in the long-run. Greater openness could have a profound influence on this developing country.
3.3. Robustness Check
This section evaluates the effects of OBOR on China’s exports growth rate. For a robustness check, we continue to use the same control group and experimental period, and then construct counterfactuals again to investigate treatment effects.
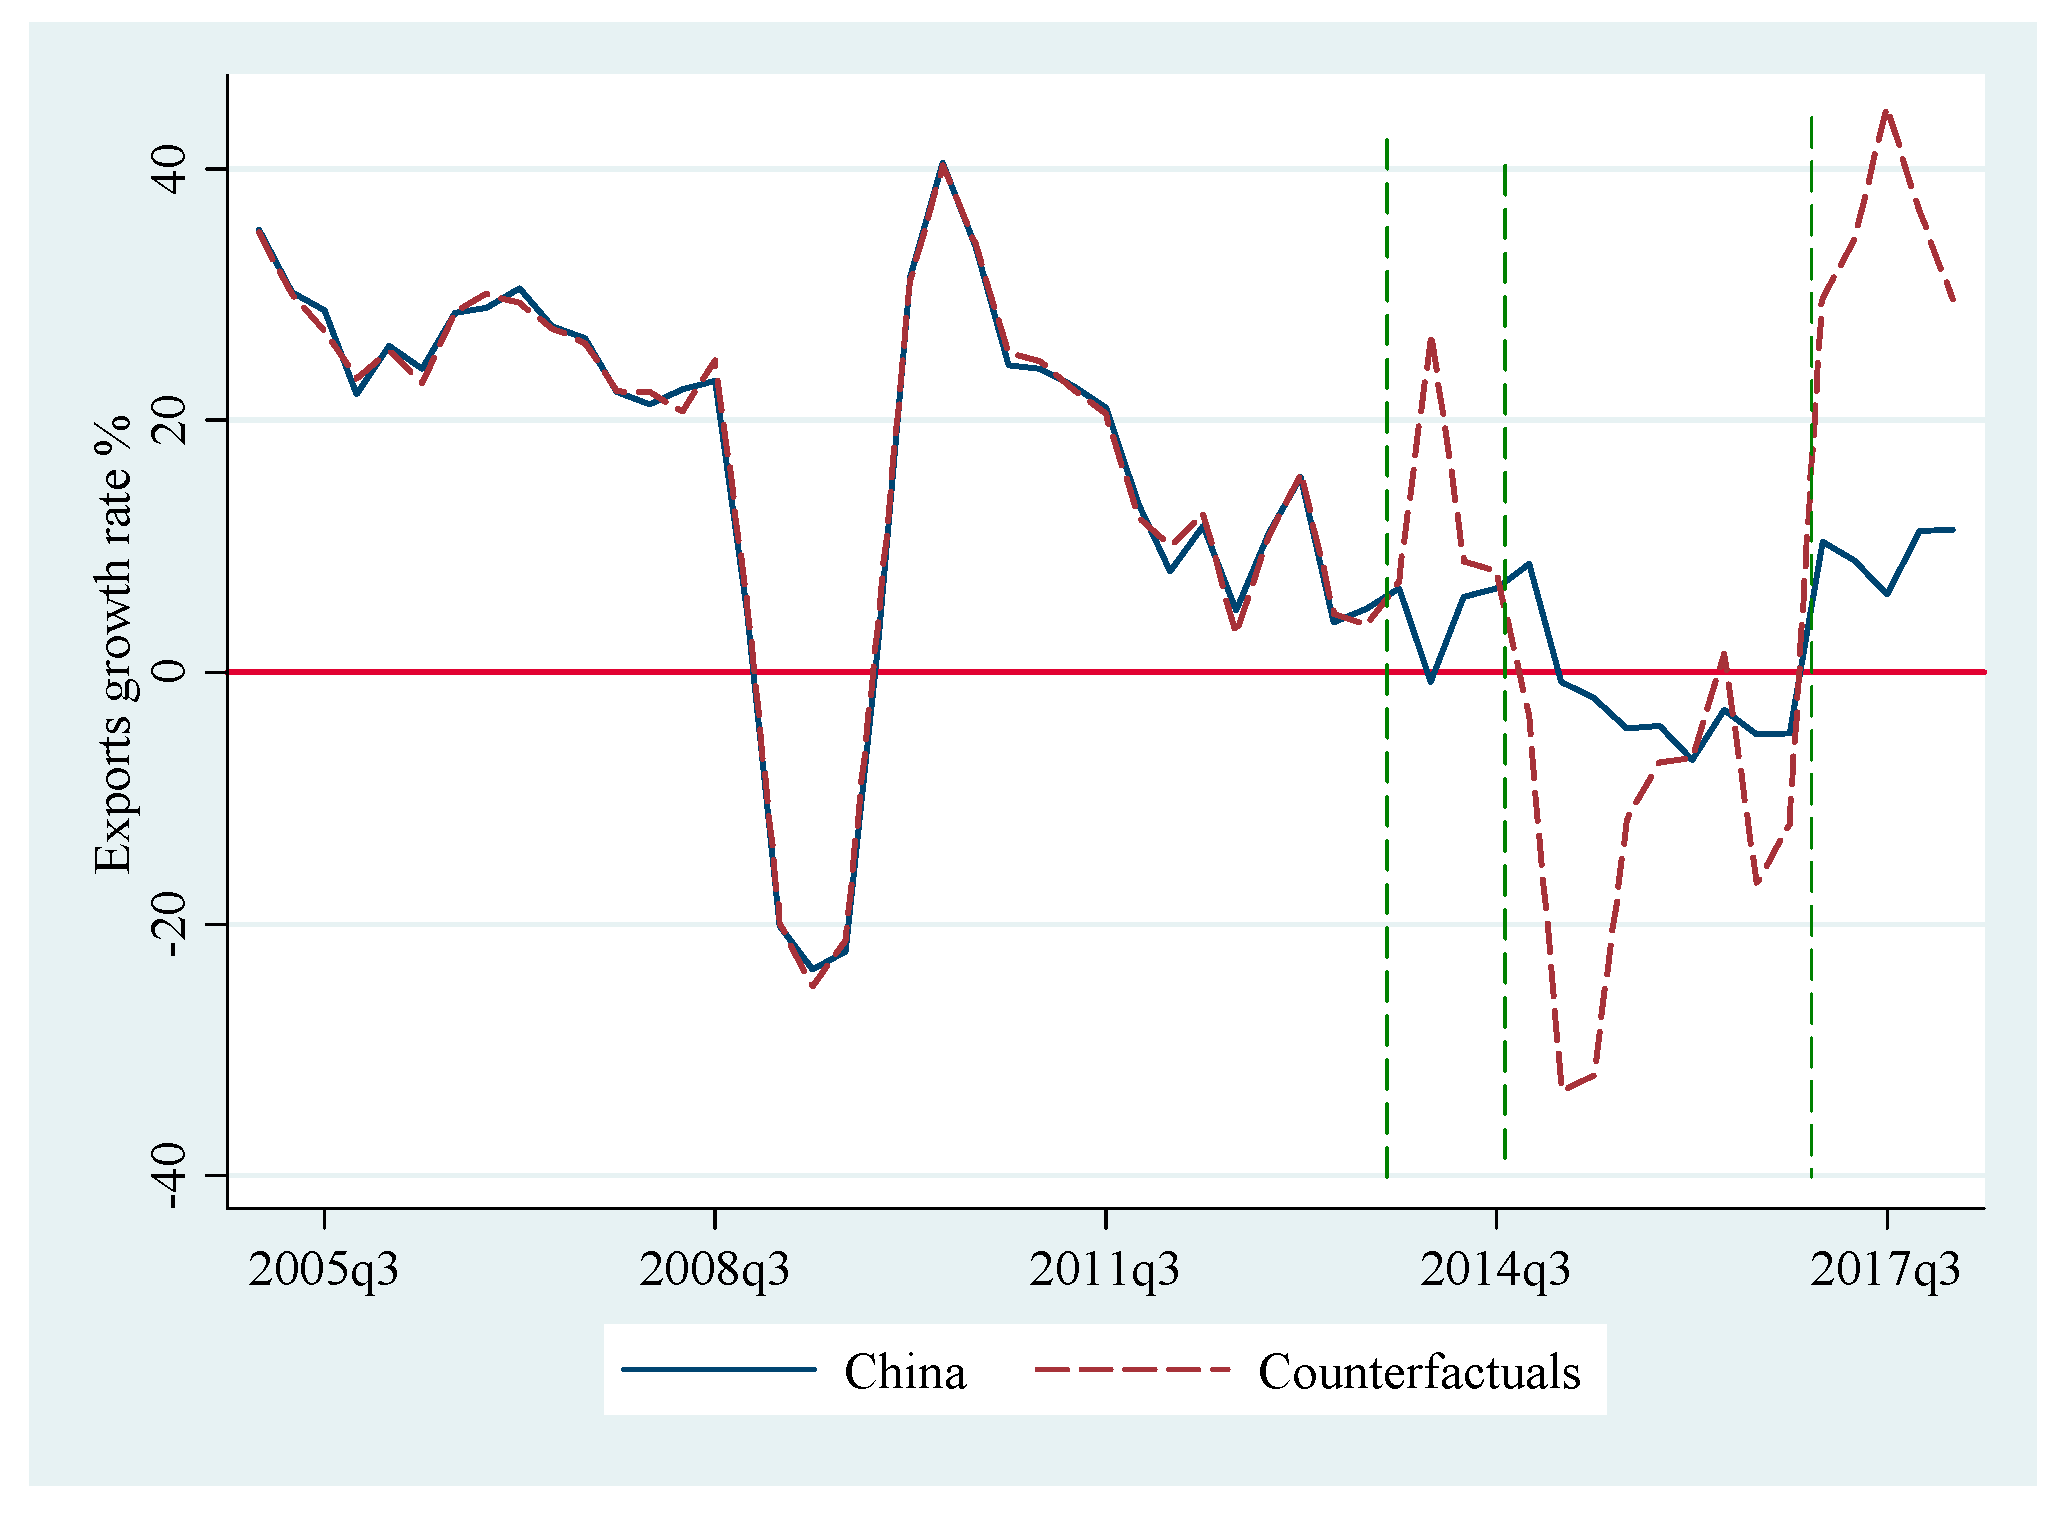
We use seasonal adjusted quarterly export growth rates of the selected control countries to construct a counterfactual for China in the absence of the OBOR initiative. Using the same procedure described in
Section 3.2, we first obtain OLS weights based on statistics for the period of 2005: q1–2014: q1 listed in
Table 4. The counterfactual path produced by the control groups is confirmed in
Figure 2; it closely traces the actual path of China’s export growth rates before the implementation of OBOR with a
of 0.996.
In
Table 5, the difference between actual growth rates and synthesized counterfactuals are below 1percent point on average; therefore, errors within a small range can be tolerated.
Figure 2 shows that the hypothetical line follows the solid line quite closely before treatment, suggesting a good fit by estimation settings. The actual and estimated counterfactual exports growth rate in the absence of the “One Belt, One Road” initiative has been about 12% yearly on an average, after the Global Financial Crisis of 2008.
The robustness checking result supports the fact that the OBOR significantly increased China’s exports during the observed period. The estimated average treatment effect on exports growth rate from 2014:q1 to 2018:q1 is 8 percent points (
Table 6), and is significant at the 1% level according to the asymptotic distribution derived by Li et al. [
24]. Specifically, in the background of global trade shrinkage, the average actual exports growth rate remains positive, while the average predicted exports growth rate without extra trade promotions is much likely to be below zero points. The estimated treatment effects indicate that the exports growth rate has been boosted by more than 8 percent points, compared to the growth rate had there been no initiative.
Figure 2 shows that, starting from the treatment quarter until the middle of 2014, between the first vertical line and the second vertical line, the hypothetical line separates from the actual line with an unstable trend, implying a testing treatment period (we are not certain when the OBOR initiative began to be effective). Subsequently, the observation period between the second vertical line and the third vertical line in
Figure 2 shows a certain positive treatment effect on exports growth from 2014 to 2016.
Owing to the OBOR initiative, China’s exports growth rates did not drop as sharply as the global trend, which is extraordinary given the country’s enormous trade quantities. Treatment effects were estimated to be negative after 2016 (the facts are presented in
Section 3.2). Although China has shown a slower exports growth rate than other developing economies since 2016 (after the third dash vertical line in
Figure 2), primarily caused by the US-Sino trade war, it now shows a small positive rate of around 7 percent points owing to stimulation by the OBOR initiative.
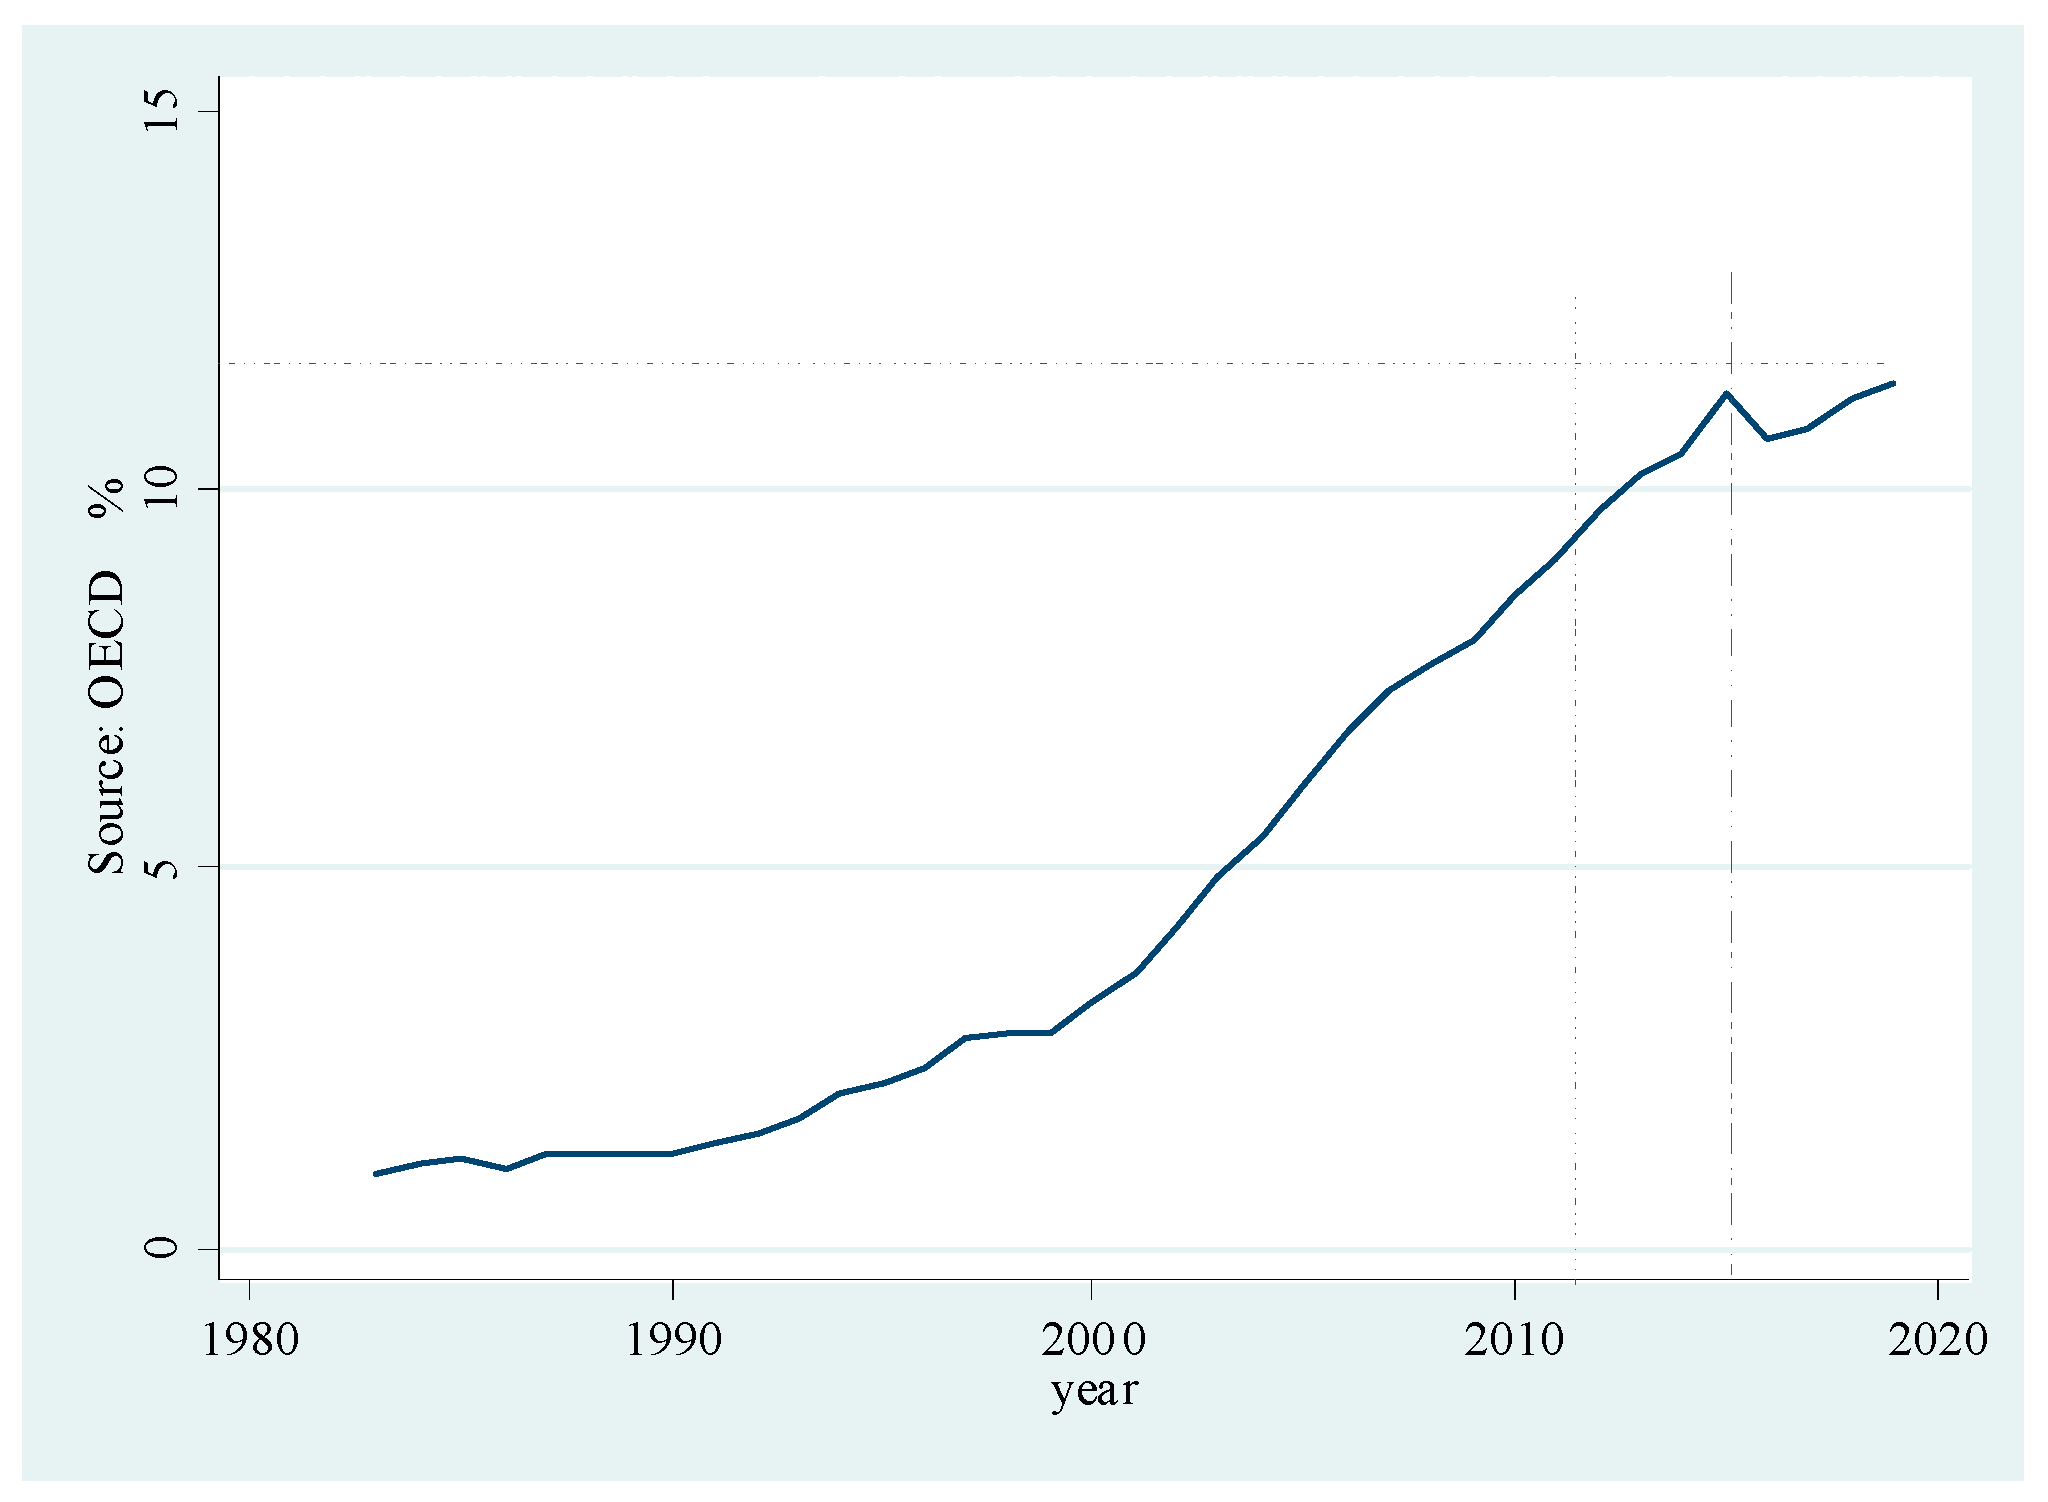
We also collected data of China’s exports from the Organization for Economic Co-operation and Development (OECD) and plotted an increasing trend in market share (
Figure 3), which is another evidence of the effectiveness of the “One Belt, One Road” scheme. There is a slight peak in market share for the period of 2014 to 2016 (after the second dash line); it shows the stimulation of the scheme on total exports in China. The time-series of China’s world market share provide obvious evidence of the short-run effectiveness of the “One Belt, One Road” initiative.


