Article

Social Hotspot Analysis and Trade Policy Implications of the Use of Bioelectrochemical Systems for Resource Recovery from Wastewater

by
Mobolaji B. Shemfe
1,*,
Siddharth Gadkari
2 and
Jhuma Sadhukhan
1,2
1
Centre for Environment and Sustainability, University of Surrey, Surrey GU2 7XH, UK
2
Department of Chemical and Process Engineering, University of Surrey, Surrey GU2 7XH, UK
*
Author to whom correspondence should be addressed.
Sustainability 2018, 10(9), 3193; https://doi.org/10.3390/su10093193
Submission received: 6 August 2018 / Revised: 22 August 2018 / Accepted: 4 September 2018 / Published: 6 September 2018

Abstract

:
Bioelectrochemical systems (BESs) have been catalogued as a technological solution to three pressing global challenges: environmental pollution, resource scarcity, and freshwater scarcity. This study explores the social risks along the supply chain of requisite components of BESs for two functionalities: (i) copper recovery from spent lees and (ii) formic acid production via CO2 reduction, based on the UK’s trade policy. The methodology employed in this study is based on the UNEP/SETAC guidelines for social life-cycle assessment (S-LCA) of products. Relevant trade data from UN COMTRADE database and generic social data from New Earth’s social hotspot database were compiled for the S-LCA. The results revealed that about 75% of the components are imported from the European Union. However, the social risks were found to vary regardless of the magnitude or country of imports. “Labour and Decent Work” was identified as the most critical impact category across all countries of imports, while the import of copper showed relatively higher risk than other components. The study concludes that BESs are a promising sustainable technology for resource recovery from wastewater. Nevertheless, it is recommended that further research efforts should concentrate on stakeholder engagement in order to fully grasp the potential social risks.

1. Introduction

Environmental pollution, resource scarcity, and freshwater shortage are critical global challenges facing humanity in this century. A growing global population, rising at 83 million per annum [1,2], exacerbate these challenges, as the demand for freshwater and resources continue to grow. For instance, in the UK, the renewable internal freshwater resources per capita has seen a decline of 10% over the last two decades [3]. Yet, a significant proportion of global freshwater supply is lost through the end-of-pipe disposal of wastewater into aquatic ecosystems. The accumulation of wastewater in these ecosystems is not only harmful to public health and biodiversity but could also result in adverse societal consequences if left unchecked. Nevertheless, wastewater can be deemed a resource that can be tapped for additional utility [4]. The potential energy resources locked within typical wastewater include organic matter (~6.4 MJ/m3), thermal energy (~25 MJ/m3), and nutritional elements (~2.5 MJ/m3) [5]. Moreover, wastewater resources constitute about 50–100% of overall waste resources [6]. These valuable resources can be recovered and regenerated from wastewater and recycled into the economy for reuse towards the realisation of the circular economy concept.
In order for the potential economic, environmental and societal benefits of resource recovery from wastewater to be fully realised, a transition from the linear economy model to a circular one is essential [7,8]. Stringent surface water quality and carbon emission targets for wastewater treatment facilities are also compelling drivers for this transition. However, these goals cannot be achieved solely by existing wastewater plants, as they are capital and resource (chemicals and energy) intensive [6]. Thus, the adoption of innovative, flexible solutions for resource recovery, such as bioelectrochemical systems (BESs), could plausibly make the current wastewater infrastructure sustainable [9,10]. BESs are essentially microbial-aided electrochemical devices that receive wastewater in the anodic chamber under anaerobic conditions to produce clean water, and thereby supply electrons and protons for recovery of products in the cathodic chamber. Several experimental investigations on various configurations of BESs have been carried out, all showing potential for upscaling of the technology [11]. Nevertheless, it is essential to ascertain whether BESs, as a flexible solution for wastewater treatment and resource recovery, are ‘sustainable’ [8].
According to the Bruntdland report [12], sustainability comprises three aspects: environment, economic and social facets that should be assessed and weighed when designing new products or production systems. The life cycle sustainability assessment (LCSA) methodology, proposed by Kloepffer [13], combines life cycle assessment (LCA), life cycle costing (LCC), and social life cycle assessment (S-LCA). Concisely, LCA assesses environmental impacts, LCC evaluates economic costs, and S-LCA assesses social risks/impacts. The multi-dimensional approach of the LCSA methodology thus ensures that enterprise-level supply chain or country-level trade policy decisions align with sustainable development goals [14,15]. Despite the potential of LCSA to be a powerful decision-making tool, a major methodological challenge is the implementation of LCA, LCC and S-LCA in a combined way [16]. This is because, unlike LCA, and to an extent LCC, S-LCA is yet to be standardised and have consistent indicators. Consequently, various social indicators have been adopted in literature and S-LCA is still undergoing evolution [12,13,14,15,16,17]. Even so, considerable research progress has been made over the last two decades to harmonise the methodology of S-LCA, the summation of which led to the publication of the UNEP/SETAC guidelines for S-LCA of products [17]. The UNEP/SETAC guidelines provide the state-of-the-art framework for conducting S-LCA studies.
To the knowledge of the authors, sustainability studies of BESs in literature have so far focused on economic and environmental (i.e., LCC and LCA) perspectives [18,19,20]. Moreover, in a previous work of this group, the economic and environmental impacts of a BES for wastewater treatment and formic acid production were assessed, but the social impacts were not evaluated [21]. Therefore, the present study, for the first time, examines the potential social risks of BESs for wastewater treatment and two resource recovery functions: copper recovery and formic acid production. Herein, a social hotspot analysis of the requisite components for the construction and operation of BESs is conducted using trade import data from the United Nations Commodity Trade Statistics (UN COMTRADE) database in conjunction with the Social Hotspot database (SHDB), based on UNEP/SETAC guidelines. The study elucidates the distribution of social risks along the supply chain of BES components based on the UK’s trade policy. Most importantly, this paper contributes to current understanding of the sustainability of BESs, by taking a step further from the traditional economic and environmental perspectives to a social one. Furthermore, it lays the foundation for future LCSA studies towards the triple-bottom-line sustainable development of BESs.

2. Materials and Methods

Figure 1 depicts the overall methodology employed in this study.
Firstly, inventory data, primarily metainformation of components of a BES model, are obtained from our previous work [21]. Subsequently, the inventory data are mapped to relevant commodities on the UN COMTRADE database, in order to identify the top countries of imports that constitute at least 90% of total import value of each component to the UK. The value of the imports of each commodity per country is then deflated to USD 2002 to conform to the SHDB input format. Next, the import value of each commodity is mapped to respective countries and sectors on the SHDB. Finally, social impact scores are assessed via the Social Life Cycle Impact Assessment (S-LCIA) method on the SHDB.

2.1. Goal and Scope of Study

The present study aims to assess the potential social hotspots in the supply chain of requisite components (commodities) for the construction and operation of BESs in the UK. The scope of this study spans the cradle (raw material extraction) to the production gate—in agreement with the scope adopted in our previous study on the environmental and economic impacts of formic acid synthesis via a BES [21]. It should be noted that social impacts, in contrast to environmental and economic impacts, cannot be expressed per functional unit due to the methodological challenge of linking social indicators, which are expressed as qualitative and semi-quantitative data, to the functional unit, which is based on physical output. Nevertheless, the UNEP/SETAC S-LCA guidelines [22] recommend the inclusion of a functional unit in all S-LCA studies in order to accentuate product/process utility.
In addition to treating organic wastewater at their anodes, BESs can be used for multiple functions, including metal recovery, organic acid synthesis and hydrogen production, depending on their cathodic configuration [8,23,24]. Regardless of the cathodic configuration, in most cases, BES operation and construction require the same major components: carbon-based anode and cathode, organic wastewater (anolyte), a membrane, current collectors, and an enclosure. In respect to cathodic applications, the catholyte is tailored for the resource of interest: metallic wastewater (e.g., spent lees with toxic levels of Cu2+) is used for metal (e.g., Cu/Cu2O) recovery, and potassium bicarbonate (KHCO3) solution is used for organic acid (e.g., formic acid) production from CO2 reduction. Furthermore, the aforementioned applications are catalysed either by microbes, e.g., Shewanella oneidensis for Cu recovery or high-efficiency metals, e.g., indium for formic acid production. Thus, in this study, ‘ornamental’ functional units of 1 kg Cu recovery and 1 kg formic acid production at the cathode, associated with organic wastewater treatment at the anode, are employed. Figure 2 shows the schematic of the BES under consideration.

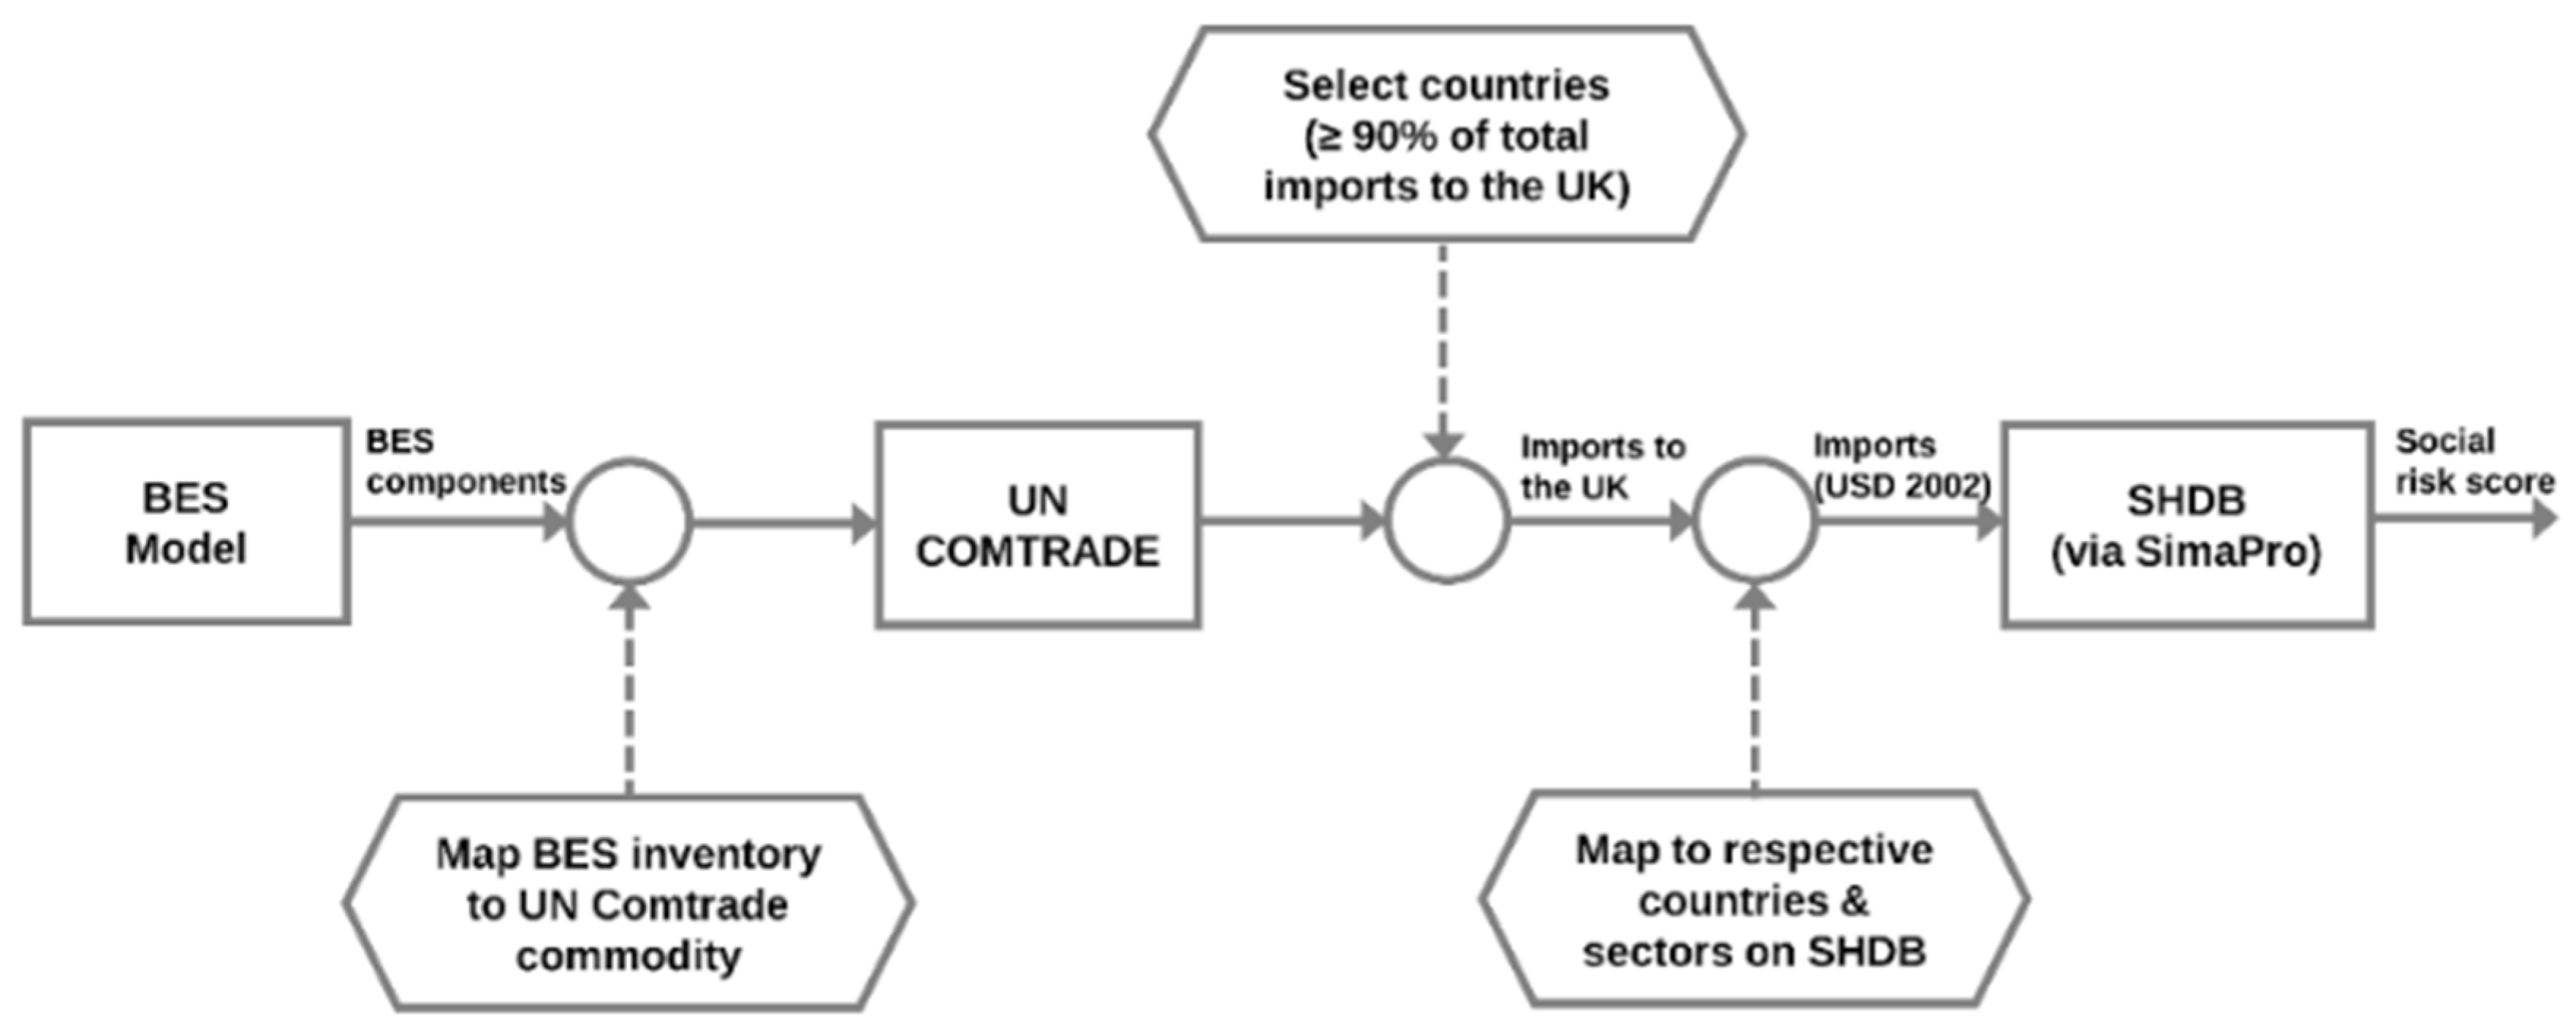
2.2. Inventory Analysis

The inventory data of the raw materials (components) described in Figure 2 are obtained from a previously-developed BES model [21]. Based on this model, the anode is derived from carbon fibre, which is manufactured from polyacrylonitrile. A Nafion membrane, derived from sulfonated polytetrafluoroethylene (PTFE), and current collectors, made of copper, are used. As aforesaid, the cathodic configuration depends on the function of the system. For formic acid production, a cathode, comprising indium as catalyst, carbon fibre as catalyst support and PTFE as binder, is used, and KHCO3 solution (0.1M) is used as catholyte. Whereas for Cu recovery from spent lees, a carbon fibre cathode catalysed by Shewanella oneidensis, is employed.
These inventory data are then mapped to relevant commodities on the UN COMTRADE database in order to identify the top countries that constitute at least 90% of the imports (in USD) of the BES components to the UK. The import value of each commodity is subsequently mapped to relevant country-specific economic sectors on the SHDB. The SHDB, developed by Benoît Norris et al. [25], comprises generic social data that can be used to attribute social risks to the country-specific sectors associated with the BES commodities. The database links economic input/output (I/O) data from the Global Trade Analysis Project (GTAP) model with labour intensity factors and social indicators of country-specific sectors from reputable international organisations. The GTAP I/O model provides wage payments (USD) per economic output (USD) of product supply chains in 57 economic sectors of 113 countries. Hourly wage rates (USD/hour) for country-specific sectors are obtained from the International Labour Organisation (ILO), the Organisation for Economic Co-operation and Development (OECD), the United Nations Industrial Development Organisation (UNIDO), and the Food and Agriculture Organisation (FAO). The wage payments per economic output from the GTAP model and the hourly wage rates from various international organisations constitute the worker hours model used in the SHDB [26]. The social indicators for country-specific sectors are obtained from 200 reputable publicly-available sources, including the ILO, the World Bank (WB), and the World Health Organisation (WHO). The worker hours model is linked with the social indicators to attribute social risk (R) for the social themes within each social impact category. A single or several related social indicators are used to categorise the risk for the themes within each impact category. For example, the indicator: “percentage of population living under $2 per day” is used to attribute risk for the social theme: “Poverty” under the “Labour Rights and Decent Work” impact category. A complete list of the indicators used to attribute risks for the social themes in the SHDB can be found elsewhere [27]. Table 1 summarises the social impact categories, their respective social themes and relevant stakeholders and Figure 3 illustrates the overall SHDB methodology.

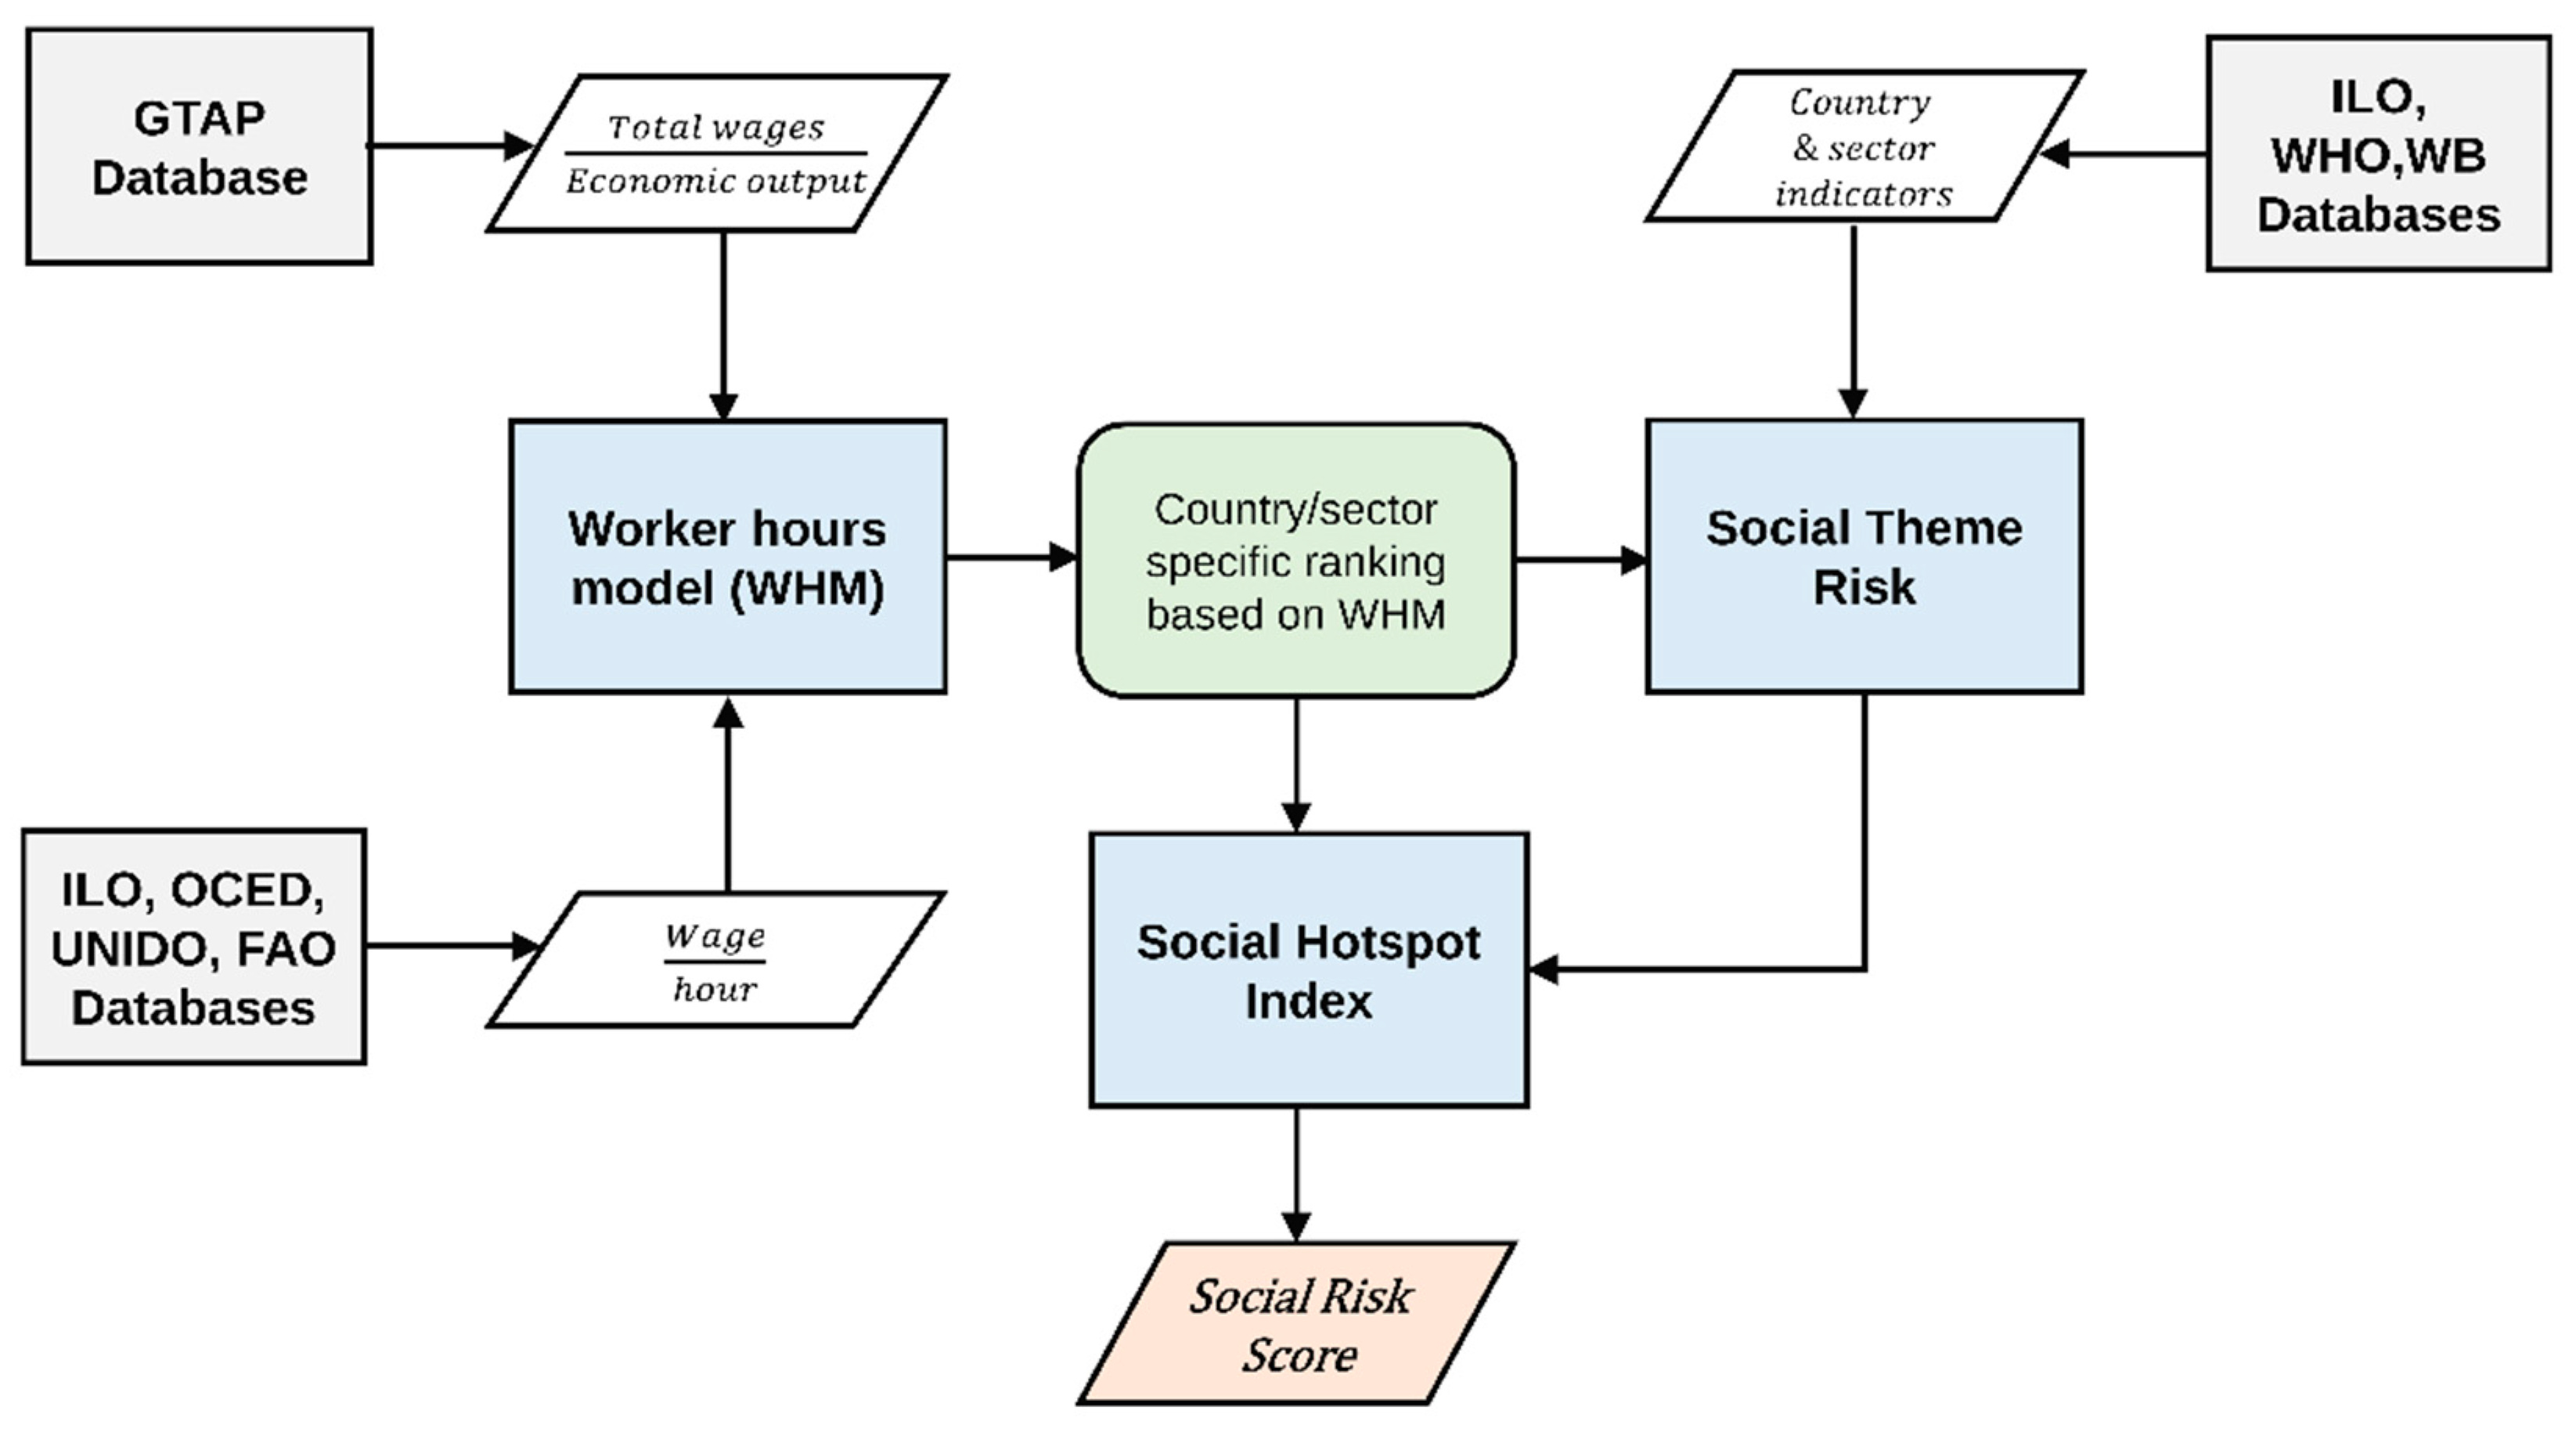
2.3. Impact Assessment

The S-LCIA Method V2.00, provided in the SHDB package, is used to assess social risk levels for the BES commodities across the five social impact categories provided in Table 1. S-LCIA characterisation models, which are algorithms based on the distribution of data across the entire population of sectors and countries on the SHDB divided into quartiles, are used to assign four risk levels: low, medium, high or very high risk. In other words, the characterisation models show how the country-specific sectors compare globally. Table 2 shows the weighting factors (W) assigned to each risk level. The weighting factors essentially indicate the relative probability of an adverse situation to occur [25]. The resulting weighted risks (WR) for each social impact category, expressed in medium-risk hours-equivalent, are then aggregated into social hotspots indexes (SHIs) as described in Equation (1).
S H I c a t = T = 1 n R a v g · W T T = 1 n R m a x · W T · 100 %
where n is the number of themes within a category, T is social theme, Ravg is the average risk across the theme, Rmax is the maximum risk for a theme and WT is the assigned weight.
The SHIs are unitless, ranging from 0 to 1. As a general rule, the higher the SHI score, the higher the potential impacts in that social category for a country-specific sector.

3. Results and Discussion

3.1. Trade Value of BES Components

Table 3 shows the top countries that account for ≥90% of the import of commodities (raw materials) for the manufacture of the BES components, their respective trade values, global regions, and economic sectors on the SHDB.
As shown in Table 3, European Union (EU) countries constitute a significant proportion of the imports of the BES commodities to the UK. About 75% of the total imports, estimated at $USD 1.4 billion, is from the EU. This insight, while ordinarily would have been inconsequential to this study, is significant in light of the ‘Brexit’ trade negotiation between the EU and the UK. Nevertheless, it is too early to speculate on which countries will replace EU exporters to the UK, and what the potential social risks will be post-Brexit. Notwithstanding, years of research have shown that the link between commodities and supply chain actors (i.e., countries and sectors) is not always linear (one-dimensional) [28,29]. Instead, global trade is a complex interactive supply chain network and, thus, the connections and dynamics between the exporting and importing countries/sectors need to be re-assessed in subsequent research efforts.

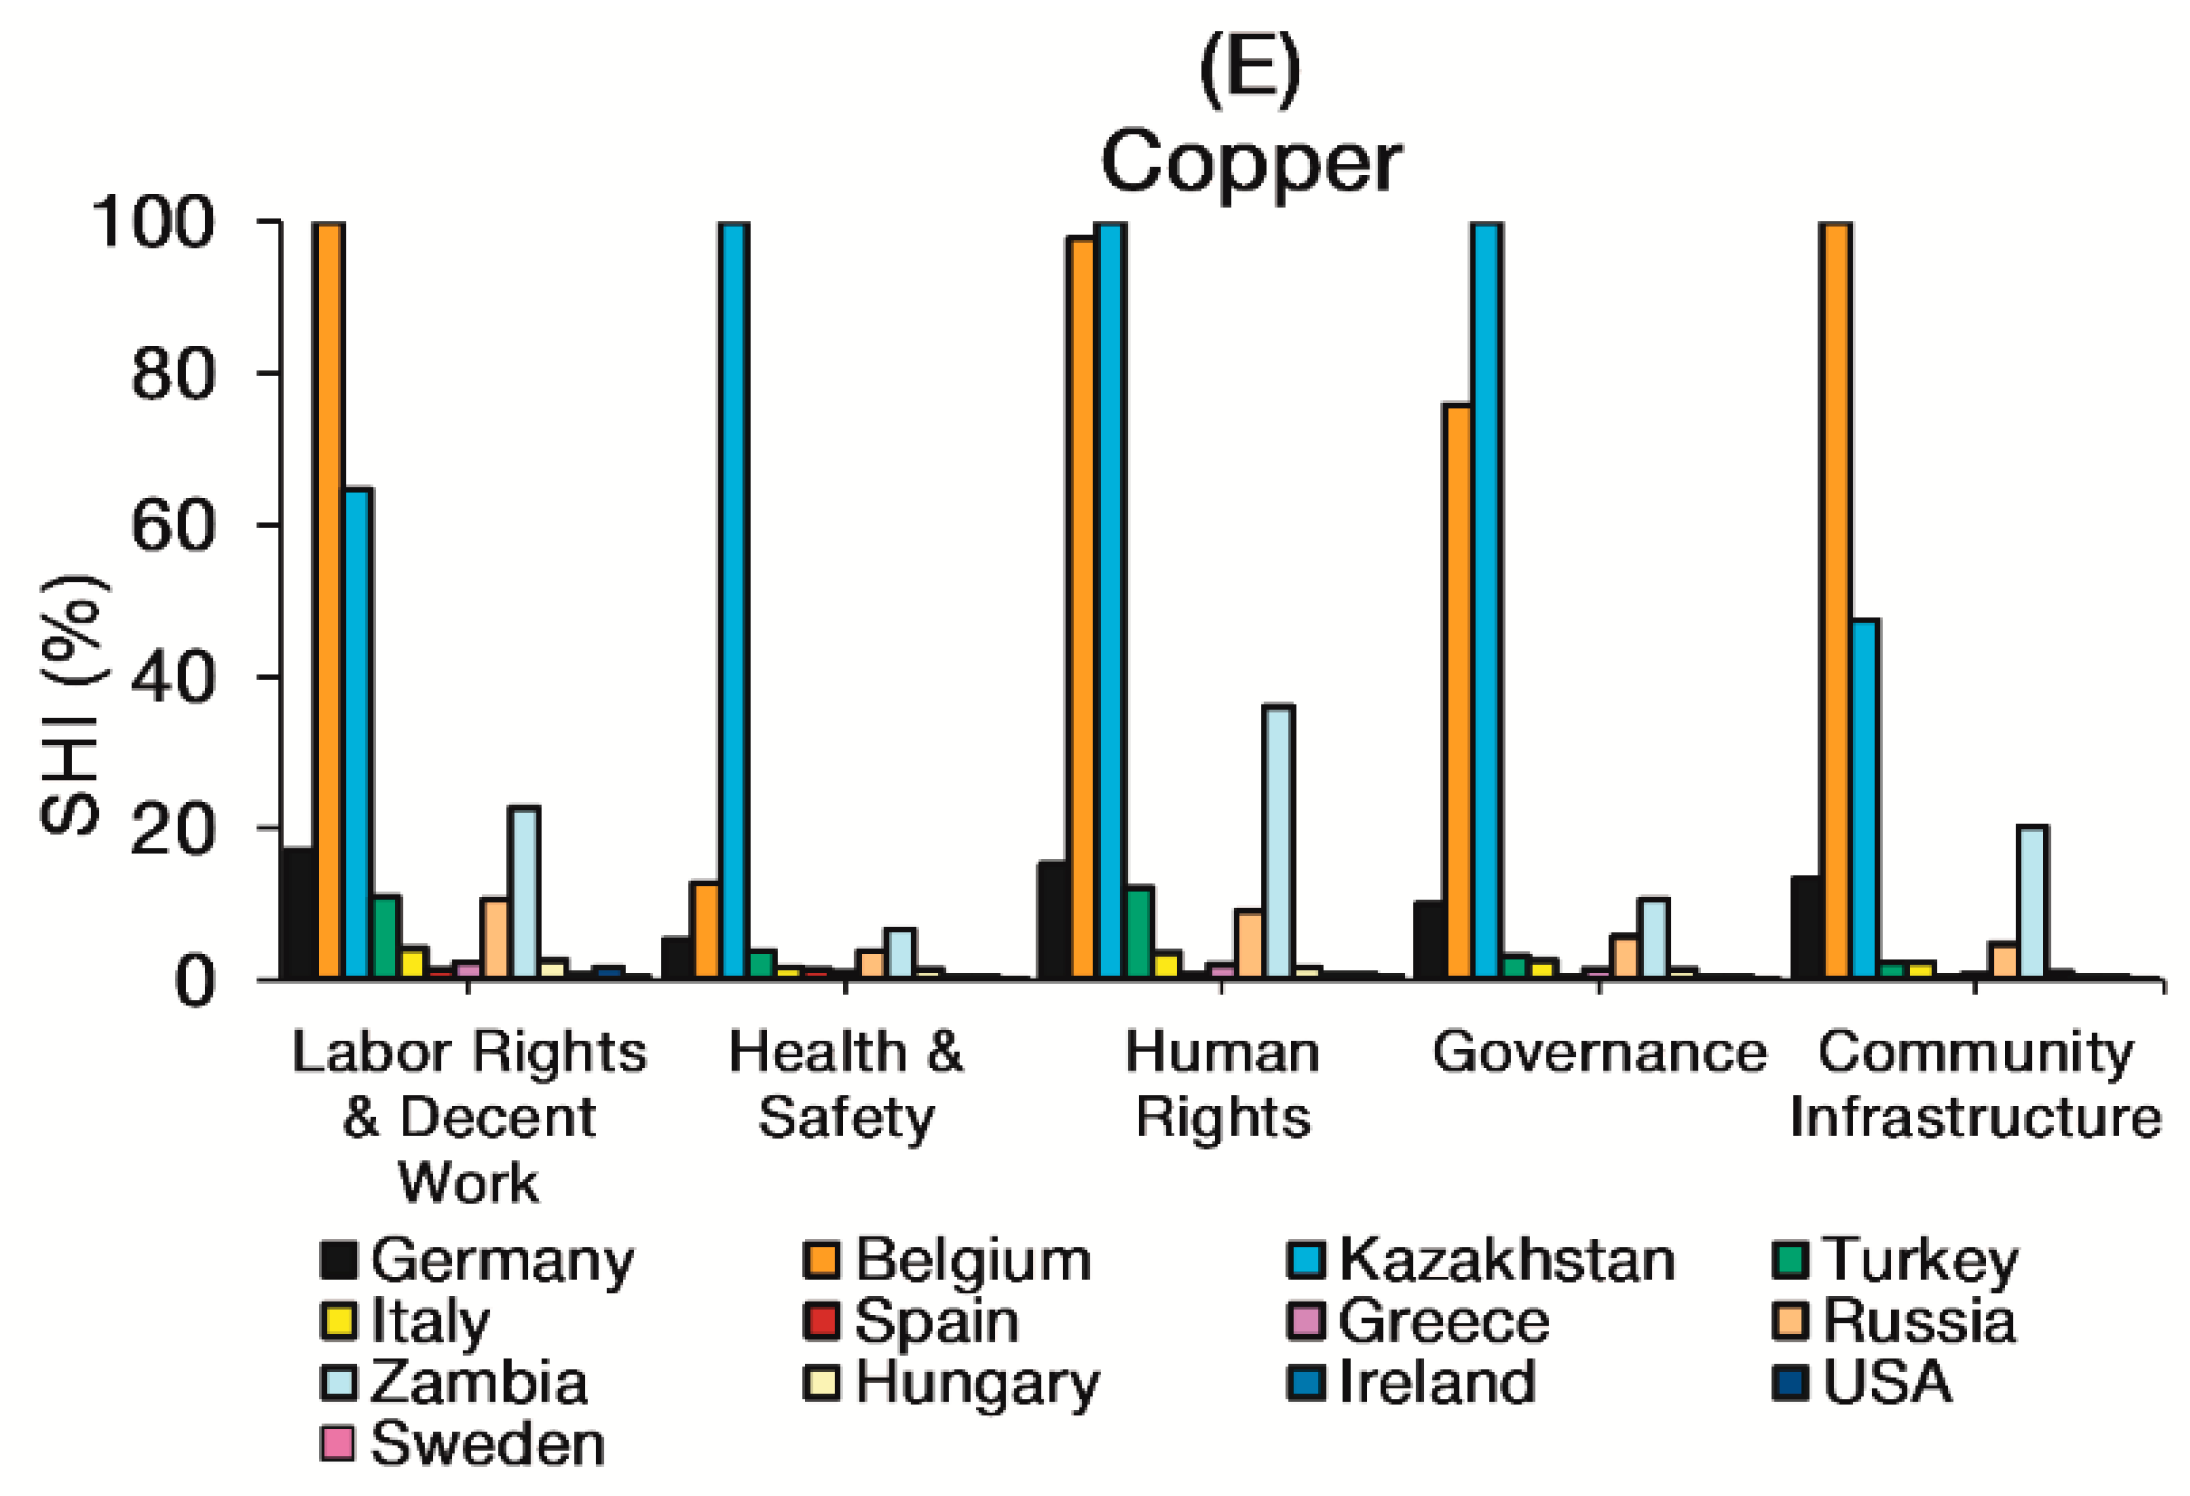
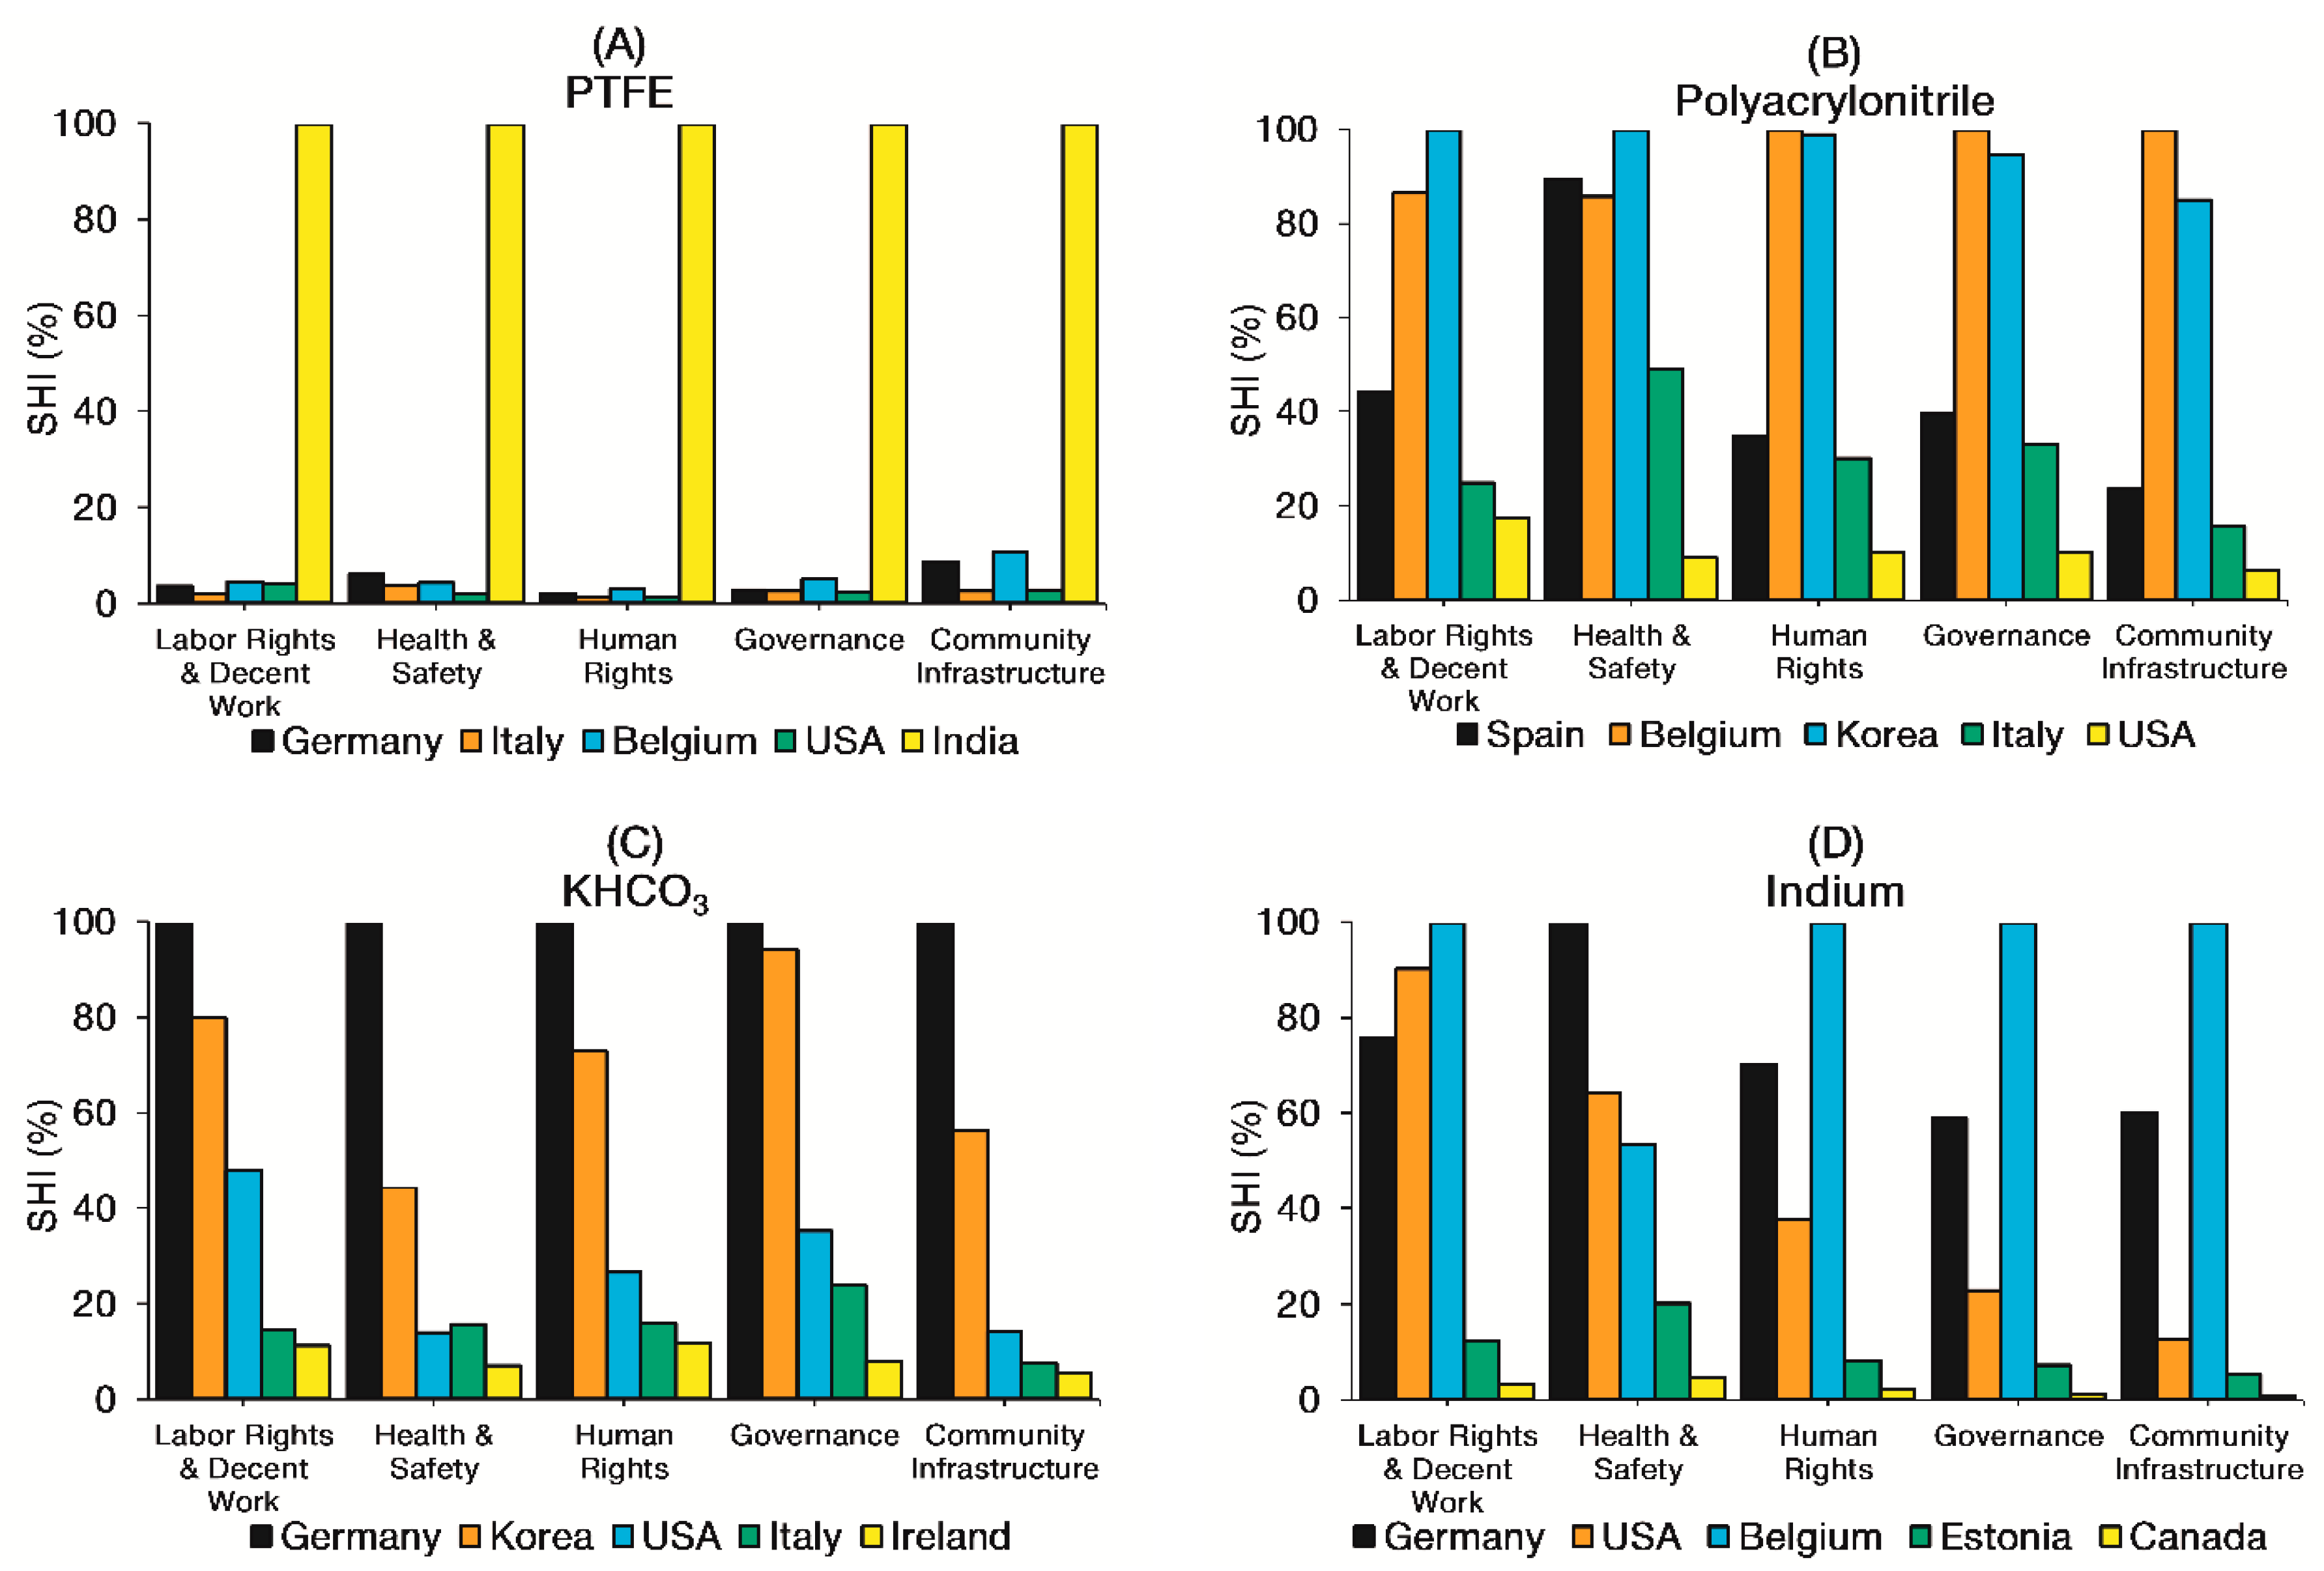
3.2. Social Hotspot Analysis of BES Components

The SHIs, across five social categories, associated with the country-of-origin of importation of the BES components are presented in Figure 4A–E.
The values of WR, i.e., the values used to calculate the SHIs depicted in Figure 4A–E, for the five social impact categories per commodity/country is presented in Table 4.
For PTFE, “Labour and Decent Work” shows the highest risk (i.e., WR) in all countries of imports while “Community Infrastructure” shows the lowest in all countries, except Germany and Belgium, where “Governance” and “Human Rights” exhibit the lowest risk, respectively (See Table 4). In terms of overall SHI per country, India scores the highest and the USA scores the lowest (See Figure 4A). For polyacrylonitrile, “Labour and Decent Work” exhibits the highest risk in all countries of imports, while “Community Infrastructure” shows the lowest risk in all countries, except Belgium, where “Human Rights” shows the lowest risk (Table 4). In terms of overall SHI per country, Korea has the highest score, while the USA has the lowest (Figure 4B). For KHCO3, “Labour and Decent Work” records the highest risk in all countries of imports. Whereas “Community Infrastructure” records the lowest risk in all countries, except Germany, where “Governance” exhibits the lowest risk (Table 4). With respect to overall SHI per country, Germany scores the highest and Ireland the lowest (Figure 4C). For indium, “Labour and Decent Work” has the highest risk in all countries of imports, while “Community Infrastructure” shows the lowest for the USA and Canada, “Human Rights” shows the lowest for Germany and Estonia, and “Health and Safety“ the lowest for Belgium. For overall SHI per country, Belgium scores the highest, and Canada scores the lowest (Figure 4D). For copper, “Labour and Decent Work” records the highest risk for Germany, Belgium, Turkey, Italy, Greece, Russia, Zambia, Hungary, Ireland, USA and Sweden and “Health and Safety” records the highest risk for Kazakhstan and Spain. Whereas “Community Infrastructure” records the lowest risk for Kazakhstan, Turkey, Spain, Greece, Russia, Ireland, USA and Sweden, “Human Rights” the lowest for Germany, Italy and Hungary, and “Health and Safety” the lowest for Belgium and “Governance” the lowest for Zambia. For overall SHI per country, Kazakhstan records highest and Sweden the lowest (Figure 4E).
From the above results, it is clear that “Labour and Decent Work” exhibits the highest risk among all social impact categories for all the commodities. Whereas “Community Infrastructure” exhibits the lowest risk among all categories for all commodities, closely followed by “Human Right”—the lowest for Indium. It is possible that the strikingly high magnitude of risk exhibited by “Labour and Decent Work” is due to the relatively large number of indicators used to attribute its risk [27]. Moreover, it appears that the magnitude of trade value does not always correspond with the extent of social risk, as the latter varies considerably due to peculiar socio-economic realities. As a case in point: India has the lowest export of PTFE to the UK among all countries of import, but shows strikingly higher risks in all categories and overall SHI than Germany, Italy, Belgium, and the USA.
In ascending order, the ranking of the combined risks (i.e., combined worker hours of the WR of the five impact categories of the countries of imports) of each BES commodity is as follows: polyacrylonitrile, KHCO3, indium, PTFE, and copper. Precisely, copper ratios PTFE, indium, KHCO3, and polyacrylonitrile by 145:1, 279:1, 2614:1, and 3356:1, respectively. The high combined risks exhibited by copper require particular attention, as copper recovery from metallic wastewater is paradoxically an application of BESs. Thus, from this perspective, the use of substitute metals or alloys for current collectors in BESs should be considered. The use of indium as a catalyst due to its high efficiency for formic acid production may also need reconsideration, as its modest combined risk may not justify its use. Moreover, it is a critical raw material with a low recycling rate. While the social impacts of PTFE, KHCO3, and polyacrylonitrile are worth considering, they can be synthesised from different chemical pathways using other precursor raw materials or replaced with other components with similar physicochemical properties and performance.

3.3. Limitations

The lack of causal links between social indicators and the functional units in terms of quantifiable output is the major limitation of this study. Linkages between social performance indicators and the functional unit will ensure more accurate S-LCA results and help identify the trade-offs between the economic, environmental, and social implications of supply chain decisions. The use of different weighting factors could also affect the outcome of the S-LCA. Thus, it is recommended that weighting factors for the risk levels be updated as new information and evidence become available, in order to obtain up-to-date perspectives on the potential social risks. The lack of granularity in terms of commodity/sector-specific data is another limitation. For example, copper and indium are both mapped to “metals n.e.c” on the SHDB, even though the social risks associated with both metals, irrespective of country of import and trade value, may differ significantly. Furthermore, as with global trade, it is probable that the links between social risks, social indicators, and labour intensity factors are not one-dimensional. At any rate, as S-LCA is still in the nascent stage of development, research efforts in the field are ongoing to address these daunting methodological challenges.

4. Conclusions

This study provides provisional insights into the potential social risks associated with the import of requisite BES components, for copper recovery and formic acid production, to the UK. It was found that the imports of the BES components are highly skewed towards EU countries, which make up about 75% of total imports to the UK. “Labour Rights and Decent Work” exhibited the highest risk for all commodities across the countries of imports, whereas “Human Rights” and “Community Infrastructure”, in equal extents, exhibited the lowest risk. Copper showed a strikingly higher social risk than other BES commodities, thus, its use as current collectors should be reconsidered. The insights gained in this study thus lays the foundation for future research for understanding the holistic sustainability of BESs. The UNEP-SETAC guidelines suggest that the results of computational S-LCA studies (such as the present study) should be verified and complemented with direct engagement with relevant stakeholders. Experimental trials of BESs have so far shown optimistic results and considerable prospects for scaling up. Moreover, previous research suggests strong environmental and economic drivers for the upscaling of the technology [21]. Therefore, it is possible that the upscaling of BESs will ultimately yield social benefits.

Author Contributions

Conceptualisation and supervision by J.S.; methodology design by M.B.S. and S.G.; analysis and draft preparation by M.B.S.; and review and editing by all authors.

Funding

The authors gratefully acknowledge the financial support provided for this work by the UK Engineering and Physical Sciences Research Council (EPSRC) project reference: EP/N009746/1 and the Natural Environment Research Council (NERC) project reference: NE/L014246/1 and NERC-Resource Recovery from Waste (RRfW) mini project: Life Cycle Sustainability and Policy Analyses of Plausible Systems for RRfW.

Conflicts of Interest

The authors declare no conflict of interest.

Table of Acronyms and Abbreviations

BESBioelectrochemical System
EUEuropean Union
FAOFood and Agriculture Organisation
GTAPGlobal Trade Analysis Project
ILOInternational Labour Organisation
LCALife Cycle Assessment
LCCLife Cycle Costing
LCSALife Cycle Sustainability Assessment
OECDOrganisation for Economic Co-operation and Development
PTFEPolytetrafluoroethylene
SETACSociety of Environmental Toxicology and Chemistry
SHDBSocial Hotspot Database
SHI Social Hotspot Index
S-LCASocial Life Cycle Assessment
UN COMTRADE United Nations Commodity Trade Statistics Database
UNEPUnited Nations Environment Programme
USDUnited States Dollar
WB World Bank
WHOWorld Health Organisation

References

  1. UNESCO. New Report Highlights Crucial Role of Water in Development | United Nations Educational, Scientific and Cultural Organization. Available online: http://www.unesco.org/new/en/media-services/single-view/news/new_report_highlights_crucial_role_of_water_in_development/ (accessed on 22 August 2018).
  2. UNDESA. World Population Prospects: The 2015 Revision, Key Findings and Advance Tables; UNDESA: New York, NY, USA, 2015. [Google Scholar]
  3. The World Bank Annual Freshwater Withdrawals, Total (Billion Cubic Meters) | Data. Available online: http://data.worldbank.org/indicator/ER.H2O.FWTL.K3 (accessed on 17 September 2016).
  4. Gude, V.G. Microbial fuel cells for wastewater treatment and energy generation. In Microbial Electrochemical and Fuel Cells-Fundamentals and Applications; Yu, E.H., Scott, K., Eds.; Woodhead Publishing: Boston, MA, USA, 2016; pp. 247–285. [Google Scholar]
  5. McCarty, P.L.; Bae, J.; Kim, J. Domestic wastewater treatment as a net energy producer—Can this be achieved? Environ. Sci. Technol. 2011, 45, 7100–7106. [Google Scholar] [CrossRef] [PubMed]
  6. Puyol, D.; Batstone, D.J.; Hülsen, T.; Astals, S.; Peces, M.; Krömer, J.O. Resource recovery from wastewater by biological technologies: Opportunities, challenges, and prospects. Front. Microbiol. 2017, 7, 2106. [Google Scholar] [CrossRef] [PubMed]
  7. Velenturf, A.P.M.; Purnell, P. Resource recovery from waste: Restoring the balance between resource scarcity and waste overload. Sustainability 2017, 9, 1603. [Google Scholar] [CrossRef]
  8. Sadhukhan, J.; Lloyd, J.R.; Scott, K.; Premier, G.C.; Yu, E.H.; Curtis, T.; Head, I.M. A critical review of integration analysis of microbial electrosynthesis (MES) systems with waste biorefineries for the production of biofuel and chemical from reuse of CO2. Renew. Sustain. Energy Rev. 2016, 56, 116–132. [Google Scholar] [CrossRef]
  9. Rabaey, K.; Angenent, L.; Schroder, U.; Keller, J. Bioelectrochemical Systems: From Extracellular Electron Transfer to Biotechnological Application; International Water Association: London, UK, 2009. [Google Scholar]
  10. Pant, D.; Singh, A.; Van Bogaert, G.; Irving Olsen, S.; Singh Nigam, P.; Diels, L.; Vanbroekhoven, K. Bioelectrochemical systems (BES) for sustainable energy production and product recovery from organic wastes and industrial wastewaters. RSC Adv. 2012, 2, 1248–1263. [Google Scholar] [CrossRef]
  11. Jain, A.; He, Z. “NEW” resource recovery from wastewater using bioelectrochemical systems: Moving forward with functions. Front. Environ. Sci. Eng. 2018, 12, 1. [Google Scholar] [CrossRef]
  12. Brundtland, G.H. Our Common Future: Report of the World Commission on Environment and Development. United Nations Comm. 1987, 4, 300. [Google Scholar]
  13. Kloepffer, W. Life cycle sustainability assessment of products. Int. J. Life Cycle Assess. 2008, 13, 89–94. [Google Scholar] [CrossRef]
  14. Sadhukhan, J.; Ng, K.S.; Hernandez, E.M. Biorefineries and Chemical Processes: Design, Integration and Sustainability Analysis; Wiley: Chichester, UK, 2014. [Google Scholar]
  15. Clift, R.; Sim, S.; King, H.; Chenoweth, J.L.; Christie, I.; Clavreul, J.; Mueller, C.; Posthuma, L.; Boulay, A.M.; Chaplin-Kramer, R.; et al. The challenges of applying planetary boundaries as a basis for strategic decision-making in companies with global supply chains. Sustainability 2017, 9, 279. [Google Scholar] [CrossRef]
  16. Valdivia, S.; Ugaya, C.; Sonnemann, G.; Hildenbrand, J. (Eds.) Towards a Life Cycle Sustainability Assessment: Making Informed Choices on Products; UNEP/SETAC Life Cycle Initiative: Paris, France, 2011. [Google Scholar]
  17. Benoît, C.; Norris, G.A.; Valdivia, S.; Ciroth, A.; Moberg, A.; Bos, U.; Prakash, S.; Ugaya, C.; Beck, T. The guidelines for social life cycle assessment of products: Just in time! Int. J. Life Cycle Assess. 2010, 15, 156–163. [Google Scholar] [CrossRef]
  18. Foley, J.; Rozendal, R.A.; Hertle, C.K.; Lant, P.A.; Rabaey, K. Life cycle assessment of high-rate anaerobic treatment, microbial fuel cells, and microbial electrolysis cells. Environ. Sci. Technol. 2010, 44, 3629–3637. [Google Scholar] [CrossRef] [PubMed]
  19. Christodoulou, X.; Velasquez-Orta, S.B. Microbial electrosynthesis and anaerobic fermentation: An economic evaluation for acetic acid production from CO2 and CO. Environ. Sci. Technol. 2016, 50, 11234–11242. [Google Scholar] [CrossRef] [PubMed]
  20. Pant, D.; Singh, A.; Van Bogaert, G.; Gallego, Y.A.; Diels, L.; Vanbroekhoven, K. An introduction to the life cycle assessment (LCA) of bioelectrochemical systems (BES) for sustainable energy and product generation: Relevance and key aspects. Renew. Sustain. Energy Rev. 2011, 15, 1305–1313. [Google Scholar] [CrossRef]
  21. Shemfe, M.; Gadkari, S.; Yu, E.; Rasul, S.; Scott, K.; Head, I.M.; Gu, S.; Sadhukhan, J. Life cycle, techno-economic and dynamic simulation assessment of bioelectrochemical systems: A case of formic acid synthesis. Bioresour. Technol. 2018, 255, 39–49. [Google Scholar] [CrossRef] [PubMed] [Green Version]
  22. Benoît, C.; Mazijn, B. (Eds.) Guidelines for Social Life Cycle Assessment of Products. Available online: http://www.unep.fr/shared/publications/pdf/DTIx1164xPA-guidelines_sLCA.pdf (accessed on 8 July 2018).
  23. Ng, K.S.; Head, I.; Premier, G.C.; Scott, K.; Yu, E.; Lloyd, J.; Sadhukhan, J. A multilevel sustainability analysis of zinc recovery from wastes. Resour. Conserv. Recycl. 2016, 113, 88–105. [Google Scholar] [CrossRef]
  24. Shemfe, M.; Sadhukhan, J.; Ng, K.S. Bioelectrochemical Systems for biofuel (electricity, hydrogen, and methane) and valuable chemical production. In Green Chemistry for Sustainable Biofuel Production; Gnaneswar, V., Ed.; Apple Academic Press: New York, NY, USA, 2018. [Google Scholar]
  25. Norris, C.B.; Norris, C.B.; Norris, G.A. Chapter 8: The Social Hotspots Database Context of the SHDB. Sustain. Pract. Guid. Soc. Anal. Assess. 2015, 200, 52–73. [Google Scholar]
  26. Benoît Norris, C. Data for social LCA. Int. J. Life Cycle Assess. 2014, 19, 261–265. [Google Scholar] [CrossRef]
  27. Benoit-norris, C.; Cavan, D.A.; Norris, G. Identifying Social Impacts in Product Supply Chains: Overview and Application of the Social Hotspot Database. Sustainability 2012, 4, 1946–1965. [Google Scholar] [CrossRef]
  28. Duchin, F.; Levine, S.H. The rectangular sector-by-technology model: Not every economy produces every product and some products may rely on several technologies simultaneously. J. Econ. Struct. 2012, 1, 3. [Google Scholar] [CrossRef] [Green Version]
  29. Duchin, F.; Levine, S.H. Choosing among alternative technologies: Conditions for assuring the feasibility of an input–output database or scenario. Econ. Syst. Res. 2017, 29, 541–556. [Google Scholar] [CrossRef]
Figure 1. Flowchart of overall methodology (rectangles denote models and databases; circles denote inspection points, hexagons denote data preparation steps).
Sustainability 10 03193 g001
Figure 2. A BES schematic: describes the system’s technical utility: (i) organic wastewater treatment, and (ii) organic acid production or (iii) metal recovery, and major BES components: (a) anode, (b) cathode, (c) membrane, (d) cathodic catalyst: indium or bacteria, (e) catholyte: KHCO3 or spent lees, and (f) current collectors.
Sustainability 10 03193 g002
Figure 3. SHDB methodology.
Sustainability 10 03193 g003
Figure 4. SHIs of the BES components per country of import across five social impact categories. (A) shows SHIs for PTFE, (B) shows SHIs for polyacrylonitrile, (C) shows SHIs for KHCO3, (D) shows SHIs for indium, and (E) shows SHIs for copper.
Sustainability 10 03193 g004aSustainability 10 03193 g004b
Table 1. Social impact categories, their respective social themes and stakeholders.
Social Impact CategoriesSocial ThemesStakeholder
Labour Rights and
Decent Work
Child labourWorkers
Forced labour
Excessive working time
Poverty
Wage assessment
Migrant labour
Collective bargaining
Inadequate social benefits
Health and SafetyInjuries and fatalitiesWorkers and
society
Toxics and hazards
Human RightsIndigenous rightsSociety and
local community
Gender equity
High conflict
GovernanceLegal systemSociety and
value chain actors
Corruption
Community
Infrastructure
Drinking waterSociety and
local community
Improved sanitation
Hospital beds
Table 2. Weights for each risk level.
Weighting Factors Risk Levels
10Very high
5High
1Medium
0.1Low
Table 3. UK imports of commodities required for the BES components by country of origin, region, trade value (in $USD ‘000) and sectors on the SHDB.
InventoryCountryRegionTrade ValueSHDB Sector
Polytetrafluoroethylene (PTFE)GermanyEurope8160Chemicals, rubber and plastic products
ItalyEurope2992
BelgiumEurope2863
USAN. America2723
IndiaAsia2023
PolyacrylonitrileSpainEurope818Chemicals, rubber and plastic products
BelgiumEurope729
Rep. of KoreaAsia654
ItalyEurope484
USAN. America155
Potassium bicarbonateGermanyEurope4329Chemicals, rubber and plastic products
Rep. of KoreaAsia728
USAN. America605
ItalyEurope391
IrelandEurope227
IndiumGermanyEurope11,456Metals nec.
USAN. America10,918
BelgiumEurope1532
EstoniaEurope847
CanadaN. America681
CopperGermanyEurope580,054Metals nec.
BelgiumEurope347,562
KazakhstanAsia279,130
TurkeyEurope90,356
ItalyEurope89,889
SpainEurope85,112
GreeceEurope68,710
Russia *Europe66,159
ZambiaAfrica60,966
HungaryHungary47,512
IrelandEurope44,317
USAAmerica41,624
SwedenEurope39,942
* not part of the EU.
Table 4. Weighted risks of the BES components. labour rights and decent work is expressed in child labour medium risk hour-equivalent (CL mhr eq), health and safety is expressed in injuries and fatalities medium risk hour-equivalent (IF mhr eq), human rights is expressed in gender equality medium risk hour-equivalent (GE mrh eq), governance is expressed in legal system medium risk hour-equivalent (LS mhr eq) and community infrastructure is expressed in drinking water medium risk hour-equivalent (DW mhr eq).
CountriesLabour Rights and Decent Work Health and SafetyHuman RightsGovernanceCommunity Infrastructure
PTFEGermany2,577,1742,119,651584,900561,975703,444
Italy1,501,2171,354,188379,546544,078215,612
Belgium3,325,4781,507,194806,2991,046,476876,013
USA2,962,025701,936370,338470,814238,298
India73,356,71535,550,94027,155,48620,484,8998,263,333
PolyacrylonitrileSpain591,383544,91797,013142,91871,735
Belgium1,151,553521,914279,207362,376303,347
Korea1,332,786608,275276,474342,838257,752
Italy330,649298,26583,596119,83547,489
USA229,95854,49528,75136,55218,500
KHCO3Germany1,860,3871,530,115422,223405,673507,796
Korea1,485,032677,760308,056382,001287,195
USA895,877212,304112,010142,40072,074
Italy266,690240,57067,42696,65538,303
Ireland208,743109,11949,41532,08628,300
IndiumGermany12,410,9365,482,4842,974,9474,726,0564,700,009
USA14,726,4343,516,7191,599,9881,821,052982,496
Belgium16,339,1112,933,7764,237,6138,003,8997,792,364
Estonia2,002,0891,106,674349,829570,115400,539
Canada511,532263,10293,228106,05959,416
CopperGermany628,404,804277,595,465150,630,942239,295,108237,976,295
Belgium3,705,652,779665,370,095961,075,6451,815,256,1171,767,280,628
Kazakhstan2,404,645,4605,179,686,690981,873,3812,388,544,991841,536,953
Turkey399,437,194204,898,945118,076,68376,136,84537,831,224
Italy151,446,22290,742,86135,797,25164,360,42440,504,452
Spain52,804,71065,842,1376,664,58311,133,9445,445,993
Greece87,859,73751,152,20020,149,23634,057,48612,301,866
Russia392,250,069189,972,35988,226,634135,381,62882,321,925
Zambia839,948,514346,915,625355,717,051253,052,828355,099,991
Hungary93,568,77468,144,91715,269,80035,691,96020,276,281
Ireland32,321,68918,454,6127,416,7206,915,8756,301,878
USA56,141,44313,406,7556,099,6186,942,3813,745,559
Sweden18,594,24016,602,5424,164,3495,043,0233,944,785

