Reutilization of Green Waste as Compost for Soil Improvement in the Afforested Land of the Beijing Plain

1
College of Forestry, Beijing Forestry University, Beijing 100083, China
2
Jianshui Research Station, School of Soil and Water Conservation, Beijing Forestry University, Beijing 100083, China
*
Author to whom correspondence should be addressed.
Sustainability 2018, 10(7), 2376; https://doi.org/10.3390/su10072376
Submission received: 20 May 2018
/
Revised: 25 June 2018
/
Accepted: 2 July 2018
/
Published: 9 July 2018
(This article belongs to the Section Environmental Sustainability and Applications)
Abstract
:Resource utilization of urban green waste compost for soil improvement in afforested land is an important way of digesting urban green waste. In this study, artificial Sophora japonica Linn. Woodland in the Beijing plain, where the million mu (66,700 ha) afforestation project was carried out, was taken as an experimental area to investigate the influences of urban green waste composting on soil improvement and soil microorganisms. Application amounts of green waste composts for each tree were as follows: CK treatment: no application of fertilizer; T1 treatment: 5 kg/each tree; T2 treatment: 10 kg/each tree; T3 treatment: 15 kg/each tree. Results showed that the application of green waste had a significant effect on soil improvement, such as improving of organic matter, available phosphorus, and available potassium content (p < 0.05). The high-level application amount (T3 treatment) had a greater effect on soil improvement. Compared with the control treatment (CK), soil pH in T3 treatment decreased to 7.28–7.45, Soil organic matter contents reached more than 35 g·kg−1, and soil total nitrogen, soil available phosphorus, and soil available potassium increased by 25–28%, 200–400%, and 80–177%, respectively. Soil carbon–nitrogen ratio has increasing to 15.61–24.38 in the three treatments, which would not obviously slow down the decomposition of organic matter by microorganisms in the soil. After the application of green waste compost, the soil microbial structure was changed. From the operational taxonomic unit (OTU) level, bacterial abundance increased by 12–13%, but the change in bacterial diversity was not significant. The influences of pH and contents of organic matter content, available phosphorus, and rapidly available potassium on the bacterial community were greater. This study will provide the necessary scientific basis for the application of green waste compost in the improvement of soil on afforested land in the Beijing plain.
1. Introduction
Urban green wastes generally comprise of garden or park waste such as grass or flower cuttings, fallen leaves, and branch trimmings. With accelerated urbanization progress all over the world, garden and park areas have been continuously increasing, and urban green wastes been surging. Consequently, digestion and treatment of urban green waste have been one of the major environmental problems faced by urban administration [1]. It was estimated that the total amount of green waste in Beijing had exceeded 5 million tons with insufficient digestion and disposal. If these wastes are simply disposed of by traditional means, like landfill and incineration, it will result in the waste of resources and severe environmental pollution [2].
Green waste compost is a new concept for resource utilization developed in recent years [3], which is applied to floricultural substrate or substrate for nursery-grown plant production in most areas [4,5,6]. Recently, green waste compost has become an important means of relieving urban green waste and amending urban polluted soil [7,8,9].
The following urban forestry concept developed rapidly, and a large amount urban marginal land has been used for afforestation to beautify urban landscape [10,11]. As a large megacity in Asia, Beijing has made efforts to conduct large-scale afforestation activity for more than 50 years [12], especially in early 21st century, when an ambitious afforestation project had been implemented, in which it was expected that within five years (2012–2016) there would be a million mu (66,700 ha) of urban forests established on the plains as a natural, harmonious, and healthy forest ecosystem [13,14]. However, the majority of the afforested land used was marginal land characterized by poor soil organic matter and nutritive elements (nitrogen, phosphorus, and potassium), and hence enormous fertilizers or manure were added to maintain or amend soil fertility [15,16], which provided broad application and digestion prospects for urban green waste compost [17].
Few reports can be found for forest-related soil improvement with green waste compost [18]. Green waste compost has the advantages of low pollution and less investment [19,20], and it contains large amounts of organic matter, but when the compost product was added in the poor soil of the afforested land, the effects on increasing soil organic matter and rapidly available nutrients are not clear due to easy volatilization and leaching loss of the nutrient. Another problem is that the application of green waste compost would greatly increase the carbon–nitrogen ratio in soil, which would adversely impact the decomposition of organic matter by bacteria. Many researchers have focused on the improvement of compost product, but there are few studies that focus on soil improvement by the application of green waste compost in afforested land. Moreover, green waste compost contains large amount of microorganism communities. When mixed with the soil, a large number of microorganisms are brought into the soil and increase the soil microbes. These microorganisms may have a significant impact on the accumulation of soil nutrients and decomposition of organic matter, but the effect of promoting the increase of microorganism species and communities in forest soil has not been sufficiently studied.
This work is a new attempt to study the application of green waste compost for soil improvement in the afforested land. The concern of the forestry department of Beijing is whether the compost has a good effect on soil improvement in afforested land and whether a suitable amount of green waste can be digested by applying it in the afforested land. This study’s aims at two-fold: (1) to find suitable amount of green waste compost to improve the soil physiochemical properties by investigating the influences of different application amounts of green waste compost on soil physiochemical properties, soil carbon-nitrogen ratio, and soil microorganisms, and (2) to analyze the influences changes to soil physiochemical properties on soil microorganisms communities in the afforested area of Beijing. This study will provide a theoretical support for the application of green waste compost in the afforestation area of Beijing.
2. Materials and Methods
2.1. Study Area
The experimental site is located at Yufa Town, Daxing District, in the Beijing plain (116°18’ E, 39°30’ N), where a large-scale plain afforestation project (1 million Mu) was carried out (Figure 1). It is 35 km from the Daxing city area and is located on Yongding River alluvial plain. The average elevation is 22 m. It belongs to a warm temperate zone with semi-humid continent monsoon climate, and the annual average temperature and precipitation are 11.6 °C and 556 mm, respectively. The soil mother rock is limestone, and the soil type is sandy soil. A three-year-old landscape tree species, Sophora japonica Linn, was planted in the experimental site with 3.5 m belt space and 2 m individual space.
2.2. Material
The green wastes consisted of fallen leaves and branch trimmings collected from the Olympic Park and the Beijing Botanic Garden in Beijing. Physiochemical properties of green waste were tested in Table 1. The whole composting experiment was conducted at Beijing Jingpuyuan Bioengineering Co., Ltd. (Beijing, China). During the composting preprocess, the green waste was cut into small pieces (about 1 cm particle size), and raw material was added to three digester cells (6 m long, 2 m wide, and 1.5 m high; non-covered cement containers). The moisture content of these raw materials was adjusted to about 60–70%, and urea was added to adjust the initial C/N ratio to 25–30 of the composting materials to optimize microbial activity. A mixture of Trichoderma spp. (60%, v/v) and Phanerochaete chrysosporium Burdsall (40%, v/v) was added to the composting materials as microbial inoculum in order to accelerate the composting process. During composting process, water was monitored each week throughout the composting period to maintain it at 60–70%. To ensure an adequate oxygen supply and to accelerate microbial activity, an automatic compost-turning system (made by Beijing Jingpuyuan Bioengineering Co., Ltd.) was used to turn the compost pile for 40 min every day. The temperature of pile increased to 50–60 °C on the third day and was maintained between 50–60 °C for about six days. After about 42 days, when the temperature of pile was equal to ambient temperature, the composting process was over. The final product was transported to experimental site for application.
The stability and safety of the compost product were important for using of the green waste compost. In this study, the physiochemical properties of the final green waste compost were tested before the application in the afforested land (Table 2). According to many studies, to ensure compost maturity, stability, and safety, the temperature of the compost pile must be sustained in the range of 50–60 °C for at least three consecutive days, indicating that the thermophilic period was sufficient to kill pathogens in the compost. A germination index (GI) value > 80% [21], a final pH value between 6.5–7.5, EC values lower than 4 mS/cm [22], CEC values > 60 cmol/kg [23], a ratio of E4/E6 (optical densities at 465 nm for humic acid and 665 nm for fulvic acid) of at least 1.7 [24], a ratio of C/N < 20 [25], and a final NH4+1-N/NO3–1-N ratio < 3 [26] indicate the absence of compost phytotoxicity and also indicate compost maturity and stability. From Table 2, all the indexes indicated the final green waste compost in our study was well stabilized and mature. We also determined the amount heavy metal in the final green waste compost. According to the National Standard of the People’s Republic of China (GB/T 23349-2009) ecological index of arsenic, cadmium, lead, chromium, and mercury for fertilizers, the concentration of As, Cd, Pb, Cr, and Hg and their compounds need to be lower than 50,10, 200, 500, and 5 mg/kg indicated harmless of ecology. The results of Table 2 indicated that the heavy metal of As, Cr, Pb, Cd, and Hg are in the range of harmless of ecology.
The experiment started in July 2016. Four treatments with different application amount of green waste compost were designed: control (CK), 5 kg compost each tree (T1), 10 kg compost each tree (T2), and 15 kg compost each tree (T3). Randomized blocks design was adopted with three replications for each treatment, and 10 trees were treated for each replication. Soil sampling (0−40 cm) was carried out from experimental site before compost application. Then, a 10 cm deep and 160 cm wide compost application ring was dug for each tree stem. The soil and compost were blended evenly. Finally, the blended soil was backfilled into the ring as surface cover. As long as the compost application continued, enough water for each treated tree was irrigated manually. Then, conventional irrigation was implemented.
In July 2017, soil samples from 0–10 cm, 10–20 cm, and 20–40 cm layers in each experimental block were taken with 40 cm far from the center of the tree. An S-type sampling method was used to take one five-point blended soil sample in every block (Figure 2). Soil sub-samples taken with the quartering method were air dried, sufficiently blended and ground, and then passed 1 mm and 0.5 mm sieves for determining their physicochemical characteristics. Soil samples for bacteria diversity determination were collected from the top 0 cm to 10 cm of surface soil within the planting pits for microbial analyses. Samples were put in a drikold box, transferred to the laboratory, and stored in at −80 °C freezer before being tested.
2.3. Determination Method of Indexes
All the soil samples including those taken before and after compost application were analyzed in the laboratory. Soil bulk density (BD) was determined using the cutting-ring method. Soil pH was determined directly for soil leaching liquor after filtering using potentiometry according to a 1:5 water-soil ratio. Soil organic matter was determined using the dichromic acid oxidation dilution heating method. Total nitrogen was determined with the Kjeldahl apparatus distillation method. Total phosphorus and total potassium were determined through the Mo-Sb colorimetric method and the flame photometer method, respectively. Available phosphorus was determined through the sodium bicarbonate-Mo-Sb colorimetric method. Rapidly available potassium was determined by the ammonium acetate digestion-flame photometer method. The determine method was used according to the literature [27,28,29].
Three composting samples were collected from the top, middle, and bottom of each digester cell using the method of quartering. The three 200 g samples were combined into one composite sample, which was then divided into three parts. The first part was air-dried, the second part was oven-dried at 65 °C, and the third part was not dried. These samples were used to determine the physiochemical properties. The methods to determine the physiochemical properties of the final green waste compost were used according to the literature [30,31,32]. To determine the heavy metals content, composting samples were digested with sulphuric acid, and the digested liquid was analyzed by inductively coupled plasma mass spectrometry (ICP-MS).
2.4. DNA Extraction, PCR Amplification, and High throughput Sequencing
Total genomic DNA was extracted from the fresh soil samples using a Fast DNA® SPIN Kit for Soil (MP Biomedicals, Santa Ana, CA, USA). The integrity of DNA was validated by agarose gel electrophoresis. The quantity and purity of DNA were checked by NanoDrop2000 spectrophotometer (Thermo Fisher Scientific, Waltham, Massachusetts, USA). The universal 16S rRNA gene primers 515F (5′-GTGCCAGCMGCCGCGG-3′) and 970R (5′-CCGTCAATTCMTTTRAGTTT-3′) were used for the amplification and subsequent high-throughput sequencing of the PCR products [33]. The Polymerase Chain Reaction (PCR) reactions were performed using TransGen AP221-02: TransStart Fastpfu DNA Polymerase (TransGen Biotech Ltd. Beijing, China). Each 20-μL PCR mixture contained 4 μL of Fast Pfu Buffer (5× Transgen), 2 μL of 2.5 mm dNTPs, 0.8 μL of Forward Primer (5 μM), 0.8 μL of Reverse Primer (5 μM), 0.4 μL of FastPfu Polymerase, 10 ng of Template DNA, and ddH2O to 20 μL. All of the qPCR reactions were performed in triplicate by ABI GeneAmp® 9700 PCR. The PCR protocol was performed by initial denaturation at 95 °C for 3 min, followed by 30 cycles of denaturation 30 s at 95 °C, annealing 30 s at 55 °C, primer extension 30 s at 72 °C, and finally 10 min at 72 °C, 10 °C until halted by user. Amplified products were detected by 2% agarose gel electrophoresis and washed with Tris-HCl. PCR products sequencing was conducted by Shanghai Majorbio Bio-pharm Technology Co., Ltd. (Shanghai, China), using an Illumina MiSeq platform PE300 (San Diego, CA, USA) to measure diversity and composition of the bacterial community.
2.5. Data Analysis
SPSS17.0 software was used for one-way analysis of variance (ANOVAs) of the nutrient contents and organic matter, and Duncan’s test was used to compare difference significance of the nutrient contents and organic matter between treatments (p = 0.05) [34].
Operational taxonomic unit (OTU) was defined as units with a 97 percent similarity level [35]. Chao1 index was used to estimate total number of OTU in the sample, and it reflected bacterial abundance—the greater the Chao1, the higher the bacterial community abundance [36]. Bacterial community diversity was expressed by Shannon and Simpson indexes. The greater the Shannon index or the smaller the Simpson index, the higher the bacterial community diversity [37]. Indexes computational methods referred to the literature [38,39]. Redundancy analysis (RDA), which has proved to be a good method and is widely used for the analysis of the relation between soil factors and bacterial community in recent years [40,41], was conducted using Canoco 5.0 [42,43].
3. Results
3.1. Influences of Green Waste Compost on pH and Organic Matters
Before the application of the green waste compost, soil pH was alkalescent. The total nitrogen of the soil was between 0.67–0.76 g·kg–1, available phosphorus of soil was between 4.46–5.50 mg·kg–1, and rapidly available potassium was between 42.37–105.98 mg·kg–1 (Table 3). Organic matter content was between 17.77–21.69 mg·kg–1. The nutrients content and organic matter content in the soil were at low levels.
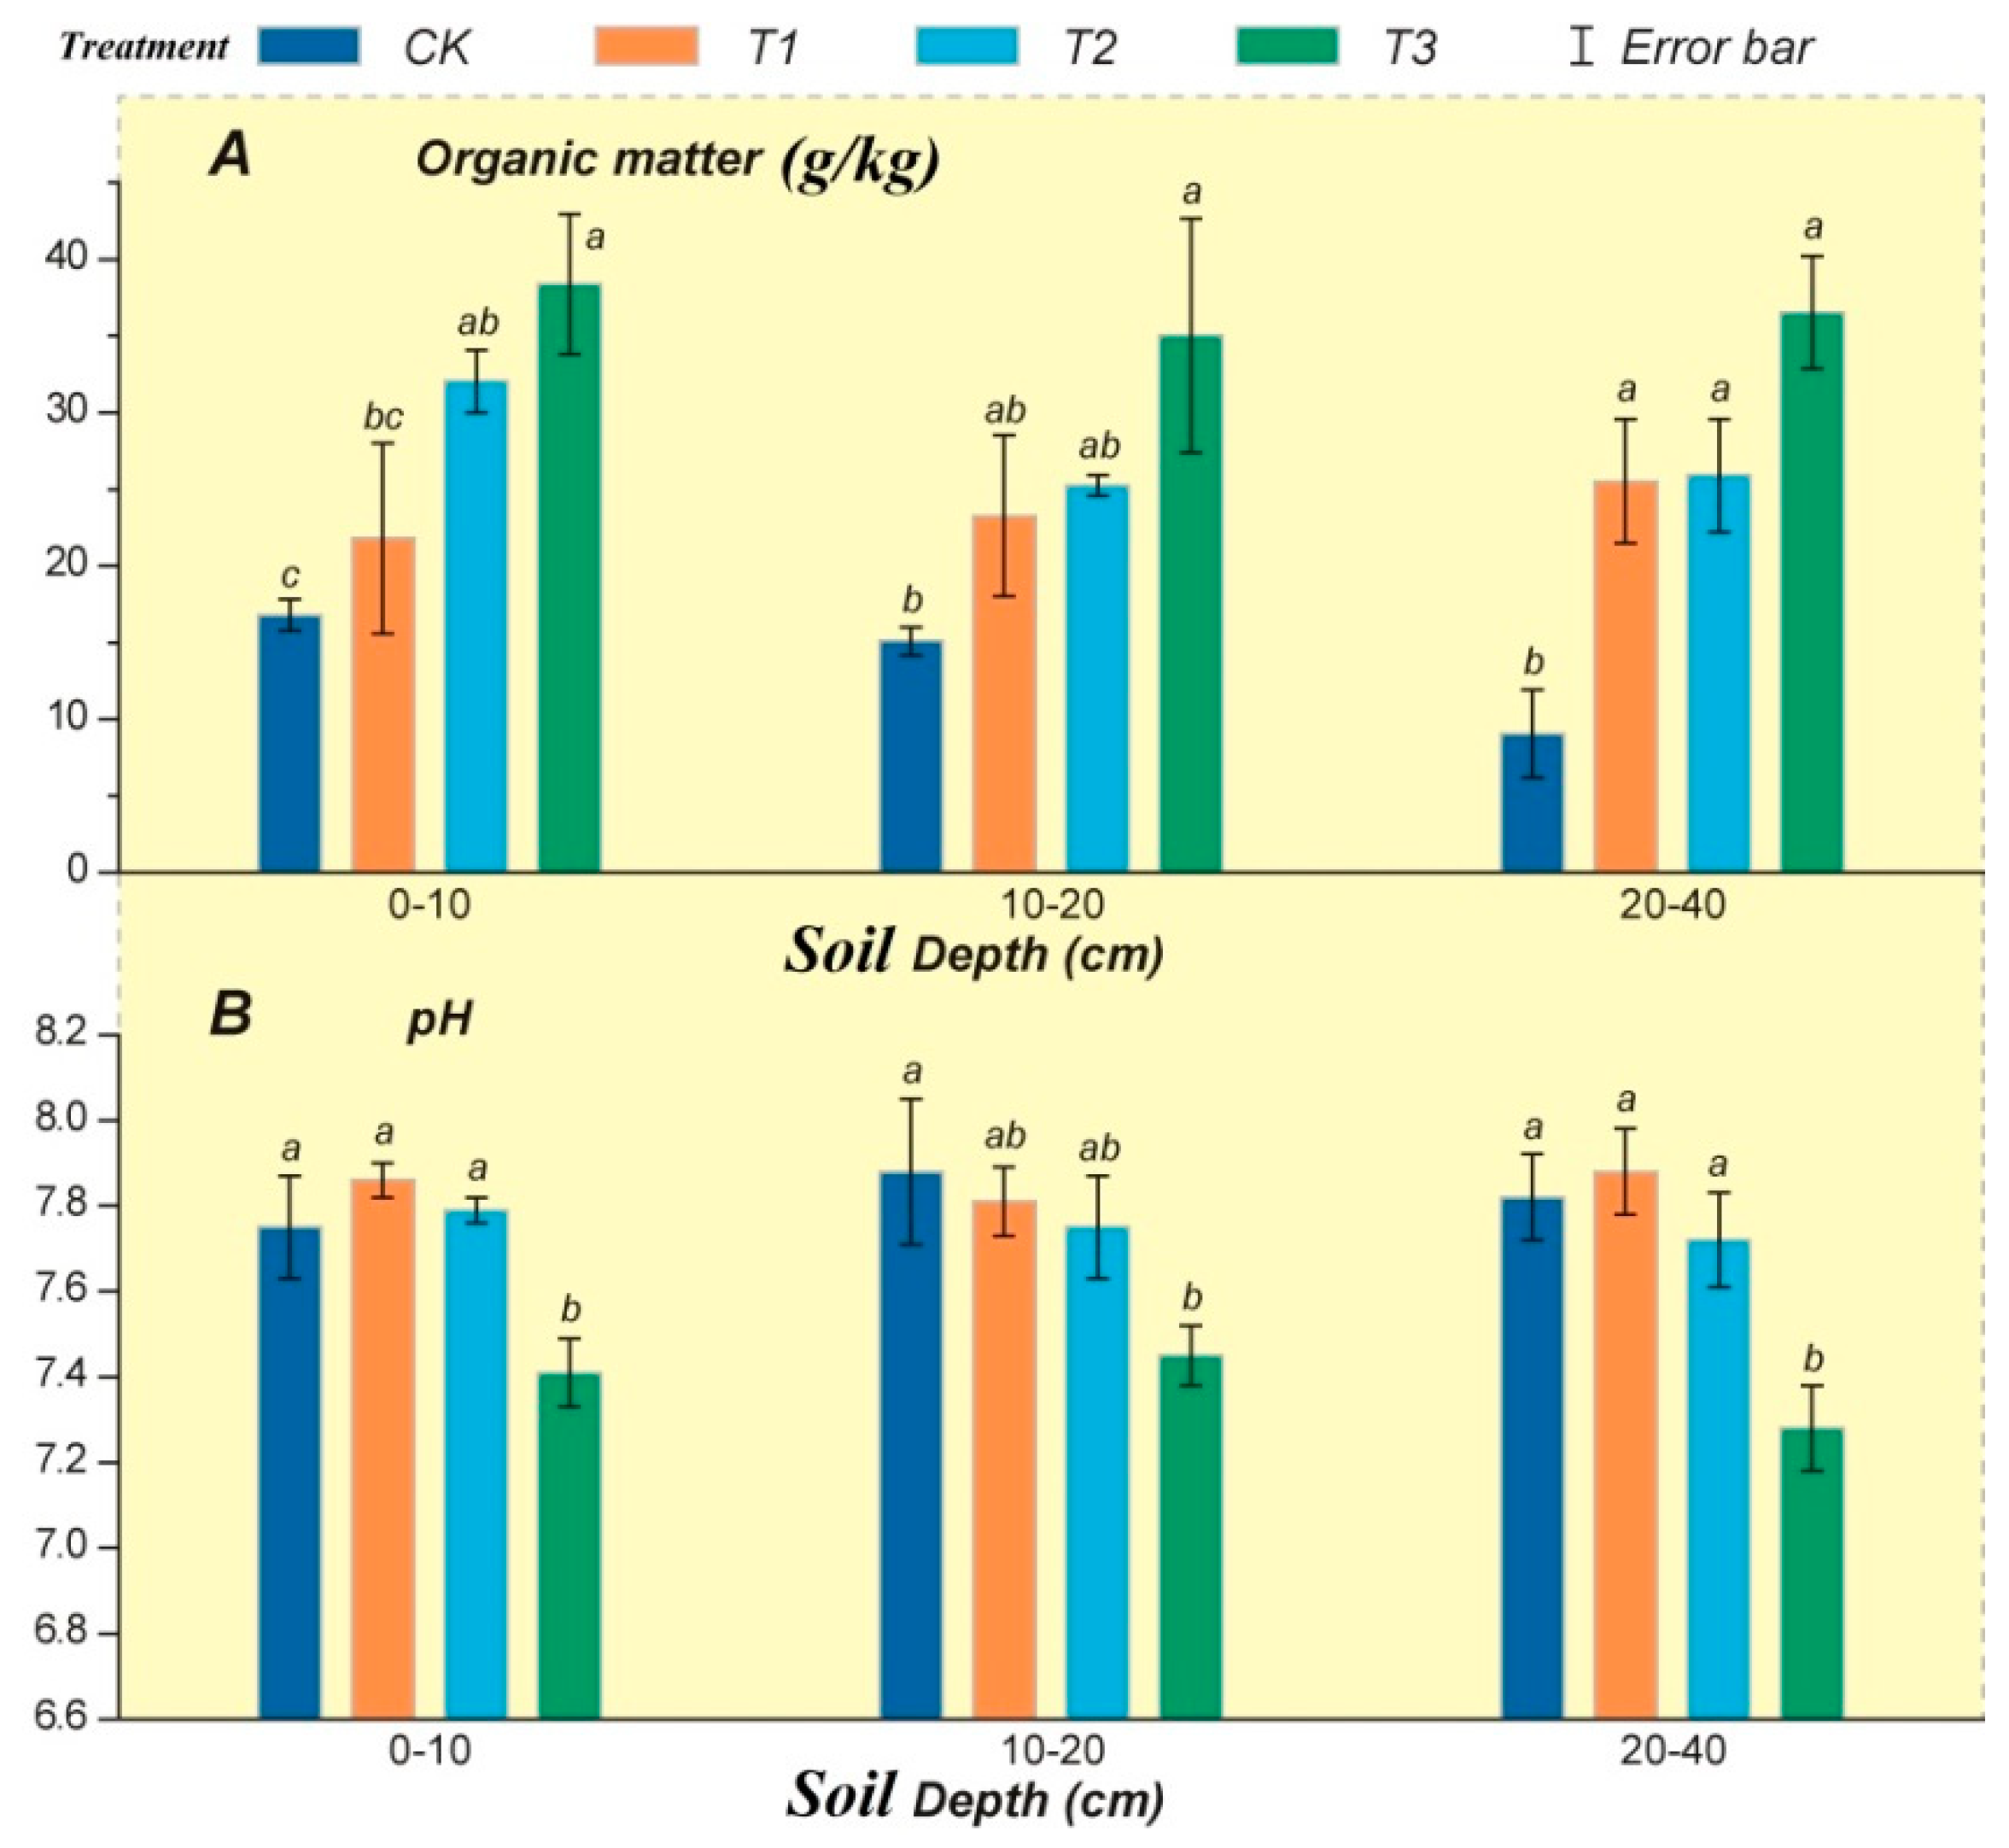
The application amount of green waste compost had great influence on soil organic matter for each tree. Organic matter contents in three treatments presented a gradually rising tendency as application amount increased (Figure 3A). Organic matter contents in the deep soil layer (20–40 cm) in T1 and T2 treatments were significantly higher than CK treatment, but in the shallow soil (0–10 cm), organic matter shown no significant difference among T1, T2, and CK treatments (p < 0.05). Organic matter contents in all the three soil layers were shown significant deference between T3 and CK treatments (p < 0.05). Average organic matter contents in CK, T1, T2, and T3 were 13.64 g·kg−1, 23.53 g·kg−1, 27.74 g·kg−1, and 36.64 g·kg−1, respectively. Soil organic matter contents in T3 treatment at three soil layers were all higher than 35 g·kg−1. Organic matter contents at 0–10 cm, 10–20 cm, and 0–40 cm soil layers in T3 treatment increased by 128.4%, 132.1%, and 304.3%, respectively, compared with the CK treatment.
Soil pH values for different treatments are shown in Figure 3B. Results showed that soil pH was alkaline in all the four treatments in the experiment, and differences in soil pH were not significant at 0–10 cm, 10–20 cm, and 20–40 cm soil layers. Application amounts of green waste composts had different influences on pH values. Average soil pH values in CK and T1, T2, and T3 treatments at three soil layers were 7.81, 7.85, 7.75, and 7.35, respectively. Soil pH value showed a decline tendency as compost application amount increased. Compared with CK treatment, T3 treatment significantly reduced soil pH in all three layers (p < 0.05), while T1 and T2 treatments had insignificant influences on change of soil pH value (p < 0.05).
3.2. Influence of Green Waste Compost on Total Nutrients and Carbon–Nitrogen Ratio in Soil
Different application amounts of green waste compost had different influences on soil total nitrogen, total phosphorus, and total potassium.
Compared with CK, only the T3 treatment could significantly increase soil total nitrogen (p < 0.05), while influences of T1 and T2 treatments on total nitrogen were insignificantly different from that of CK (p < 0.05) (Figure 4A). Soil total nitrogen contents in CK, T1, and T2 treatments were basically within 0.7–0.85 g·kg–1. Total nitrogen content was higher in T3 treatment, and it was between 0.85–1.09 g·kg–1 at three soil layers, which increased by 25–28% compared with CK.
Soil total phosphorus content at 0–10 cm soil layer was higher than those at 10–20 cm and 20–40 cm soil layers at the experimental site. Soil total phosphorus contents in the treatments at 0–10 cm and 10–20 cm soil layers were insignificantly different from that in the CK. In deep soil layer (20 cm–40 cm), compared with CK, T3 treatment significantly increased soil total phosphorus content, and soil total phosphorus contents in T3 treatment at all layers reached above 0.25 g·kg–1 (Figure 4B).
Soil total potassium content reflected the potential capacity of the soil potassium supply. From Figure 4C, total potassium contents in the T1 and T2 treatments were significantly lower than that in CK by 18–43%. Soil total potassium content in the T3 treatment was significantly higher than that in CK, rising to above 17–21 g·kg–1. Compared with CK, total potassium contents in the T3 treatment at the three soil layers increased by 24.2%, 21.5%, and 54.8%, respectively.
If the carbon–nitrogen ratio of green waste compost was high, its application would seriously influence the soil carbon–nitrogen ratio so as to affect microbial activities in the soil. It can be seen from Table 4 that the soil carbon–nitrogen ratio was within 7.54–11.50 in CK treatment, but it would gradually increase as application amount increased. In the T1 and T2 treatments, soil carbon–nitrogen ratios increased to 15.61–17.97, and 18.97–21.34, respectively. Soil carbon–nitrogen ratio increased to above 20 in T3 treatment. Soil carbon-nitrogen ratio in T3 treatment at 20–40 cm soil layer reached a very high level, being 24.38.
3.3. Influence of Green Waste Compost on Soil Available Nutrients
Soil available phosphorus was a more important index measuring the supply status of soil phosphorus and played a significant role in the aspect of soil diagnosis and fertilization, but available phosphorus in the soil was sometimes unrelated to total phosphorus content. From Figure 5A, the three treatments all significantly increased soil available phosphorus content (p < 0.05). The T3 treatment could increase soil available phosphorus most significantly, and it could increase soil available phosphorus by about 2–4 times compared with CK, increasing from 5–15 mg·kg–1 in CK to 30–40 mg·kg–1 at the three soil layers. The T1 and T2 treatments increased soil available phosphorus by about 1–3 times.
Rapidly available potassium in soil included potassium in soil solution and exchangeable potassium adsorbed on soil colloid surface, both of which would be easily absorbed and utilized by plants. As shown in Figure 5B, soil rapidly available potassium content in CK treatment was only 60–70 mg·kg–1, which was a low level. Rapidly available potassium content gradually increased as the application amount of green waste compost increased. Both T1 and T2 treatments increased soil rapidly available potassium content to a certain degree, but most of their difference was insignificant (p < 0.05). However, the T3 treatment had significant influence on soil rapidly available potassium content compared with the CK treatment (p < 0.05). Rapidly available potassium content in T3 treatment increased by 80–177% compared with CK. Soil rapidly available potassium content in T3 treatment already reached 130–150 mg·kg–1, which was at a superior level according to the Beijing soil nutrient standard.
3.4. Influence of Application Amount on Soil Microorganisms
Figure 6 showed that application amount had obvious influence on microbial bacterial species in soil. At OTU level, the amount of bacterial OTU species after fertilization in T1, T2, and T3 treatments increased from 2940 to 3113, 3303, and 3308 or by 5.88%, 11.66%, and 11.14%, respectively (Figure 6A). At the microbial phylum level, bacterial phylum in T1, T2, and T3 treatments increased from 30 to 32, 33, and 34, respectively (Figure 6B). After compost application, the four new microbial phyla appeared in the soil as Deferribacteres, Fusobacteria, TA06, and Candidate_division_OP11, while BD1-5 bacterium disappeared in CK. Proportions of new microbial phylum (abundance) in all treatments were lower than 1%.
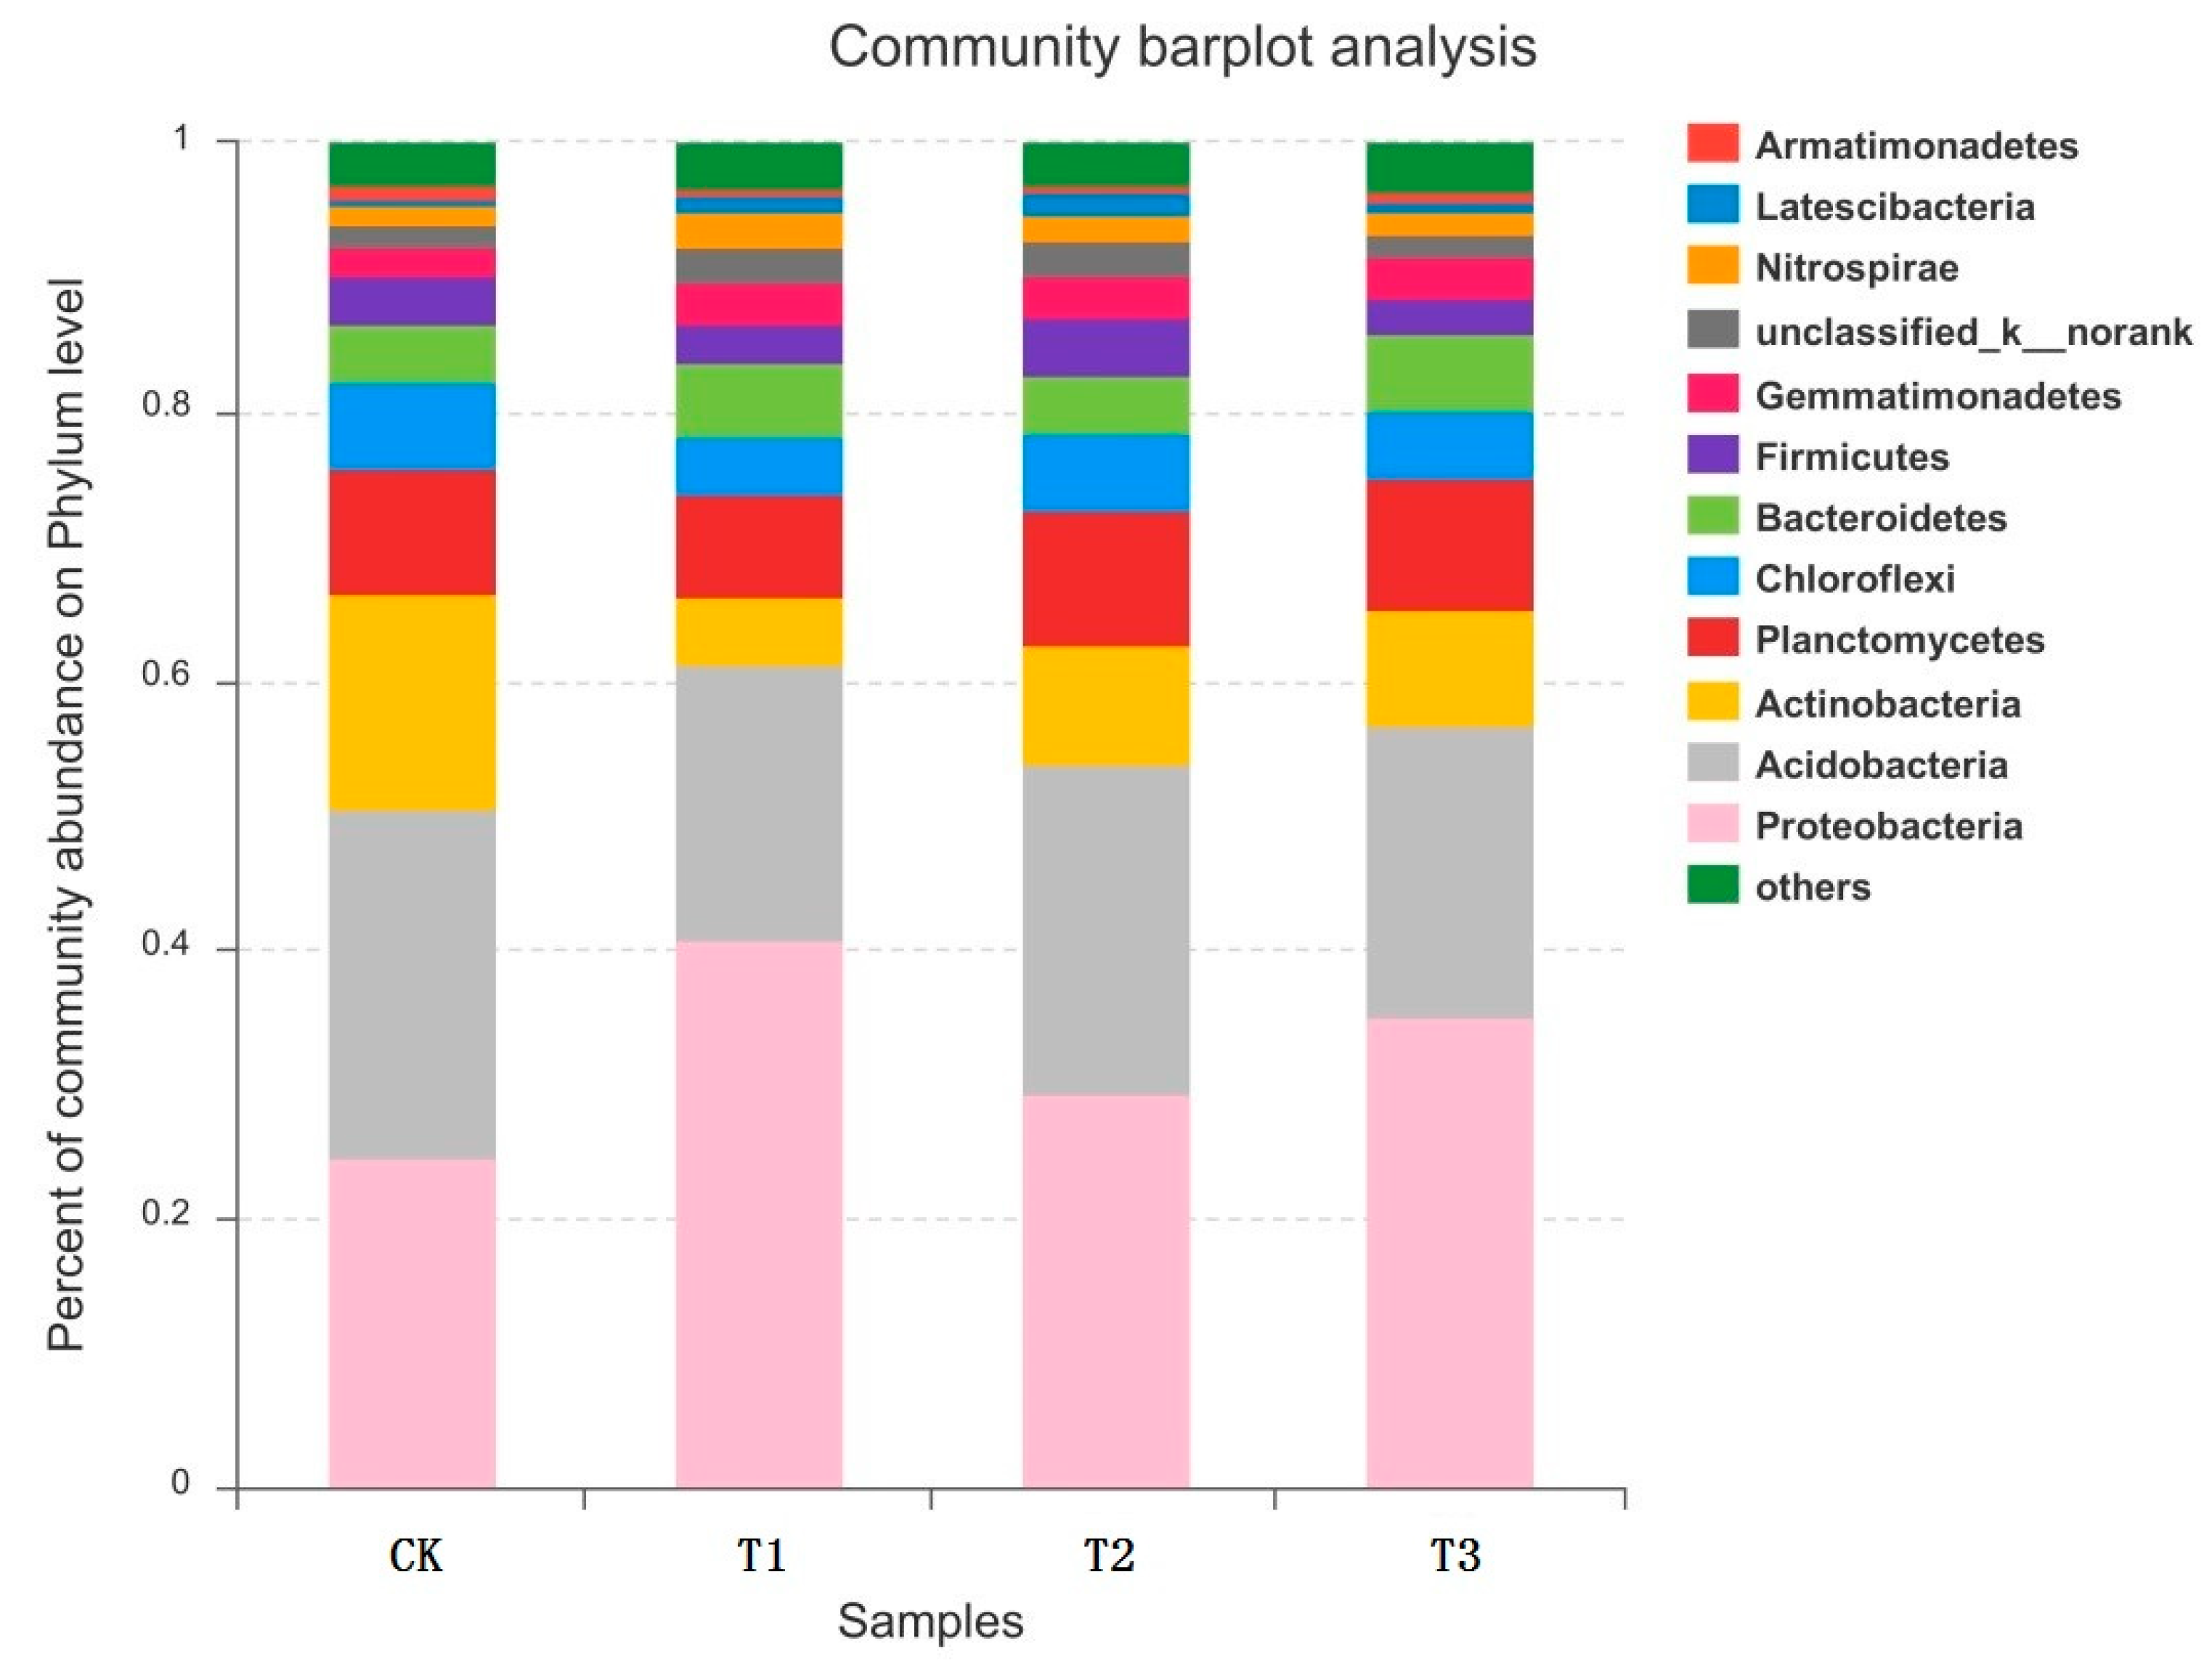
Figure 7 indicated that in aspect of phylum classification, there were nine phyla of predominant bacteria with abundances being greater than 1%, and the sum of their abundances occupied about 95% of total soil bacteria in all the samples of the four treatments. Proteobacteria, Acidobacteria, Actinobacteria, Planctomycetes, Chloroflexi, Bacteroidetes, Firmicutes, Gemmatimonadetes, and Nitrospirae were predominant bacteria in all treatments, averagely occupied 33.43%, 23.98%, 9.75%, 9.22%, 5.22%, 4.91%, 3.28%, 2.68%, and 2.51% respectively in total bacteria amount.
After compost application, percentages of Proteobacteria and Gemmatimonadetes microorganisms presented an obvious rising tendency. Proportions of Proteobacteria increased to above 30% after application treatment, and maximum value was 41.7% in T1 treatment. Proportions of Gemmatimonadetes increased to 3.0% in T3 treatment from 1.9% in CK treatment. Proportions of Acidobacteria, Actinobacteria, and Chloroflexi microorganisms had obvious descending tendency, where decrement proportion of Actinobacteria was large, decreasing from 16.2% in CK treatment to about 5–9% for application treatments.
Table 5 reflects indexes related to bacterial abundance and diversity in different treatments as well as coverage rates in DNA library. Coverage rates in all treatments in soil DNA library were all above 97%, which indicated that the experiment could reflect real sample status, and microbial species information in different samples were basically manifested. Analysis results in Table 5 showed that the Chao1 index and ACE index both had an obvious rising tendency as the application amount increased, with both reaching maximum values in the T2 treatment. The Shannon and Simpson indexes had contrary tendencies. After the application treatment, the Shannon index presented a certain descending tendency, while the Simpson index had an increasing tendency. The Shannon index was the maximum, and Simpson index was the minimum in the T2 treatment. The CHAO1 index and ACE index can be descended as T2, T3, T1, and CK.
RDA analysis results showed that three treatments had different gathering positions in Figure 8, which meant that three treatments changed soil microbial structure. As shown in the Figure 8, influences of organic matter content (TC), available phosphorus (RP), PH, and rapidly available potassium (RK) contents in soil had great influences on bacterial community, whereas total nitrogen (TN), total phosphorus (TP), and total potassium (TK) content had lower influence on bacterial community. The Proteobacteria, Bacteroidetes, Firmicutes, Gemmatimonadetes, Nitrospirae, and Candidate_division_WS3 were significantly influenced by the pH values. The Amatimonadetes and Cyanobacteria were positively correlated with the organic matter content. The Acidobacteria and Planctomycetes were mainly influenced by the total phosphorus, and the Chloroflexi was mainly influenced by the available phosphorus.
4. Discussion
Undoubtedly, the utilization of green waste compost is a new path for digesting urban green waste. However, it has not been extensively applied to soil improvement in forestry construction. This study’s results showed that green waste compost had a favorable improvement effect on soil in the Beijing plain afforested area and can improve soil nutrients, increase organic matter content, reduce soil pH, and enhance microbial abundance. Therefore, green waste compost has broad application prospects for soil improvement in the Beijing plain afforested area. Although inorganic fertilizer or spent mushroom compost and chicken manure or pig manure also have favorable soil improvement effects [44], green waste compost has the dual effect of waste use and soil improvement. The study results also showed that low-level compost application amount (T1 treatment) had minor influence on soil nutrients, while high-level application amount (T3 treatment) could significantly increase soil organic matter content and soil nutrient content. Hence, soil improvement effect can be significant with scientific control of compost application amount.
However, green waste compost cannot improve all the soil nutrients ideally in Beijing, in reference to the Beijing Gradation and Classification Standard of Soil Nutrients (reference website: http://www.bjtf.org/trgl/trfl/yfpj/pjbz/index.htm). After compost application treatments, soil rapidly available potassium content rose from 60–70 mg·kg–1 to above 130–150mg·kg–1, namely from a low level to a high level, and soil organic matter content rose from 13.64 g·kg–1 to more than 35 g·kg–1, also from a low level to an extremely high level, while soil total nitrogen increased to 0.85–1.09 g·kg–1, and available phosphorus content only rose to 30–40 mg·kg–1—both of them were at medium and low levels. Since there was a major increase in available phosphorus and available potassium for T3 treatment (Figure 5), if fertilizers are to be added to the plantation, N would be required, but relatively less P and K would be required. However, the Chinese government supports this work not only to benefit from increasing the fertilizer effectiveness but also for the digesting a large amount of green waste. More technologies with low cost for raising the fertility of the green waste compost should be developed. In Shanghai city, Gu et al. (2009) concluded that green waste compost application can increase soil total nitrogen and available phosphorus contents, and the soil improvement was superior [45].
After the application of the green waste compost, the soil carbon–nitrogen ratio was among 15.64–24.38, which was not limiting microbial decomposition of organic matter in soil (a carbon–nitrogen ratio below 25 is suitable for the microbial decomposition). In the T3 treatment, soil carbon-nitrogen ratio approximated to 25. If the application amount continues to increase, it will be greater than 25, hence the application amount of green waste compost must be controlled to maintain a lower carbon–nitrogen ratio suitable for the microbial decomposition. Some studies also indicated that the mixed composting of green waste with cow dung, sludge, and other additives could elevate N and P levels in soil and reduce the soil carbon–nitrogen ratio [46,47,48,49], but its influence on environmental safety should be considered.
The application of green waste compost could change microbial structure and diversity in soil. Through RDA analysis in this study, the results showed that the microbial structure was changed and microbial bacterial abundance was obviously strengthened. Microbial structural change would result in microbial functional change. For example, an increase of the proportion of Proteobacteria in this study could give rise to increase of Azotobacteria, while a decrease of the proportion of Actinobacteria could result in reduction of metabolic active substances released by it and related to the promotion of plant growth. Some study results showed that Actinobacteria presented a significant correlation with soil organic matter content or C:N ratio, so the reduction of Actinobacteria might be caused by the increase of soil organic matter [50,51]. However, variation tendencies of bacterial diversity indexes in all treatments were not obvious, and the change of bacterial phylum was also small, which indicated that compost application cannot significantly affect microbial diversity and increase hazardous microorganisms after fertilization. Obviously, it is of benefit for maintaining soil health. This study also showed that organic matter content, available phosphorus, pH, and rapidly available potassium contents had significant influences on bacterial communities in soil, and this was consistent with some other studies [52,53].
According to our study, soil organic matter is linear with weight of green waste compost added, but TN, TP, TK, RP, and RK are non-linear. The reason for the non-linear relationships might be induced by volatilization and leaching losses and bacteria consuming C, N, P, and K in the soil at different relative rates or fungi decomposition. From Figure 8, the organic matter and nutrients were correlated with the bacterial community. It was probably that the bacterial feeding habits that led to a non-linear amount of nutrients. Proteobacteria, Acidobacteria, Actinobacteria, and Planctomycetes account for 75% of the bacteria amount. Acidobacteria and Planctomycetes were correlated with TP, and Chloroflexi was closely correlated with RP, while Actinobacteria was closely related with TC. Feeding habits of these bacteria were key for the different changes of nutrients and organic matter. On the other hand, the fungi, such as Trichoderma sp., Penicillium sp., and Actinomyces sp., play a major role in the decomposition of organic matter in soil [54]. These fungi could also have a major influence on the non-linear nutrient levels. We will investigate these impacts of microorganism in the following research.
5. Conclusions
The million-mu plain afforestation project of Beijing is an important measure to promote the greening of the capital. The influences of different application amounts of green waste compost in soil on its physical and chemical properties as well as microorganisms in the afforested land of Beijing were compared in the experiment, and the following conclusions were drawn:
All the three application amounts of green waste compost could improve soil fertility in the Beijing plain afforested area to a certain degree. Compared to CK treatment, there was less influence for smaller amount of compost application (T1 and T2) and a significant effect for a large amount of compost application in the aspects of improving and increasing nutrient levels of soil total nitrogen, total phosphorus and rapidly available potassium, and improving alkaline soil. In addition, a large amount of compost application can also increase soil C/N ratio to a great degree, but if the application amount is not controlled to a certain degree (less than T3 treatment), it will not adversely impact the microbial decomposition of organic matter. In this study, green waste compost increased total nitrogen and available phosphorus in soil, but the effect was not ideal.
Green waste compost application changed the microbial structure. The percentages of Proteobacteria and Gemmatimonadetes microorganisms presented an obvious rising tendency, but the percentage of Actinobacteria was reduced. Compost application had a favorable effect on strengthening soil microbial abundance but insignificant influence on soil microbial diversity. The influences of soil organic matter content, pH, available phosphorus, and rapidly available potassium contents on bacterial communities in soil were significant. In a word, the application amount in the T3 treatment is proposed for green waste compost application in the plain afforested area of Beijing.
Author Contributions
J.T., X.S., and S.L. conceived the study and designed the experiments; J.T. and B.Q. performed the experiments and analyzed the data; J.T. drafted the manuscript; L.W. helped to revise the manuscript.
Funding
This research was funded by the Beijing Municipal Science and Technology Project grant number [Z161100001116061 and Z151100002115006], grants from the Beijing Municipal Education Commission grant number [CEFF-PXM2017_014207_000043], and Special Fund for Forest Scientific Research in the Public Welfare of China grant number [201504401].
Acknowledgments
We thank the anonymous reviewers and the editor for their valuable and constructive comments.
Conflicts of Interest
The authors declare no conflict of interest.
References
- Meisel, F.; Thiele, N. Where to dispose of urban green waste? Transportation planning for the maintenance of public green spaces. Transp. Res. Part A Policy Pract. 2014, 64, 147–162. [Google Scholar] [CrossRef]
- Liu, J.; Sui, Y.; Yu, Z.; Shi, Y.; Chu, H.; Jin, J.; Liu, X.; Wang, G. High throughput sequencing analysis of biogeographical distribution of bacterial communities in the black soils of northeast China. Soil Biol. Biochem. 2014, 70, 113–122. [Google Scholar] [CrossRef]
- Zhang, L.; Sun, X.Y. Improving green waste composting by addition of sugarcane bagasse and exhausted grape marc. Bioresour. Technol. 2016, 218, 335–343. [Google Scholar] [CrossRef] [PubMed]
- Morales-Corts, M.R.; Gómez-Sánchez, M.Á.; Pérez-Sánchez, R. Evaluation of green/pruning wastes compost and vermicompost, slumgum compost and their mixes as growing media for horticultural production. Sci. Hortic. 2014, 172, 155–160. [Google Scholar] [CrossRef]
- Kazamias, G.; Roulia, M.; Kapsimali, I.; Chassapis, K. Innovative biocatalytic production of soil substrate from green waste compost as a sustainable peat substitute. J. Environ. Manag. 2016, 203, 670–678. [Google Scholar] [CrossRef] [PubMed]
- Tang, J.; Xu, Y.; Luan, Y. Agricultural and Forestry Waste Composts as Substitutes for Peat in Potting Media: Effects on Root Growth and Fractal Features of New Guinea impatiens (Impatiens hawkeri). Agric. Res. 2016, 5, 1–8. [Google Scholar] [CrossRef]
- Beesley, L.; Dickinson, N. Carbon and trace element mobility in an urban soil amended with green waste compost. J. Soils Sediments 2010, 10, 215–222. [Google Scholar] [CrossRef]
- Hartley, W.; Dickinson, N.M.; Riby, P.; Leese, E.; Morton, J.; Lepp, N.W. Arsenic mobility and speciation in a contaminated urban soil are affected by different methods of green waste compost application. Environ. Pollut. 2010, 158, 3560–3570. [Google Scholar] [CrossRef] [PubMed]
- Clemente, R.; Hartley, W.; Riby, P.; Dickinson, N.M.; Lepp, N.W. Trace element mobility in a contaminated soil two years after field-amendment with a greenwaste compost mulch. Environ. Pollut. 2010, 158, 1644–1651. [Google Scholar] [CrossRef] [PubMed]
- Kowarik, I.; Körner, S. Wild Urban Woodlands: New Perspectives for Urban Forestry; Springer Science & Business Media: Berlin, Germany, 2005. [Google Scholar]
- Nielsen, A.B.; Jensen, R.B. Some visual aspects of planting design and silviculture across contemporary forest management paradigms–perspectives for urban afforestation. Urban. For. Urban. Green. 2007, 6, 143–158. [Google Scholar] [CrossRef]
- Pei, N.; Wang, C.; Jin, J.; Jia, B.; Chen, B.; Qie, G.; Gu, L.; Sun, R.; Li, J.; Zhang, C.; et al. Long-term afforestation efforts increase bird species diversity in Beijing, China. Urban For. Urban Green. 2018, 29, 88–95. [Google Scholar] [CrossRef]
- Chen, J.Q.; Wang, X.P.; Yang, X.H.; Zhu, J.G.; Shen, Q.Q. Building up a green Beijing—An ambitious urban forestry program. For. Chron. 2013, 2, 127–128. [Google Scholar] [CrossRef]
- Yu, Z.; Liu, X.; Zhang, J.; Xu, D.; Cao, S. Evaluating the net value of ecosystem services to support ecological engineering: Framework and a case study of the Beijing plains afforestation project. Ecol. Eng. 2018, 112, 148–152. [Google Scholar] [CrossRef]
- Zhang, Z.M.; Yu, X.X.; Song, Q.; Li, J.W. Spatial variability of soil nitrogen and phosphorus of a mixed forest ecosystem in Beijing, China. Environ. Earth Sci. 2010, 60, 1783–1792. [Google Scholar] [CrossRef]
- Hu, K.; Wang, S.; Li, H.; Huang, F.; Li, B. Spatial scaling effects on variability of soil organic matter and total nitrogen in suburban Beijing. Geoderma 2014, 226–227, 54–63. [Google Scholar] [CrossRef]
- Ventorino, V.; Parillo, R.; Testa, A.; Viscardi, S.; Espresso, F. Chestnut green waste composting for sustainable forest management: Microbiota dynamics and impact on plant disease control. J. Environ. Manag. 2015, 166, 168–177. [Google Scholar] [CrossRef] [PubMed]
- Guerrero, C.; Gómez, I.; Moral, R.; Mataix-Solera, J.; Mataix-Beneyto, J.; Hernández, T. Reclamation of a burned forest soil with municipal waste compost: Macronutrient dynamic and improved vegetation cover recovery. Bioresour. Technol. 2001, 76, 221–227. [Google Scholar] [CrossRef]
- Järvis, J.; Ivask, M.; Nei, L.; Kuu, A.; Luud, A. Effect of green waste compost application on afforestation success. Balt. For. 2016, 22, 90–97. [Google Scholar]
- Tits, M.; Elsen, A.; Bries, J.; Vandendriessche, H. Short-term and long-term effects of vegetable, fruit and garden waste compost applications in an arable crop rotation in Flanders. Plant Soil 2014, 376, 43–59. [Google Scholar] [CrossRef]
- Zucconi, F.; Pera, A.; Forte, M.; De Bertoldi, M. Evaluating toxicity of immature compost maturity. Biocycle 1981, 22, 54–57. [Google Scholar]
- Karak, T.; Bhattacharyya, P.; Paul, R.K.; Das, T.; Saha, S.K. Evaluation of composts from agricultural wastes with fish pond sediment as bulking agent to improve compost quality. Acta Hydrochim. ET Hydrobiol. 2013, 41, 711–723. [Google Scholar] [CrossRef]
- Karak, T.; Sonar, I.; Paul, R.K.; Das, S.; Boruah, R.K.; Dutta, A.K.; Das, D.K. Composting of cow dung and crop residues using termite mounds as bulking agent. Bioresour. Technol. 2014, 169, 731–741. [Google Scholar] [CrossRef] [PubMed]
- Zhang, L.; Sun, X.Y. Addition of seaweed and bentonite accelerates the two-stage composting of green waste. Bioresour. Technol. 2017, 243, 154–162. [Google Scholar] [CrossRef] [PubMed]
- Karnchanawong, S.; Suriyanon, N. Household organic waste composting using bins with different types of passive aeration. Resour. Conserv. Recyl. 2011, 55, 548–553. [Google Scholar] [CrossRef]
- Das, M.; Uppal, H.S.; Singh, R.; Beri, S.; Mohan, K.S.; Gupta, V.C.; Adholeya, A. Co-composting of physic nut (Jatropha curcas) deoiled cake with rice straw and different animal dung. Bioresour. Technol. 2011, 102, 6541–6546. [Google Scholar] [CrossRef] [PubMed]
- Sarkar, D. Physical and Chemical Methods in Soil Analysis; New Age International: New Delhi, India, 2005. [Google Scholar]
- Thomas, G.W. Methods of Soil Analysis, Chemical and Microniological Properties, Part 2, 2nd ed.; American Society of Agronomy and Soil Science Society of America: Madison, WI, USA, 1982; pp. 159–165. [Google Scholar]
- Parkinson, J.A.; Allen, S.E. A wet oxidation procedure suitable for determination of nitrogen and mineral nutrients in biological material. Commun. Soil Sci. Plant Anal. 1975, 6, 1–11. [Google Scholar] [CrossRef]
- Zhang, L.; Sun, X.Y.; Tian, Y.; Gong, X.Q. Effects of brown sugar and calcium superphosphate on the secondary fermentation of green waste. Bioresour. Technol. 2013, 131, 68–75. [Google Scholar] [CrossRef] [PubMed]
- Zhang, L.; Sun, X.Y. Effects of rhamnolipid and initial compost particle size on the two-stage composting of green waste. Bioresour. Technol. 2014, 163, 112–122. [Google Scholar] [CrossRef] [PubMed]
- Zhang, L.; Sun, X.Y. Effects of earthworm casts and zeolite on the two-stage composting of green waste. Waste Manag. 2015, 39, 119–129. [Google Scholar] [CrossRef] [PubMed]
- Zhou, Y.J.; Li, J.H.; Friedman, C.R.; Wang, H.F. Variation of soil bacterial communities in a Chrono sequence of rubber tree (Hevea brasiliensis) plantations. Front. Plant Sci. 2017, 8, 1–12. [Google Scholar] [CrossRef] [PubMed]
- Ruíz-Machuca, L.M.; Ibarra-Jiménez, L.; Valdez-Aguilar, L.A.; Robledo-Torres, V.; Benavides-Mendoza, A.; Cabrera-De, L.F.M. Cultivation of potato–use of plastic mulch and row covers on soil temperature, growth, nutrient status, and yield. Acta Agric. Scand. Sect. B 2015, 65, 30–35. [Google Scholar] [CrossRef]
- Hou, J.; Cao, X.; Song, C.; Zhou, Y. Predominance of ammonia-oxidizing archaea and nirk-gene-bearing denitrifies among ammonia-oxidizing and denitrifying populations in sediments of a large urban eutrophic lake (lake Donghu). Can. J. Micro. 2013, 59, 456–464. [Google Scholar] [CrossRef] [PubMed]
- Shanmugam, S.G.; Magbanua, Z.V.; Williams, M.A.; Jangid, K.; Whitman, W.B.; Peterson, D.G.; Kingery, W.L. Bacterial diversity patterns differed in two developing ecosystems. Microb. Ecol. 2016, 73, 1–14. [Google Scholar]
- Brown, J.W. Principles of Microbial Diversity; ASM Press: Washington, DC, USA, 2015. [Google Scholar]
- Wang, C.; Zhou, J.; Liu, J.; Jiang, K.; Xiao, H.; Du, D. Responses of the soil fungal communities to the co-invasion of two invasive species with different cover classes. Plant Biol. 2017, 20, 151–159. [Google Scholar] [CrossRef] [PubMed]
- Whittaker, R.H. Evolution and Measurement of Species Diversity. Taxon 1972, 21, 213–251. [Google Scholar] [CrossRef]
- Calderón, K.; Reboleiro-Rivas, P.; Rodríguez, F.A.; Poyatos, J.M.; González-López, J.; Rodelas, B. Comparative analysis of the enzyme activities and the bacterial community structure based on the aeration source supplied to an Mbr to treat urban wastewater. J. Environ. Manag. 2013, 128, 471–479. [Google Scholar] [CrossRef] [PubMed]
- Zhang, Q.Q.; Ying, G.G.; Pan, C.G.; Liu, Y.S.; Zhao, J.L. Comprehensive evaluation of antibiotics emission and fate in the river basins of China: Source analysis, multimedia modeling, and linkage to bacterial resistance. Environ. Sci. Technol. 2015, 49, 6772–6782. [Google Scholar] [CrossRef] [PubMed]
- Lambert, Z.V.; Wildt, A.R.; Durand, R.M. Redundancy analysis: An alternative to canonical correlation and multivariate multiple regression in exploring interset associations. Psychol. Bull. 1988, 104, 282–289. [Google Scholar] [CrossRef]
- Ter Braak, C.J.; Smilauer, P. CANOCO Reference Manual and CanoDraw for Windows User’s Guide: Software for Canonical Community Ordination (Version 5). 2002. Available online: www.canoco.com (accessed on 25 June 2018).
- Showler, A.T. Effects of compost and chicken litter on soil nutrition, and sugarcane physiochemistry, yield, and injury caused by Mexican rice borer, Eoreuma loftini, (Dyar) (Lepidoptera: Crambidae). Crop Prot. 2015, 71, 1–11. [Google Scholar] [CrossRef]
- Gu, B.; Lv, Z.W.; Fang, H.L.; Li, Q.; Haom, G.J. Effects of green plant waste compost on soil remediation in urban greenbelts. Soils 2009, 41, 940–946. (In Chinese) [Google Scholar]
- Kumar, M.; Ou, Y.L.; Lin, J.G. Co-composting of green waste and food waste at low C/N ratio. Waste Manag. 2010, 30, 602–609. [Google Scholar] [CrossRef] [PubMed]
- Gabhane, J.; William, S.P.; Bidyadhar, R.; Bhilawe, P.; Anand, D.; Vaidya, A.N. Additives aided composting of green waste: Effects on organic matter degradation, compost maturity, and quality of the finished compost. Bioresour. Technol. 2012, 114, 382–388. [Google Scholar] [CrossRef] [PubMed]
- Moretti, S.M.L.; Bertoncini, E.I.; Abreujunior, C.H.; Moretti, S.M.L.; Bertoncini, E.I.; Abreujunior, C.H. Composting sewage sludge with green waste from tree pruning. Sci. Agric. 2015, 72, 432–439. [Google Scholar] [CrossRef] [Green Version]
- Zhang, L.; Sun, X.Y. Using cow dung and spent coffee grounds to enhance the two-stage co-composting of green waste. Bioresour. Technol. 2017, 245, 152–161. [Google Scholar] [CrossRef] [PubMed]
- Pan, Y.; Cassman, N.; De, H.M.; Mendes, L.W.; Korevaar, H.; Geerts, R.H. Impact of long-term N, P, K, and NPK fertilization on the composition and potential functions of the bacterial community in grassland soil. FEMS Microbiol. Ecol. 2014, 90, 195–205. [Google Scholar] [CrossRef] [PubMed] [Green Version]
- De Menezes, A.B.; Prendergastmiller, M.T.; Poonpatana, P.; Farrell, M.; Bissett, A.; Macdonald, L.M. C:N ratio drives soil actinobacterial cellobiohydrolase gene diversity. Appl. Environ. Micro. 2015, 81, 3016–3028. [Google Scholar] [CrossRef] [PubMed]
- Khan, K.S.; Mack, R.; Castillo, X.; Kaiser, M.; Joergensen, R.G. Microbial biomass, fungal and bacterial residues, and their relationships to the soil organic matter C/N/P/S ratios. Geoderma 2016, 271, 115–123. [Google Scholar] [CrossRef]
- Pei, Z.; Eichenberg, D.; Bruelheide, H.; Kröber, W.; Kühn, P.; Li, Y. Soil and tree species traits both shape soil microbial communities during early growth of Chinese subtropical forests. Soil Biol. Biochem. 2016, 96, 180–190. [Google Scholar] [CrossRef]
- Wei, Z.; Xi, B.; Zhao, Y.; Wang, S.; Liu, H.; Jiang, Y. Effect of inoculating microbes in municipal solid waste composting on characteristics of humic acid. Chemosphere 2007, 68, 368–374. [Google Scholar] [CrossRef] [PubMed]
Figure 1.
Location of the experiment site. Sophora japonica Linn was planted in experiment site.

Figure 2.
The five-point blended soil sampling method for each block. Soil was taken 40 cm far from the center of the tree stem.
Figure 2.
The five-point blended soil sampling method for each block. Soil was taken 40 cm far from the center of the tree stem.

Figure 3.
Influence of application amount on soil organic matter and soil pH in Sophora japonica Linn. forest. Significant differences analyses were based on one-way ANOVAs followed by the Duncan’s test. Treatments with different lowercase letters show significant difference (p < 0.05) between them, while treatment with the same lowercase letters show no significant difference (p < 0.05) between them. (CK treatment, no application of fertilizer; T1 treatment, 5 kg/each tree; T2 treatment, 10 kg/each tree; T3 treatment, 15 kg/each tree). Bars indicate means with error bars being standard errors (n = 3).

Figure 4.
Influences of different treatments on soil total nitrogen, total phosphorus, and total potassium content in Sophora japonica Linn. forest. Significant differences analyses were based on one-way ANOVAs followed by the Duncan’s test. Treatments with different lowercase letters show significant difference (p < 0.05) between them, while treatment with the same lowercase letters show no significant difference (p < 0.05) between them (CK treatment, no application of fertilizer; T1 treatment, 5 kg/each tree; T2 treatment, 10 kg/each tree; T3 treatment, 15 kg/each tree). Bars indicate means with error bars being standard errors (n = 3).

Figure 5.
Influences of different treatments on available phosphorus and rapidly available potassium content in Sophora japonica Linn. Woodland. Significant differences analyses were based on one-way ANOVAs followed by the Duncan’s test. Treatments with different lowercase letters show significant difference (p < 0.05) between them, while treatment with the same lowercase letters show no significant difference (p < 0.05) between them (CK treatment, no application of fertilizer; T1 treatment, 5 kg/each tree; T2 treatment, 10 kg/each tree; T3 treatment, 15 kg/each tree). Bars indicate means with error bars being standard errors (n = 3).

Figure 6.
Influences of different treatments on soil microbial species (A) OTU level; (B) phylum level. The numbers in the A and B are the amounts of soil microbial OTU species and soil microbial phylum in each treatment respectively. (CK treatment, no application of fertilizer; T1 treatment, 5 kg/each tree; T2 treatment, 10 kg/each tree; T3 treatment, 15 kg/each tree).

Figure 7.
Percentages of bacterial phylum in different treatments in total bacterial amount (CK treatment, no application of fertilizer; T1 treatment, 5 kg/each tree; T2 treatment, 10 kg/each tree; T3 treatment, 15 kg/each tree).
Figure 7.
Percentages of bacterial phylum in different treatments in total bacterial amount (CK treatment, no application of fertilizer; T1 treatment, 5 kg/each tree; T2 treatment, 10 kg/each tree; T3 treatment, 15 kg/each tree).

Figure 8.
RDA analysis of influences of soil physiochemical properties on soil bacterial community. Arrow lengths of various factors express influence degrees of soil physiochemical properties on soil bacterial community in the phylum level. The numbers in the figure show the amount of different bacterial phylum. (CK treatment, no application of fertilizer; T1 treatment, 5 kg/each tree; T2 treatment, 10 kg/each tree; T3 treatment, 15 kg/each tree; TC: organic matter content; RP, available phosphorus; RK, rapidly available potassium contents; TN, total nitrogen; TP, Total phosphorus; and TK, total potassium).


Table 1.
Basic physiochemical properties of garden greening waste. The data are mean values of three repetition. Values are mean ± standard error (n = 3) (BD, bulk density; EC, electrical conductivity; CEC, cation exchange capacity; C/N, ratio of carbon to nitrogen).
Table 1.
Basic physiochemical properties of garden greening waste. The data are mean values of three repetition. Values are mean ± standard error (n = 3) (BD, bulk density; EC, electrical conductivity; CEC, cation exchange capacity; C/N, ratio of carbon to nitrogen).
| Index | Value | Index | Value |
|---|---|---|---|
| BD (g/cm3) | 0.98 ± 0.03 | Total phosphorus (%) | 0.06 ± 0.01 |
| pH | 7.10 ± 0.05 | Total potassium (%) | 0.62 ± 0.03 |
| EC (ms/cm) | 1.55 ± 0.02 | Organic matters (%) | 77.6 ± 8.24 |
| CEC (cmol/kg) | 18.8 ± 1.25 | Total Carbon (%) | 45.0 ± 4.78 |
| Total nitrogen (%) | 1.04 ± 0.02 | C/N | 42.86 ± 4.60 |
Table 2.
Basic physiochemical properties of greening waste compost. The data are mean values of three repetition. Values are mean ± standard error (n = 3). (BD, bulk density; EC, electrical conductivity; CEC, cation exchange capacity; C/N, ratio of carbon to nitrogen; GI, Germination Index).
Table 2.
Basic physiochemical properties of greening waste compost. The data are mean values of three repetition. Values are mean ± standard error (n = 3). (BD, bulk density; EC, electrical conductivity; CEC, cation exchange capacity; C/N, ratio of carbon to nitrogen; GI, Germination Index).
| Index | Value | Index | Value |
|---|---|---|---|
| BD (g/cm3) | 0.34 ± 0.02 | E4/E6 | 1.83 ± 0.01 |
| pH | 6.81 ± 0.08 | Ratio of NH4+-N/NO3−1-N | 1.31 ± 0.01 |
| EC (ms/cm) | 0.94 ± 0.01 | GI (%) | 92 ± 1.73 |
| CEC (cmol/kg) | 65.53 ± 0.32 | As (10–3%) | 1.46 ± 0.04 |
| Total nitrogen (%) | 2.12 ± 0.01 | Cd (10–3%) | 0.15 ± 0.02 |
| Total phosphorus (%) | 0.27 ± 0.01 | Pb (10–3%) | 3.7 ± 0.26 |
| Total potassium (%) | 0.75 ± 0.02 | Cr (10–3%) | 2.36 ± 0.52 |
| Total Carbon (%) | 18.41 ± 0.08 | Hg (10–3%) | 0.13 ± 0.02 |
| C/N | 8.69 ± 0.03 |
Table 3.
Basic physiochemical properties of soil to be tested (0–40 cm). The data are mean values of three repetitions. Values are mean ± standard error (n = 3). Significant differences analyses were based on one-way ANOVAs followed by the Duncan’s test. Different lowercase letters indicate significant differences at P < 0.05 between different soil layers.
| Soil Layer | PH | Total Nitrogen | Total Phosphorus | Total Potassium | Available Phosphorus | Available Potassium | Organic Matters |
|---|---|---|---|---|---|---|---|
| g·kg−1 | g·kg−1 | g·kg−1 | mg·kg−1 | mg·kg−1 | mg·kg−1 | ||
| 0–10 cm | 7.03 ± 0.02a | 0.69 ± 0.02b | 0.17 ± 0.03a | 16.44 ± 0.81b | 5.50 ± 0.42a | 42.37 ± 3.64c | 17.77 ± 1.02b |
| 10–20 cm | 7.07 ± 0.11a | 0.67 ± 0.02b | 0.17 ± 0.03a | 17.89 ± 0.77b | 5.24 ± 0.21a | 56.84 ± 0.58b | 16.76 ± 0.53b |
| 20–40 cm | 6.89 ± 0.06a | 0.76 ± 0.02b | 0.21 ± 0.01a | 24.97 ± 0.66a | 4.46 ± 0.13b | 105.98 ± 3.64a | 21.69 ± 1.03a |
Table 4.
Influences of different treatments on soil carbon–nitrogen ratio. The data are mean values of three repetition. Values are mean ± standard error (n = 3). Significant differences analyses were based on one-way ANOVAs followed by the Duncan’s test. Different lowercase letters indicate significant differences at p < 0.05 between different soil layers. (CK treatment, no application of fertilizer; T1 treatment, 5 kg/each tree; T2 treatment, 10 kg/each tree; T3 treatment, 15 kg/each tree).
| 0–10 cm | 10–20 cm | 20–40 cm | |
|---|---|---|---|
| CK | 11.50 ± 0.87b | 11.00 ± 0.87b | 7.54 ± 2.18b |
| T1 | 15.61 ± 2.22ab | 16.03 ± 2.45ab | 17.97 ± 2.32a |
| T2 | 21.34 ± 2.90a | 18.27 ± 1.16a | 18.97 ± 2.45a |
| T3 | 20.52 ± 4.64a | 20.33 ± 3.48a | 24.38 ± 4.86a |
Table 5.
Soil bacterial diversity indexes of different treatments. Values are mean ± standard error (n = 3).
Table 5.
Soil bacterial diversity indexes of different treatments. Values are mean ± standard error (n = 3).
| Shannon | Simpson | Ace | Chao1 | Coverage | |
|---|---|---|---|---|---|
| CK | 6.478 ± 0.087 | 0.004 ± 0.001 | 2769.547 ± 10.515 | 2781.251 ± 16.084 | 0.978 ± 0.001 |
| T1 | 6.17 ± 0.108 | 0.009 ± 0.002 | 2881.277 ± 106.483 | 2873.715 ± 109.458 | 0.975 ± 0.002 |
| T2 | 6.461 ± 0.154 | 0.005 ± 0.002 | 2964.080 ± 88.861 | 2964.346 ± 95.423 | 0.976 ± 0.001 |
| T3 | 6.425 ± 0.064 | 0.006 ± 0.001 | 2919.419 ± 127.585 | 2929.363 ± 131.286 | 0.976 ± 0.002 |
© 2018 by the authors. Licensee MDPI, Basel, Switzerland. This article is an open access article distributed under the terms and conditions of the Creative Commons Attribution (CC BY) license (http://creativecommons.org/licenses/by/4.0/).
Share and Cite
MDPI and ACS Style
Tong, J.; Sun, X.; Li, S.; Qu, B.; Wan, L. Reutilization of Green Waste as Compost for Soil Improvement in the Afforested Land of the Beijing Plain. Sustainability 2018, 10, 2376. https://doi.org/10.3390/su10072376
AMA Style
Tong J, Sun X, Li S, Qu B, Wan L. Reutilization of Green Waste as Compost for Soil Improvement in the Afforested Land of the Beijing Plain. Sustainability. 2018; 10(7):2376. https://doi.org/10.3390/su10072376
Chicago/Turabian StyleTong, Jing, Xiangyang Sun, Suyan Li, Bingpeng Qu, and Long Wan. 2018. "Reutilization of Green Waste as Compost for Soil Improvement in the Afforested Land of the Beijing Plain" Sustainability 10, no. 7: 2376. https://doi.org/10.3390/su10072376
Note that from the first issue of 2016, this journal uses article numbers instead of page numbers. See further details here.