Location Recommendation of Digital Signage Based on Multi-Source Information Fusion


1
Beijing Key Laboratory of Big Data Technology for Food Safety, School of Computer and Information Engineering, Beijing Technology and Business University, Beijing 100048, China
2
Key Laboratory of Resources Utilization and Environmental Remediation, Institute of Geographical Sciences and Natural Resources Research, Chinese Academy of Sciences, Beijing 100101, China
3
College of Resource and Environment, University of Chinese Academy of Sciences, Beijing 100049, China
*
Authors to whom correspondence should be addressed.
Sustainability 2018, 10(7), 2357; https://doi.org/10.3390/su10072357
Submission received: 17 June 2018
/
Revised: 3 July 2018
/
Accepted: 3 July 2018
/
Published: 6 July 2018
(This article belongs to the Section Economic and Business Aspects of Sustainability)
Abstract
:With the increasing amount of digital signage and the complexity of digital signage services, the problem of introducing precise location recommendation methods for digital signage should be solved by digital signage enterprises. This research aims to provide a sustainable location recommendation model that integrates the spatial characteristics of geographic locations and multi-source feature data to recommend locations for digital signage. We used the outdoor commercial digital signage within the Sixth Ring Road area in Beijing as an example and combined it with economic census, population census, average house prices, social network check-in data, and the centrality of traffic networks that have an impact on the sustainable development of the regional economy as research data. The result shows that the proposed method has higher precision and recall in location recommendation, which indicates that this method has a better recommendation effect. It can further improve the recommendation quality and the deployment of digital signage. By this method, we can optimize resource allocation and make the economics and resources sustainable. The digital signage recommendation results of the Beijing City Sixth Ring Road indicated that the areas suitable for digital signage were primarily distributed in Wangfujing, Financial Street, Beijing West Railway Station, and tourist attractions in the northwest direction of the Fifth Ring Road. The research of this paper not only provides a reference for the integration of geographical features and their related elements data in a location recommendation algorithm but also effectively improves the science of digital signage layout, prompting advertising efforts to advance precision, personalization, low carbonization, and sustainable development.
1. Introduction
Sustainable development links economic, social and ecological systems, and it transforms development into a more comprehensive, balanced, and sustainable concept. Sustainable development is a broad concept that includes all the social, economic, and cultural aspects of human life [1]. Among them, good advertising can convey product information to consumers, promote the circulation of goods, and achieve sustainable economic development.
Most of the traditional outdoor advertisements were carried out in the form of billboards, posters, etc. This kind of advertising and propaganda methods may lead to waste of materials and consumption of human and economic resources. Moreover, their advertising efficiency is extremely low. In order to reduce the waste of resources and make advertisements more sustainable, digital signage markets were brought into being. Digital signage is a multimedia professional audiovisual system that aims to display business, financial, and entertainment information through digital signage terminals in public places where crowds gather. As a new type of media, digital signage has become an important medium for the advertising of modern city entities [2,3]. Compared to traditional TV commercials and newspaper advertisements, digital signage is more flexible; it can provide personalized and customized advertising according to different audience groups [4,5,6]. The payback of digital signage advertising is not only saves resources, but also enables advertising more efficiency and make advertisement delivery more sustainable. Even though the history of digital signage spans only 20 years, its application has spread to all areas of work and life [7,8]; meanwhile, its wide application has brought invaluable industrial value to society.
The industrial chain of digital signage includes the following processes: first, the suppliers of digital signage are responsible for producing digital signage; second, the media dealers of digital signage purchase digital signage and choose locations to install it; last, advertising agencies purchase digital signage advertising posters from media companies according to advertisers’ demand. The development of digital signage primarily includes the following three stages: the initial stage of digital signage focuses on digital signage production, research, and manufacturing; the application stage involves continuous promotion, as seen by the digital signage that has been deployed in airports, hotels, shopping malls, and other places, which has caused a rapid increase in the number of layouts for digital signage; the scientific management stage consists of the scientific and standardized management of digital signage by digital signage stakeholders, motivated by the widespread use of digital signage.
Scholars have made considerable efforts to make digital signage generate more revenue. The studies on digital signage are mainly divided into two categories. The first is the study of consumer behavior of digital signage by management scholars. In 2012, Kim [9] analyzed the differences in advertising content of digital signage at different locations, which resulted in changes in consumer preferences and interactive satisfaction. In 2015, Yoon et al. [10] researched the position determination methods that enable motion scheduling based on the location of people using position determination technology and provided individualized display contents. In 2016, Ijaz [11] studied the layout of the products by designing human interaction with digital signage. The results show that the tree layout method can provide consumers with more convenience, while the tubular layout can enhance the consumer shopping experience. In 2017, Umor et al. [12] investigated consumers’ views on digital signage and found that most people were interested in the relevant information on digital signage. These studies collectively demonstrate that digital signage can promote a retail atmosphere and stimulate consumer behavior. The second category is the system construction study of digital signage management and content distribution by scholars of information science. In 2014, Moon [13] developed software for ultra high definition (UHD) digital signage content encoding that can manage the quality of segmented frames according to the layout of the digital signage display system. In 2015, Hyun et al. [14] proposed a digital signage peer-to-peer (P2P) network distribution method that cannot only reduce content delivery time but also decrease service provider costs. Hossain et al. [15] proposed a software-defined networking solution to provide flexibility and compatibility for Internet of Things-based (IOT-based) smart digital signage systems. In 2017, Khue et al. [16] designed a scalable real-time digital signage system that can effectively handle real-time tasks, such as emergency/instant messaging and system status monitoring. In addition, emerging technologies represented by big data have promoted the development of intelligent platforms, such as digital signage terminal management, automatic scheduling, and content distribution [17]. Together, recent studies of digital signage focus on consumer behavior and information system construction, which ignore the spatial information impact of digital signage. With the wide use of digital signage, it is disorderly arranged in airports, restaurants, shopping malls and other places. This fact results in a waste of economic resources and digital signage advertising screens. At the same time, the site selection and advertising of traditional digital signage are all artificial, resulting in low timeliness, lack of reference, and ineffective delivery effects. It is difficult to meet the needs of advertisers and media companies. Therefore, it is most important for digital signage enterprises to introduce standardized location recommendation methods for digital signage.
As an important application of geo-social networks, location recommendation has geospatial attributes that can be introduced into the space dimension; thus, it is possible to accurately recommend the location according to a known location [18]. Currently, according to different recommendation strategies, studies on recommendation systems generally include content-based filtering (CBF) [19,20], collaborative filtering (CF) [21,22,23], and hybrid recommendation algorithms (HR) [24,25,26]. With the rapid development of location-based social networks (LBSN), location recommendation systems are widely applied [27,28]. Recent studies are focusing on exploring social influences and users’ personal preferences on location through user social relationships and geospatial features [29,30]. To make large-scale online social networks accessible, researchers have conducted a comprehensive study of the spatial attributes of social networks [31]. Due to the strong correlation between time and geographical location, the study introduced time characteristics into location recommendations and used it to improve the performance of location recommendation [32,33]. In terms of research data, the data sources used in the current location recommendation can be divided into two categories: (1) user information, which includes the profile, location history and t track of users [34,35,36,37]; and (2) characteristics of the location, such as the number of users visiting a certain place and physical properties such as malls and parks [38,39,40]. Although researchers have proposed numerous new methods and models, they have continued to promote the development of location recommendation research. Nevertheless, research regarding location recommendation continues to lag in two aspects: the use of spatial characteristics of the location has not been systematically studied, while the introduction of geographical features in the location recommendation study can effectively improve the accuracy of the recommendation [41]. Second, geographical data such as population and economic information are important influences on location recommendation results [18], and society and economy are important components of sustainable development [42]. However, in the current study, the impact of geographical features such as economy and population on location recommendation has not been considered.
To introduce factors—such as social, economic, and demographic ones—that have an impact on the sustainable development of the regional economy in the recommendation process and effectively solve the issue of digital signage scientific layout and precision marketing. We propose a sustainable location recommendation model that couples multi-source elements to compensate for the shortcomings in the current location recommendation approaches. At the same time, this method was considered to recommend the location of digital signage in order to provide a scientific reference for the location selection of digital signage. In this research, we used the outdoor commercial digital signage within Six Ring in Beijing as an example. First, exploring elements of commercial activities, such as economic census, population census, average house prices, social network check-in data, and the centrality of traffic networks, which affect the placement of digital signage, the modeling factors of digital signage were identified by using the method of gridded specialization. Second, clustering algorithms were applied to divide the study area and use area-divided feature data as a data source. Therefore, this study integrates digital signage geographic features into location recommendations to recommend the location of digital signage. Finally, we selected three factors—precision, recall and F-measure—to evaluate the algorithm quality. On the one hand, this research provides a reference for the integration of geographical features and their elements data in the location recommendation algorithm, and improves the existing location recommendation algorithm. On the other hand, it can effectively increase the accuracy of ad placement and the scientific nature of digital signage deployment. Digital signage can evoke customer sensory aesthetic experiences that then create brand appeal, and it has the potential to promote sales [43,44]. While information technology can improve the competitiveness of firms by enhancing agility in terms of market capitalizing and operational adjustment [45]. Applying the information technology of location recommendation to location allocation for digital signage will ameliorate its utilization rate; further raise the competitiveness of digital signage advertised products; maximize the effectiveness of advertising; optimize the allocation of digital signage resources; and promote the precision, personalization, low carbonization, and sustainable development of advertising.
2. Study Area
In this paper, we considered the Sixth Ring Road in Beijing as the study area. The area of the Sixth Ring Road in Beijing is 2267 km2. Although its area only accounts for 14% of Beijing’s total area, it accommodates more than 60% of the city’s resident population and 62% of the total gross domestic product (GDP) [46].
Being the core area of commercial development in Beijing, the Sixth Ring Road in Beijing covers the central function area of the capital and the urban functional expansion area of the city, including all of the areas of Dongcheng District, Xicheng District, Chaoyang District, Haidian District, Shijingshan District, and Fengtai District; and a small area of Changping District, Shunyi District, Tongzhou District, Daxing District, Fangshan District, Mentougou District. Digital signage is mainly concentrated in this area, accounting for 85% of the total amount of Beijing, and it is the core area for the commercial development of first-tier cities, with the representation of digital signage in economically developed cities. Thus, digital signage location recommendation research in this area not only verifies the feasibility of applying the location recommendation algorithm proposed in this paper to the recommendation of digital signage location in a city but also has a certain practical result.
3. Data Sources and Processing
3.1. Data Sources
We collected the basic data of 5823 outdoor digital signage and business activity elements that have an impact on the sustainable development of the regional economy, where the basic data of digital signage includes the geographical location of digital signage and the average play price per 15 s of digital signage. The data of business activity elements mainly include the final working population number in the third economic census and the resident population number in the population census, which were derived from statistical means, the average house price data in the Housing World listing and the check-in data of Sina Weibo’s social network, as well as the traffic network-centered data, measured based on the basic road network.
3.2. Data Spatial Processing
To perform spatial modeling, digital signage basic data and business activity elements data with location information must be spatially processed. At the same time, to facilitate the expression of the distribution rules of the business activities in the regional units, the grid processing of multi-source and heterogeneous business activity elements data must be standardized to a unified spatial scale. The process of standard gridding divides non-overlapping polygons in geographic space (500 × 500 m squares), and each polygon is a spatial unit. The grid can conveniently express the information of each statistical unit. Grid-based business activity element data cannot only reflect reality more intuitively and truly but also provide a unified spatial reference for data fusion.
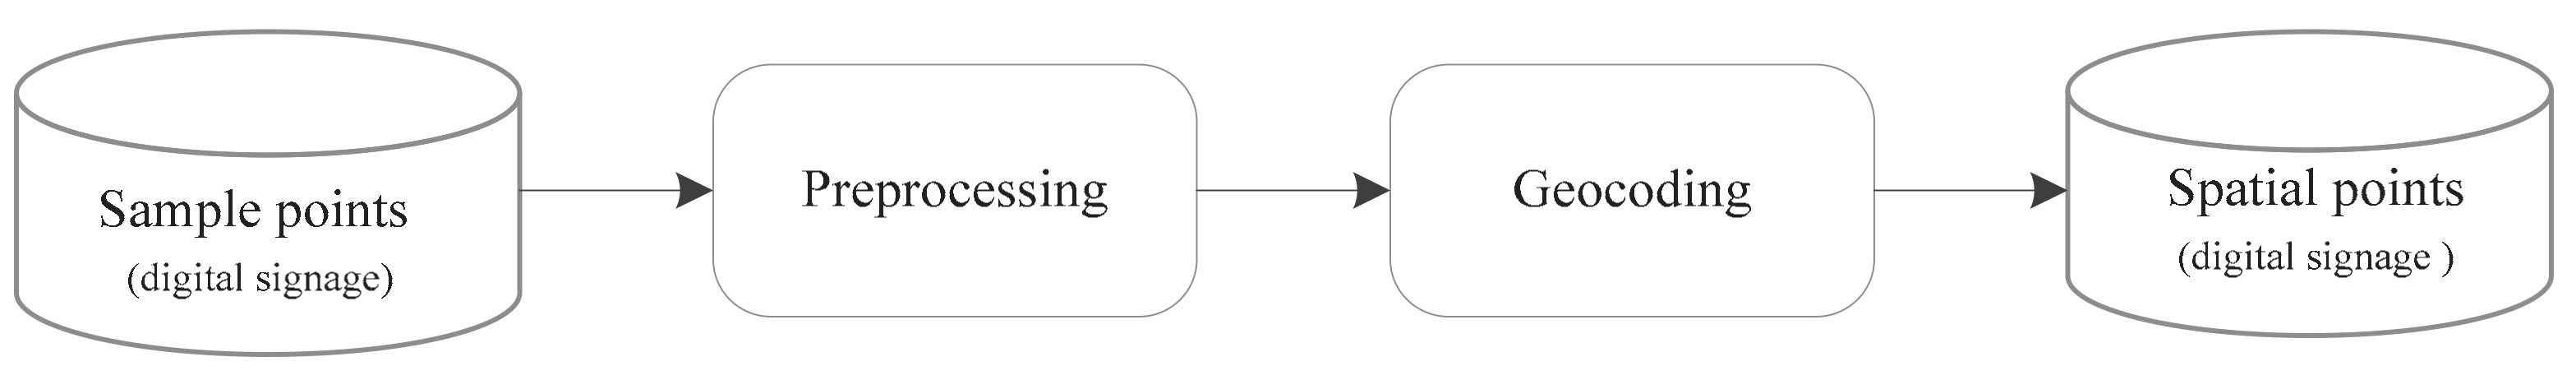
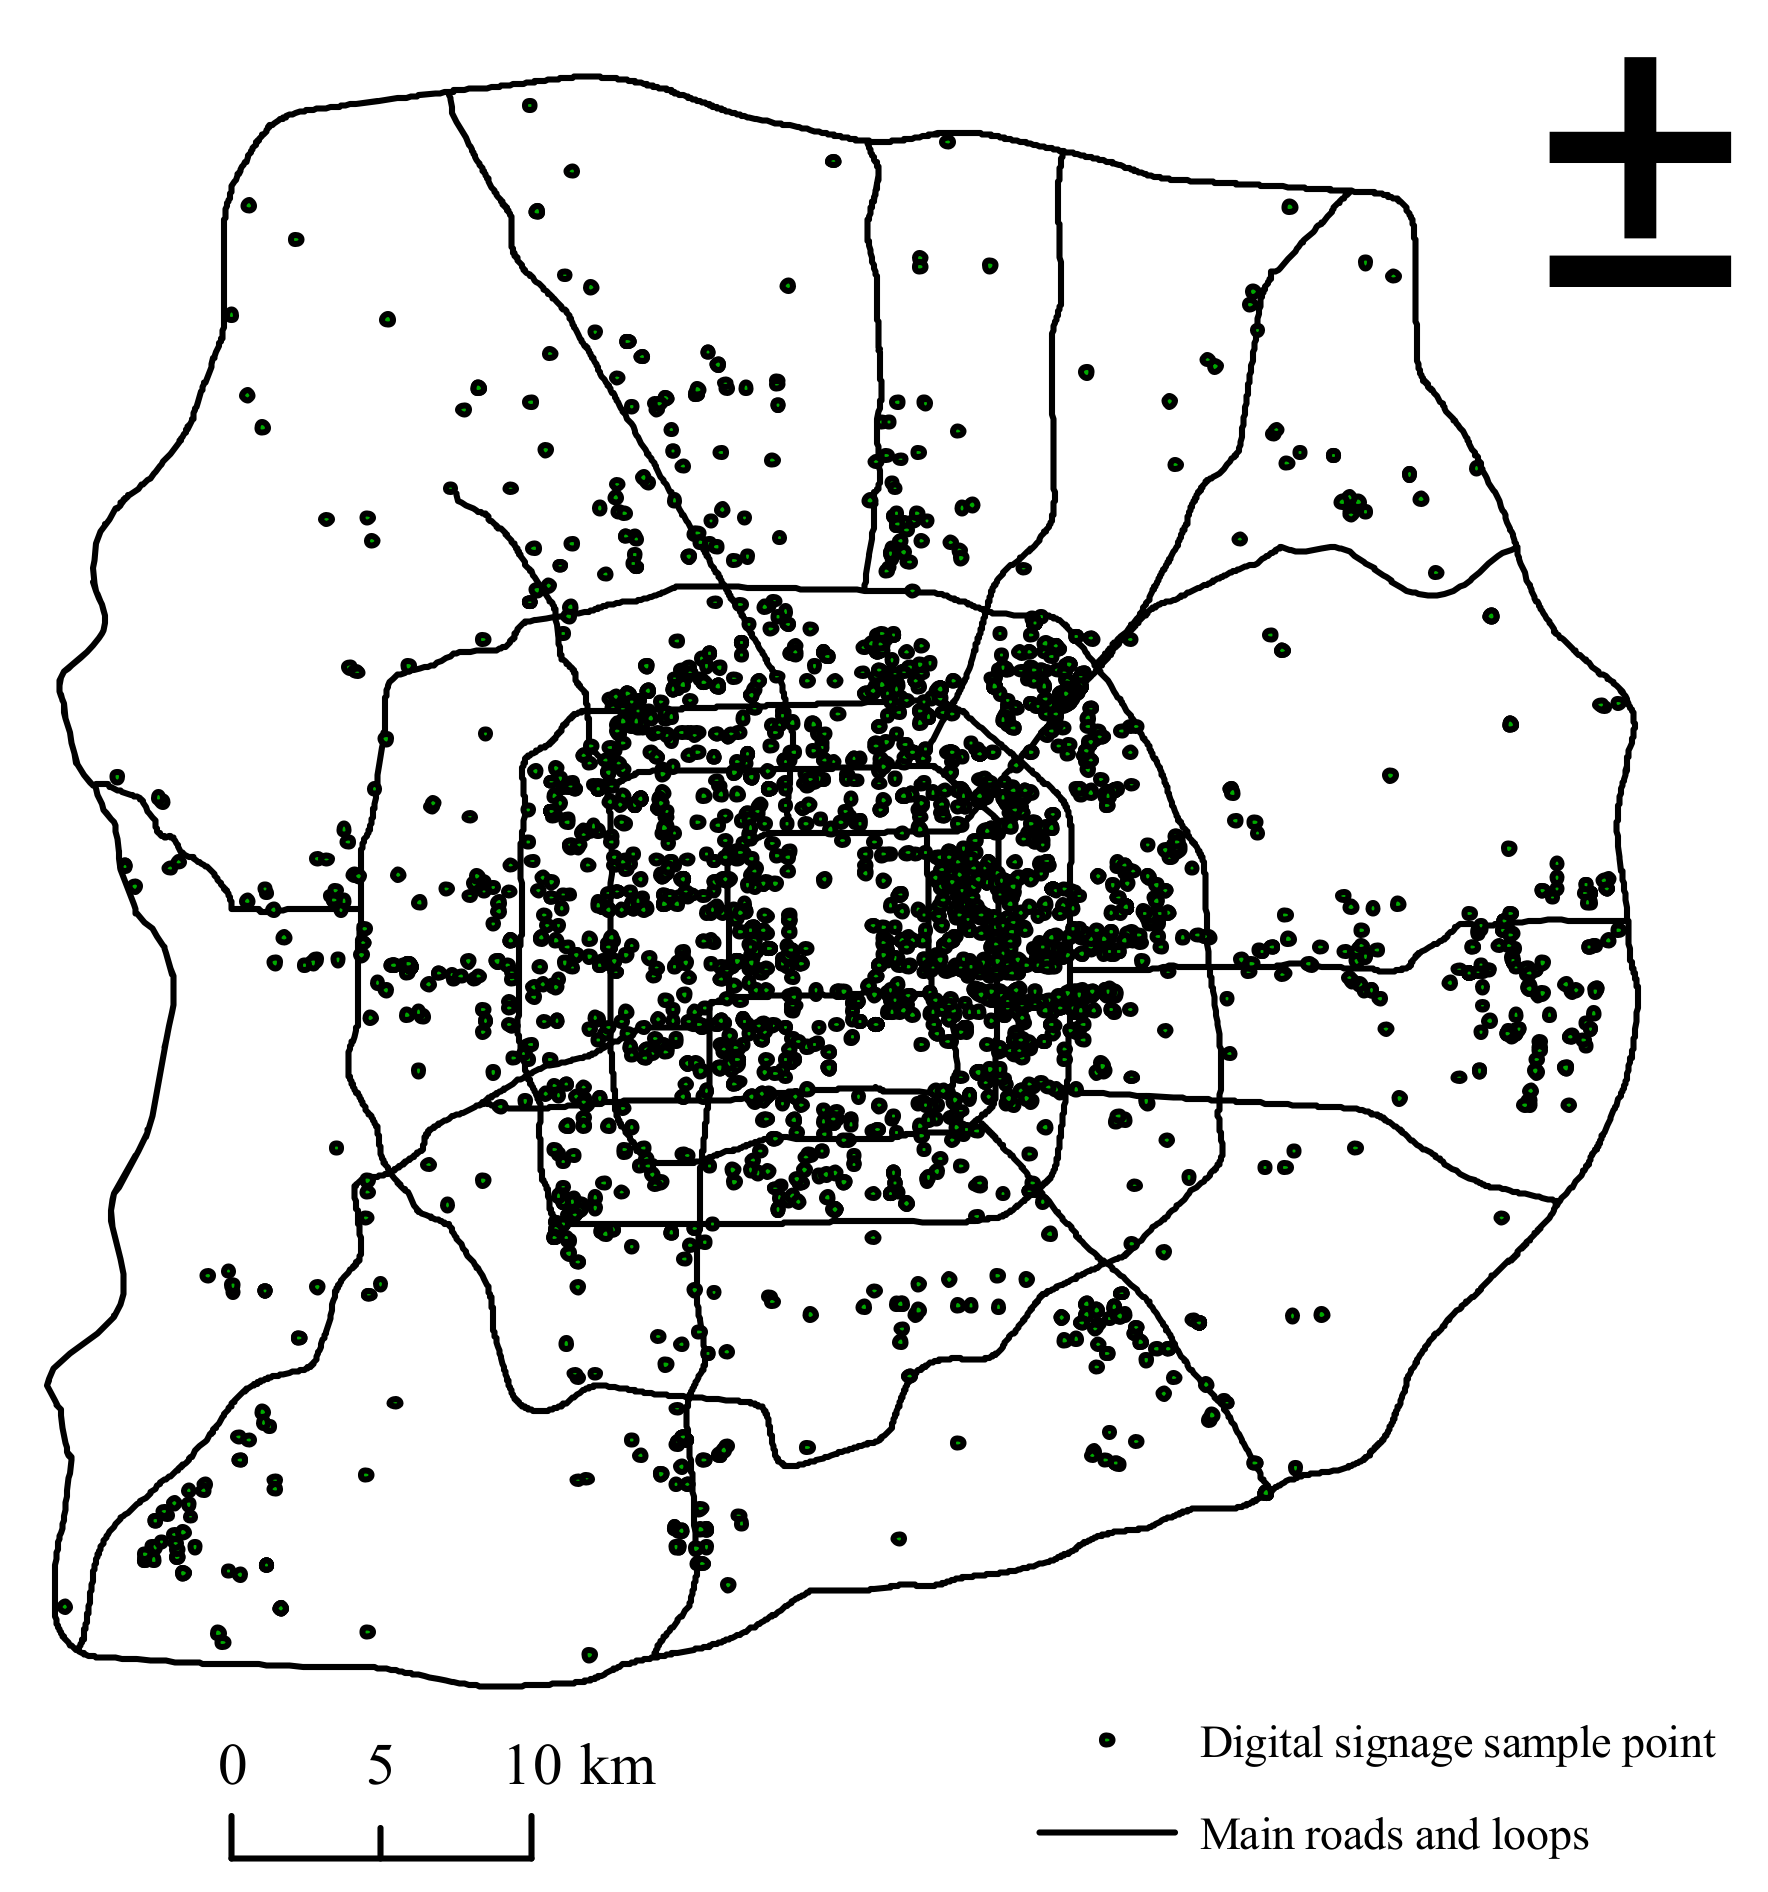
The digital signage basic data processing flow is shown in Figure 1. We delete useless data and modify the wrong data, and we use ArcGIS 10.3 software (ESRI Inc., Redlands, CA, USA) to spatialize the data to obtain the spatial data of digital signage. Finally, visualization the digital signage data of the study area is achieved (Figure 2).
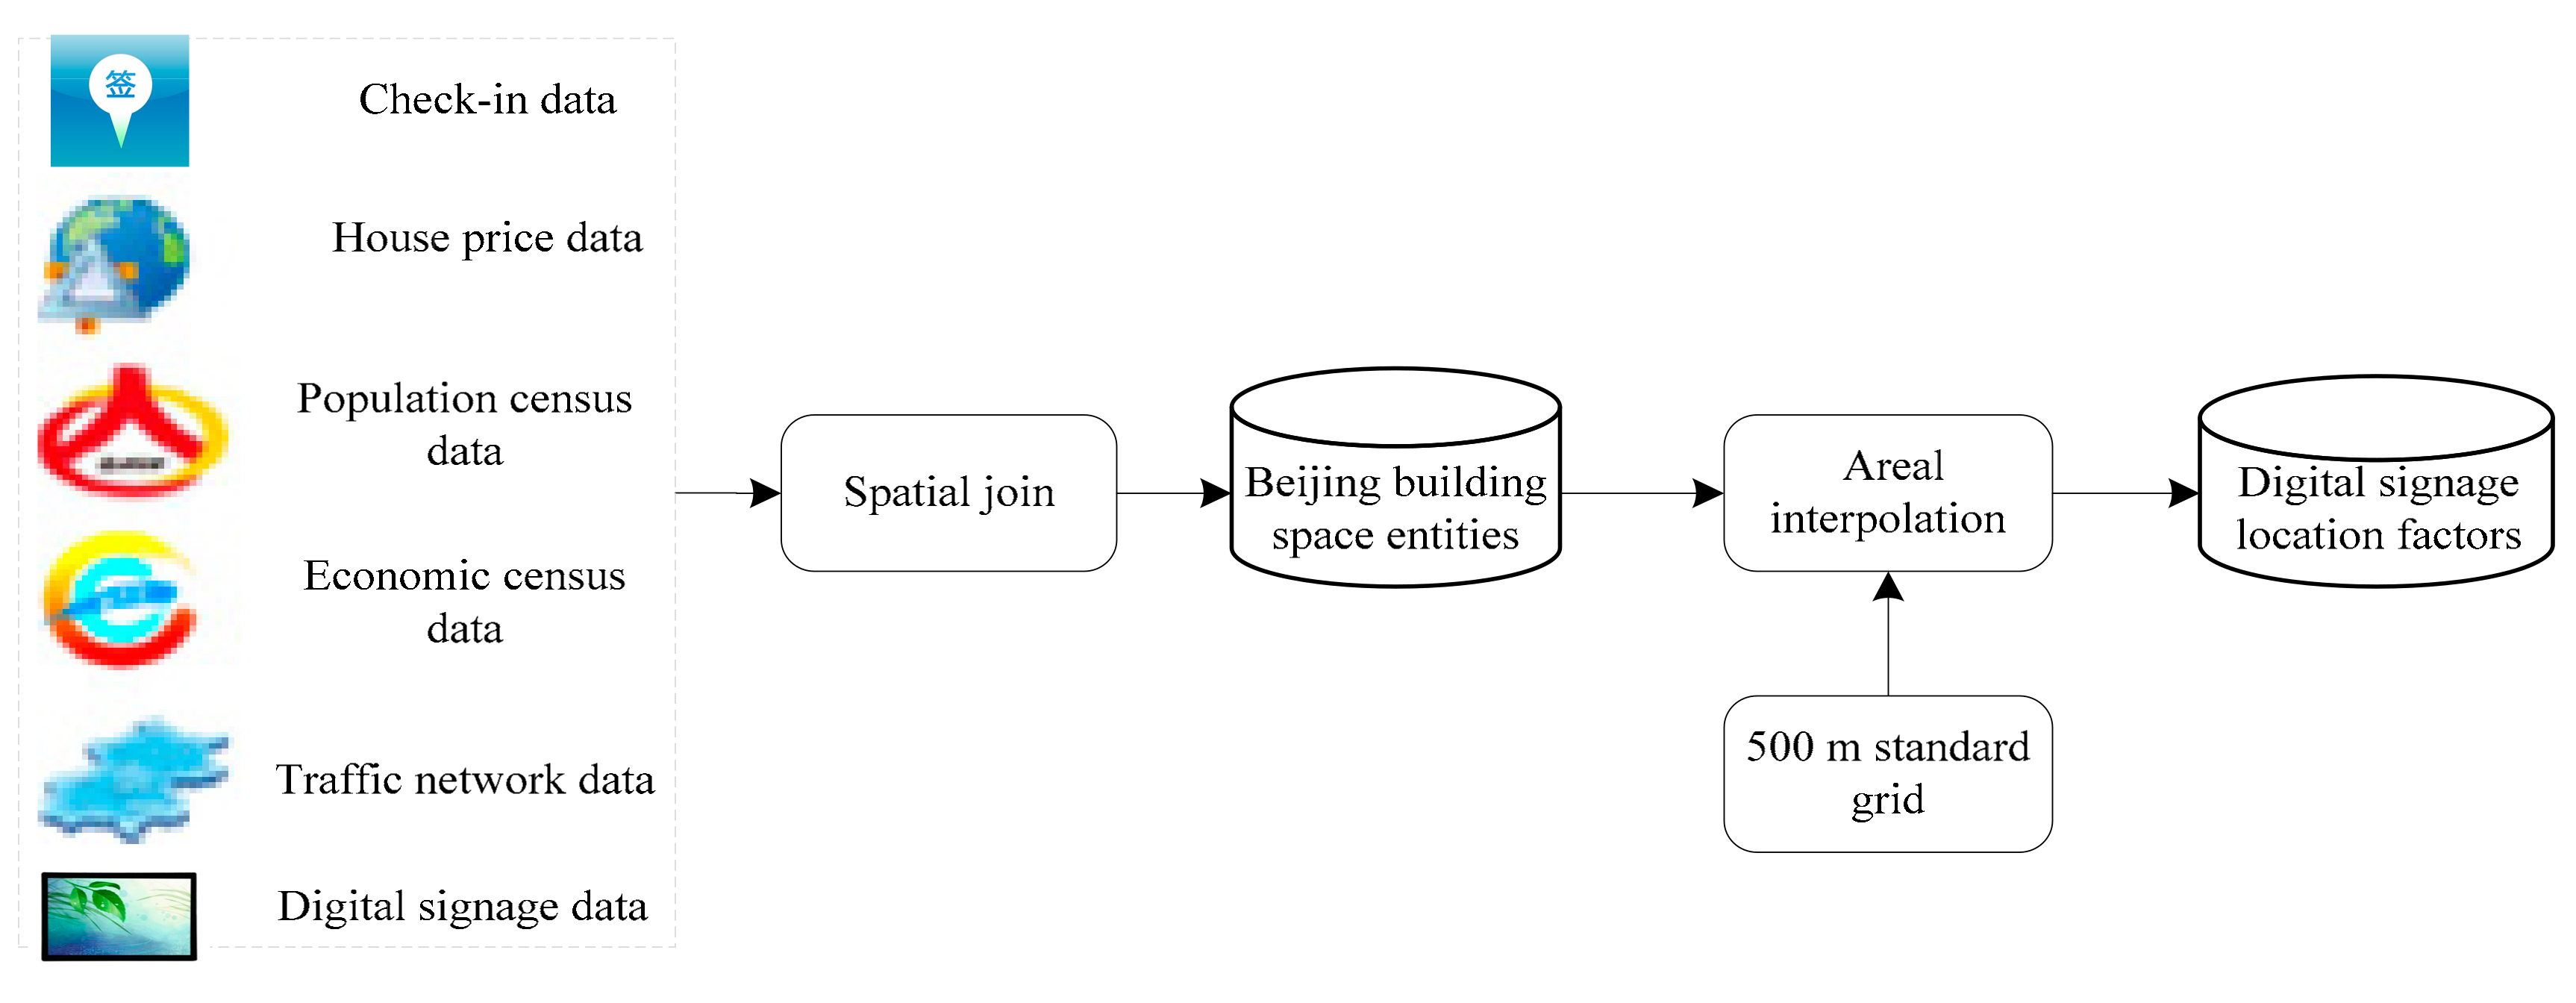
The processing flow of the digital signage location factor is shown in Figure 3. We used the spatial connection operation in ArcGIS to associate the five kinds of business activity factor data, including average house price data, social network check-in data, end-of-period commercial business population data in the economic census, unit population data in the population census, and transportation network center and digital signage data with Beijing building space entities (using the Beijing building data collected during the third national economic census in 2013). For visualization and modeling on a uniform scale, an interpolation with a 500-m standard grid for all data is required for the area.
4. Methodology
The location recommendation of digital signage uses both location information and the location factor of the digital signage as input to output the list of places for deployment, that is, to provide location information for the location selection of the digital signage and accurate placement of advertisements. As an effective information filtering technology, the location recommendation method has received extensive attention due to its characteristics of geospatial attributes. However, to date, the current location recommendation research has not explored the spatial characteristics of the geographical location. In addition, the research data does not consider the impact of geographical features, such as the economy and population, on the location recommendation. Finally, when analyzing the influence of various factors on the recommendation results, multiple regions were usually considered as a whole, but the factors that include economic, demographic and other factors often have different effects on the recommendation results in various regions. Therefore, to achieve the recommendation of a digital signage location that reflects geographical features, such as the economy and population, the spatial features of regional divisions and geographic locations were integrated into the location recommendation algorithm.
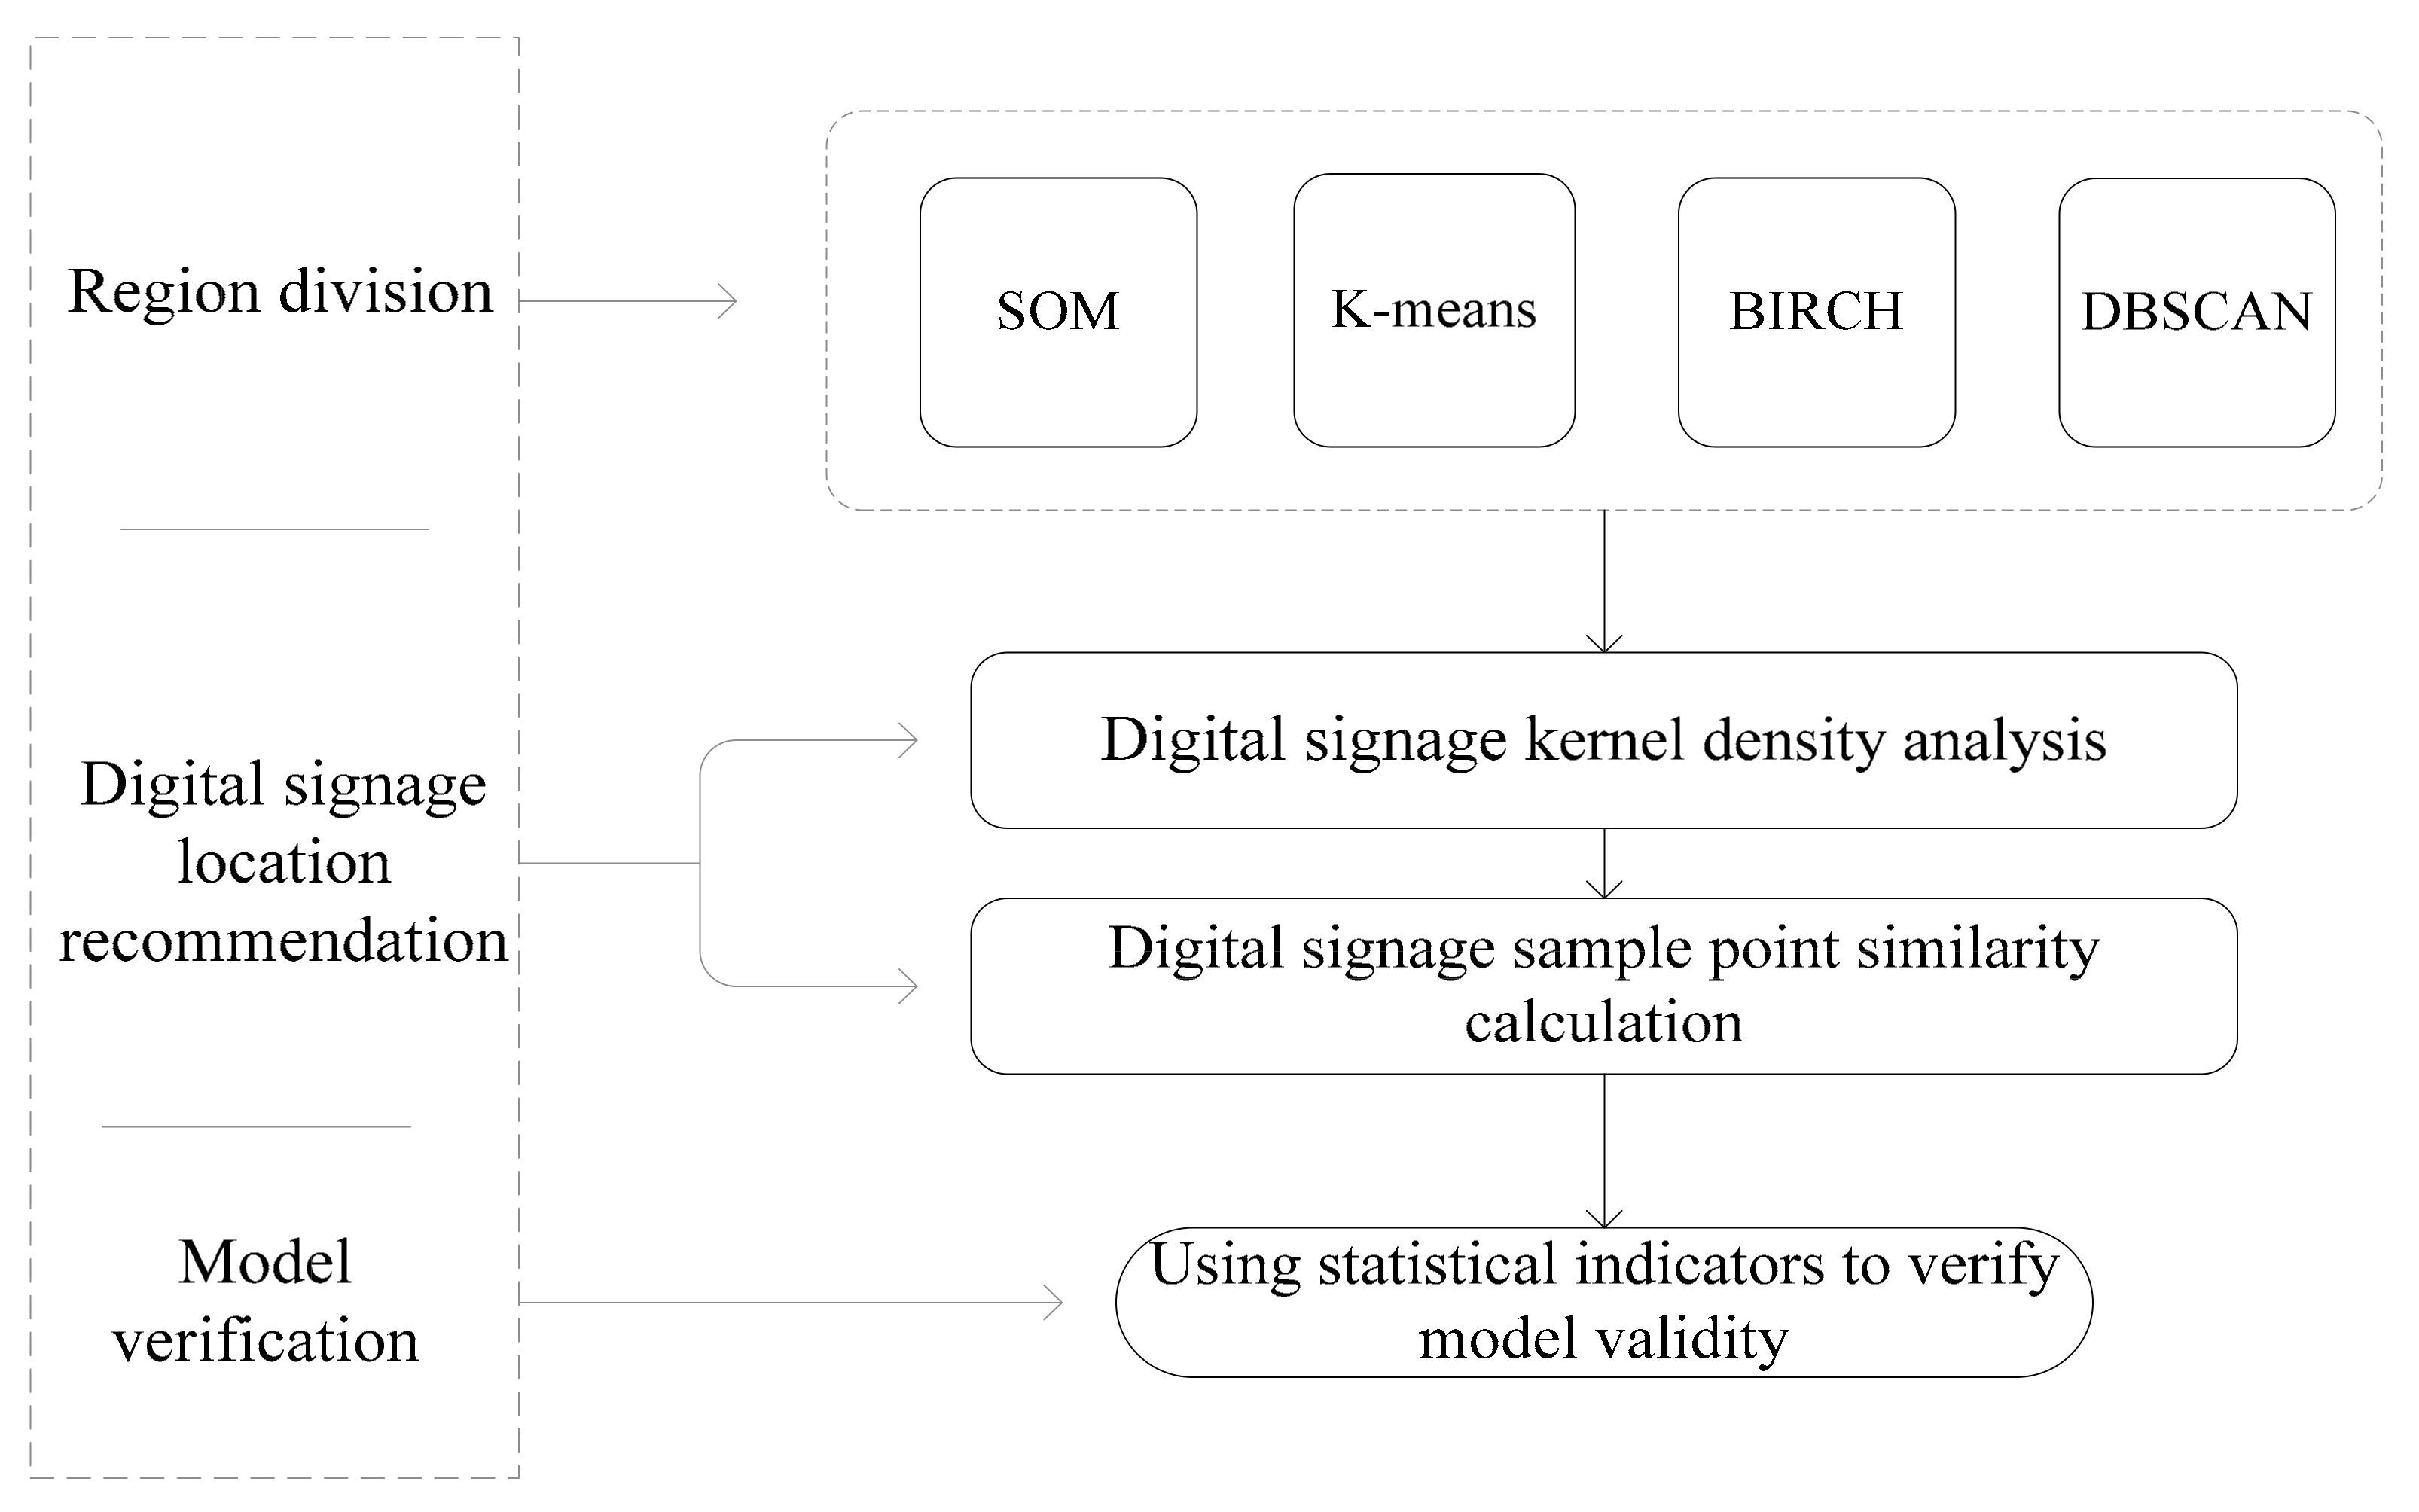
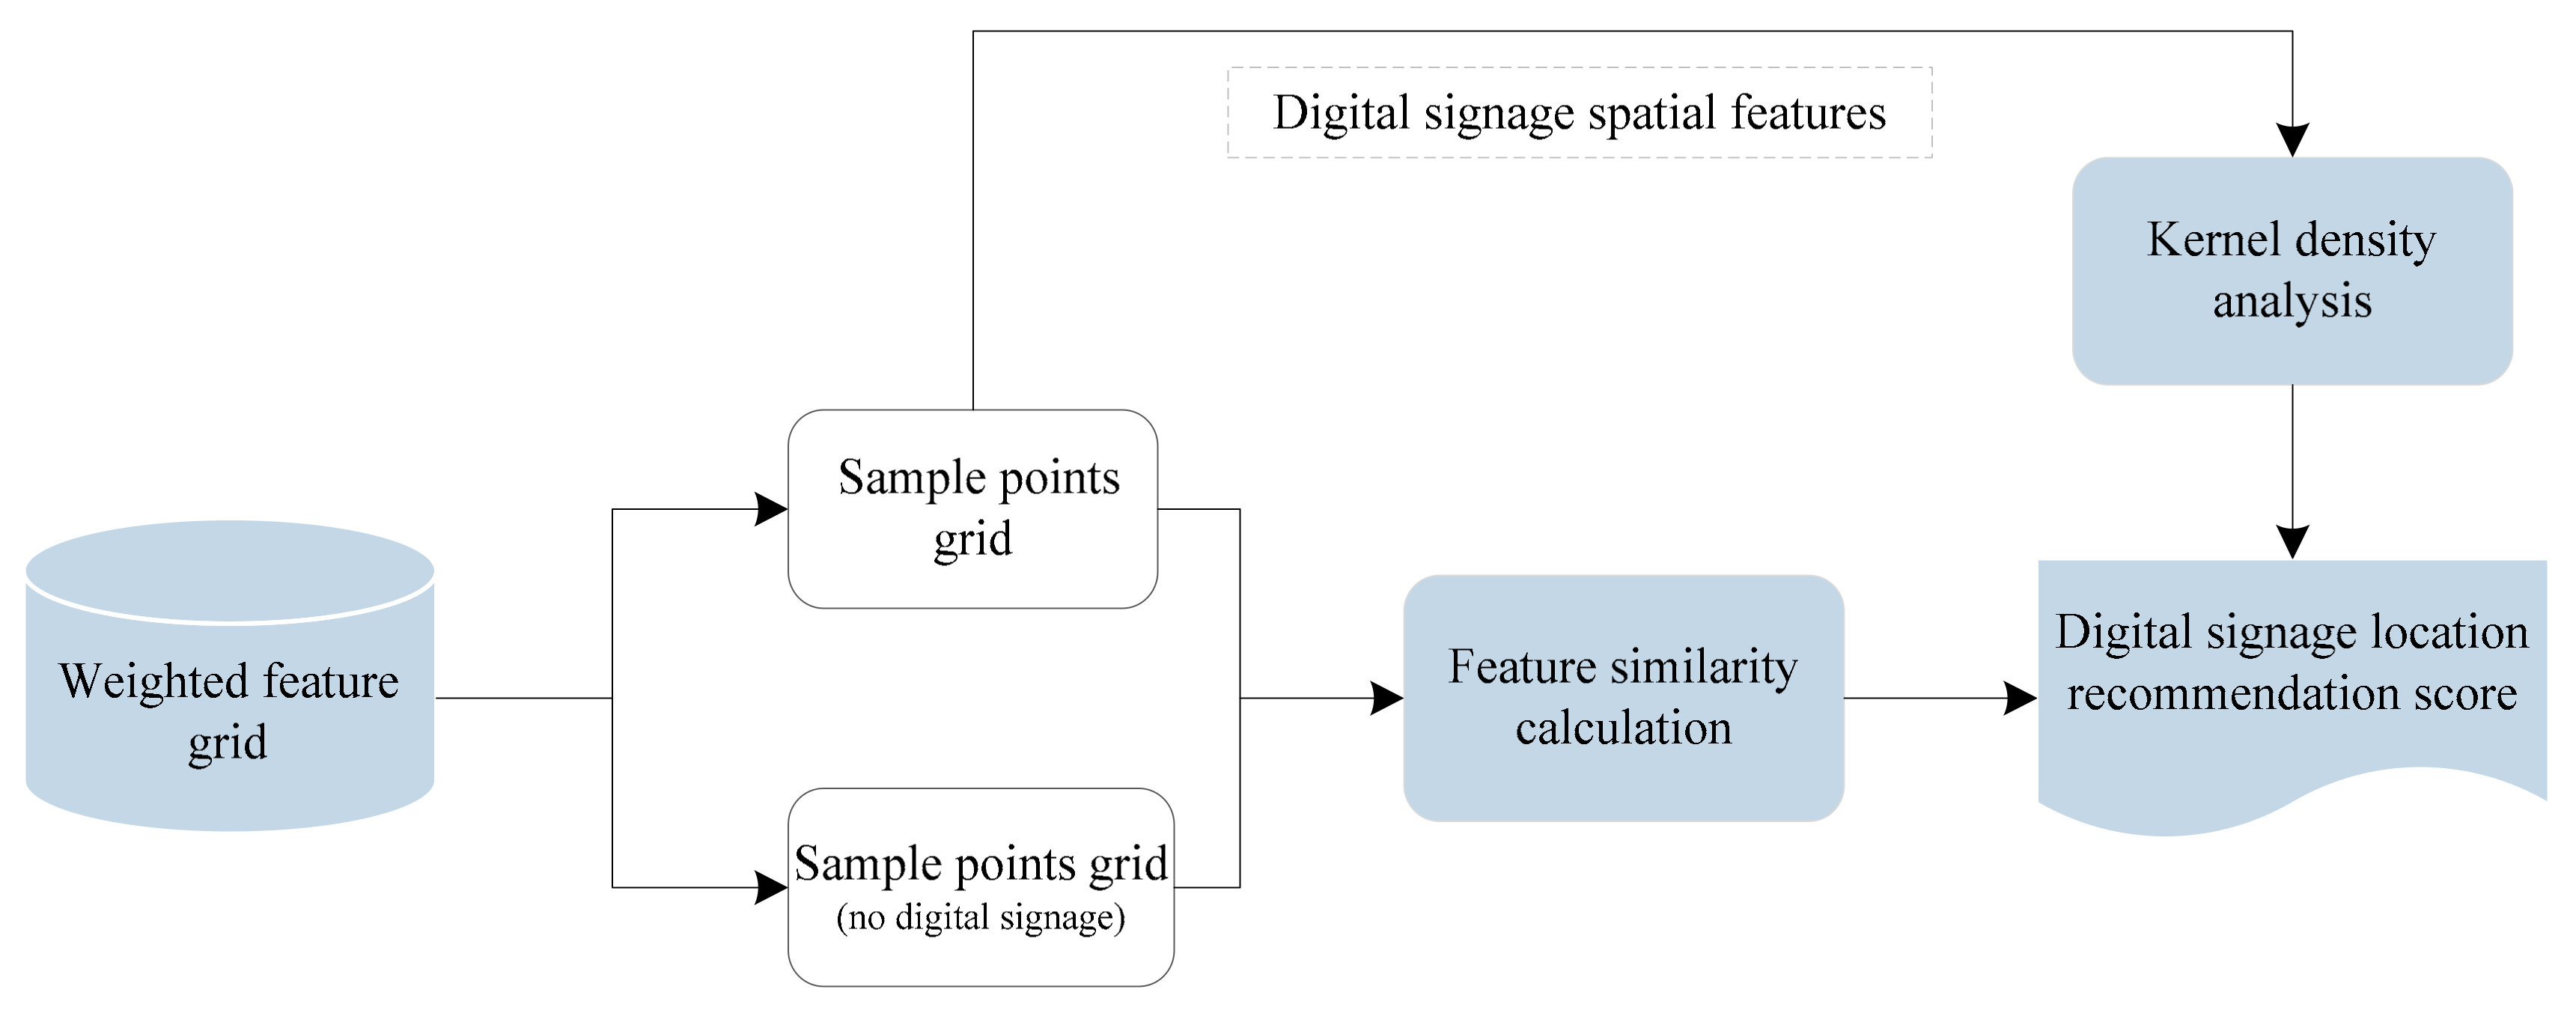
In this section, we will introduce the location recommendation algorithm in detail to achieve the digital signage location recommendation. Specifically, the recommendation process consists of three parts (Figure 4).
- (1)
- Region Division: We first use four types of clustering algorithms to partition the study area then use the Calinski-Harabasz Index to find the parameters that optimize the area partitioning. Finally, the maximum information coefficient to define the degree of influence of the digital signage location factor on the distribution of digital signage was employed.
- (2)
- Digital signage location recommendation: First, the kernel density method was used to analyze the density of digital signage points in their surrounding neighborhoods. Next, the Euclidean distance was considered to calculate the similarity between the digital signage sample points. Finally, the first three sample points with the highest similarity to the non-imposed digital signage were selected, and the similarity of the three sample points and their nuclear density value are weighted to be averaged. Therefore, for each undistributed land area, a recommendation score between 0 and 1 is calculated, which indicates the extent to which the plot is suitable for the placement of digital signage.
- (3)
- Model verification: We verify the validity of the model using precision, recall, and F-measure.
4.1. Region Division
In machine learning algorithms, the division of the study area based on influential factors is called unsupervised learning. Spatial clustering algorithms are typical unsupervised machine-learning algorithms that not only describe how the data are organized or clustered but also generate clustered data object collections based on the data features [47]. The objects in the same cluster are similar to each other, and objects in different clusters show various differences from each other [48]. In this study, the experimental results of four classical clustering algorithms were compared to obtain the algorithm that is the most suitable for the study area division. These methods are as follows:
4.1.1. K-Means Algorithm
K-means [49] is a clustering method based on distance classification. The clustering process mainly includes three steps. First, K centroids that represent the number of clusters are determined; second, the Euclidean distance of each index is calculated, and the spatial distances are integrated between the calculated objects; finally, the program is run continuously until the sum of squared errors is the smallest [50].
4.1.2. BIRCH Algorithm
BIRCH is a hierarchical clustering algorithm, which needs to be adjusted when using it for clustering [51]. The first step is evaluates the threshold, which is the maximum sample radius threshold T of each cluster feature tree that determines the radius threshold of hyperspheres formed by all the samples in each cluster feature tree. The other is the branching factor, which is the maximum number of clustering features B of the internal nodes of the cluster feature tree. The algorithm uses the balanced iteration of hierarchical methods to reduce and cluster datasets [52].
4.1.3. DBSCAN Algorithm
DBSCAN is a density-based clustering algorithm, which needs two input parameters for the algorithm’s calculation [53]. One parameter is the radius (Eps), which represents the range of the circular neighborhood centered at the given point P; the other parameter is MinPts, which is the minimum points in the neighborhood centered on the point P. The algorithm uses an iterative search method to find all density-contained objects contained in each cluster.
4.1.4. SOM Algorithm
The SOM clustering algorithm [54] consists of an input layer composed of m neurons and a two-dimensional planar array competition layer composed of a*b neurons. The SOM clustering process is as follows: First, a smaller weight is assigned to the connection weights between the m input neurons and the output neurons. Second, the node is found that best matches the input vector X; then, the weight vector of the mapping layer and the Euclidean distance of the input vector are calculated. Finally, the winning neuron with the closest distance j* is obtained; then, the weights of j* and its neighboring neurons are modified according to Formula (1) [55].
where is the weight between the i-th neuron of the input layer and the j-th neuron of the competition layer and is a constant in the interval of (0,1), which gradually decreases to 0 with time.
4.1.5. Calinski-Harabasz Index (CH)
The CH index [56] is a statistical measure of the distribution effect, which indicates that the difference between measurement categories is greater than the difference within the category, that is, CH obtains the maximum value when the clustering result is optimal. The expression of the CH index is written as
where is the distance between categories, is the distance within the category, is the intra-class divergence matrix, and is the inter-class divergence matrix. The calculations for and are
where is the number of points in the data, is the set of points in cluster q, is the center of cluster q, c is the center of the sample point and is the number of points in class .
In this paper, to obtain the best clustering parameters for each algorithm, we apply Equation (2) separately for the four algorithms.
4.1.6. Maximum Information Coefficient (MIC)
MIC [57] is a novel statistical method that satisfies fairness and versatility in correlation analysis; it can effectively measure the linear and nonlinear relationships between variables and non-functional dependencies. Therefore, we choose MIC to calculate the influence of the location factor on the distribution of digital signage. MIC is generally shown as
where is the upper limit value of the grid division , is used to divide the value domain of the integrated variable of the digital signage location factor into segments, is used to divide the value domain of the digital signage sample point set into segments and is the location factor matrix.
To obtain the optimal proportional relationship of each location factor of each region, we took the digital signage location factor in the already-divided region as a sample using Formula (5) to calculate the weight of the location factors in each partition. Next, the product of the location factor vector A ( where is a sample of the location factor for the i-th parcel, is the i-th location factor) and its location factor weight B (; where is a sample of the location factor for the i-th parcel, is the i-th location factor weights) is used as the data source of the recommendation algorithm ().
4.2. Digital Signage Location Recommendation
Using the data weighted by MIC as the data source, the kernel density method was employed to analyze the density of digital signage points in their surrounding neighborhoods. Then, the Euclidean distance was brought to calculate the similarity between the digital signage sample points. Finally, the combined the density and similarity for each undistributed land area are used to calculate a recommendation score between 0 and 1, which indicates the extent to which the plot is suitable for the placement of digital signage.
4.2.1. Kernel Density Analysis
Kernel density analysis [58] was taken to calculate the density of digital signage features in their surrounding neighborhoods. When the distribution density function is , the extracted sample is , and the estimated value of at point x is . The kernel is shown in the Formula (6)
where is kernel function, is bandwidth, and is the distance from the estimated point to the sample .
In this paper, the kernel density function was used to analyze the density of the sample data of digital signage. Moreover, a higher nuclear density of the sample point indicates that the distribution of the digital signage in the sample point is denser, further evidence that the characteristics of the sample point are more suitable for the layout of digital signage.
4.2.2. Similarity Calculation
The Euclidean distance [59] is the distance calculation method, which was brought to measure the similarity between sample points in a multidimensional space. This index ranges from 0 to 1, where numbers closer to 0 indicate more similarity between two samples. The formula for the Euclidean distance is
where and are two sample points, is the i-th attribute feature in the sample , and represents the i-th attribute feature in the sample .
In this paper, we use Formula (7) to calculate the similarity of digital signage sample points, where is a sample that has a layout defined for digital signage, and is a sample that has not had layout defined for digital signage; is the i-th location factor of sample and is the i-th location factor of sample .
4.2.3. Digital Signage Recommended Location Calculation
The specific calculation processes of digital signage recommended locations in this study is as follows (Figure 5).
First, the data weighted by MIC was considered as the data source. Second, the kernel density method was applied to analyze the density of digital signage points in their surrounding neighborhoods. In addition, the Euclidean distance was used to calculate the similarity between the digital signage sample points. Finally, the three plots with the highest similarity to the plots with no layout of digital signage were selected, and the average of the kernel density values and corresponding similarity values were weighted for the three plots. Therefore, for each undistributed land area, a recommendation score is calculated between 0 and 1, which indicates the extent to which the plot is suitable for the placement of digital signage.
4.3. Model Verification
In our research, we used the precision, recall, and F-measure to verify the validity of the model. Precision rate (P) represents the ratio of digital signage samples that are the actual layout to digital signage samples that are the predicted layout. The recall rate (R) represents the ratio of digital signage samples that are the predicted layout to digital signage samples that are the actual layout. The F-measure was considered to synthesize P and R of the model.
P [60] was used for the prediction result; it indicates how many samples in the positive prediction are true positive samples. There are two possibilities for the prediction to be positive. One possibility is to predict the true positive class as a positive class (). The other possibility is to predict the negative class as a positive class (). Thus, the P can be calculated by the expression as
R [61] was used for the original sample. It indicates how many positive examples in the sample are correctly predicted. There are two possibilities for being correctly predicted. One is to predict the true positive class as a positive class (). The other is to predict the original positive class as a negative class ().
There are occasions when contradictory situations exist between and indicators. Therefore, a comprehensive calculation formula (F-Measure) [62] of and was selected in this study for the overall evaluation of the model
5. Results and Analysis
In this paper, we propose a recommendation location method of digital signage with multi-source information fusion, and perform research on location recommendations for outdoor digital signage in the Beijing Sixth Ring Road area. Through the establishment of the abovementioned models, in this section, we mainly use the experiments to verify the effectiveness of the location recommendation algorithm and analyze the influence of four clustering algorithms on the recommended result.
5.1. Regional Division Results
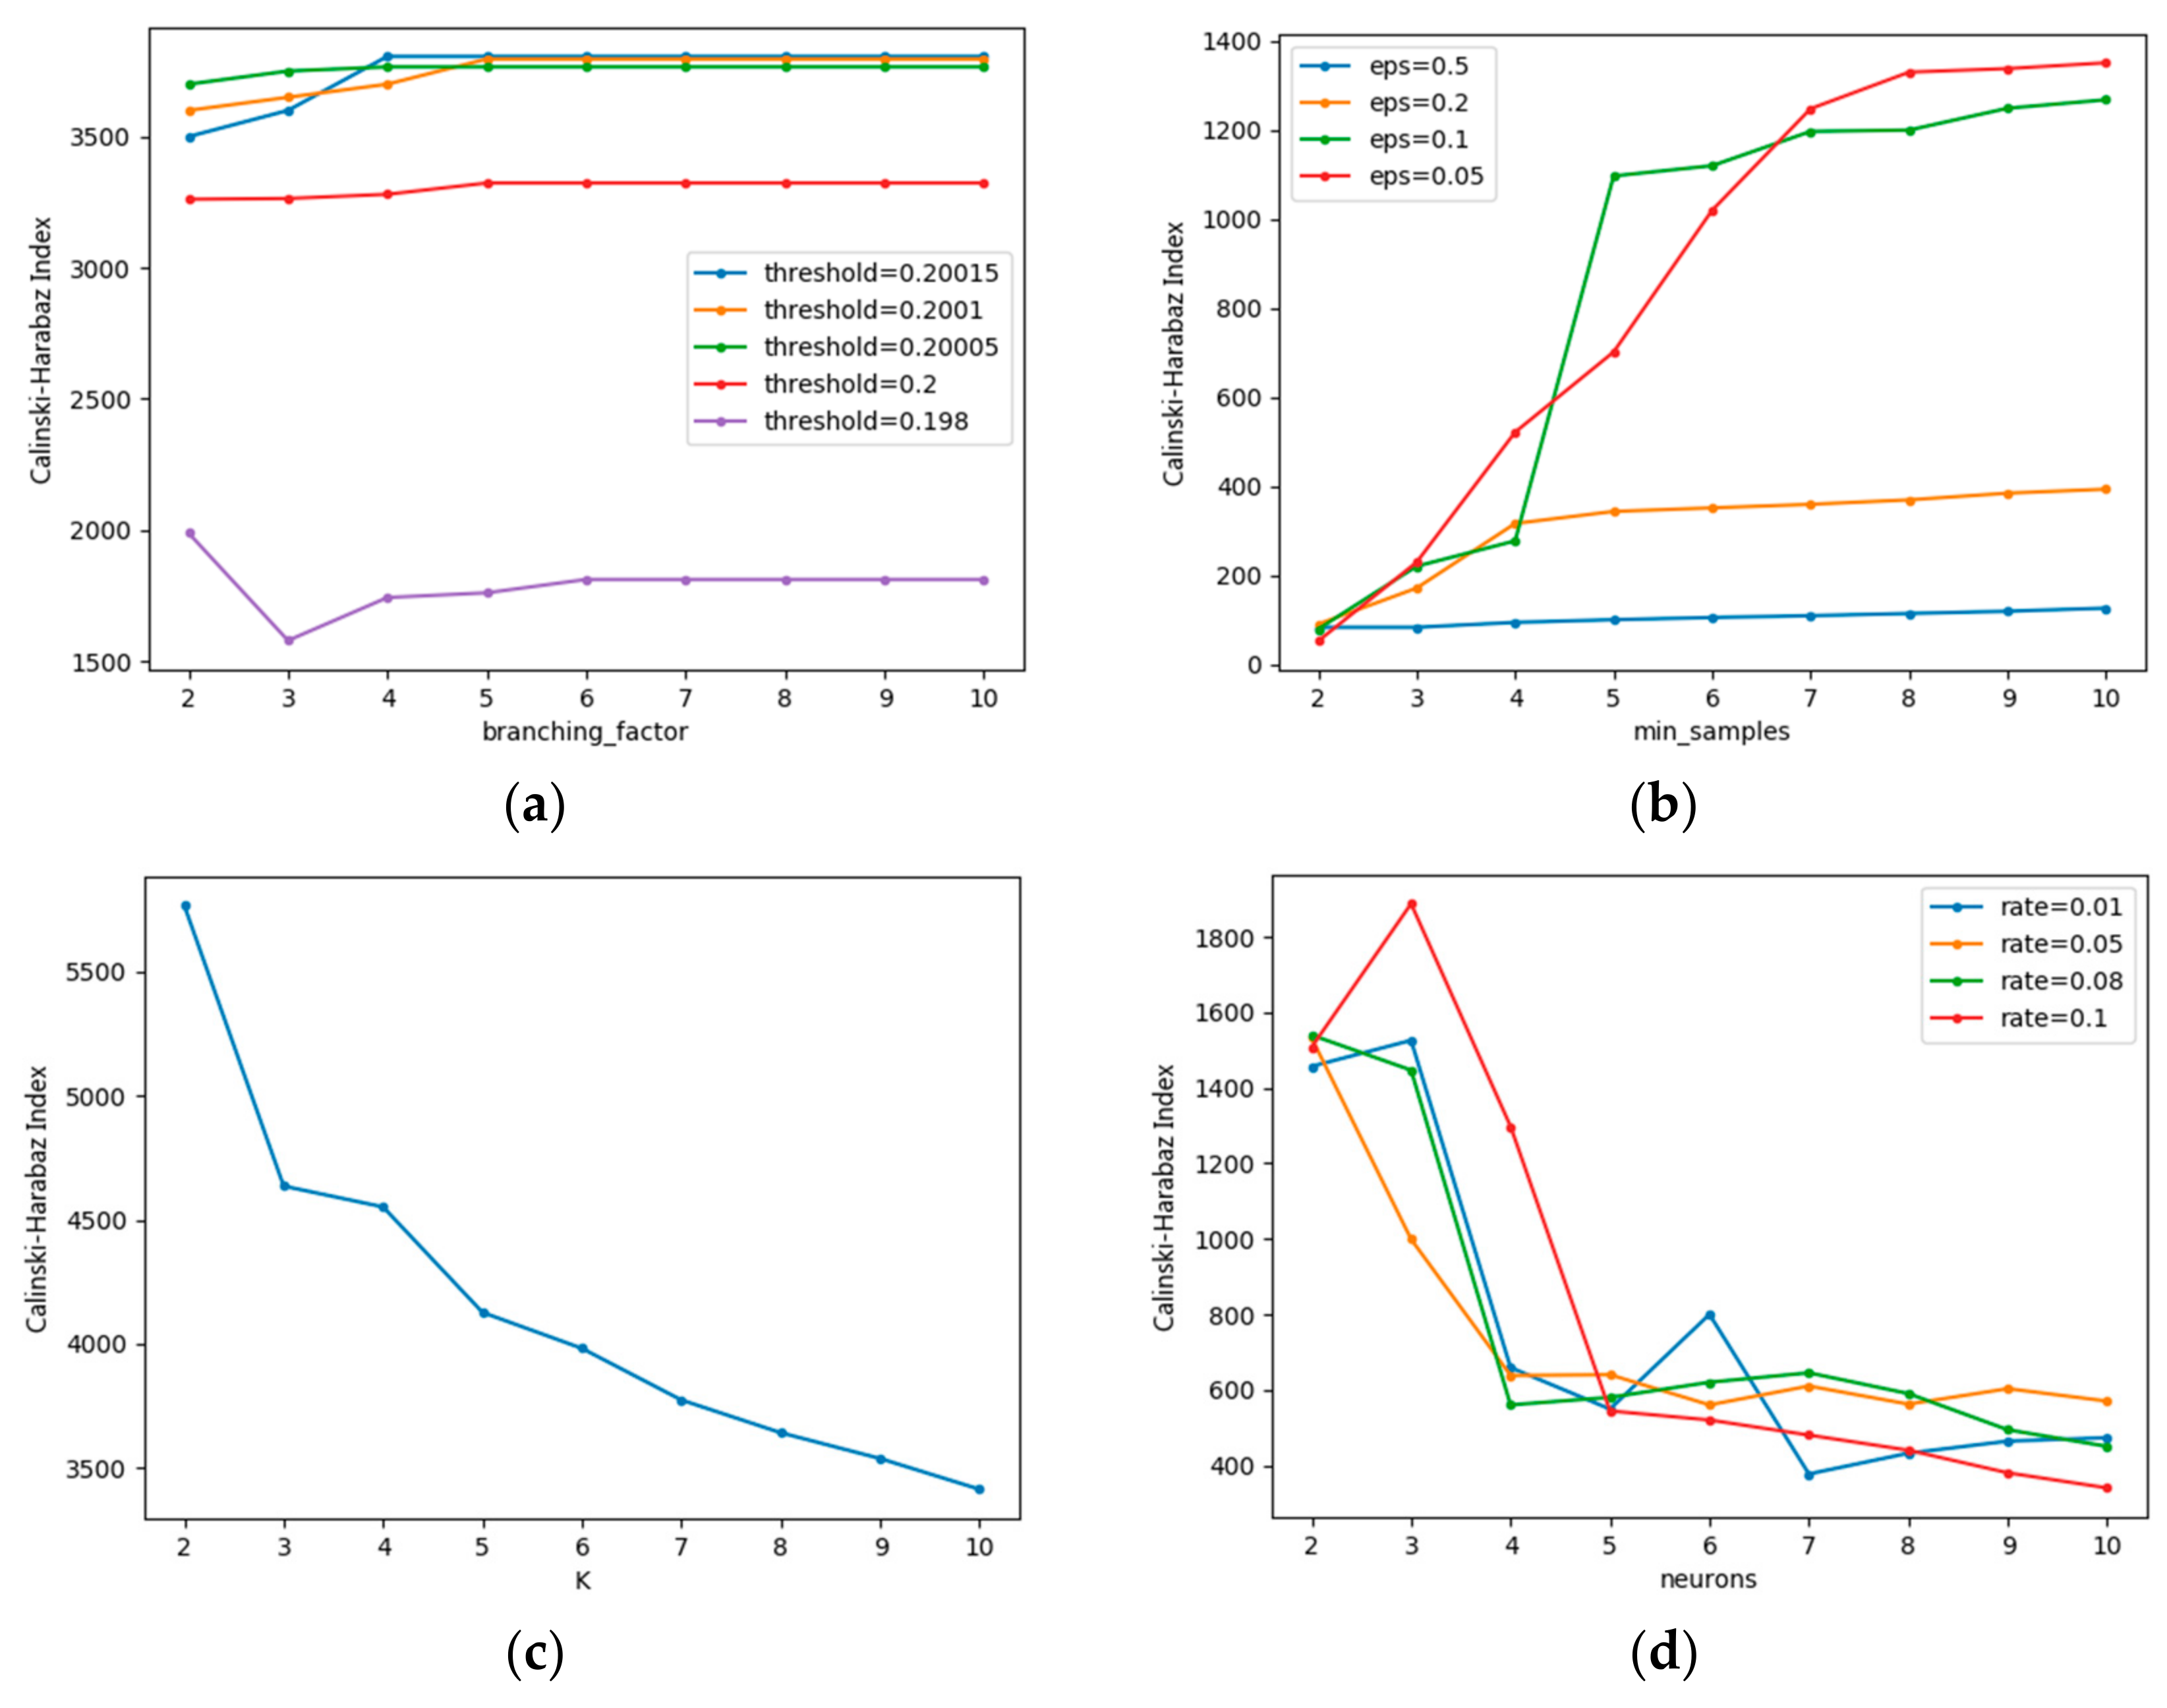
We used SOM, K-means, BIRCH, and DBSCAN clustering algorithms to divide the study area into regions. Through multiple experiments to adjust the parameters of each algorithm, the clustering quality index (CH index) was later applied to find the best clustering parameters in each algorithm.
The parameters of each algorithm shown in Table 1. The parameters of each algorithm in the experiment were adjusted to obtain different CH. The variation plot of the clustering quality against parameters for four clustering algorithms including BIRCH, DBSCAN, K-means, and SOM is shown in Figure 6. Based on Figure 6a, for the same threshold value, the CH index does not change with different branching factor values. However, the CH index value is significantly reduced when the threshold value is too small, and the CH index is maximized when the branching factor = 4 and the threshold = 0.20015. According to Figure 6b, for the same eps value, with the increase of the min samples, the CH index value increases first and then remains the same. For the same min samples value, with an increasing eps value, the CH index decreases; when min samples = 8 and eps = 0.05, the CH index reaches the maximum. As seen in Figure 6c, the CH index decreases with the increase of the K value; when K = 2, the CH index reaches the maximum. While in Figure 6d, for the same rate value, with the increase of the neurons’ value, the CH index increases first and then decreases. For different rate values, the CH index does not change with various neurons values. When the rate = 0.1 and neurons = 3, the CH index reaches the maximum.
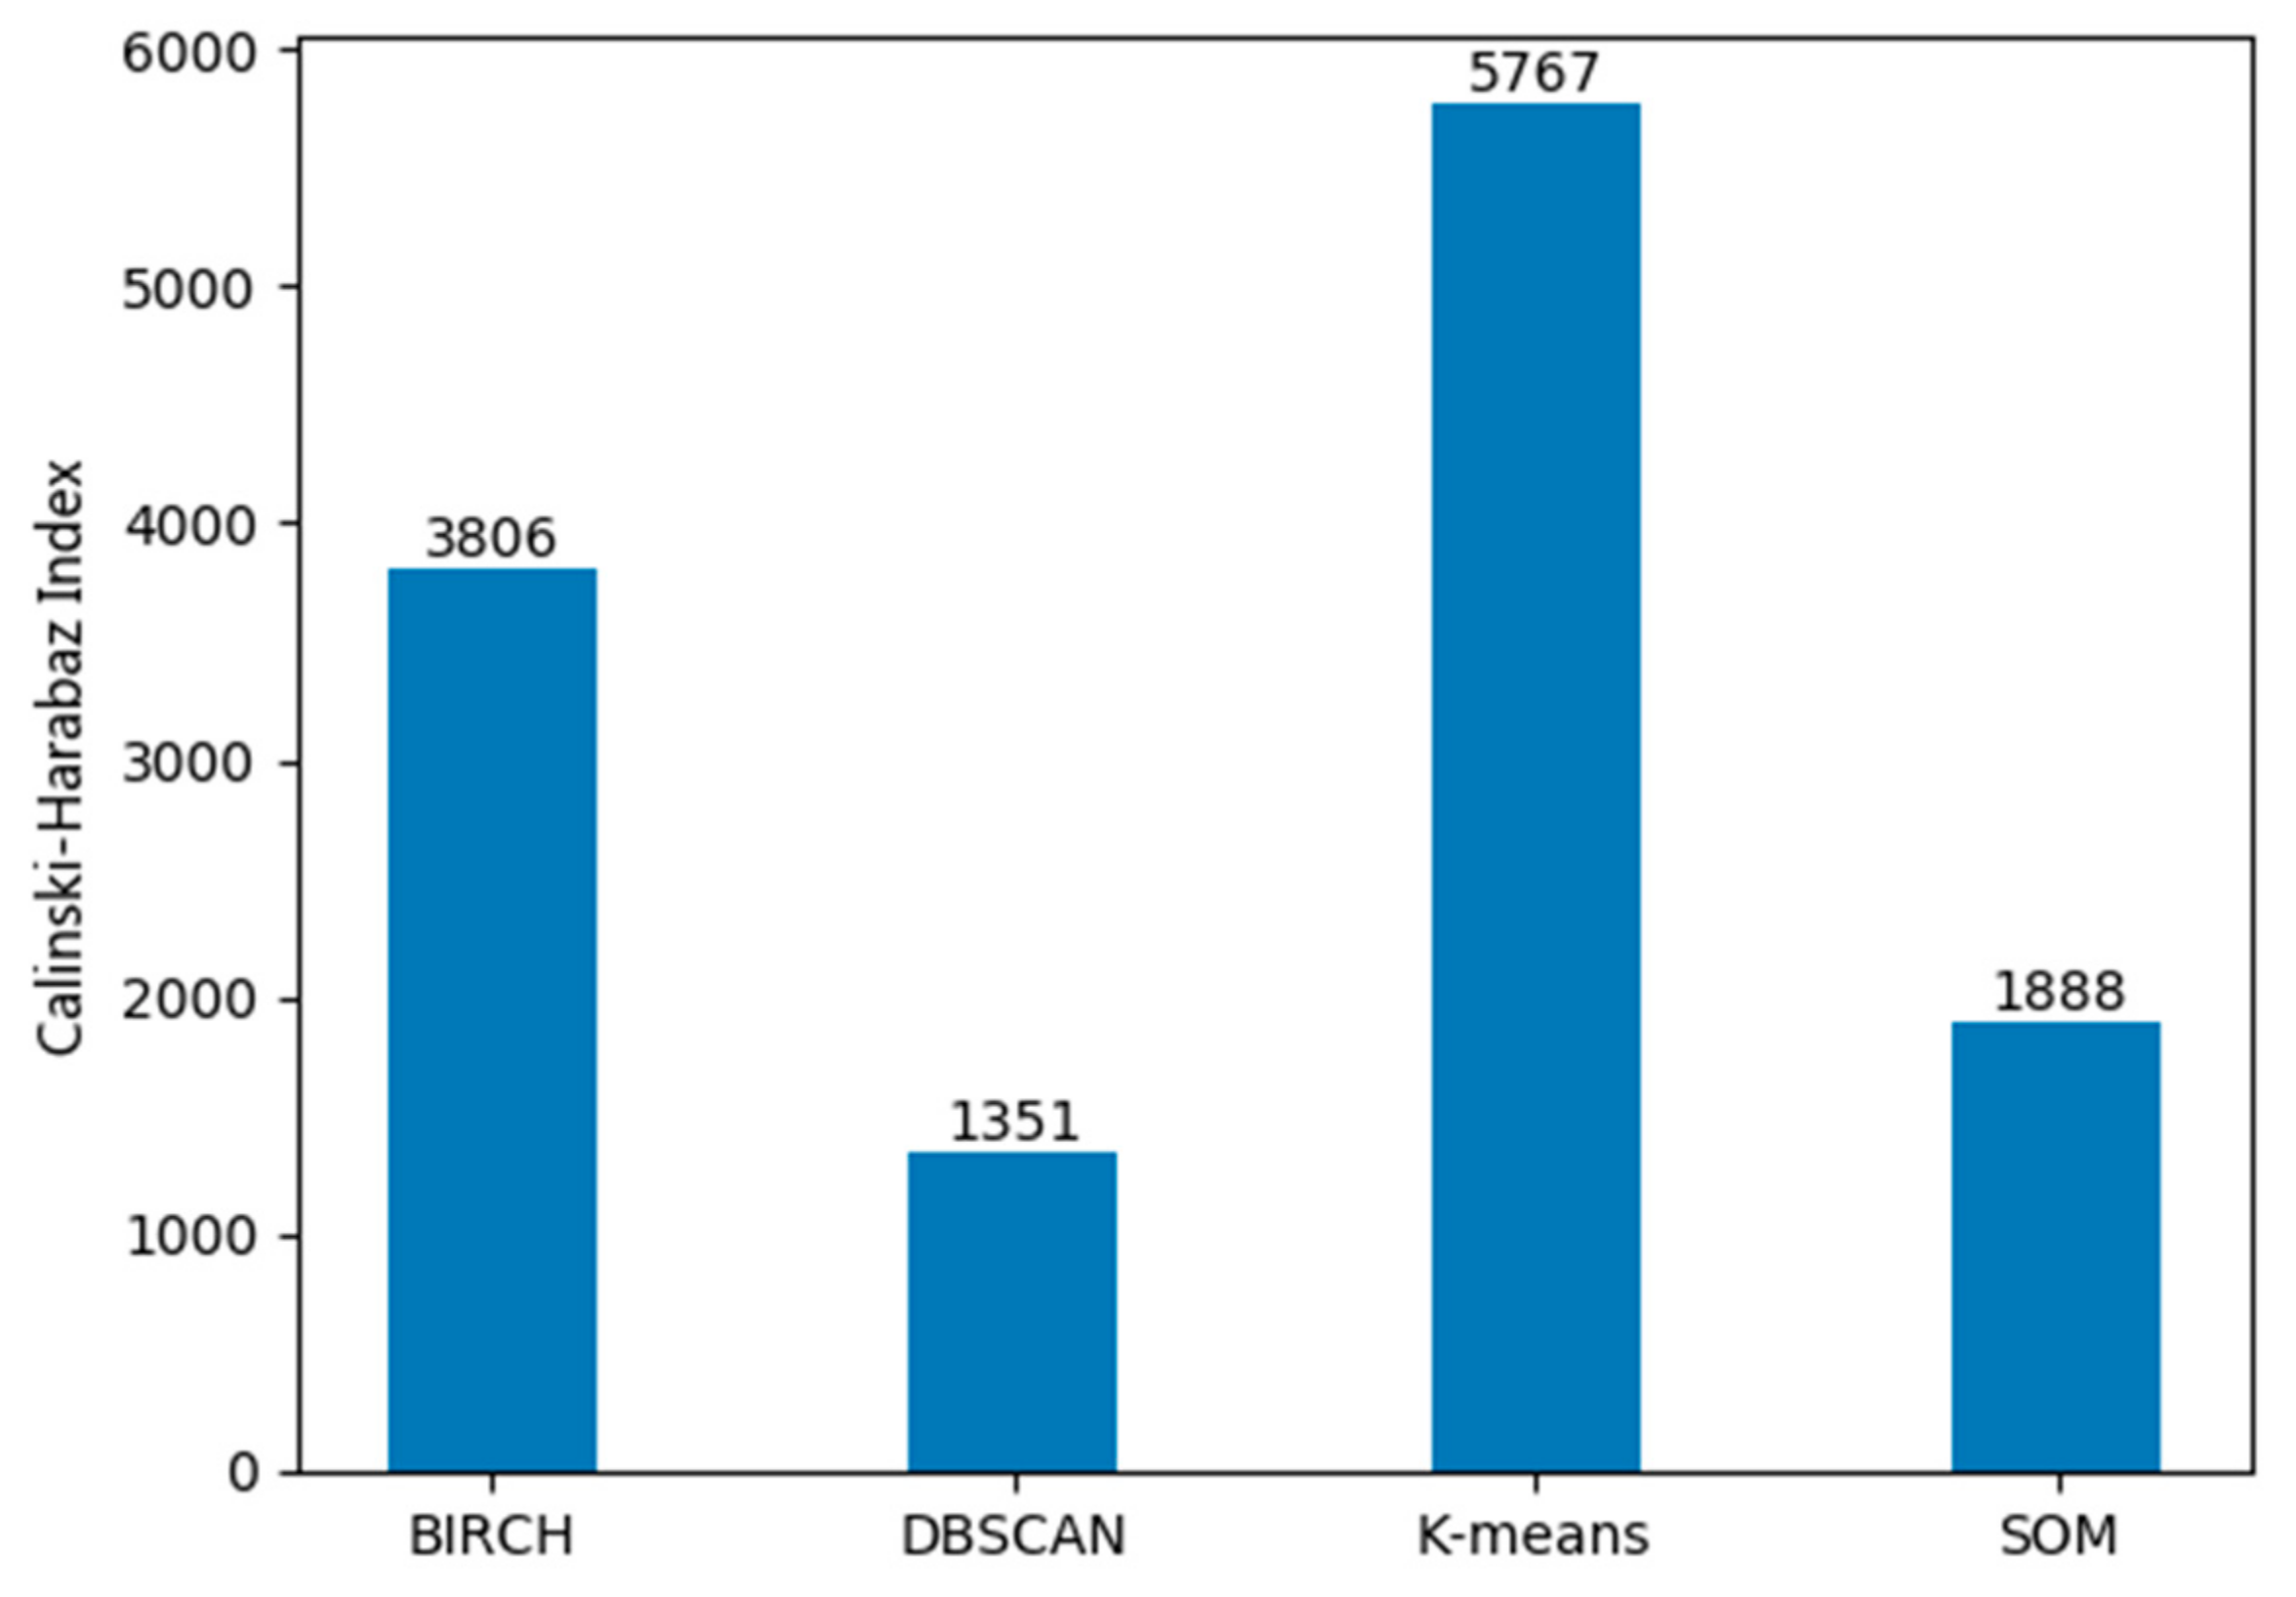
The parameter that maximizes the value of the CH index was applied as the optimal parameter for clustering. Next, the CH index values for each algorithm were compared under the optimal parameters (Figure 7). It can be seen from Figure 7 that when the study area is divided using the K-means algorithm, the CH value is the largest, and when the study area is divided using the DBSCAN algorithm, the CH value is the smallest. However, the CH value was usually taken to evaluate the clustering quality of different parameters of a specific clustering algorithm. Moreover, the evaluation of the clustering effect of the different algorithms has yet to be fully defined. Therefore, to select the clustering algorithm that is most suitable for the regional division of this study more accurately, we will compare the recommendation results after division by the four algorithms.
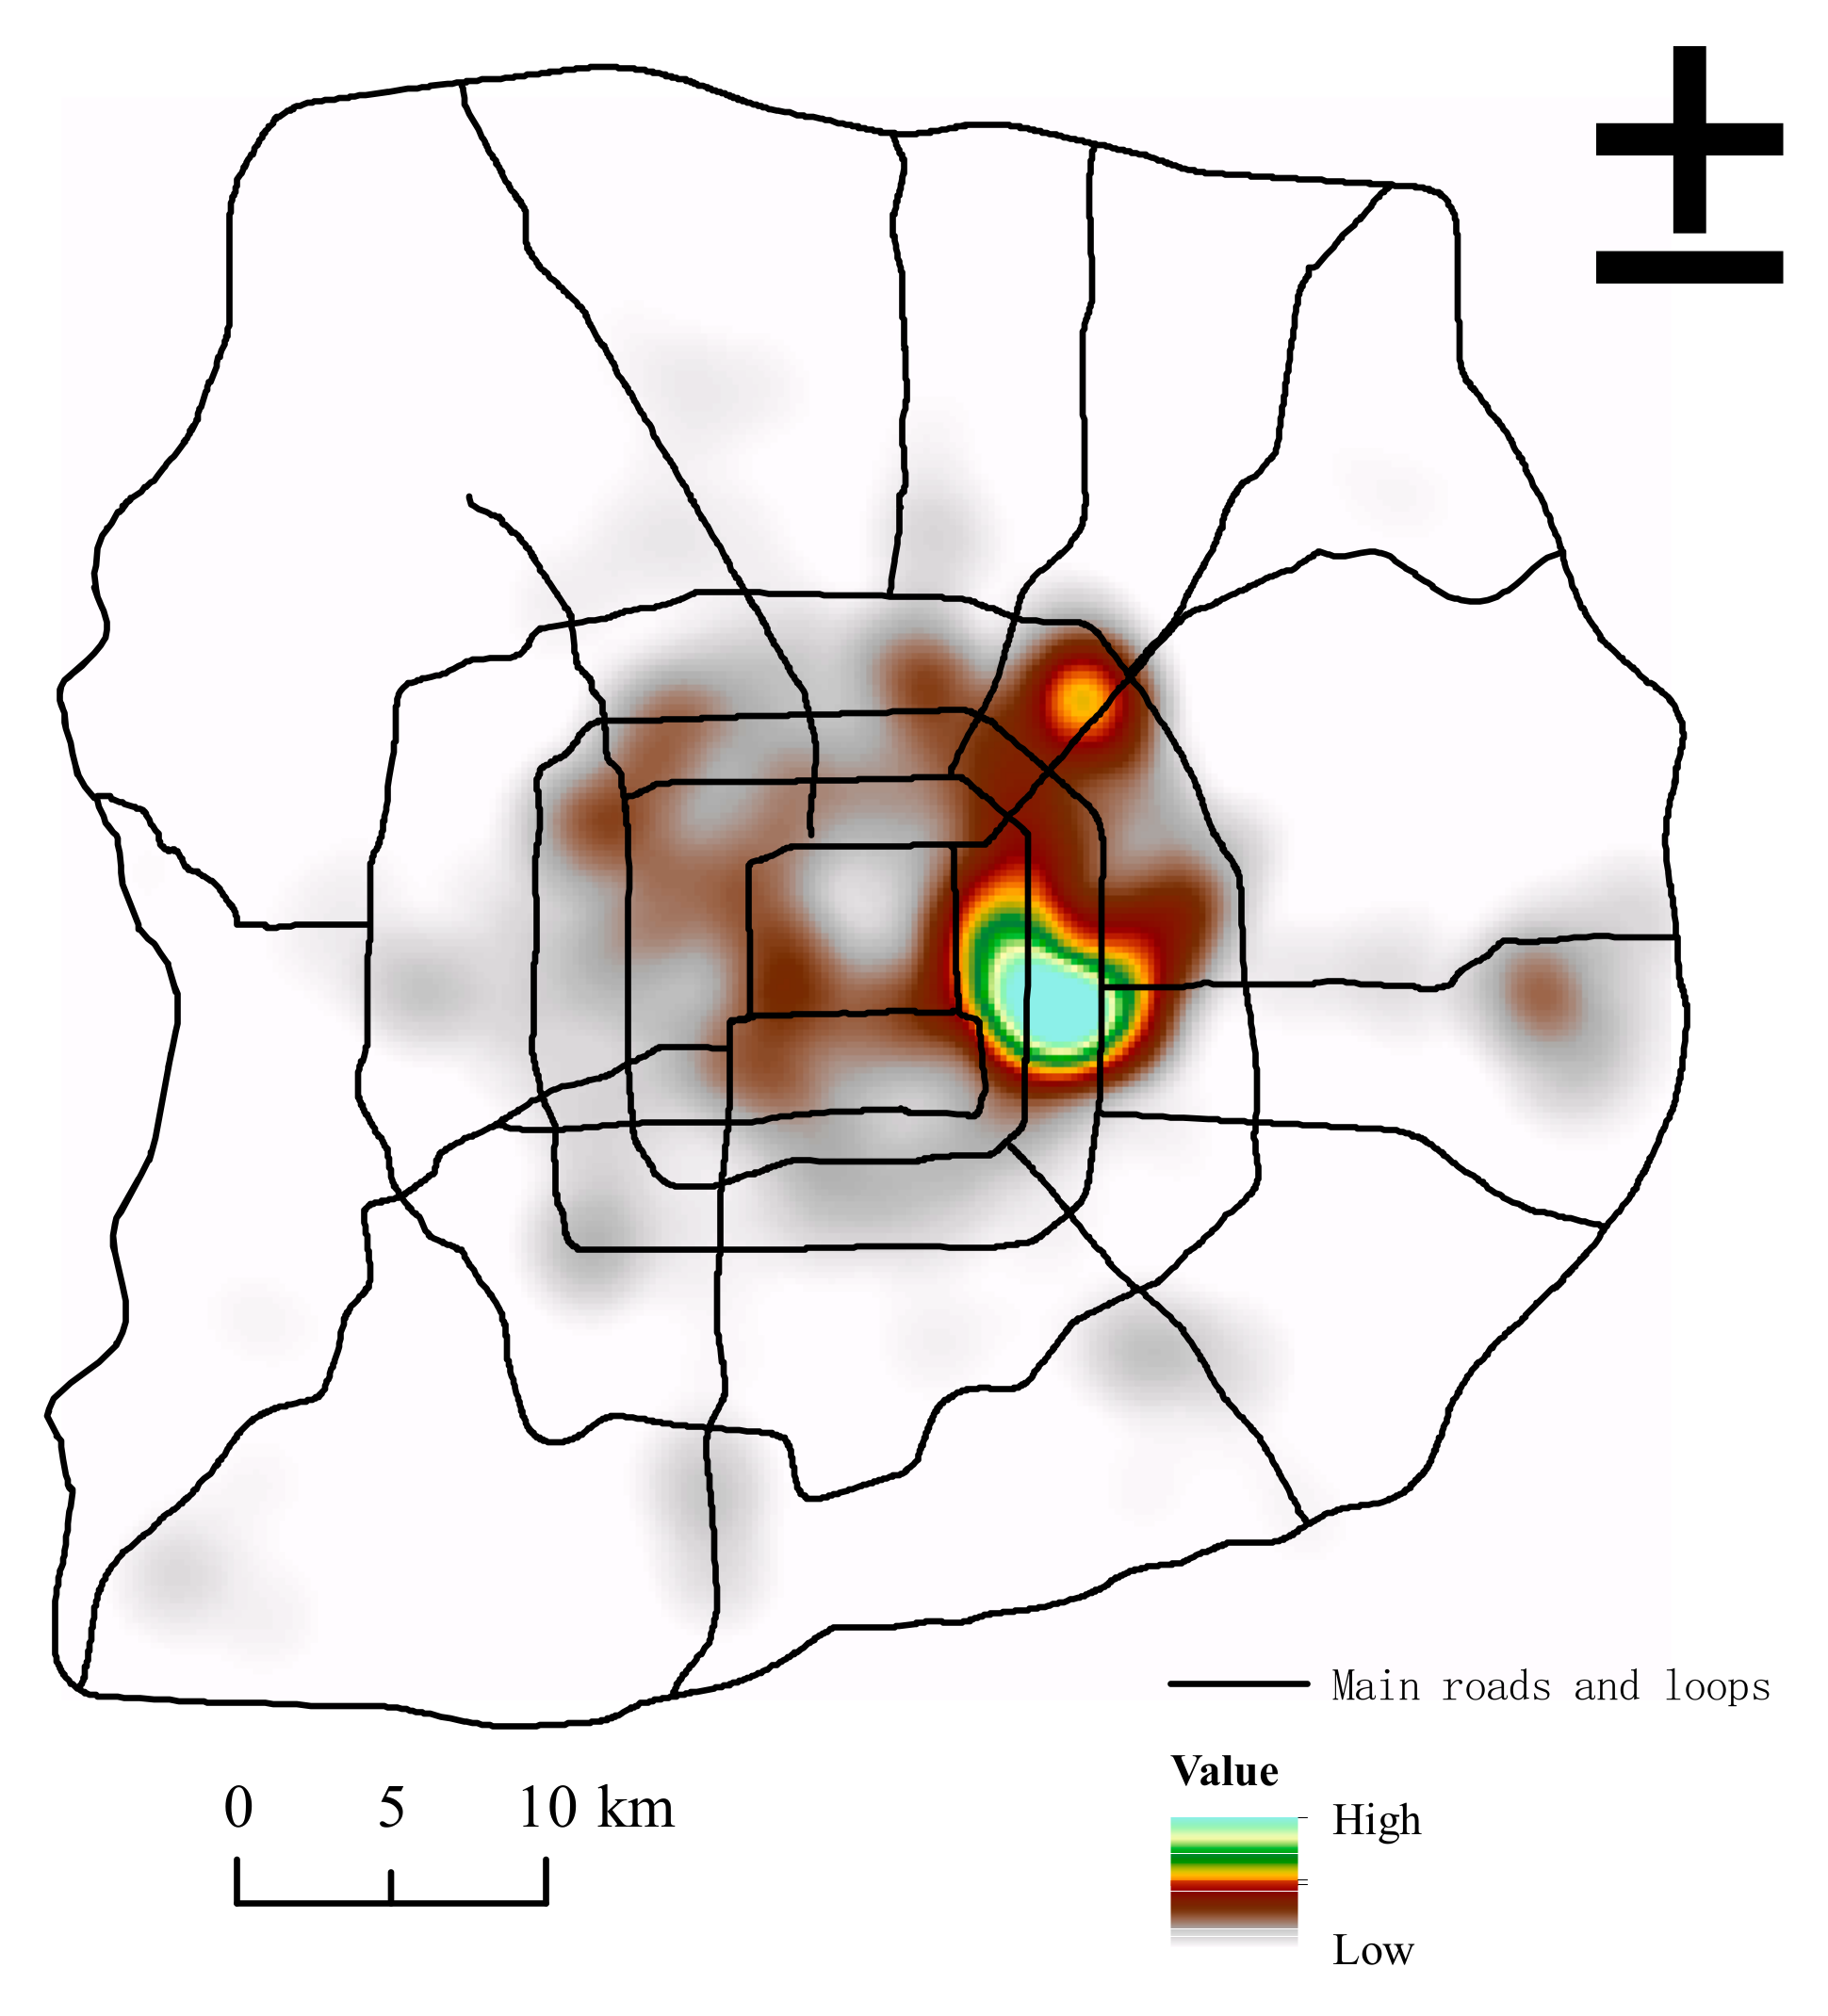
5.2. Kernel Density Analysis
To incorporate spatial characteristics into recommendations, the kernel density function in ArcGIS was evaluated to assess the density of the sample data of digital signage. Figure 8 shows the kernel density distribution of digital signage sample points in the study area. It can be seen that the degree of spatial clustering of digital signage can be divided into three levels: (1) Relying on the superior commercial location environment, a large number of digital signage systems are distributed in areas such as Guomao, Shuangjing and Panjiayuan, making it the most prominent area for digital signage agglomeration in the Beijing Sixth Ring Road area. (2) The most prominent digital signage space agglomeration area includes 798 Art District, Olympic Park, Xidan, Wangfujing, and Zhongguancun. (3) The spatial distribution of digital signage in a number of scattered areas from the Fourth Ring Road to the Sixth Ring Road initially shows an agglomeration feature.
5.3. Location Recommendation Analysis
In this paper, the recommendation of digital signage locations associated with geographical features, such as economy and population, was achieved by integrating the spatial features of regional divisions and geographic locations into the location recommendation algorithm. We used the product of the location factor weights and location factors obtained in Section 4.1 as the data source for the recommendation, and we combined the digital signage kernel density obtained in Section 4.2 with the similarity measure to achieve the location recommendation of the digital signage. To make the recommendation result of the model more accurate and reliable, a 10-fold cross-validation method was brought in the recommendation experiment. Specifically, the data set is divided into 10 average parts; each time, nine of them are used as training data, and the remaining data are used as test data. After 10 tests, the results are weighted and averaged as the final training result. Next, the threshold of the recommendation score (RS) is set to 0~0.9, and the step length is set to 0.1. In particular, the higher the threshold of the sample recommendation score, the more likely it is that the sample point will be the layout with digital signage.
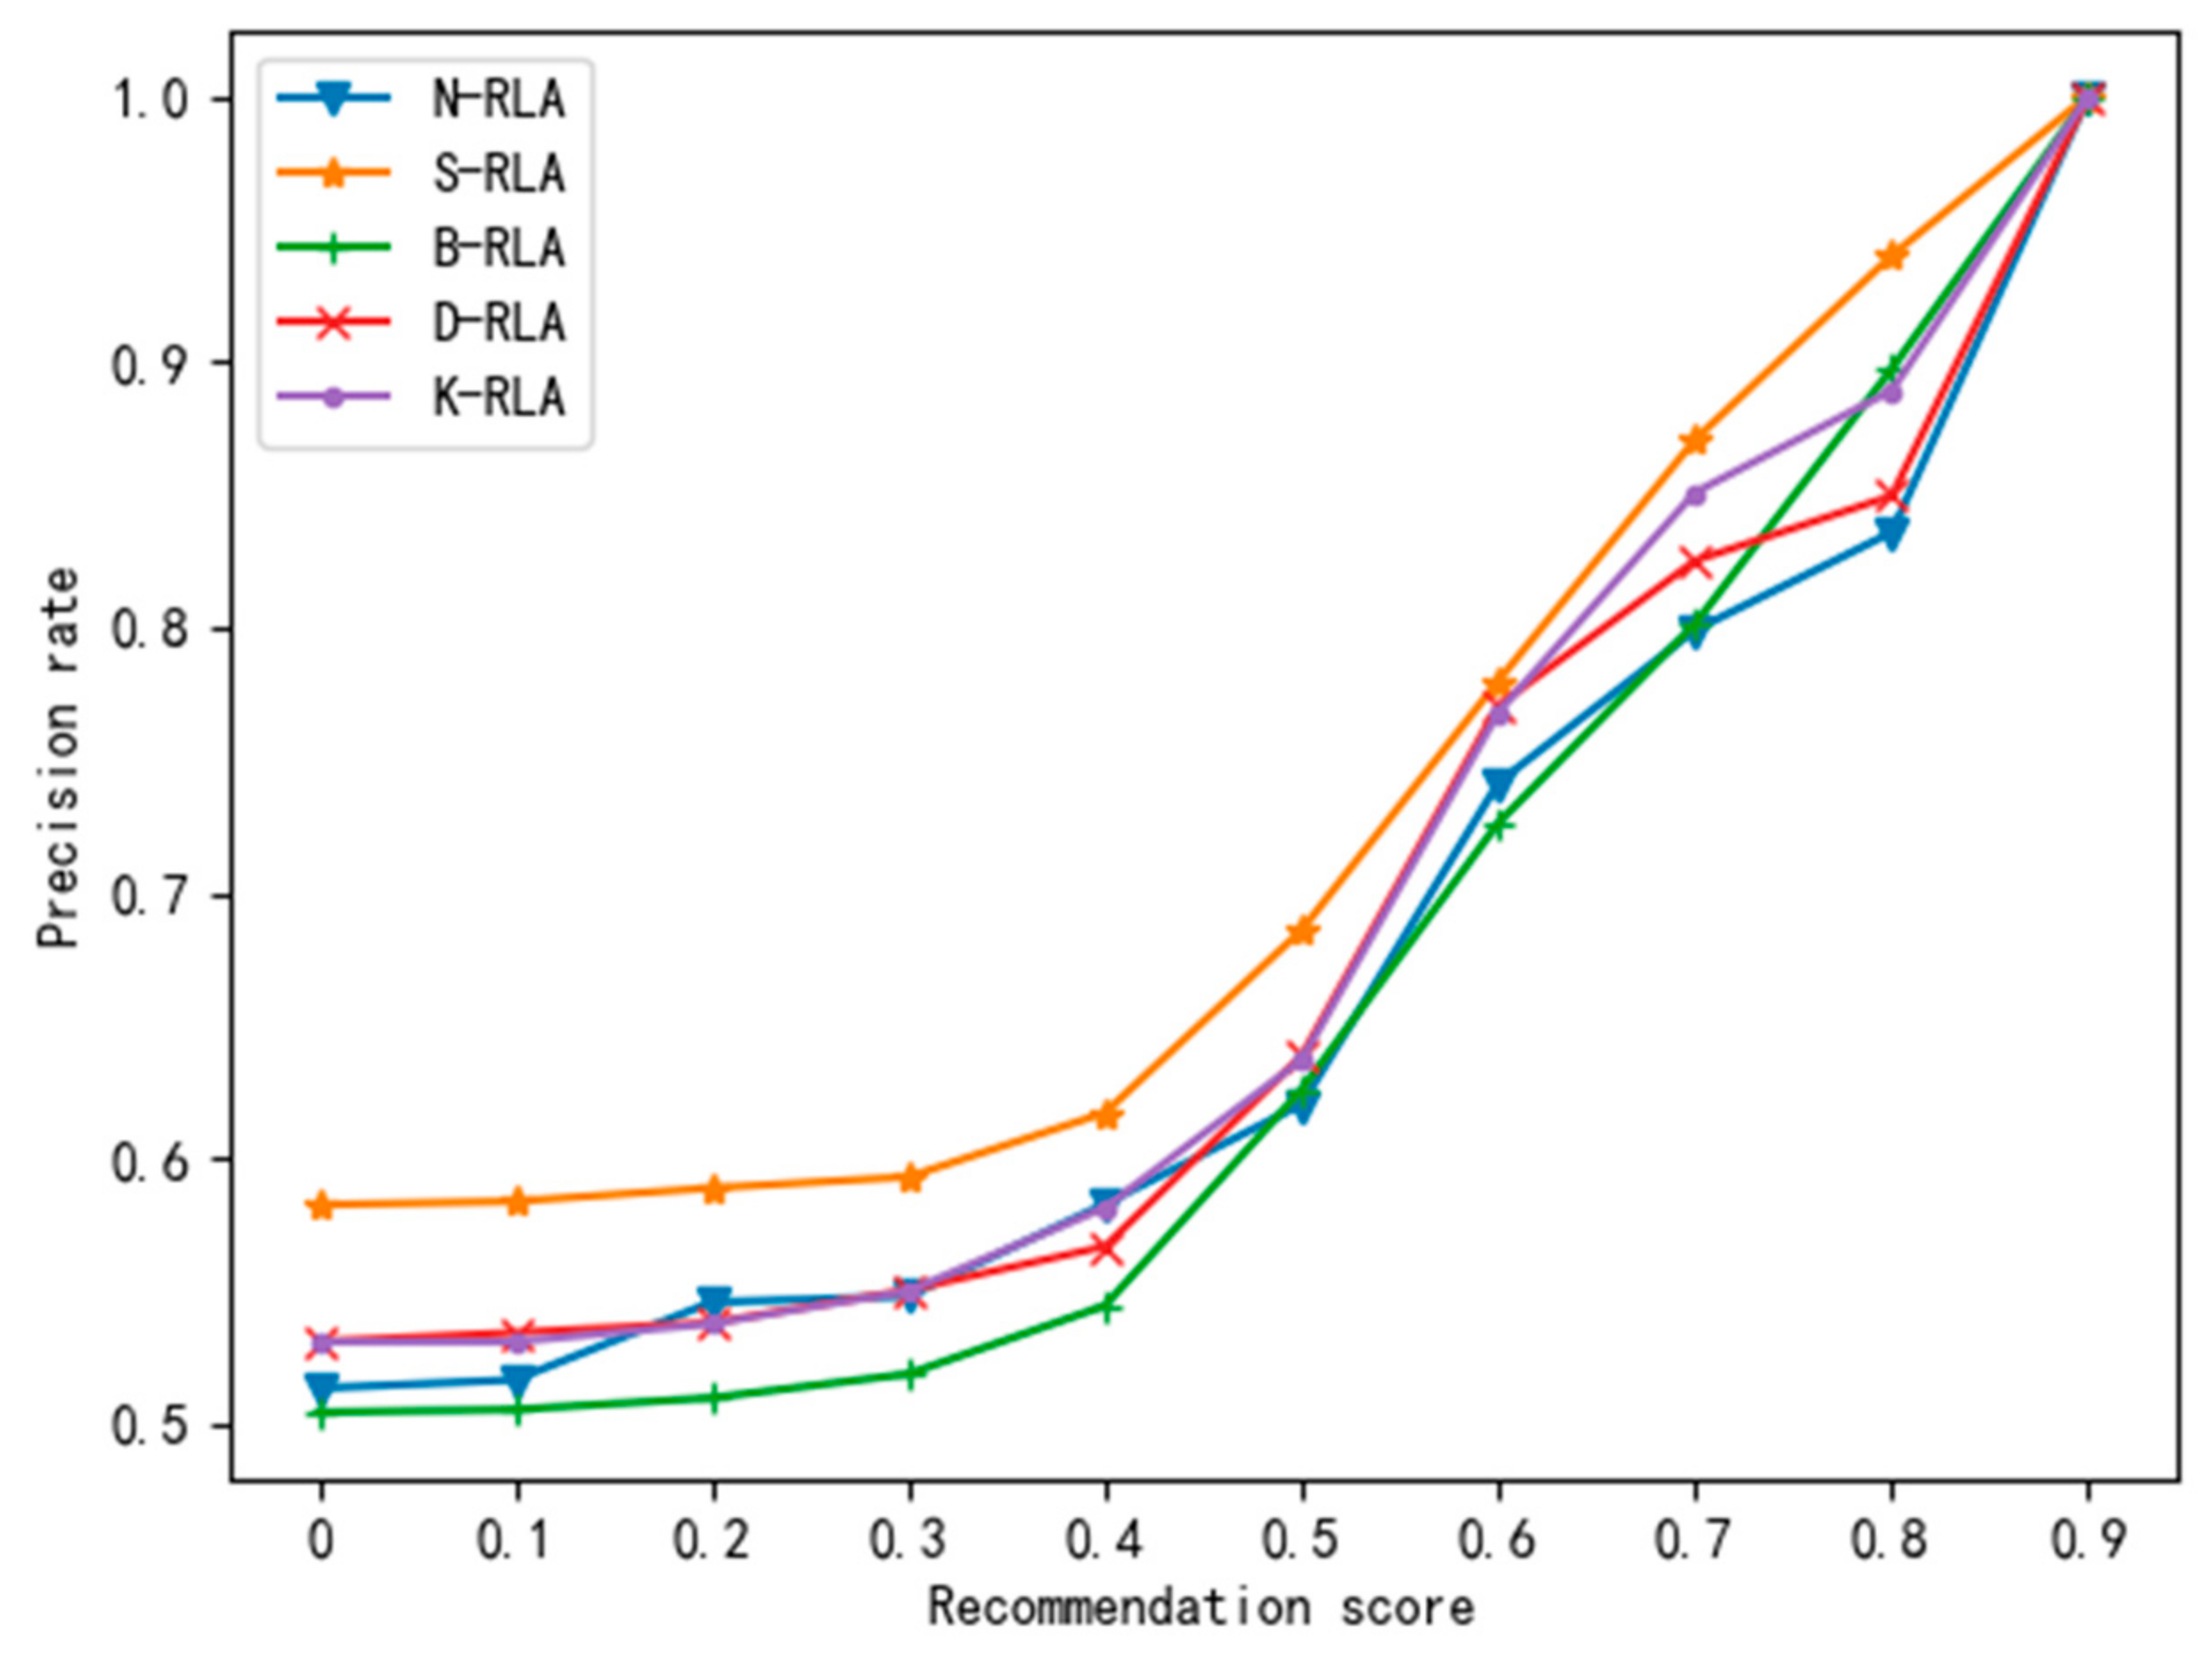
Figure 9 shows the comparison of P for the five algorithms. It can be seen from the figure that within the range of the RS, the P of the five algorithms has achieved good results, with a minimum value of approximately 0.5 and a maximum value that reaches 1. The P does not change considerably for the RS less than 0.4, while in the range of 0.5 to 0.9, the P increases sharply. The performance of location recommendation algorithm after SOM partition (S-RLA) on P is outstanding among the five models. When RS is in the range of 0.2 to 0.4, the P of location recommendation algorithm after K-means partition (K-RLA) and location recommendation algorithm after DBSCAN partition (D-RLA) are close to location recommendation algorithm with no partition (N-RLA), However, in the other RS, the P values of K-RLA and D-RLA are slightly higher than N-RLA. Within the RS range, the P of location recommendation algorithm after BIRCH partition (B-RLA) is significantly lower than those of S-RLA, K-RLA, and D-RLA. When RS is 0 to 0.5, the P of B-RLA is lower than that of N-RLA, while when RS > 0.5, the P of B-RLA is slightly higher than N-RLA.
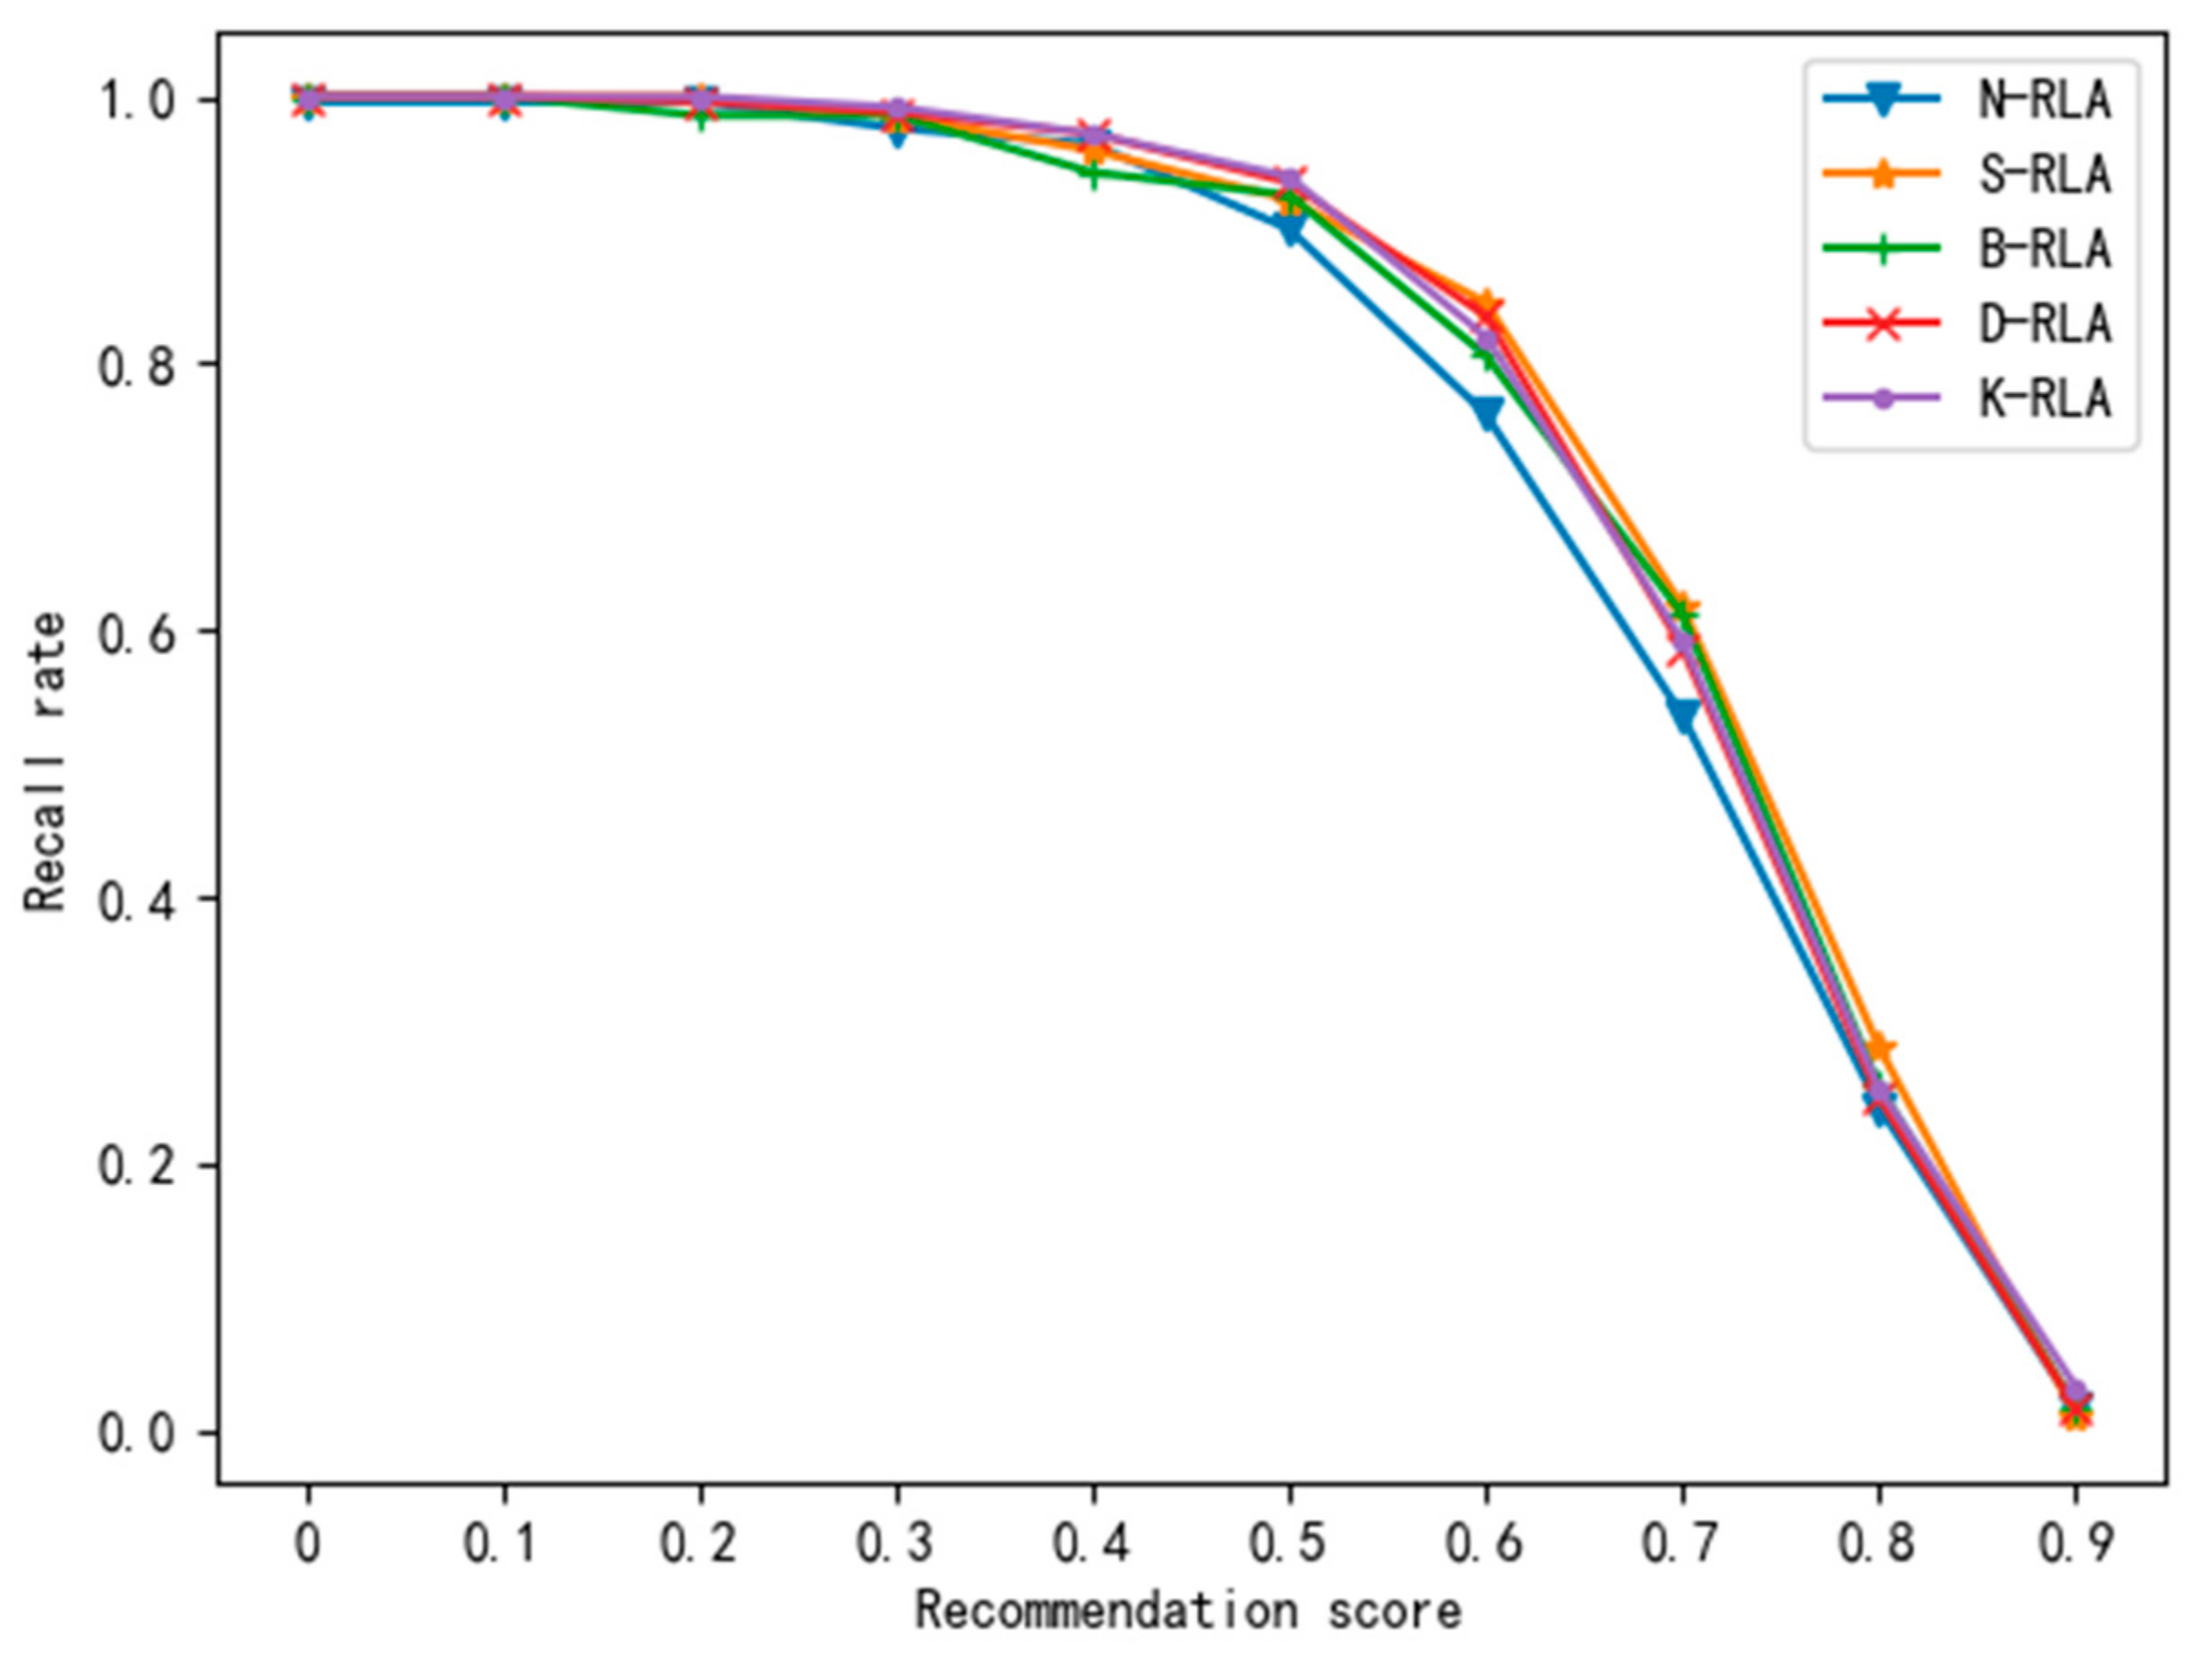
The R for the five algorithms is presented in Figure 10. The R of an algorithm is an inverted U curve. The R does not change considerably for the RS less than 0.4, while in the range of 0.5 to 0.9, the R decreases sharply and eventually is close to 0. When RS is in the range of 0 to 0.4, the R of the five algorithms is the same. When RS > 0.4, the P of S-RLA is slightly higher than the other four algorithms. Within the RS, the R of K-RLA, D-RLA, and B-RLA are almost equal and slightly higher than N-RLA.
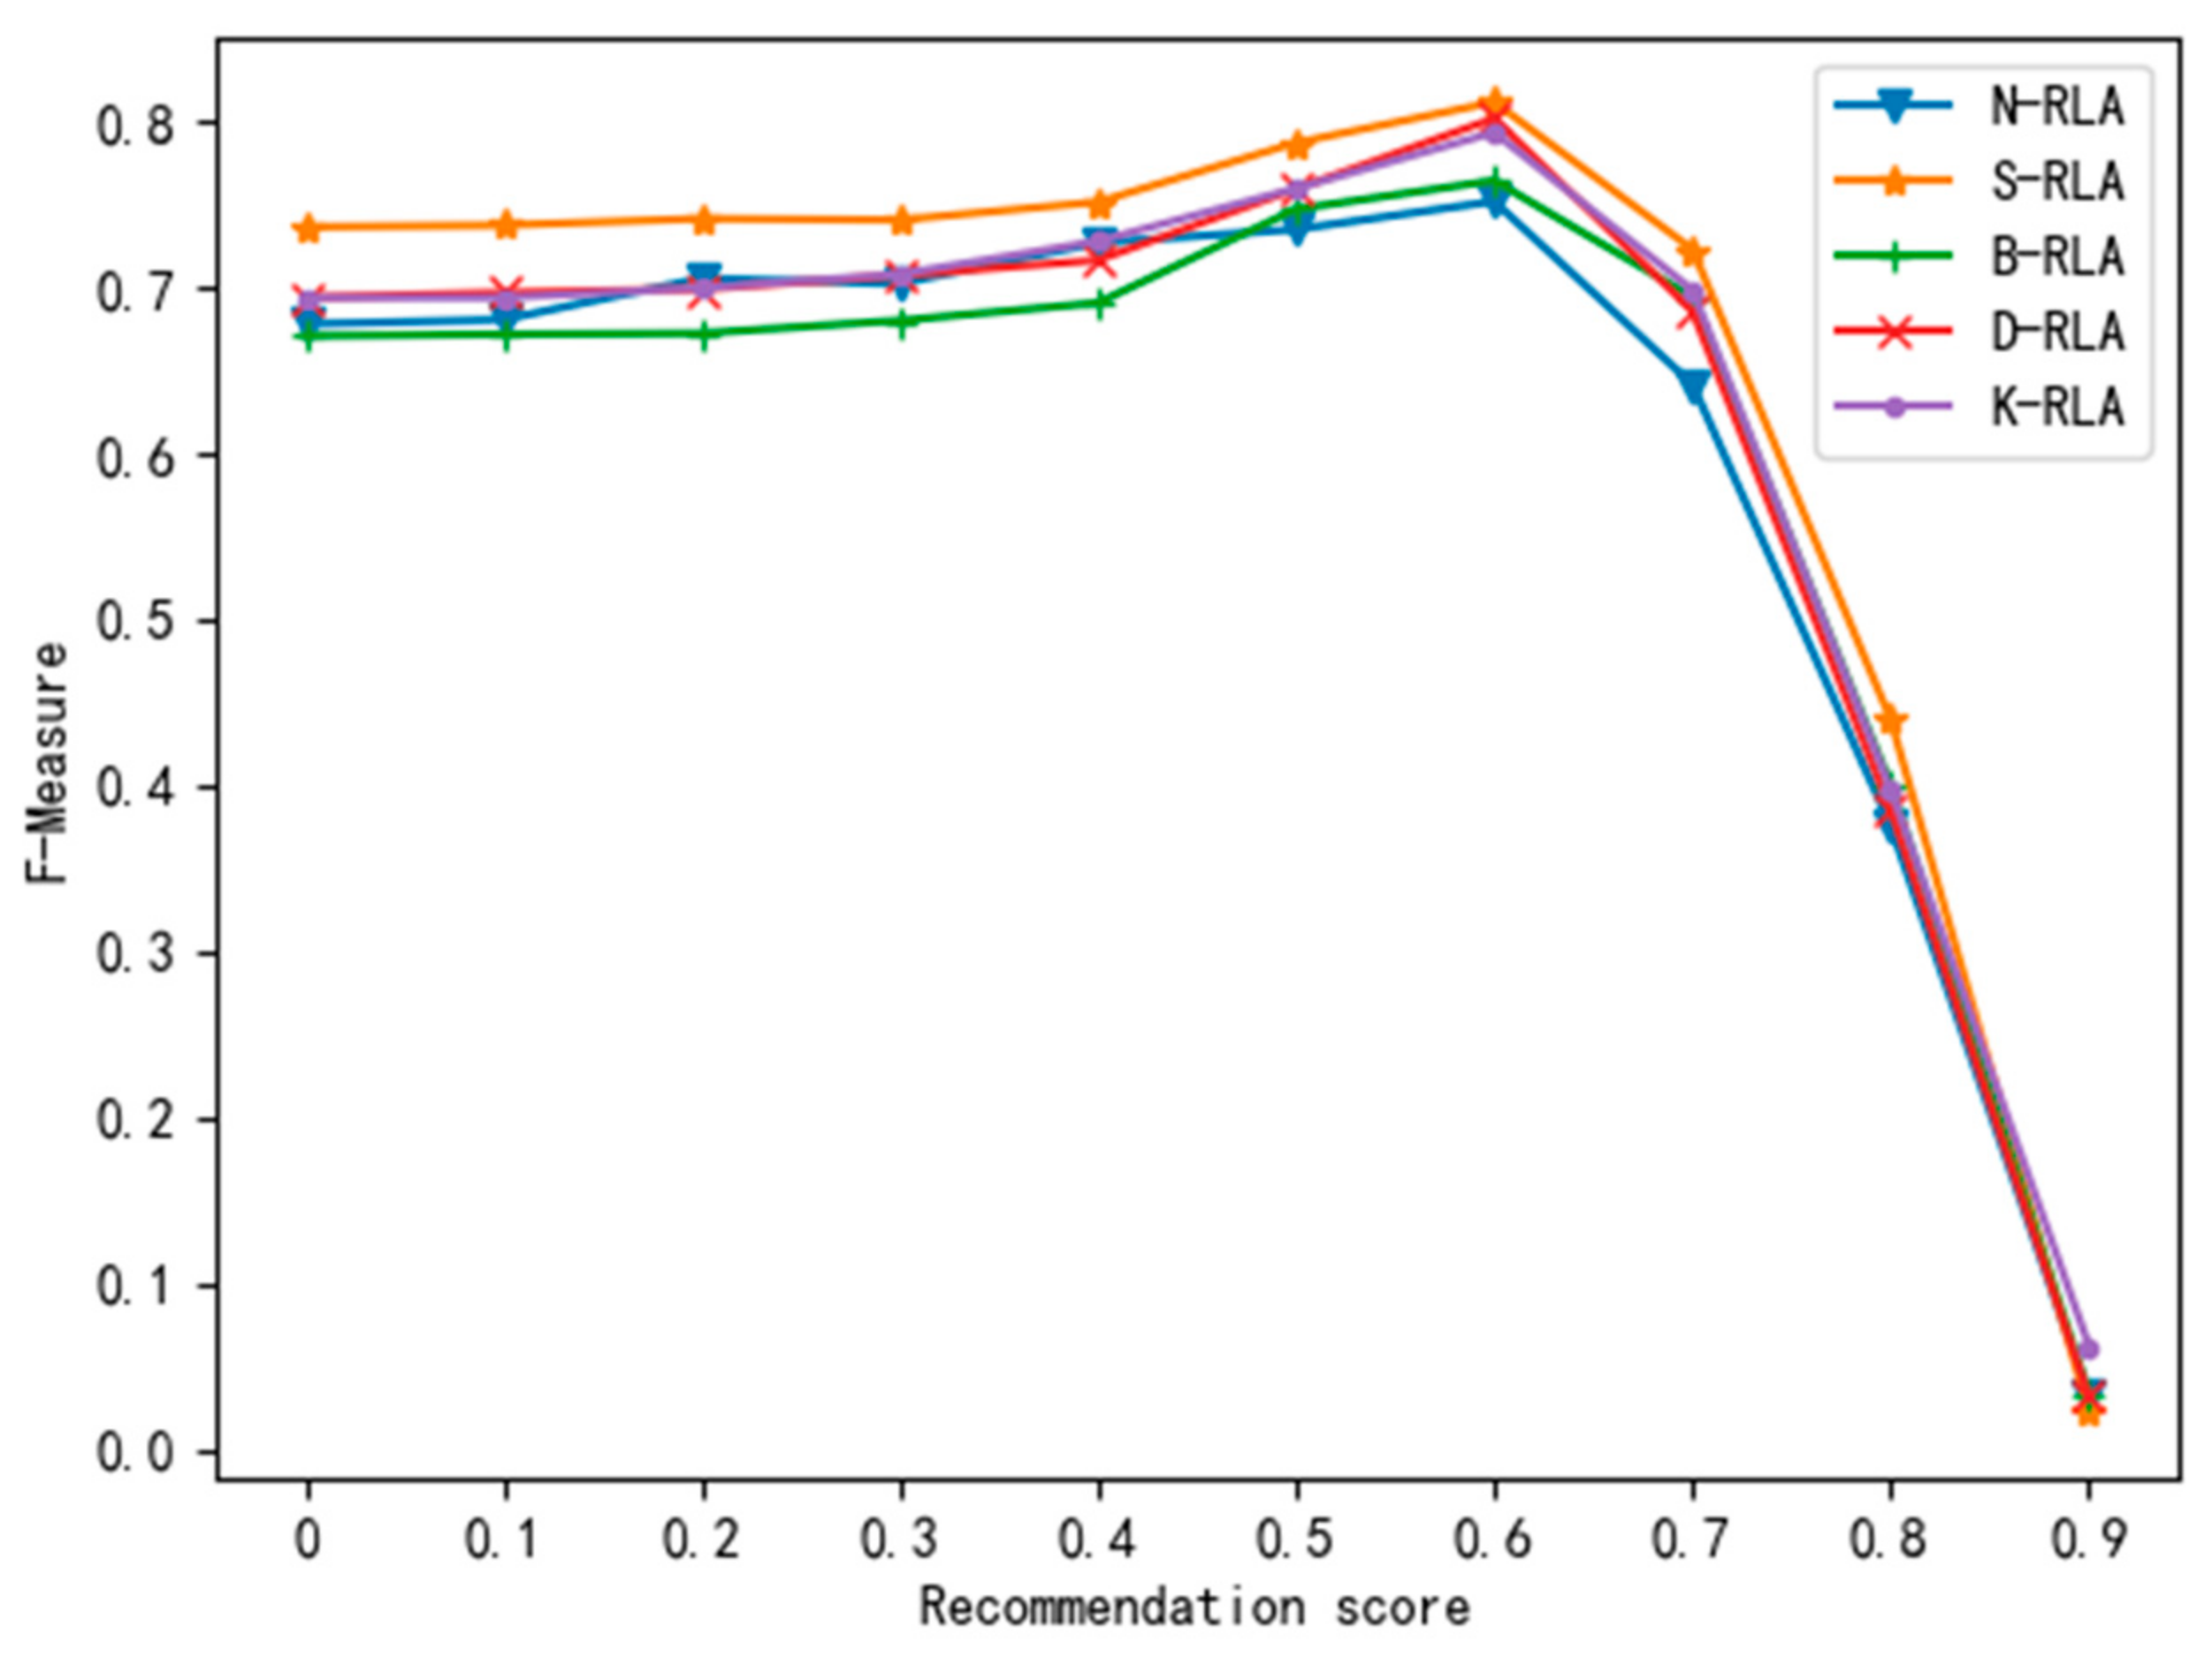
From Figure 9 and Figure 10, we can see that under different RS, the values of P and R cannot achieve the best at the same time, thus we choose the F (F-measure) to consider P and R together. The best combination of P and R is when F reach peak. Figure 11 shows the line chart of the F for different algorithms during experiments. From the plot, we can observe that when RS is in the range of 0 to 0.5, the F of the five algorithms increases slowly; when RS = 0.6, the F reaches the peak, while as RS increases from 0.6 to 0.9, the F of the five algorithm decreases sharply, and finally approaches zero. The performance of S-RLA on F is outstanding among the five models. Within the RS, the F of K-RLA and D-RLA are almost equal and slightly higher than B-RLA and N-RLA. When RS is in the range of 0 to 0.5, the F of B-RLA is lower than that of N-RLA, while when RS > 0.5, the F of B-RLA is slightly higher than N-RLA.
From the analysis of the validation results of the location recommendation algorithm proposed in this paper, we can observe the following: (1) according to the definition of P, R, and RS, with the growth of RS, the P will increase, and the R will decrease, which is consistent with the results of this paper. Therefore, it was proven that the location recommendation algorithm that couples multi-source elements proposed in this paper is realistic. (2) The F of the five algorithms all reach their peak when RS = 0.6, indicating that P and R of the model are the best at this time. Therefore, using this value as the digital signage location recommendation threshold can guarantee the model has better P and R. Furthermore, when RS = 0.6 (Table 2), the five algorithms maintain a high P and R, which shows that the proposed algorithm has a better recommendation effect and can further improve the recommendation quality. (3) The P and R of the S-PLA are significantly higher than the other four algorithms, revealing that use SOM to divide the study area has the best recommendation effect. However, using K-means, BIRCH, and DBSCAN to partition the study area had no significant effect on the recommendation results. (4) The recommended results of the four algorithms in this section are completely different from the results of the four clustering effects in Section 4.1, evidencing that the CH index is not suitable for evaluating the clustering quality of different algorithms.
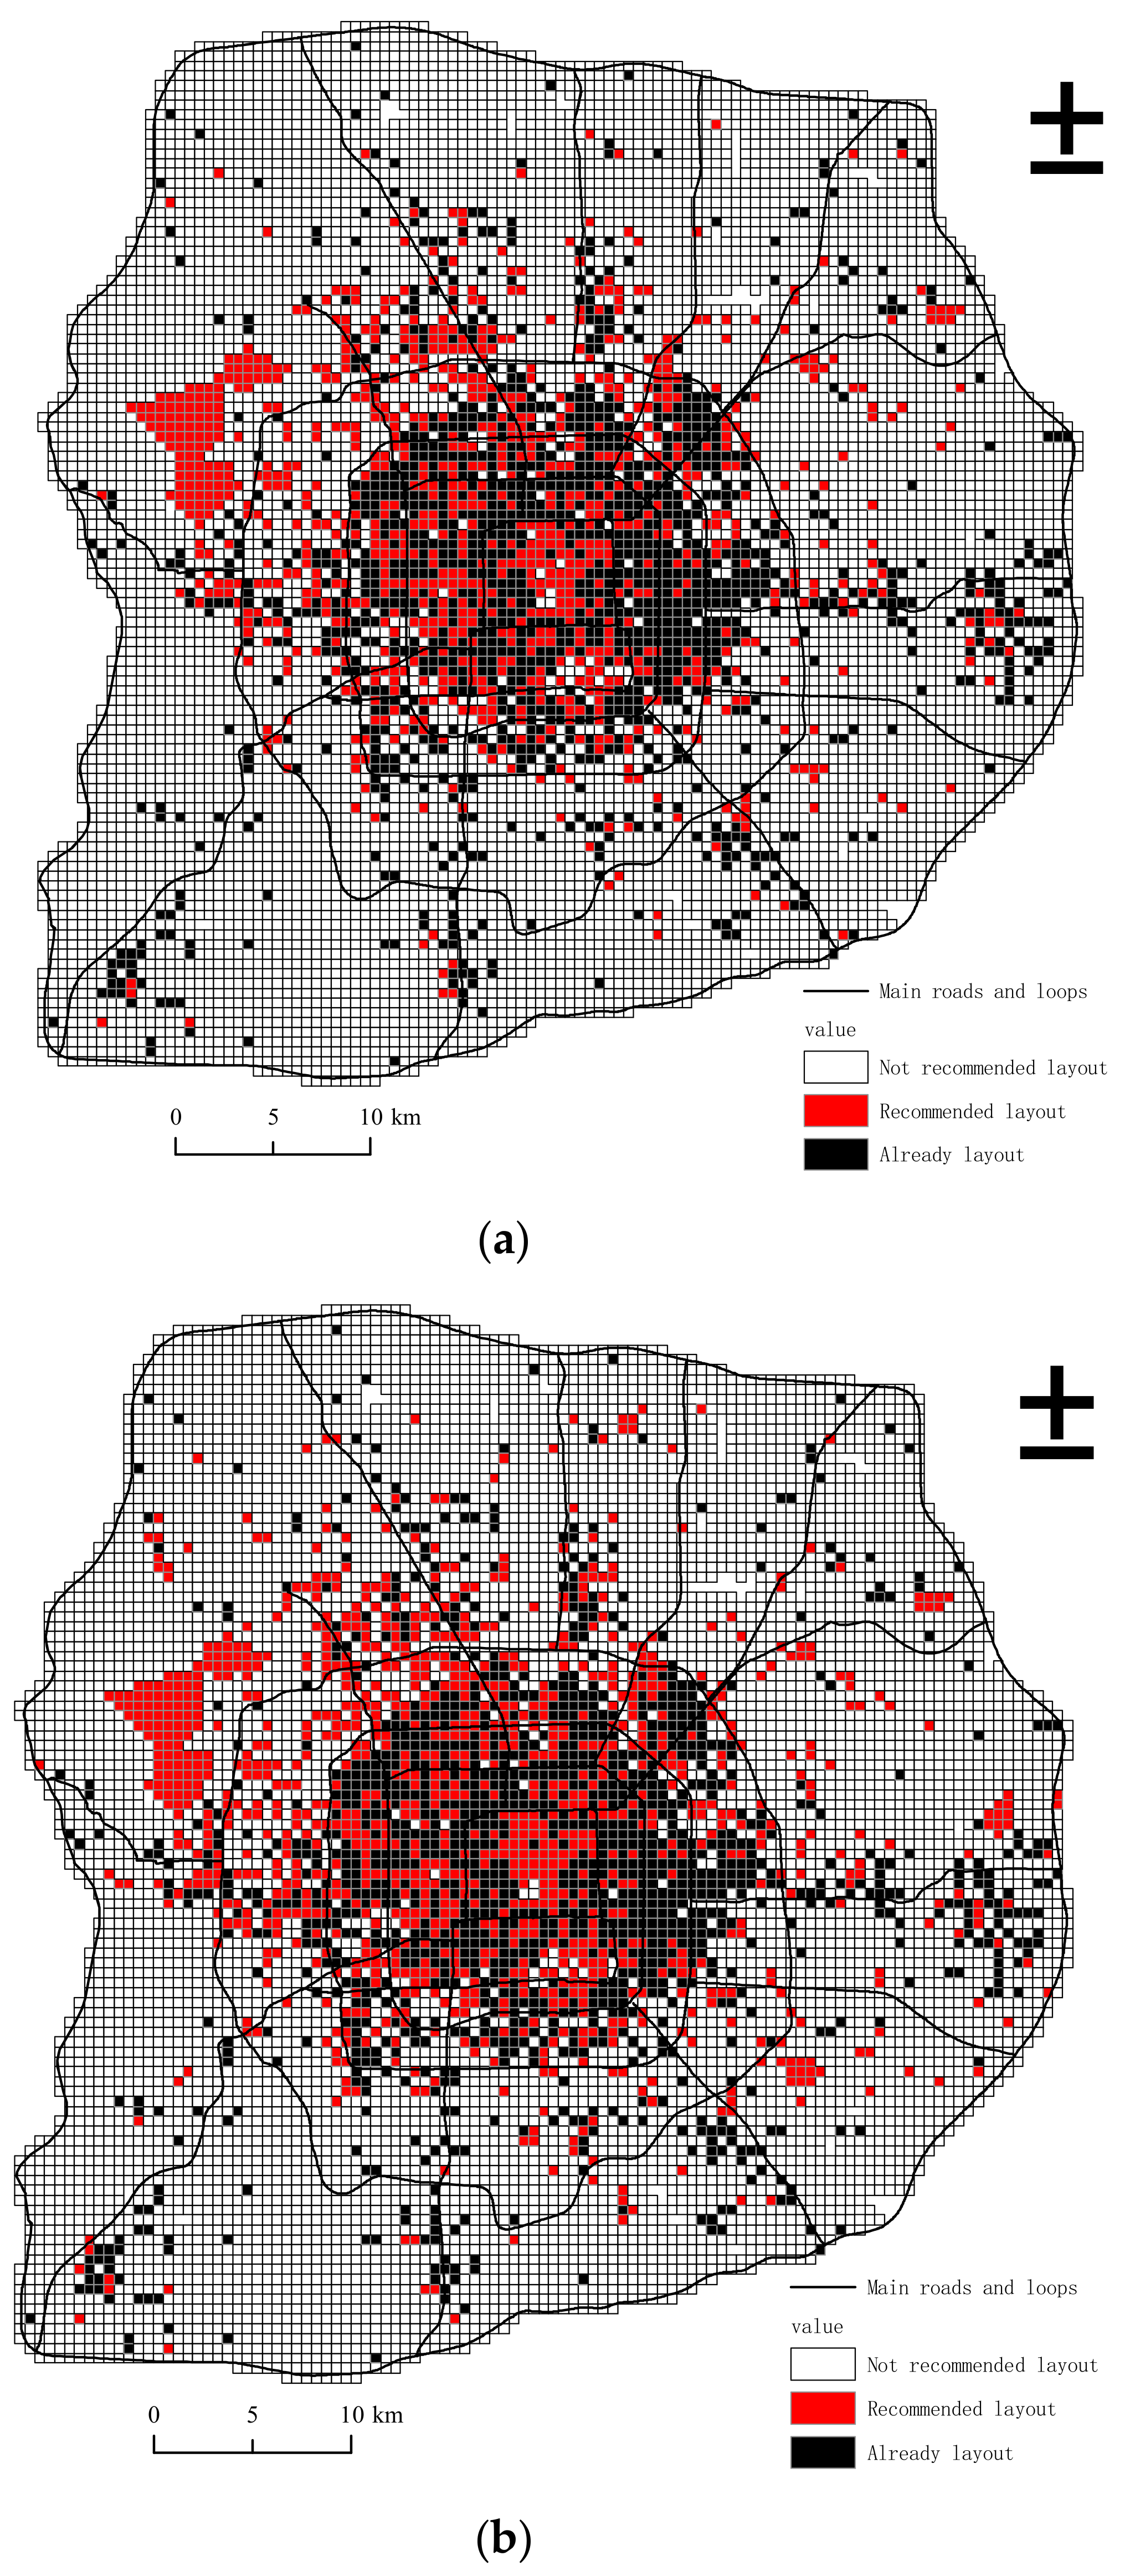
We considered RS = 0.6 as the threshold of the recommended digital signage, that is, when the sample point’s recommendation score is greater than 0.6, the sample point is considered suitable for the placement of digital signage, and the spatial visualization results of digital signage recommendation locations for S-RLA and N-RLA are compared (Figure 12). This plot shows that the areas that are suitable for the layout of digital signage generated by the two algorithms are roughly consistent and generally have a multicenter distribution. The agglomeration areas suitable for the installation of digital signage are mainly distributed in Wangfujing, Financial Street, Beijing West Railway Station, and tourist attractions in the northwest direction of the Fifth Ring Road. However, the two algorithms have slightly different results in some areas, for example, based on Figure 12a, the model recommends that a small amount of digital signage should be concentrated in the north of Tongyan expressway, while in Figure 12b, there is no recommendation to place digital signage in this area. Both models recommend that a small amount of digital signage should be distributed in the southeast direction outside the East Fifth Ring, but the distribution area of Figure 12b is relatively larger than that of Figure 12a. The above situation can be explained by the value of P, since the P of N-RLA is lower than that of S-RLA, and the lower the precision, the higher the probability that the actual negative is predicted to be positive; specifically, the N-RLA recommends more places where digital signage should not be deployed to accommodate digital signage.
6. Discussion and Conclusions
With widespread use of digital signage, the introduction of precise location recommendation methods for digital signage is a problem that urgently needs to be solved by digital signage companies. Location recommendation systems can meet the individual needs of the user and reduce the information overload problem, which has been widely discussed. However, there are still problems in the current location recommendation algorithm. To solve these problems in the traditional location recommendation algorithm and make the layout of digital signage more scientific and reasonable, we propose a location recommendation algorithm of digital signage with multi-source information fusion. We explore elements of commercial activities—such as economic census, population census, average house prices, social network check-in data, and the centrality of traffic networks—which affect the placement of digital signage, and identify the modeling factors of digital signage by using the method of gridded specialization. Four types of clustering algorithms were applied to divide the study area, and the area-divided feature data were used as the data source. Using a kernel density analysis method to obtain the density of digital signage in its surrounding neighborhood, it is then integrated into the location recommendation algorithm to recommend the location of the digital signage. The precision, recall, and F-measure verify the validity of the model. The results of the study are as follows:
- (1)
- In this paper, we provided a location recommendation algorithm with multi-source information fusion, which integrated the spatial features of regional divisions and geographic locations, and used it to achieve the recommendation of digital signage locations that were associated with geographical features, such as the economy and the population.
- (2)
- The precision, recall, and F-measure were considered to evaluate the validity of the model. The evaluation results show that the proposed method has higher rates of precision and recall, which clearly indicates that this method has a better recommendation effect and can further improve the recommendation quality.
- (3)
- Using different clustering algorithms to divide the study area, the division results reveal that the use of the SOM algorithm to divide the study area can significantly improve the precision and recall rate, thereby improving the location recommendation effect and further improving the recommendation quality. The recommended quality of the partitioning model using K-means and DBSCAN in the study area show a certain increase, but the effect is not obvious. While BIRCH was employed to partition the study area, the recommendation quality is poor when the recommendation score is small, and when the recommendation score threshold is large, the recommendation quality of the model increases.
- (4)
- Using this algorithm to recommend the location of Beijing City Sixth Ring for digital signage, the recommendation results indicate that the areas suitable for digital signage are mainly distributed in Wangfujing, Financial Street, Beijing West Railway Station, and the tourist attractions in the northwest direction of the Fifth Ring Road.
This case study has made certain contributions to sustainable development. According to the definition of sustainability, it is achieved in the context development of ecological, economic, and social [63]. If we achieve the sustainable development with abovementioned digital signage location recommendation model coupled with multi-source elements, the location recommendation will be more effectively reach its targets, and this recommendation model can help conduct digital signage management and sustainable advertising without adverse impact on the environment and consumers. We use the clustering algorithm to divide the digital signage in the study area according to the social and economic factors affecting sustainable development. Therefore, the administrator can manage the digital signage and place of advertisements according to the division, thereby improving the management efficiency and reducing the manpower and material resources. Our work provides a scientific method for digital signage site selection, and in this selection process, the economic, social, and other factors that may affect sustainable development were fully considered. The location recommended by this method has a high degree of credibility, which effectively improves the scientific approach to digital signage layout and enhances the utilization rate of advertisements. Compared with traditional manual site selection and advertisement placement, it can save resources and promote the precision, personalization, low carbonization, and sustainable development of advertising. As too many digital signage systems will affect the appearance of the city and waste resources, the next step will be to optimize the research of digital signage deployment to make the digital signage resources more reasonable.
Author Contributions
Conceptualization, X.Z.; Data curation, M.J.; Funding acquisition, X.Z. and D.J.; Investigation, X.Z.; Methodology, J.F.; Project administration, X.Z.; Software, J.F.; Supervision, D.J.; Validation, X.X.; Visualization, X.X.; Writing—original draft, X.X.; Writing—review & editing, C.Y.
Funding
This research was funded by the Research Project of Ministry of Science and Technology of China (grant number 2016YFC1201300); Humanities and Social Science on Youth Fund of the ministry of Education (grant number 15YJCZH224); China Postdoctoral Science Foundation (grant number 2017M620885); Opening Fund of Capital Circulation Industry Research Base (grant number JD-YB-2017-010).
Acknowledgments
We would like to acknowledge Beijing Key Laboratory of Big Data Technology for Food Safety and Key Laboratory of Resources utilization and Environmental Remediation for providing a research grant to conduct this work. We express gratitude to the editors for the editing assistance. Lastly, we would like to thank the reviewers for their valuable comments and suggestions on our paper.
Conflicts of Interest
The authors declare no conflict of interest.
References
- Yarihesar, A.; Badri, S.A.; Pourtaheri, M.; Farajisabokbar, H. Study and defining the process for selecting sustainability evaluation and appraisal indicators for Rual habitats of metropolitan areas case: Tehran metropolitan. Geo. Dev. 2013, 32, 127–148. [Google Scholar]
- Garaus, M.; Wagner, U.; Manzinger, S. Happy grocery shopper: The creation of positive emotions through affective digital signage content. Technol. Forecast. Soc. Chang. 2017, 124, 295–305. [Google Scholar] [CrossRef]
- Ravnik, R.; Solina, F. Audience Measurement of Digital Signage: Quantitative Study in Real-World Environment Using Computer Vision. Interact. Comput. 2013, 25, 218–228. [Google Scholar] [CrossRef] [Green Version]
- Davies, N.; Langheinrich, M.; Jose, R.; Schmidt, A. Open Display Networks: A Communications Medium for the 21st Century. Computer 2012, 45, 58–64. [Google Scholar] [CrossRef]
- Krumm, J. Ubiquitous Advertising: The Killer Application for the 21st Century. IEEE Pervasive Comput. 2010, 10, 66–73. [Google Scholar] [CrossRef]
- Michelis, D.; Muller, J. The Audience Funnel: Observations of Gesture Based Interaction with Multiple Large Displays in a City Center. Int. J. Hum.-Comput. Interact. 2011, 27, 562–579. [Google Scholar] [CrossRef]
- Battiato, S.; Cavallaro, A.; Distante, C. Special issue on “Video analytics for audience measurement in retail and digital signage”. Pattern Recognit. Lett. 2016, 81, 1–2. [Google Scholar] [CrossRef]
- Ullah, F.; Sarwar, G.; Lee, H.; Ryu, W.; Lee, S. Control framework and services scenarios of provisioning N-Screen services in interactive digital signage. Tehnicki Vjesnik 2014, 21, 1321–1328. [Google Scholar]
- Kim, J.S. A Study of Contact Frequency and Consumer Preference for Digital Signage Advertisement. In Proceedings of the 1st International Mega-Conference on Green and Smart Technology (GST 2012)/International Conference on Sensor and Its Applications (SIA 2012), Jeju, South Korea, 28 November–2 December 2012; pp. 181–187. [Google Scholar]
- Yoon, S.; Kim, H. Research into the Personalized Digital Signage Display Contents Information through a Short Distance Indoor Positioning. Int. J. Smart Home 2015, 9, 171–178. [Google Scholar] [CrossRef]
- Ijaz, M.F.; Tao, W.; Rhee, J.; Kang, Y.S.; Alfian, G. Efficient Digital Signage-Based Online Store Layout: An Experimental Study. Sustainability 2016, 8, 511. [Google Scholar] [CrossRef]
- Umor, E.F. The Role of Digital Signage Advertising in Enhancing Patronage among Advertisers and Potential Consumers; the UYO city outlets in perspective. Rev. Commun. Media Stud. 2017, 1, 174–190. [Google Scholar]
- Moon, S.W.; Lee, J.W.; Lee, J.S.; Jung, H.T.; Yoon, K.S. Software-based encoder for UHD digital signage system. In Proceedings of the 16th International Conference on Advanced Communication Technology (ICACT), PyeongChang, South Korea, 16–19 February 2014; pp. 649–652. [Google Scholar]
- Hyun, W.; Huh, M.Y.; Kim, S.H.; Park, J.Y. Standardizations and considerations on P2P-based contents distribution for digital signage service. In Proceedings of the 17th IEEE International Conference on Advanced Communications Technology (ICACT), PyeonhChang, South Africa, 1–3 July 2015; pp. 509–512. [Google Scholar]
- Hossain, M.A.; Islam, A.; Le, N.T.; Lee, Y.T.; Lee, H.W.; Jang, Y.M. Performance analysis of smart digital signage system based on software-defined IoT and invisible image sensor communication. Int. J. Distrib. Sens. Netw. 2016, 12, 1–14. [Google Scholar] [CrossRef]
- Khue, T.D.; Binh, N.T.; Chang, W.; Kim, C.; Chung, S.T. Design and implementation of MEAN stack-based scalable real-time Digital Signage System. In Proceedings of the 8th International Conference of Information and Communication Technology for Embedded Systems (IC-ICTES), Chonburi, Thailand, 7–9 May 2017. [Google Scholar]
- Chen, Y. Optimization Design and Implementation of Multimedia Information Publishing System; Fudan University: Shanghai, China, 2013. (In Chinese) [Google Scholar]
- Lian, D.F.; Zheng, K.; Ge, Y.; Cao, L.B.; Chen, E.H.; Xie, X. GeoMF++: Scalable Location Recommendation via Joint Geographical Modeling and Matrix Factorization. ACM Trans. Inf. Syst. 2018, 36, 1–29. [Google Scholar] [CrossRef]
- Son, J.; Kim, S.B. Content-based filtering for recommendation systems using multiattribute networks. Expert Syst. Appl. 2017, 89, 404–412. [Google Scholar] [CrossRef]
- Zenebe, A.; Norcio, A.F. Representation, similarity measures and aggregation methods using fuzzy sets for content-based recommender systems. Fuzzy Sets Syst. 2009, 160, 76–94. [Google Scholar] [CrossRef]
- Ma, T.H.; Guo, L.A.; Tang, M.L.; Tian, Y.; Al-Rodhaan, M.; Al-Dhelaan, A. Collaborative Filtering Recommendation Algorithm Based on Hierarchical Structure and Time Awareness. IEICE Trans. Inf. Syst. 2016, E99, 1512–1520. [Google Scholar] [CrossRef]
- Lin, Z.J. An empirical investigation of user and system recommendations in e-commerce. Decis. Support Syst. 2014, 68, 111–124. [Google Scholar] [CrossRef]
- Herlocker, J.L.; Konstan, J.A.; Loren, J.; Terveen, G.; Riedl, T. Collaborative filtering recommender systems. ACM Trans. Inf. Syst. 2004, 22, 5–53. [Google Scholar] [CrossRef]
- Lian, D.F.; Ge, Y.; Zhang, F.Z.; Yuan, N.J.; Xie, X.; Zhou, T.; Rui, Y. Content-Aware Collaborative Filtering for Location Recommendation based on Human Mobility Data. In Proceedings of the IEEE International Conference on Data Mining (ICDM), Atlantic City, NJ, USA, 14–17 November 2015; pp. 261–270. [Google Scholar]
- Agarwal, D.; Chen, B.C. Regression-based latent factor models. In Proceedings of the 15th ACM SIGKDD International Conference on Knowledge Discovery and Data Mining, Paris, France, 28 June–1 July 2009; pp. 19–27. [Google Scholar]
- Rendle, S. Factorization Machines with libFM. ACM Trans. Intell. Syst. Technol. 2012, 3, 1–22. [Google Scholar] [CrossRef]
- Lu, Z.; Wang, H.; Mamoulis, N.; Tu, W.T.; Cheung, D.W. Personalized location recommendation by aggregating multiple recommenders in diversity. Geoinformatica 2017, 21, 1–26. [Google Scholar] [CrossRef]
- Logesh, R.; Subramaniyaswamy, V. Learning Regency and Inferring Associations in Location Based Social Network for Emotion Induced Point-of-Interest Recommendation. J. Inf. Sci. Eng. 2017, 33, 1629–1647. [Google Scholar]
- Zhou, D.Q.; Wang, X. Probabilistic Category-based Location Recommendation Utilizing Temporal Influence and Geographical Influence. In Proceedings of the IEEE International Conference on Data Science & Advanced Analytics, Shanghai, China, 30 October–1 November 2014; pp. 115–121. [Google Scholar]
- Cai, L.; Xu, J.; Liu, J.; Pei, T. Integrating spatial and temporal contexts into a factorization model for POI recommendation. Int. J. Geogr. Inf. Sci. 2018, 32, 524–546. [Google Scholar] [CrossRef]
- Feitosa, R.M.; Labidi, S.; dos Santos, A.L.; Santos, N. Social Recommendation in Location-Based Social Network using Text Mining. In Proceedings of the 4th International Conference on Intelligent Systems, Modelling and Simulation (ISMS), Bangkok, Thailand, 29–31 January 2013; pp. 67–72. [Google Scholar]
- Zhang, A.X.; Noulas, A.; Scellato, S.; Mascolo, C. Hoodsquare: Modeling and Recommending Neighborhoods in Location-based Social Networks. In Proceedings of the ASE/IEEE International Conference on Social Computing (SocialCom), Washington, DC, USA, 8–14 September 2013; pp. 69–74. [Google Scholar]
- Li, X.; Xu, G.D.; Chen, E.H.; Zong, Y. Learning recency based comparative choice towards point-of-interest recommendation. Expert Syst. Appl. 2015, 42, 4274–4283. [Google Scholar] [CrossRef]
- Karatzoglou, A.; Lamp, S.C.; Beigl, M. Matrix Factorization on Semantic Trajectories for Predicting Future Semantic Locations. In Proceedings of the 13th IEEE International Conference on Wireless and Mobile Computing, Networking and Communications (WiMob), Rome, Italy, 9–11 October 2017; pp. 724–730. [Google Scholar]
- Cui, G.; Luo, J.; Wang, X. Personalized travel route recommendation using collaborative filtering based on GPS trajectories. Int. J. Digit. Earth 2018, 11, 284–307. [Google Scholar] [CrossRef]
- Wang, F.; Meng, X.W.; Zhang, Y.J. An Adaptive User Preferences Elicitation Scheme for Location Recommendation. Chin. J. Electron. 2016, 25, 943–949. [Google Scholar] [CrossRef]
- Xin, M.J.; Zhang, Y.H.; Li, S.X.; Zhou, L.Y.; Li, W.M. A Location-Context Awareness Mobile Services Collaborative Recommendation Algorithm Based on User Behavior Prediction. Int. J. Web. Serv. Res. 2017, 14, 45–66. [Google Scholar] [CrossRef]
- Bao, J.; Zheng, Y.; Wilkie, D.; Mokbel, M. Recommendations in location-based social networks: A survey. Geoinformatica 2015, 19, 525–565. [Google Scholar] [CrossRef]
- Levandoski, J.J.; Sarwat, M.; Eldawy, A.; Mokbel, M.F. LARS: A Location-Aware Recommender System. In Proceedings of the 28th IEEE International Conference on Data Engineering (ICDE), Washington, DC, USA, 1–5 April 2012; pp. 450–461. [Google Scholar]
- Hu, B.; Ester, M. Social Topic Modeling for Point-of-Interest Recommendation in Location-Based Social Networks. In Proceedings of the 14th IEEE International Conference on Data Mining (IEEE ICDM), Shenzhen, China, 14–17 December 2014; pp. 845–850. [Google Scholar]
- Kefalas, P.; Symeonidis, P.; Manolopoulos, Y. A Graph-Based Taxonomy of Recommendation Algorithms and Systems in LBSNs. IEEE Trans. Knowl. Data Eng. 2016, 28, 604–622. [Google Scholar] [CrossRef]
- Melita, R.C. Open Space Evaluation Methodology and Three Dimensional Evaluation Model as a Base for Sustainable Development Tracking. Sustainability 2015, 7, 13690–13712. [Google Scholar] [Green Version]
- Dennis, C.; Brakus, J.J.; Gupta, S.; Alamanos, E. The effect of digital signage on shoppers’ behavior: The role of the evoked experience. J. Bus. Res. 2014, 67, 2250–2257. [Google Scholar] [CrossRef] [Green Version]
- Roggeveen, A.L.; Nordfält, J.; Grewal, D. Do digital displays enhance sales? Role of retail format and message content. J. Retail. 2016, 92, 122–131. [Google Scholar] [CrossRef]
- Mikalef, P.; Pateli, A. Information technology-enabled dynamic capabilities and their indirect effect on competitive performance: Findings from PLS-SEM and fsQCA. J. Bus. Res. 2017, 70, 1–16. [Google Scholar] [CrossRef]
- Beijing Municipal Bureau of Statistics. Beijing Statistical Yearbook 2013; China Statistics Press: Beijing, China, 2013. (In Chinese) [Google Scholar]
- Xu, R.; Wunsch, D. Survey of clustering algorithms. IEEE Trans. Neural Netw. 2005, 16, 645–678. [Google Scholar] [CrossRef] [PubMed]
- Ferrari, D.C.; de Castro, L.N. Clustering algorithm selection by meta-learning systems: A new distance-based problem characterization and ranking combination methods. Inf. Sci. 2015, 301, 181–194. [Google Scholar] [CrossRef]
- Hartigan, J.A.; Wong, M.A. Algorithm AS 136: A K-Means Clustering Algorithm. J. R. Stat. Soc. 1979, 28, 100–108. [Google Scholar] [CrossRef]
- Huang, J.Z.X.; Ng, M.K.; Rong, H.Q.; Li, Z.C. Automated variable weighting in k-means type clustering. IEEE Trans. Pattern Anal. Mach. 2005, 27, 657–668. [Google Scholar] [CrossRef] [PubMed] [Green Version]
- Prasad, P.K.; Rangan, C.P. Privacy preserving BIRCH algorithm for clustering over arbitrarily partitioned Databases. In Proceedings of the 3rd International Conference on Advanced Data Mining and Applications, Harbin, China, 6–8 August 2007. [Google Scholar]
- Dong, J.; Wang, F.; Yuan, B. Accelerating BIRCH for Clustering Large Scale Streaming Data Using CUDA Dynamic Parallelism. In Proceedings of the 14th International Conference on Intelligent Data Engineering and Automated Learning (IDEAL), Hefei, China, 20–23 October 2013; pp. 409–416. [Google Scholar]
- Shen, J.; Hao, X.P.; Liang, Z.Y.; Liu, Y.; Wang, W.G.; Shao, L. Real-time Superpixel Segmentation by DBSCAN Clustering Algorithm. IEEE Trans. Image Process. 2016, 25, 5933–5942. [Google Scholar] [CrossRef] [PubMed]
- Vatanen, T.; Osmala, M.; Raiko, T.; Lagus, K.; Sysi-Aho, M.; Oresic, M.; Honkela, T.; Landesmaki, H. Self-organization and missing values in SOM and GTM. Neurocomputing 2015, 147, 60–70. [Google Scholar] [CrossRef]
- Cottrell, M.; Fort, J.C.; Pagès, G. Theoretical aspects of the SOM algorithm. Neurocomputing 2007, 21, 119–138. [Google Scholar] [CrossRef]
- De Amorim, R.C.; Hennig, C. Recovering the number of clusters in data sets with noise features using feature rescaling factors. Inf. Sci. 2015, 324, 126–145. [Google Scholar] [CrossRef] [Green Version]
- Zhang, Y.H.; Hu, Q.P.; Zhang, W.S.; Liu, J. A Novel Bayesian Network Structure Learning Algorithm based on Maximal Information Coefficient. In Proceedings of the IEEE 5th International Conference on Advanced Computational Intelligence (ICACI), Nanjing, China, 18–20 October 2012; pp. 862–867. [Google Scholar]
- Elgammal, A.; Duraiswami, R.; Harwood, D.; Davis, L.S. Background and foreground modeling using nonparametric kernel density estimation for visual surveillance. Proc. IEEE 2002, 90, 1151–1163. [Google Scholar] [CrossRef] [Green Version]
- Lele, S.; Richtsmeier, J.T. Euclidean distance matrix analysis: A coordinate-free approach for comparing biological shapes using landmark data. Am. J. Phys. Anthropol. 1991, 86, 415–427. [Google Scholar] [CrossRef] [PubMed]
- Liu, N.H. Comparison of content-based music recommendation using different distance estimation methods. Appl. Intell. 2013, 38, 160–174. [Google Scholar] [CrossRef]
- Li, D.; Lv, Q.; Xie, X.; Shang, L.; Xia, H.H.; Lu, T.; Gu, N. Interest-based real-time content recommendation in online social communities. Knowl.-Based Syst. 2012, 28, 1–12. [Google Scholar] [CrossRef]
- Huang, Y.J.; Powers, R.; Montelione, G.T. Protein NMR recall, precision, and F-measure scores (RPF scores): Structure quality assessment measures based on information retrieval statistics. J. Am. Chem. Soc. 2005, 127, 1665–1674. [Google Scholar] [CrossRef] [PubMed]
- Mofidi, C.M.; Alijanpour, A.; Barani, H.; Motamedi, J.; Azadi, H.; Van Passel, S. Economic sustainability assessment in semi-steppe rangelands. Sci. Total Environ. 2018, 637, 112–119. [Google Scholar] [CrossRef] [PubMed]
Figure 1.
Digital signage basic data processing flow.

Figure 2.
Digital signage basic data.

Figure 3.
Digital signage location factor data processing flow.

Figure 4.
Flow chart of digital signage location recommendation.

Figure 5.
Digital signage recommendation process.

Figure 6.
Clustering quality of four algorithms under different parameters ((a) BIRCH; (b) DBSCAN; (c) K-means; (d) SOM).
Figure 6.
Clustering quality of four algorithms under different parameters ((a) BIRCH; (b) DBSCAN; (c) K-means; (d) SOM).

Figure 7.
Comparison of four algorithms Calinski-Harabaz values.

Figure 8.
Kernel density of digital signage sample point.

Figure 9.
Comparison of the precision rate in different algorithms.

Figure 10.
Comparison of the recall rate in different algorithms.

Figure 11.
Comparison of the F-measure in different algorithms.

Figure 12.
Spatial visualization results of digital signage recommendation locations ((a) S-RLA; (b) N-RLA).
Figure 12.
Spatial visualization results of digital signage recommendation locations ((a) S-RLA; (b) N-RLA).


Table 1.
Parameters of the four clustering algorithms
| Clustering Algorithm | Parameter | Defaults |
|---|---|---|
| BIRCH | branching_factor | 50 |
| threshold | 0.5 | |
| DBSCAN | eps | 0.5 |
| min_samples | 5 | |
| K-means | K | None |
| SOM | neurons | None |
| rate | None |
Table 2.
Comparison of precision and recall for different algorithms at RS = 0.6.
| Algorithm | Precision Rate | Recall Rate |
|---|---|---|
| S-RLA | 0.7797 | 0.8456 |
| D-RLA | 0.7704 | 0.8353 |
| K-RLA | 0.7678 | 0.8200 |
| B-RLA | 0.7262 | 0.8059 |
| N-RLA | 0.7413 | 0.7619 |
© 2018 by the authors. Licensee MDPI, Basel, Switzerland. This article is an open access article distributed under the terms and conditions of the Creative Commons Attribution (CC BY) license (http://creativecommons.org/licenses/by/4.0/).
Share and Cite
MDPI and ACS Style
Xie, X.; Zhang, X.; Fu, J.; Jiang, D.; Yu, C.; Jin, M. Location Recommendation of Digital Signage Based on Multi-Source Information Fusion. Sustainability 2018, 10, 2357. https://doi.org/10.3390/su10072357
AMA Style
Xie X, Zhang X, Fu J, Jiang D, Yu C, Jin M. Location Recommendation of Digital Signage Based on Multi-Source Information Fusion. Sustainability. 2018; 10(7):2357. https://doi.org/10.3390/su10072357
Chicago/Turabian StyleXie, Xiaolan, Xun Zhang, Jingying Fu, Dong Jiang, Chongchong Yu, and Min Jin. 2018. "Location Recommendation of Digital Signage Based on Multi-Source Information Fusion" Sustainability 10, no. 7: 2357. https://doi.org/10.3390/su10072357
Note that from the first issue of 2016, this journal uses article numbers instead of page numbers. See further details here.