Efficiency of Government-Sponsored R&D Projects: A Metafrontier DEA Approach

1
Technology Management, Economics, and Policy Graduate Program, Seoul National University, Gwanak-ro 1, Gwanak-gu, Seoul 151-742, Korea
2
Department of Biomedical Convergence, College of Medicine, Chungbuk National University, Chungdae-ro 1, Seowon-gu, Cheongju-si, Chungbuk 28644, Korea
*
Author to whom correspondence should be addressed.
Sustainability 2018, 10(7), 2316; https://doi.org/10.3390/su10072316
Submission received: 13 June 2018
/
Revised: 30 June 2018
/
Accepted: 2 July 2018
/
Published: 4 July 2018
(This article belongs to the Section Economic and Business Aspects of Sustainability)
Abstract
:Government R&D investments are steadily increasing with the perception that R&D plays an important role in technological innovation and sustainable economic growth. In particular, because biotechnology is recognized as one of the next growth engines, the Korean government has recently increased their investment in biotechnology R&D. However, careful analysis of the efficiency of government-sponsored R&D projects is still lacking. In this paper, we measured the technical efficiency and technology gap ratio to investigate the efficiency of Korean government-sponsored R&D projects of 16 sub-biotechnologies from 2007 to 2013 using a metafrontier Data Envelopment Analysis approach. There was no improvement in overall efficiency between 2007 and 2013. Biochip development technology has been the most efficient sub-biotechnology field and the least efficient fields have been biotechnology product safety and efficacy assessment technology. Medical science and engineering is the closest to optimal production technology among sub-biotechnologies. The efficiency of universities and government-funded research institutes is high, while the efficiency of companies is relatively low. The results suggest that the government should improve the R&D planning process and establish a customized R&D investment strategy that considers the characteristics of technologies and the seven organization types of R&D conductors to increase R&D efficiency.
1. Introduction
Government investment in R&D is an important factor in technological innovation. If the R&D investment of a private enterprise is not done properly, the importance is higher. R&D is also one of the key factors contributing to sustainable economic growth. Therefore, implementing a technology innovation strategy to accelerate R&D has become one of the government’s most important industrial policies. Since R&D generally involves market failure, government funding could increase R&D activities and move them closer to the social optimum [1]. In addition, R&D intensity and subsidies have positive correlations with the probability of innovation [2], and government-sponsored R&D creates additional innovations for beneficiaries [3,4,5]. Thus, government grants that encourage private R&D activities are common in many OECD countries [6]. The Korean government has continuously increased its R&D investment. Korea’s R&D expenditure as a percent of gross domestic product (GDP) has increased from 2.26% in 1996 to 4.22% in 2015, the highest level in the world [7]. As a result, the quantitative growth of R&D investment and the socioeconomic impact and efficiency of R&D activities are attracting great attention. If it is difficult to increase the investment quantitatively because of realistic reasons, such as resource constraints, further efforts to improve R&D efficiency are required. Understanding the nature of the efficiency of R&D is important for the establishment of policies to improve resource allocation [8]. The Korean government considers biotechnology to be one of the next growth engines and has been increasing its investment in recent years. Thus, the efficiency of government-funded R&D is becoming increasingly important in Korea.
Although there have been some studies on the efficiency of government-sponsored R&D projects, in-depth analyses of government-sponsored biotechnology R&D projects are difficult to find. Therefore, this study attempts to analyze the overall efficiency of government-sponsored biotechnology R&D projects in Korea. Efficiency analysis methodologies typically include Data Envelopment Analysis (DEA), a nonparametric approach, and stochastic frontier analysis (SFA), a parametric approach. DEA does not need to explicitly assume a functional relationship between inputs and outputs, but rather, empirically estimates efficient boundaries based on actual input and output data and then measures efficiency based on distances from the boundaries. DEA is also advantageous in dealing with multiple inputs and outputs. One of the most notable DEA study fields in recent years is the metafrontier DEA approach. Basically, the production frontier is used to measure the efficiency level of decision-making units (DMUs). The metaproduction frontier is the envelope of the production frontier of different groups [9]. Therefore, the metafrontier approach is widely used for efficiency analyses between groups operating under different technologies [10,11,12,13]. Generally, in the metafrontier approach, the group frontier and the metafrontier are obtained, and the technology gap ratio (TGR) is calculated as the distance between the group frontier and the metafrontier. TGR represents the efficiency gap between the metafrontier and the specific group frontier.
Therefore, our research question is to obtain the efficiencies of the government-sponsored R&D projects under the group frontier and metafrontier, respectively, and to make efficiency comparisons across groups of R&D projects. In this paper, we apply a metafrontier DEA approach to estimate the efficiency of Korean government-sponsored biotechnology R&D projects between 2007 and 2013. We obtain the efficiency scores of the R&D projects of 16 sub-biotechnologies under different group frontiers and the metafrontier and calculate TGRs. The resulting TGR values provide an opportunity to recognize which sub-biotechnology R&D field is relatively efficient. It is also meaningful to understand the changes in efficiency during this period, because the Korean government’s investment in biotechnology R&D has increased significantly. We present the efficiency results of 16 sub-biotechnologies by time series and by R&D organization type. This shows the efficiency trends of 16 sub-biotechnologies and the differences in efficiency by R&D organization type. Based on the analysis results, our study has implications for government R&D policy. To improve the efficiency of government-sponsored R&D projects, careful monitoring, clear outcome goal setting, and customized R&D investment planning are needed. Our study is the first application of a metafrontier DEA approach to evaluate the technical efficiency of government-sponsored biotechnology R&D projects and so, provides a novel framework for identifying the relative efficiency of R&D projects of 16 sub-biotechnologies. Thus, this paper enriches the DEA theory and its applications.
The rest of this paper is structured as follows. In Section 2, we review the literature regarding the efficiency of R&D activities and the metafrontier DEA approach. We describe the data, variables, and analytic model used in the empirical analysis in Section 3, which is followed by the presentation of results in Section 4. We discuss the empirical results and methodology in Section 5. Finally, in Section 6, we conclude the study with the implications, limitations, and future research recommendations of the study.
2. Literature Review
2.1. Efficiency of R&D Activities
As the number of government R&D investments increase, resource allocation causes increased attention on government R&D policies [14]. Thus, it is important to understand the characteristics of R&D efficiency when establishing policies to improve resource allocation [8]. Efficiency can generally be defined as the ratio of output to input, which is a concept of technical efficiency that is often used in a narrow sense. When we compare efficiency and effectiveness, effectiveness is a concept that focuses on how much we have achieved a planned goal with a given input, whereas efficiency is a measure of how well the input resources are used to achieve a given goal, that is, the concept related to cost reduction. If a DMU achieves a given goal with minimal resource input, it can be considered to be a DMU that achieves technical efficiency. In this context, research regarding R&D efficiency using DEA has been carried out on various levels, including the project, program, company, government-funded research institutes (GRIs), and country level. Each level provides various implications. At the national level, Rousseau and Rousseau [15] used DEA to analyze the efficiency of 14 European countries. The inputs were GDP, active population, and R&D expenditure, and the outputs were publications and patents. Lee and Park [16] measured the R&D efficiency of 27 Asian countries using DEA instead of TFP. Their results showed that Singapore had relatively high efficiency and that China, Korea, and Taiwan were relatively inefficient. Wang and Huang [8] compared the R&D efficiency of 30 countries using a three-step DEA approach. The inputs were R&D investment and manpower, and the outputs were publications and patents. The analysis showed that more than half of the countries’ R&D activities were not efficient. Sharma and Thomas [17] estimated the relative efficiency of R&D processes in 22 developed and developing countries using DEA. Under the constant returns to scale (CRS) model, Japan, Korea, and China were efficient, but Japan, Korea, China, India, Slovenia, and Hungary were efficient under the variable returns to scale (VRS) model. The improvement of inefficiency of using R&D resources implies the potential for national development and growth.
At the organizational level, such as the company or GRI level, Hashimoto and Haneda [18] used DEA and the Malmquist index to analyze the R&D efficiency of 10 Japanese pharmaceutical companies between 1983 and 1992. They showed that the efficiency of Japanese pharmaceutical companies continued to deteriorate during this period. Lee and Lee [19] analyzed the efficiency of 10 Korean GRIs, which played an important role in national R&D. They used a bottom-up DEA approach. Their findings confirmed that the proposed method can be used to establish and implement national R&D policies by effectively assessing GRI performance. Jang et al. [20] investigated the changes in efficiency of the world’s 49 leading R&D companies between 2007 and 2013 using DEA and the Malmquist index. During the analysis period, the overall R&D efficiency of the companies declined slightly. Han et al. [21] estimated the R&D efficiency of China’s high-tech industry between 1998 and 2009 using DEA. The R&D efficiency did not increase from 1998 to 2009 despite a rapid increase in R&D expenditure. This study suggests that inefficiency of the technology commercialization process may be the cause.
On the other hand, at the program or project level, Hsu and Hsueh [22] investigated the efficiency of 110 government-sponsored R&D projects in Taiwan through a three-step DEA approach including Tobit regression. Their findings showed that public subsidy of R&D affects the technical efficiency of government-sponsored R&D projects. The implication of their result is that a subsidy cap on the R&D budget of a receiving company must be set to avoid inefficient use of public funds. Lee et al. [23] measured the efficiency of six Korean national R&D programs using DEA and compared the efficiency results. Park and Choi [24] used DEA to measure the efficiency of biotechnology and nanotechnology projects included in the four different programs supported by the Korean government. The average efficiency of nanotechnology was higher than that of biotechnology. Park [25] analyzed the change in efficiency and productivity of government grant recipients for 6990 Korean national R&D programs from 2010 to 2012 using DEA and the Malmquist index. Productivity continued to increase during this period, but the rate of growth declined every year. Lee and Cho [26] analyzed the efficiency of the translational research program among health technologies between 2005 and 2009 using DEA and the Malmquist index. They found that the productivity of six disease groups increased and that of the remaining six disease groups decreased. As above, there are many existing studies on R&D efficiency, but most of the R&D efficiency studies have been conducted under the assumption of a group frontier, and research regarding R&D efficiency using a metafrontier approach is hard to find.
2.2. Metafrontier DEA Approach
Since Hayami and Ruttan [27] introduced the meta-production function, there have been studies on the metafrontier approach for efficiency and productivity analysis [9,11,12,28,29,30,31,32]. Previously, efficiency was usually analyzed by independently estimating each group production frontier without taking differences in environmental factors, such as technology, economies of scale and region, etc. into account. However, this approach can cause estimated efficiency results to be biased by not considering the environmental heterogeneity among the groups. The metafrontier can be considered to cover all possible frontiers that can simply arise from heterogeneity between groups [33,34]. Therefore, O’Donnell, Rao and Battese [9] introduced a metafrontier approach that allows heterogeneous groups to be evaluated based on their distance from a common frontier to settle the heterogeneity in different production opportunities.
The major studies of efficiency analysis using the metafrontier DEA approach are as follows. O’Donnell, Rao and Battese [9] introduced a metafrontier SFA and DEA approach to compare the efficiencies of firms which were classified into different groups. As an empirical study, they presented the estimated technical efficiency of 97 countries which were classified into four different regional groups using agricultural sector data. Sala-Garrido, Molinos-Senante and Hernández-Sancho [29] used a metafrontier DEA approach to analyze the efficiency of 99 Spanish wastewater treatment plants (WWTPs) which were divided into four different alternative technology groups. A comparison of the calculated TGRs revealed that efficiency was optimal for WWTPs operating with activated sludge compared to other technologies. Tiedemann, Francksen and Latacz-Lohmann [30] used a nonparametric metafrontier approach to evaluate the efficiency score of field players in football. An analysis of German Bundesliga football player data from 2002/2003 to 2008/2009 showed that the metafrontier approach can be used to identify the optimal play position of a football player and to quantify the performance improvement from moving to that position. Assaf, Barros and Josiassen [11] measured the efficiency of 78 hotels in Taiwan between 2004 and 2008 using a metafrontier bootstrap method. Their findings showed that there are significant differences in hotel efficiency depending on classifications, such as size and ownership. Chen, Lai and Piboonrungroj [12] adopted a metafrontier DEA approach to compare efficiency differences between private and public airports using 24 Taiwanese airports’ data between 2001 and 2013. Their analysis showed that privately owned airports had better technological efficiency than public airports.
This study has two main contributions. First, we obtain technical efficiencies under a group frontier and under a metafrontier and compare them with each other. Second, although there have been many studies of metafrontier DEA approaches, there are still few studies that have used metafrontier approaches to analyze R&D efficiency. In this study, we apply the metafrontier DEA to evaluate the efficiency of Korean government-sponsored biotechnology R&D projects.
3. Methodology
In this section, we describe the metafrontier DEA model, a nonparametric approach. Additionally, we apply it to an efficiency analysis of government-sponsored biotechnology R&D projects. First, the data collection is explained, and selected variables used for analysis are described.
3.1. Analytic Model
A typical efficiency measurement methodology can be roughly divided into DEA (as a nonparametric approach) and SFA (as a parametric approach). SFA is a method of measuring the production efficiency by estimating a frontier function using a quantitative econometric method. DEA is a kind of linear programming method used for evaluating the relative efficiency of comparable DMUs. Charnes et al. [35] first introduced DEA as a measure of technical efficiency derived from linear programming. Since then, DEA has become one of the most widely used methods for measuring efficiency. DEA has the advantage of being able to handle multiple input and output elements without requiring the assumption of a functional relationship between input and output. Additionally, input and output elements can have different units of measurement in DEA. Since R&D is generally associated with a large number of inputs and outputs, DEA is more appropriate for measuring the efficiency of R&D. Charnes, Cooper and Rhodes [35] used the BCC model which assumes CRS. Banker et al. [36] extended this to the CCR model which takes VRS into account. The CCR model under CRS is used with the assumption that the DMU is operating at the optimal production scale, and the BCC model under VRS is a suitable model when the optimal production activity is not performed under incomplete competition due to various constraints. In this study, we used the BCC model because it is appropriate to consider that government-sponsored R&D projects are in VRS. DEA models are divided into input-oriented models and output-oriented models depending on the purpose. Input-oriented models minimize the input while keeping the output constant, while output-oriented models maximize the output while keeping the input constant. It is desirable to use output-oriented models for R&D projects, because R&D projects intend to increase the output using limited resources. Therefore, in this study, we used the output-oriented BCC model to measure the relative efficiency of government-sponsored R&D projects.
In the analysis of the efficiency of government-sponsored R&D projects, most of the studies so far have been analyzed under the same technical conditions. However, efficient frontiers of R&D projects in groups with different characteristics of technology may have different characteristics [9,34,37]. Thus, the technical efficiency of an R&D project under a specific technology cannot be directly compared with one existing under another technology. This is because efficiency is a relative score for each frontier in each group. In other words, existing studies comparing production efficiencies do not distinguish between the various technologies covered by R&D projects. Therefore, we applied the concept of a metafrontier production function, as proposed by O’Donnell, Rao and Battese [9], to measure the efficiency of government-sponsored R&D projects dealing with various technologies. The Malmquist and Hicks-Moorsteen indexes as well as metafrontier DEA can be used to measure and compare efficiency across different technology groups [38]. The Malmquist and Hicks-Moorsteen indexes usually represent a dynamic change in the increment of inputs relative to the increase in outputs. However, in this paper, we are interested in the efficiency of government-sponsored R&D projects. That is, the goal of this paper is to estimate the technical efficiency scores and technology gap ratio for the sub-technologies and then to compare the efficiency across sub-technologies. Therefore, we used the metafrontier DEA approach in our study.
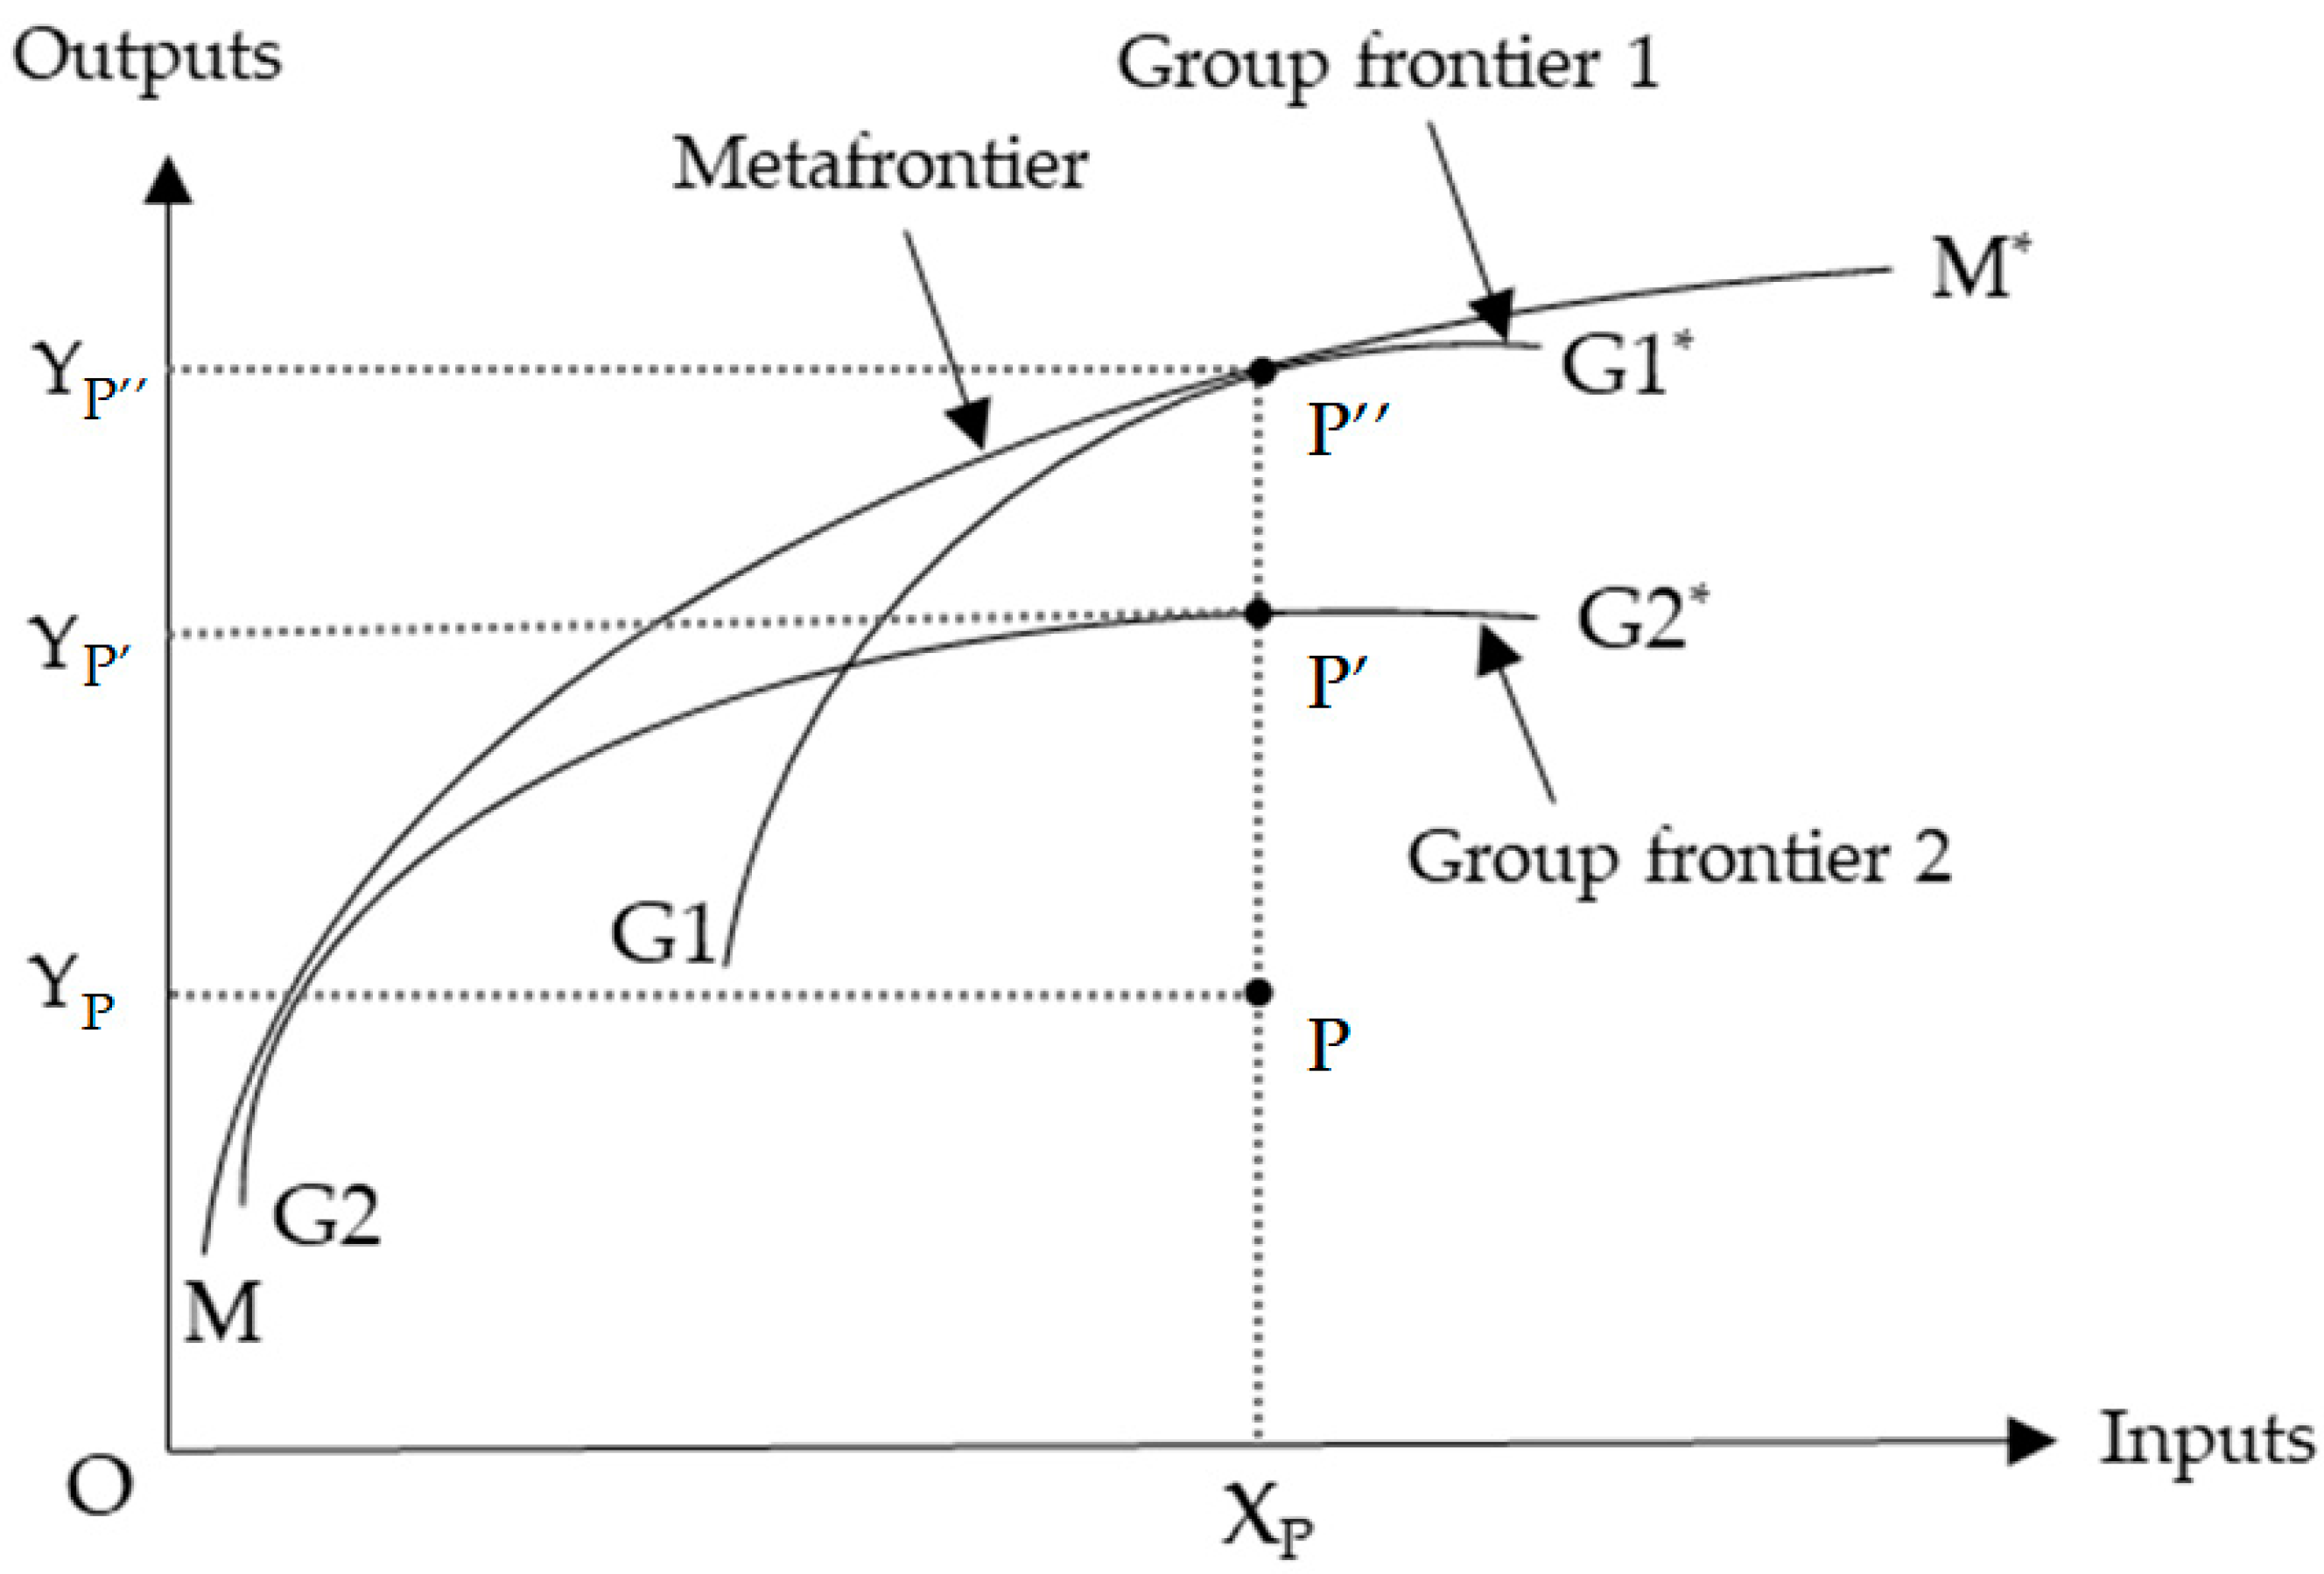
The production frontier refers to the maximum achievable output from the input level which reflects the current level of technology. If a DMU is technically efficient, it operates on the production frontier, and if it is technically ineffective, it operates below the production frontier. If the technology can be divided into K sub-technologies, the kth group frontier means the boundary of the kth sub-technology group’s output sets [9]. The metafrontier refers to the frontier which envelops the group of frontiers, as shown in Figure 1. In this study, we analyzed the efficiency difference between 16 different sub-technology groups of Korean government-sponsored biotechnology R&D projects as a case study. To estimate the metafrontier for government-sponsored biotechnology R&D projects, we pooled project data across all sub-biotechnologies. In this way, the convex metafrontier () was obtained, as shown in Figure 1. As shown in Figure 1, when two separate DEA efficiency analyses were performed, the group frontiers (. and . ) were obtained. Each group frontier represented a frontier specific to a certain technology. A metafrontier was obtained by pooling the data of the two technologies and repeating the standard DEA. As shown in Figure 1, if DMU P belongs to Technology 1, the output-oriented technical efficiency of the DMU P obtained in terms of group frontier is determined by the ratio of the distances and . On the other hand, the output-oriented technical efficiency obtained in terms of the metafrontier is determined by the ratio of the distances and . Even if the level of input is the same, DMU P may produce different outputs when operated under different technologies.
To find the efficiency score of all individual government-sponsored R&D project P, the linear programming problem of Equation (1) must be solved.
where the variables and indicate the amount of input ( and output () for each R&D project (, respectively. N, M, and J are the number of output variables, the number of input variables, and the number of R&D projects used in the analysis, respectively. The objective function of this optimization problem was to optimize the output improvement potential, ∅, in all outputs. The value is a value between zero and one and can be interpreted as the technical efficiency, [30]. TGR is an indicator of the gap between group technology and common production technology [9,39]. TGR can be described in terms of the way the group frontier approaches the metafrontier. Thus, TGR was obtained by dividing the , which is the efficiency score obtained under the metafrontier, by , the efficiency score obtained under the group frontier, and is defined as Equation (2) [9,29,40]:
where , , and represent the TGR of technology k (, the technical efficiency of metatechnology, and the technical efficiency of the Group k technology, respectively.
k is the number of groups corresponding to different technologies. If is 0.4, it means that output is 40% of the maximum output that an R&D project can produce using input with the metatechnology. If is 0.5, output is 50% of the maximum output that can be produced by an R&D project using input and Group k technology. The technical efficiency of each group technology cannot be lower than the technical efficiency of the metatechnology, because the constraints to problems in different groups are a subset of the constraints of the metafrontier problem [12]. Therefore, TGR has a value between zero and one. If the gap between the group frontier and the metafrontier increases, the TGR decreases, and when the gap decreases, the TGR approaches one. In this paper, we used the metafrontier approach to measure the efficiency scores of government-sponsored biotechnology R&D projects. Then, TGRs were calculated using the obtained efficiency scores
3.2. Data
In this study, we analyzed the efficiencies of Korean government-sponsored biotechnology R&D projects under the group frontier and metafrontier. Each R&D project was considered to be a DMU, an efficiency analysis unit. If a DMU is set to the program level, individual project data must be aggregated into one program unit. This creates the problem that the analysis results vary depending on how the data are added together. Additionally, data loss can occur during the aggregation process; thus, the discriminatory power decreases relatively. Therefore, it is desirable to set an R&D project as the DMU [23].
The data of R&D projects were extracted from the National Science and Technology Information Service (NTIS) of the Korean government. The NTIS collects and provides information on inputs and outputs of government-sponsored projects. The data period was from 2007 to 2013. Because the output data of the NTIS has been collected reliably since 2007, projects after 2007 were used in the empirical analysis. In addition, in the existing R&D productivity and efficiency analysis study, it was reported that the time lag between the input and output of R&D was three years [8,41,42]. Therefore, we analyzed projects up to 2013, considering the time lag. The NTIS collects data by classifying R&D and non-R&D projects. Because we measured the efficiency of R&D projects, non-R&D projects were excluded from the analysis. The NTIS also classifies projects by technology. Biotechnology includes 16 sub-biotechnologies, as shown in Table 1. To analyze the differences in efficiency between the group frontier and the metafrontier, this paper analyzed R&D projects belonging to the 16 sub-biotechnologies. On the other hand, institutions that conduct R&D have various organizational types. In addition, the characteristics of an organization type influence the efficiency of an R&D project. The NTIS classifies the types of R&D conductors into eight categories: (1) university, (2) large enterprise (LE), (3) small and medium-sized enterprises (SME), (4) GRI, (5) national research institute (NRI), (6) government ministry (GM), and (7) other. This study also examined the efficiency differences according to the eight different organization types of R&D project conductors.
Projects with missing and outlier values and incorrect information were excluded from the analysis. For the output variables, each was divided by the total amount of investment, and the projects outside of ±3σ were removed. It is desirable to exclude outliers, because they reduce the discriminative power of the model, because they make the efficiency of most DMUs low in the DEA analysis. Therefore, the number of government-sponsored biotechnology R&D projects from 2007 to 2013 used in the analysis of this paper was 50,597.
3.3. Variables
The variables used in the empirical analysis comprised three input variables and four output variables. In previous studies, investment, time, and personnel have usually been considered as the inputs of R&D activities [8,21,23,24,25,43,44]. Therefore, this study used R&D investment, R&D personnel, and R&D time as input variables. R&D investment is the sum of funding from various sources of a project, including government funding. R&D investment reflects the technological capabilities of R&D performers [45]. R&D personnel is the sum of all staff who participated in the project during the project period. The personnel involved in an R&D project have expertise and skills. The input of this personnel can be considered to grant knowledge and skills to the project. Another reason to set R&D personnel as an input is that knowledge creation, accumulation, and reproduction are due to the knowledge, experience, and interactions among personnel [46]. The R&D project period refers to the period of the project, and the output from R&D activities during this period is collected as the output of the project.
The representative measures of the output of R&D projects are papers and patents [47]. A paper published in a journal is used most widely as a measure of the outputs of R&D projects and researchers [8,48]. Patents are also commonly used to measure the outputs of R&D activities [22,26,45]. The number of patents is one of the most important indicators of innovation capability [49,50]. In this study, both applied patents and granted patents were used. The advantage of the applied patent is that it reflects more quantitative aspects of R&D innovation performance. A granted patent can take into account the qualitative aspects of the patent [51]. Therefore, science citation index (SCI) papers, non-SCI papers, applied patents, and granted patents provided by NTIS were used as R&D output variables. Meanwhile, we adjusted the price of R&D investment for all years to 2010 prices with the GDP deflator of the Bank of Korea to account for the impact of inflation. The input and output variables used in this study are summarized in Table 2.
4. Results
This section presents the estimated efficiency results of government-sponsored biotechnology R&D projects under the group frontier and metafrontier and provides a discussion of the results. Table 3 shows the descriptive statistics of variables for all government-sponsored biotechnology R&D projects used in the analysis. The statistics shows that for Korean government-sponsored biotechnology R&D projects, the number of SCI papers was 2.9 times that of non-SCI papers, and the number of applied patents was about 2.1 times that of granted patents. The correlation matrix between variables is shown in Table 4. Although the correlation coefficients were not so high, there were significant correlations between investment and personnel and all output variables. This is in line with the common sense that R&D projects with more investment will input more personnel and make more outputs. There is also a significant correlation between output variables.
The descriptive statistics of variables for the 16 sub-biotechnologies are shown in Table 5. T10 (biopharmaceutical development technology) was the technology field with the highest average investment and personnel per project. T2 (proteome research) had the highest number of SCI papers per project. T8 (biochip development technology) had the highest number of applied and granted patents per project. Before estimating the metafrontier, we verified whether statistically significant differences existed among the 16 sub-technologies for each variable. To do this, we performed the Kruskal–Wallis test, an extension of the Mann–Whitney U-test. The null-hypothesis that there is no difference between sub-technologies was rejected at the significance level of 0.01 for all input and output variables, as shown in Table A1. Therefore, R&D projects classified by sub-technologies are quite different from each other. The results support the previous research finding that a single product frontier cannot be used to compare the efficiency of R&D projects using different technologies [29].
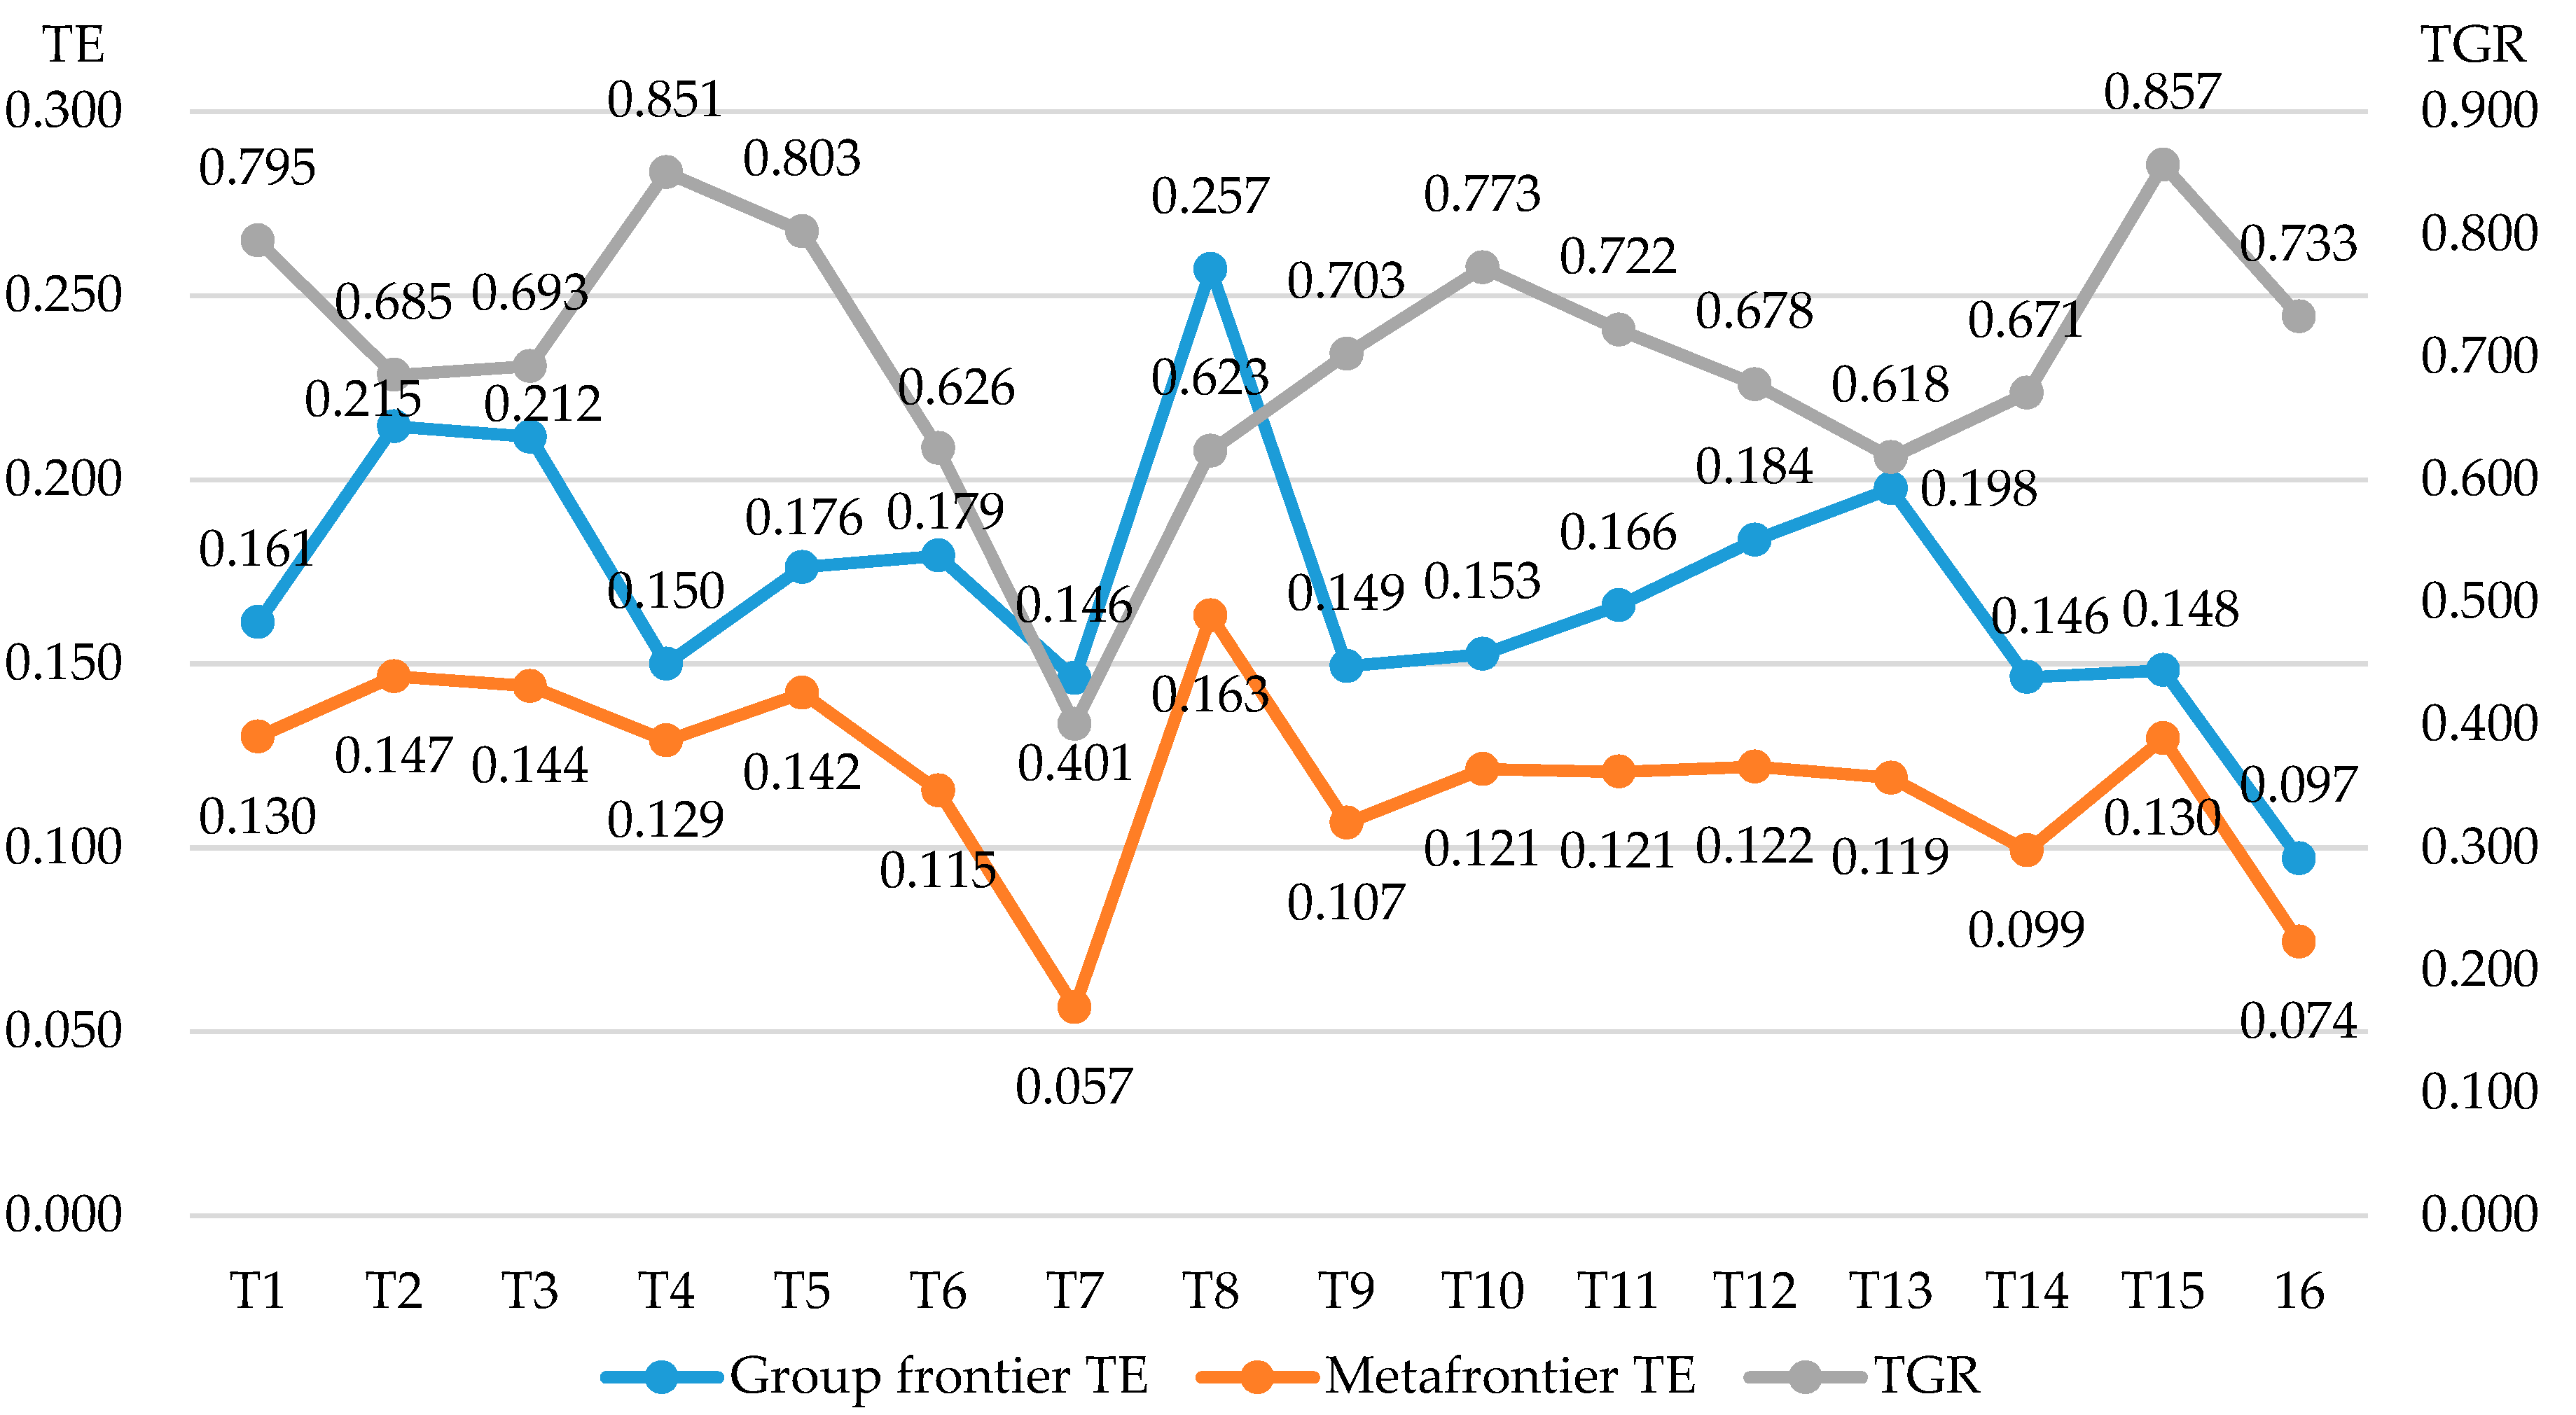
After verifying that the 16 sub-biotechnology groups operate under different technological frontiers, we estimated the technical efficiency under the group frontier and metafrontier, respectively. The TGR was calculated with the results. As mentioned in the previous section, this study used an output-oriented BCC model under the assumption of VRS. Table 6 and Figure 2 show the average efficiency results associated with the group frontier and metafrontier models. You can also see the TGRs in Table 6 and Figure 2. The efficiencies under the group frontier were between 0.097 and 0.257 for each sub-technology. On the other hand, the efficiencies under the metafrontier were between 0.057 and 0.163 for each sub-technology. These results show that the overall efficiency was low. This is because the number of papers and patents produced by the biotechnology R&D projects was low, as you can see in Table 3 and Table 5. Moreover, there were also many projects that did not produce any papers or patents. As shown in Figure 2, the technical efficiency under the metafrontier was lower than the technical efficiency under the group frontier in all of the sub-technologies. These are similar results to those found in previous studies [9,11,39,52]. This result is due to the fact that the metafrontier is composed of all government-sponsored biotechnology R&D project data, whereas the group frontier is composed of R&D project data belonging to an individual sub-biotechnology. The rankings of the group frontier and metafrontier are different from each other, as shown in Table 6. For example, in the case of T5 and T13, under the group frontier, the efficiency of T13 is higher than that of T5, whereas under the metafrontier, the efficiency of T5 is higher than that of T13. Therefore, it is inappropriate to compare the efficiencies of the sub-technology groups with the efficiency scores obtained under the group frontier. As a result, it is possible to make a more accurate comparison with the efficiency scores obtained under the metafrontier. T8 (biochip development technology) was the most efficient sub-biotechnology field under the metafrontier, followed by T2 (proteome research), T3 (bioinformatics technology), and T5 (neuroscience research). In the case of T8, a significant factor of high efficiency was the relatively higher value of average applied and granted patents per project than in other sub-biotechnology field. The least efficient technology was T7 (biotechnology product safety and efficacy assessment technology), followed by T16 (other healthcare application technology) and T14 (functional biomaterial-based technology). In the case of T7, the average number of papers and patents was lower than in other fields.
We next obtained TGRs using Equation (2), as shown in Table 6. The calculated TGRs for each sub-technology had values between 0.401 and 0.857. As shown in Figure 1, the closer the TGR is to one, the more the group technology approaches optimal production technology. On the other hand, the closer the TGR is to zero, the more the group technology lags behind the optimal production technology. T15 (medical science and engineering) had the highest TGR, indicating that T15 is the closest to optimal production technology among the sub-technologies.
Table 7 shows the efficiency under the metafrontier over time. While the number of government-sponsored biotechnology R&D projects increased from 2007 to 2013 and the investment size increased, the efficiency was the highest in 2007 and had not recovered as of 2013. Thus, while Korea’s biotechnology sector is catching up in terms of the size of its investment, it is not catching up in terms of its efficiency. Looking at the sub-technologies, we can see that the efficiency of T7 (biotechnology product safety and efficacy assessment technology) more than doubled from 2007 to 2013. On the other hand, the efficiency of T13 (gene therapy technology) reduced by about half. Therefore, it is necessary to closely monitor the R&D activities of each sub-technology, because the trend of efficiency change varies according to each sub-technology.
Table 8 shows the efficiencies under the metafrontier by the type of organization conducting the R&D project. The efficiency of universities was found to be the highest across all the sub-biotechnologies, and the efficiency of GRIs was almost as high. However, the efficiency of LEs and SMEs was lower than that of universities and GRIs. In the case of T3 (bioinformatics technology), though, the efficiency of a LE was the highest, indicating that the most efficient organization type can differ among sub-biotechnologies.
5. Discussion of Results
In this paper, we investigated the efficiency of Korean government-sponsored biotechnology R&D projects between 2007 and 2013 using a metafrontier DEA approach. Park and Choi [24] analyzed the efficiency of nanotechnology and biotechnology projects in four specific programs using DEA and compared the results. Lee and Cho [26] analyzed the efficiency and productivity of projects that corresponded to translational research among biotechnologies using DEA and the Malmquist productivity index. Thus far, however, it has been difficult to find any study that covers all sub-fields of biotechnology R&D projects. The contribution of this paper is the analysis of all areas of biotechnology R&D projects in Korea and to observe the efficiency trend during a period in which there was a significant increase in investment. The analysis showed that there was no improvement in efficiency relative to the increase in investment.
Moreover, previous studies used efficiency scores obtained under a single frontier to compare different groups [24]. However, it is not desirable to compare the efficiency of different technology groups with the results under each group technology frontier. No studies have analyzed the efficiency of government-sponsored R&D projects from the viewpoint of the metafrontier and showed related TGRs. This study estimated efficiency scores for the R&D projects of 16 sub-biotechnology groups under the metafrontier and contributed to making a more accurate comparison between sub-technologies. The TGRs obtained also provide an opportunity to investigate which sub-biotechnology R&D projects are relatively more efficient.
Additionally, this study presented the efficiency results of sub-biotechnology fields by time series and by R&D organization type. In terms of time, there was no increase in efficiency between 2007 and 2013, and the efficiency of universities and GRIs was high, while the efficiency of companies was relatively low.
Finally, in the methodology, the sample sizes of R&D projects in 16 sub-biotechnology groups used in our empirical analysis were different. According to De Witte and Marques [53], this can make the comparison of efficiency inaccurate. Therefore, it is necessary for future studies to consider using an order-m model or sub-sampling method to improve the accuracy of efficiency comparison across sub-technology groups.
6. Conclusions
In this study, we estimated the technical efficiency of Korean government-sponsored biotechnology R&D projects between 2007 and 2013 under the group frontier and metafrontier. We obtained efficiency scores for 16 sub-biotechnologies and TGRs. Then, the resulting efficiencies of sub-biotechnologies were compared by time series and by organization types of R&D performer. The results showed that the efficiency scores of sub-biotechnologies under the group frontier were between 0.097 and 0.257 and those under the metafrontier were between 0.057 and 0.163 (i.e., the efficiency score under the group frontier were greater than those under the metafrontier). This result supports the previous studies and theory. T8 (biochip development technology) was the most efficient sub-biotechnology field under the metafrontier, and the least efficient sub-biotechnology field was T7 (biotechnology product safety and efficacy assessment technology). T15 (medical science and engineering) had the highest TGR, indicating that T15 is the closest to optimal production technology among the sub-biotechnologies. In addition, there was no improvement in overall efficiency of government-sponsored biotechnology R&D projects between 2007 and 2013. The efficiency of universities and GRIs was high, while the efficiency of companies was relatively low. This paper is the first study to adopt a metafrontier DEA approach to evaluate the technical efficiency of government-sponsored biotechnology R&D projects. Our study gives a novel way of identifying the relative efficiency of R&D projects of 16 sub-biotechnologies.
This study provides some policy implications. First, measures used to evaluate government-sponsored R&D projects must be diversified, and the progress of R&D should be more carefully monitored. The overall efficiency of government-sponsored biotechnology R&D projects was low. The reason for the low efficiency is that the overall project output was small. Although the outcomes of R&D are mainly based on papers and patents, there may be other measures, such as acquiring skills, performing tasks, market sales, and other nonpatented and nonpublished performance indicators. In addition, there may be differences in outcomes depending on the characteristics of each technology and the stage of R&D. Therefore, it is necessary to collect more diverse output indicators to reveal the R&D performance more fully.
Second, to improve the efficiency of R&D and ensure the sustainability of R&D, it is necessary to clarify and define the outcome goals of R&D projects, beginning at the planning stage. Currently, many government-funded R&D projects have no innovation outputs, such as papers and patents. This is because, in many cases, there is a lack of strategic definition of target outcomes of R&D projects. Therefore, it would be helpful to improve the efficiency of R&D by making patent and publication analyses mandatory at the technological feasibility evaluating stage of new government-sponsored R&D projects.
Third, customized R&D planning is needed. There are significant differences in efficiency among the sub-biotechnologies and organization types of R&D performers. In some sub-biotechnology fields, it is more efficient for universities to conduct R&D projects, while in others, companies are more efficient. Therefore, more efficient R&D outcomes can be obtained if customized R&D planning according to the characteristics of technologies and organization types is taken into consideration.
There are some limitations to this study. First, this study did not include output data such as sales, technology transfer, and job creation. The lack of these various output data limits the measurement of full efficiency. Second, in the time series analysis, the analysis period was limited to seven years because of the available data period. Therefore, it was impossible to examine more long-term changes in R&D efficiency. Third, we could not consider the qualitative aspect of paper outputs. We used the number of published papers as an output variable. However, depending on the impact factor of the journal in which a paper is published, the paper has a significantly different quality. Therefore, it is desirable to adjust the number of papers with the impact factors of journals. However, in this study, due to the lack of relevant data, we could not adjust the number of papers. In the future, if more diverse output data are gathered for government-sponsored R&D projects and long-term data is obtained, more accurate efficiency measurements and efficiency trend analyses will be possible.
Author Contributions
J.H.P. and K.S. worked together and significantly contributed to this paper. K.S. proposed and designed this study, and J.H.P. implemented and evaluated the analytic model. Both authors contributed to the literature review and writing. Both discussed the implications and approved the final manuscript.
Funding
This research received no external funding.
Conflicts of Interest
The authors declare no conflict of interest.
Appendix A

Table A1.
Kruskal–Wallis test statistics of variables for differences in the 16 sub-biotechnologies.
Table A1.
Kruskal–Wallis test statistics of variables for differences in the 16 sub-biotechnologies.
| Variables | Chi-Squared | p-Value | |
|---|---|---|---|
| Inputs | Investment | 1579.80 | 0.000 |
| Time | 861.27 | 0.000 | |
| Personnel | 2033.90 | 0.000 | |
| Outputs | SCI papers | 1610.80 | 0.000 |
| Non-SCI papers | 416.16 | 0.000 | |
| Applied patents | 1292.00 | 0.000 | |
| Granted patents | 745.93 | 0.000 | |
References
- Görg, H.; Strobl, E. The effect of R&D subsidies on private R&D. Economica 2007, 74, 215–234. [Google Scholar]
- Baumann, J.; Kritikos, A.S. The link between R&D, innovation and productivity: Are micro firms different? Res. Policy 2016, 45, 1263–1274. [Google Scholar] [Green Version]
- Hsu, F.-M.; Horng, D.-J.; Hsueh, C.-C. The effect of government-sponsored R&D programmes on additionality in recipient firms in Taiwan. Technovation 2009, 29, 204–217. [Google Scholar]
- Guo, D.; Guo, Y.; Jiang, K. Government-subsidized R&D and firm innovation: Evidence from China. Res. Policy 2016, 45, 1129–1144. [Google Scholar] [Green Version]
- Bronzini, R.; Piselli, P. The impact of R&D subsidies on firm innovation. Res. Policy 2016, 45, 442–457. [Google Scholar]
- Pretschker, U. Introduction: The OECD’s Mission in the Field of Public Support to Industry. STI Rev. 1998, 21, 7–12. [Google Scholar]
- OECD Data. Available online: https://data.oecd.org/rd/gross-domestic-spending-on-r-d.htm (accessed on 14 January 2018).
- Wang, E.C.; Huang, W. Relative efficiency of R&D activities: A cross-country study accounting for environmental factors in the DEA approach. Res. Policy 2007, 36, 260–273. [Google Scholar]
- O’Donnell, C.; Rao, D.; Battese, G. Metafrontier frameworks for the study of firm-level efficiencies and technology ratios. Empir. Econ. 2008, 34, 231–255. [Google Scholar] [CrossRef]
- Mei, G.; Gan, J.; Zhang, N. Metafrontier Environmental Efficiency for China’s Regions: A Slack-Based Efficiency Measure. Sustainability 2015, 7, 4004–4021. [Google Scholar] [CrossRef] [Green Version]
- Assaf, A.; Barros, C.P.; Josiassen, A. Hotel efficiency: A bootstrapped metafrontier approach. Int. J. Hosp. Manag. 2012, 31, 621–629. [Google Scholar] [CrossRef]
- Chen, Y.-H.; Lai, P.-L.; Piboonrungroj, P. The relationship between airport performance and privatisation policy: A nonparametric metafrontier approach. J. Transp. Geogr. 2017, 62, 229–235. [Google Scholar] [CrossRef]
- Lee, C.-C.; Huang, T.-H. Cost efficiency and technological gap in Western European banks: A stochastic metafrontier analysis. Int. Rev. Econ. Financ. 2017, 48, 161–178. [Google Scholar] [CrossRef]
- Abramo, G.; D’Angelo, C.A. Assessing national strengths and weaknesses in research fields. J. Informetr. 2014, 8, 766–775. [Google Scholar] [CrossRef]
- Rousseau, S.; Rousseau, R. The scientific wealth of European nations: Taking effectiveness into account. Scientometrics 1998, 42, 75–87. [Google Scholar] [CrossRef]
- Lee, H.Y.; Park, Y.T. An international comparison of R&D efficiency: DEA approach. Asian J. Technol. Innov. 2005, 13, 207–222. [Google Scholar]
- Sharma, S.; Thomas, V. Inter-country R&D efficiency analysis: An application of data envelopment analysis. Scientometrics 2008, 76, 483–501. [Google Scholar]
- Hashimoto, A.; Haneda, S. Measuring the change in R&D efficiency of the Japanese pharmaceutical industry. Res. Policy 2008, 37, 1829–1836. [Google Scholar] [Green Version]
- Lee, S.; Lee, H. Measuring and comparing the R&D performance of government research institutes: A bottom-up data envelopment analysis approach. J. Informetr. 2015, 9, 942–953. [Google Scholar]
- Jang, H.; Lee, S.; Suh, E. A comparative analysis of the change in R&D efficiency: A case of R&D leaders in the technology industry. Technol. Anal. Strateg. Manag. 2016, 28, 886–900. [Google Scholar]
- Han, C.; Thomas, S.R.; Yang, M.; Ieromonachou, P.; Zhang, H. Evaluating R&D investment efficiency in China’s high-tech industry. J. High Technol. Manag. Res. 2017, 28, 93–109. [Google Scholar]
- Hsu, F.-M.; Hsueh, C.-C. Measuring relative efficiency of government-sponsored R&D projects: A three-stage approach. Eval. Program Plan. 2009, 32, 178–186. [Google Scholar]
- Lee, H.; Park, Y.; Choi, H. Comparative evaluation of performance of national R&D programs with heterogeneous objectives: A DEA approach. Eur. J. Oper. Res. 2009, 196, 847–855. [Google Scholar]
- Park, H.; Choi, H.-G. Measurement of R&D efficiency in NT and BT fields using DEA: A case in Korea. Int. J. Eng. Technol. 2013, 2, 165. [Google Scholar]
- Park, S. Evaluating the efficiency and productivity change within government subsidy recipients of a national technology innovation research and development program. R&D Manag. 2015, 45, 549–568. [Google Scholar]
- Lee, C.; Cho, K. Proposing a portfolio model for performance management of Korea’s Health Technology R&D Programme using DEA and MPI: A translational research case. Asian J. Technol. Innov. 2015, 23, 20–34. [Google Scholar]
- Hayami, Y.; Ruttan, V.W. Agricultural productivity differences among countries. Am. Econ. Rev. 1970, 60, 895–911. [Google Scholar]
- Aravindakshan, S.; Rossi, F.; Amjath-Babu, T.S.; Veettil, P.C.; Krupnik, T.J. Application of a bias-corrected meta-frontier approach and an endogenous switching regression to analyze the technical efficiency of conservation tillage for wheat in South Asia. J. Product. Anal. 2018, 49, 153–171. [Google Scholar] [CrossRef] [Green Version]
- Sala-Garrido, R.; Molinos-Senante, M.; Hernández-Sancho, F. Comparing the efficiency of wastewater treatment technologies through a DEA metafrontier model. Chem. Eng. J. 2011, 173, 766–772. [Google Scholar] [CrossRef]
- Tiedemann, T.; Francksen, T.; Latacz-Lohmann, U. Assessing the performance of German Bundesliga football players: A non-parametric metafrontier approach. Central Eur. J. Oper. Res. 2011, 19, 571–587. [Google Scholar] [CrossRef]
- Wang, Q.; Zhao, Z.; Zhou, P.; Zhou, D. Energy efficiency and production technology heterogeneity in China: A meta-frontier DEA approach. Econ. Model. 2013, 35, 283–289. [Google Scholar] [CrossRef]
- Oh, D.-H.; Lee, J.-D. A metafrontier approach for measuring Malmquist productivity index. Empir. Econ. 2010, 38, 47–64. [Google Scholar] [CrossRef]
- Rao, D.; O’donnell, C.J.; Battese, G.E. Metafrontier Functions for the Study of Inter-Regional Productivity Differences; The University of Queensland School of Economics: St. Lucia, Australia, 2003. [Google Scholar]
- Battese, G.E.; Rao, D.S.P.; O’Donnell, C.J. A Metafrontier Production Function for Estimation of Technical Efficiencies and Technology Gaps for Firms Operating Under Different Technologies. J. Product. Anal. 2004, 21, 91–103. [Google Scholar] [CrossRef]
- Charnes, A.; Cooper, W.W.; Rhodes, E. Measuring the efficiency of decision making units. Eur. J. Oper. Res. 1978, 2, 429–444. [Google Scholar] [CrossRef]
- Banker, R.D.; Charnes, A.; Cooper, W.W. Some models for estimating technical and scale inefficiencies in data envelopment analysis. Manag. Sci. 1984, 30, 1078–1092. [Google Scholar] [CrossRef]
- Battese, G.E.; Rao, D.S.P. Technology Gap, Efficiency, and a Stochastic Metafrontier Function. Int. J. Bus. Econ. 2002, 1, 87–93. [Google Scholar]
- Ferreira, D.C.; Marques, R.C. Malmquist and Hicks-Moorsteen productivity indexes for clusters performance evaluation. Int. J. Inf. Technol. Decis. Mak. 2016, 15, 1015–1053. [Google Scholar] [CrossRef]
- Lin, B.; Zhao, H. Technology gap and regional energy efficiency in China’s textile industry: A non-parametric meta-frontier approach. J. Clean. Prod. 2016, 137, 21–28. [Google Scholar] [CrossRef]
- Lin, B.; Du, K. Technology gap and China’s regional energy efficiency: A parametric metafrontier approach. Energy Econ. 2013, 40, 529–536. [Google Scholar] [CrossRef]
- Adams, J.D.; Griliches, Z. Research productivity in a system of universities. In The Economics and Econometrics of Innovation; Springer: Berlin, Germany, 2000; pp. 105–140. [Google Scholar]
- Dominique, G.; Bruno, V.P.d.l.P. From R&D to Productivity Growth: Do the Institutional Settings and the Source of Funds of R&D Matter? Oxf. Bull. Econ. Statist. 2004, 66, 353–378. [Google Scholar] [Green Version]
- Hong, J.; Feng, B.; Wu, Y.; Wang, L. Do government grants promote innovation efficiency in China’s high-tech industries? Technovation 2016, 57–58, 4–13. [Google Scholar] [CrossRef]
- Freeman, C.; Soete, L. The Economics of Industrial Innovation; MIT Press: Cambridge, MA, USA, 1997. [Google Scholar]
- Hagedoorn, J.; Cloodt, M. Measuring innovative performance: Is there an advantage in using multiple indicators? Res. Policy 2003, 32, 1365–1379. [Google Scholar] [CrossRef]
- Leoncini, R.; Maggioni, M.A.; Montresor, S. Intersectoral innovation flows and national technological systems: Network analysis for comparing Italy and Germany. Res. Policy 1996, 25, 415–430. [Google Scholar] [CrossRef]
- Thomas, V.J.; Sharma, S.; Jain, S.K. Using patents and publications to assess R&D efficiency in the states of the USA. World Pat. Inf. 2011, 33, 4–10. [Google Scholar]
- Organisation for Economic Co-operation and Development (OECD). Science, Technology, and Industry Scoreboard; OECD: Paris, France, 2001. [Google Scholar]
- Chen, Y.; Yang, Z.; Shu, F.; Hu, Z.; Meyer, M.; Bhattacharya, S. A patent based evaluation of technological innovation capability in eight economic regions in PR China. World Pat. Inf. 2009, 31, 104–110. [Google Scholar] [CrossRef] [Green Version]
- Lee, S.; Yoon, B.; Lee, C.; Park, J. Business planning based on technological capabilities: Patent analysis for technology-driven roadmapping. Technol. Forecast. Soc. Chang. 2009, 76, 769–786. [Google Scholar] [CrossRef]
- Ernst, H. Patenting strategies in the German mechanical engineering industry and their relationship to company performance. Technovation 1995, 15, 225–240. [Google Scholar] [CrossRef]
- Fei, R.; Lin, B. Energy efficiency and production technology heterogeneity in China’s agricultural sector: A meta-frontier approach. Technol. Forecast. Soc. Chang. 2016, 109, 25–34. [Google Scholar] [CrossRef]
- De Witte, K.; Marques, R.C. Capturing the environment, a metafrontier approach to the drinking water sector. Int. Trans. Oper. Res. 2009, 16, 257–271. [Google Scholar] [CrossRef] [Green Version]
Figure 1.
Group frontier and metafrontier.

Figure 2.
Technical efficiency (TE) and TGR plot.

Table 1.
Description of sub-biotechnologies.
| Sub-Biotechnology | Description |
|---|---|
| T1 | Genomic infrastructure technology |
| T2 | Proteome research |
| T3 | Bioinformatics technology |
| T4 | Life phenomenon and function research |
| T5 | Neuroscience research |
| T6 | Bioprocess technology |
| T7 | Biotechnology product safety and efficacy assessment technology |
| T8 | Biochip development technology |
| T9 | Other basic and infrastructure technology |
| T10 | Biopharmaceutical development technology |
| T11 | Intractable disease treatment technology |
| T12 | Biological tissue regeneration technology |
| T13 | Gene therapy technology |
| T14 | Functional biomaterial-based technology |
| T15 | Medical science and engineering |
| T16 | Other healthcare application technology |
Table 2.
Definitions of input and output variables.
| Variable | Definition | |
|---|---|---|
| Inputs | Investment | Total amount of funds allocated to an R&D project (unit: 1000 KRW) |
| Time | Duration of an R&D project (unit: years) | |
| Personnel | Number of researchers involved in an R&D project | |
| Outputs | SCI papers | Number of SCI papers |
| Non-SCI papers | Number of non-SCI papers | |
| Applied patents | Number of applied patents | |
| Granted patents | Number of granted patents | |
Table 3.
Descriptive statistics of input and output variables.
| Variables | Mean | SD | Min | Max | |
|---|---|---|---|---|---|
| Inputs | Investment | 175,743 | 390,509 | 34 | 20,676,190 |
| Time | 0.960 | 0.139 | 0.093 | 1.997 | |
| Personnel | 8.199 | 13.116 | 1.000 | 699.000 | |
| Outputs | SCI papers | 1.0489 | 2.722 | 0.000 | 115.000 |
| Non-SCI papers | 0.364 | 2.177 | 0.000 | 184.000 | |
| Applied patents | 0.378 | 1.296 | 0.000 | 42.000 | |
| Granted patents | 0.184 | 0.850 | 0.000 | 36.000 | |
Table 4.
Correlation analysis of variables.
| Investment | Time | Personnel | SCI Papers | Non-SCI Papers | Applied Patents | Granted Patents | |
|---|---|---|---|---|---|---|---|
| 1.00 | |||||||
| Time | 0.05 | 1.00 | |||||
| Personnel | 0.49 *** | 0.01 ** | 1.00 | ||||
| SCI papers | 0.31 *** | 0.06 *** | 0.31 *** | 1.00 | |||
| Non-SCI papers | 0.19 *** | 0.02 *** | 0.20 *** | 0.29 *** | 1.00 | ||
| Applied patents | 0.31 *** | 0.05 *** | 0.26 *** | 0.33 *** | 0.23 *** | 1.00 | |
| Granted patents | 0.26 *** | 0.04 *** | 0.20 *** | 0.29 *** | 0.19 *** | 0.5 *** | 1.00 |
*** p < 0.01, ** p < 0.05.
Table 5.
Descriptive statistics of variables by technology.
| Technology | Observation | Investment | Time | Personnel | SCI Papers | Non-SCI Papers | Applied Patents | Granted Patents | |||||||
|---|---|---|---|---|---|---|---|---|---|---|---|---|---|---|---|
| Mean | SD | Mean | SD | Mean | SD | Mean | SD | Mean | SD | Mean | SD | Mean | SD | ||
| T1 | 2783 | 163,147 | 289,896 | 0.965 | 0.131 | 7.304 | 9.201 | 1.237 | 2.523 | 0.274 | 0.902 | 0.329 | 1.070 | 0.145 | 0.644 |
| T2 | 1799 | 162,854 | 298,494 | 0.972 | 0.121 | 6.636 | 7.735 | 1.508 | 2.867 | 0.228 | 1.054 | 0.359 | 1.105 | 0.193 | 0.830 |
| T3 | 869 | 166,069 | 328,041 | 0.961 | 0.161 | 7.871 | 11.057 | 1.486 | 2.956 | 0.325 | 1.097 | 0.247 | 0.936 | 0.132 | 0.547 |
| T4 | 10,226 | 105,426 | 225,783 | 0.975 | 0.102 | 5.061 | 5.649 | 1.037 | 2.475 | 0.197 | 2.245 | 0.190 | 0.741 | 0.083 | 0.480 |
| T5 | 2847 | 160,028 | 494,710 | 0.972 | 0.104 | 8.159 | 19.535 | 1.300 | 2.671 | 0.373 | 2.349 | 0.215 | 0.861 | 0.120 | 0.763 |
| T6 | 1356 | 186,221 | 316,344 | 0.966 | 0.124 | 7.883 | 10.178 | 1.204 | 3.679 | 0.330 | 1.585 | 0.633 | 1.701 | 0.279 | 1.106 |
| T7 | 1130 | 157,959 | 247,987 | 0.896 | 0.180 | 9.683 | 11.196 | 0.458 | 1.402 | 0.373 | 1.289 | 0.205 | 0.920 | 0.074 | 0.395 |
| T8 | 1125 | 208,855 | 312,527 | 0.957 | 0.141 | 9.089 | 11.093 | 1.460 | 2.665 | 0.436 | 2.007 | 0.716 | 1.594 | 0.349 | 1.059 |
| T9 | 4815 | 166,510 | 322,519 | 0.962 | 0.135 | 9.045 | 10.044 | 0.994 | 2.789 | 0.423 | 1.481 | 0.449 | 1.350 | 0.210 | 0.823 |
| T10 | 3817 | 295,363 | 542,799 | 0.956 | 0.148 | 10.582 | 16.345 | 1.249 | 3.392 | 0.305 | 2.425 | 0.498 | 1.500 | 0.284 | 1.161 |
| T11 | 2220 | 190,806 | 568,651 | 0.972 | 0.124 | 7.860 | 11.004 | 1.048 | 2.330 | 0.254 | 0.956 | 0.332 | 1.078 | 0.137 | 0.668 |
| T12 | 1587 | 180,609 | 335,966 | 0.966 | 0.114 | 9.777 | 17.069 | 1.390 | 3.571 | 0.393 | 2.186 | 0.390 | 1.128 | 0.202 | 0.752 |
| T13 | 784 | 163,900 | 231,507 | 0.972 | 0.143 | 7.348 | 8.144 | 1.191 | 2.489 | 0.209 | 0.788 | 0.297 | 0.859 | 0.182 | 0.814 |
| T14 | 3528 | 171,688 | 259,325 | 0.964 | 0.137 | 8.754 | 10.975 | 0.683 | 1.839 | 0.408 | 2.032 | 0.559 | 1.366 | 0.240 | 0.909 |
| T15 | 5895 | 203,663 | 377,799 | 0.969 | 0.157 | 10.051 | 19.450 | 1.179 | 3.198 | 0.646 | 3.434 | 0.601 | 1.918 | 0.321 | 1.239 |
| T16 | 5901 | 210,450 | 574,222 | 0.916 | 0.181 | 9.626 | 14.957 | 0.549 | 2.230 | 0.464 | 2.241 | 0.299 | 1.395 | 0.138 | 0.796 |
Table 6.
Technical efficiencies and technology gap ratios (TGR).
| Technology | Group Frontier Technical Efficiency | Metafrontier Technical Efficiency | TGR | |||||||||
|---|---|---|---|---|---|---|---|---|---|---|---|---|
| Mean | SD | Min | Max | Mean | SD | Min | Max | Mean | SD | Min | Max | |
| T1 | 0.161 | 0.221 | 0.000 | 1.000 | 0.130 | 0.190 | 0.000 | 1.000 | 0.795 | 0.224 | 0.077 | 1.000 |
| T2 | 0.215 | 0.274 | 0.000 | 1.000 | 0.147 | 0.202 | 0.000 | 1.000 | 0.685 | 0.238 | 0.108 | 1.000 |
| T3 | 0.212 | 0.271 | 0.000 | 1.000 | 0.144 | 0.203 | 0.000 | 1.000 | 0.693 | 0.281 | 0.124 | 1.000 |
| T4 | 0.150 | 0.210 | 0.000 | 1.000 | 0.129 | 0.188 | 0.000 | 1.000 | 0.851 | 0.178 | 0.120 | 1.000 |
| T5 | 0.176 | 0.240 | 0.000 | 1.000 | 0.142 | 0.202 | 0.000 | 1.000 | 0.803 | 0.199 | 0.151 | 1.000 |
| T6 | 0.179 | 0.252 | 0.000 | 1.000 | 0.115 | 0.179 | 0.000 | 1.000 | 0.626 | 0.189 | 0.197 | 1.000 |
| T7 | 0.146 | 0.268 | 0.000 | 1.000 | 0.057 | 0.123 | 0.000 | 1.000 | 0.401 | 0.239 | 0.096 | 1.000 |
| T8 | 0.257 | 0.304 | 0.000 | 1.000 | 0.163 | 0.217 | 0.000 | 1.000 | 0.623 | 0.236 | 0.122 | 1.000 |
| T9 | 0.149 | 0.226 | 0.000 | 1.000 | 0.107 | 0.175 | 0.000 | 1.000 | 0.703 | 0.225 | 0.108 | 1.000 |
| T10 | 0.153 | 0.226 | 0.000 | 1.000 | 0.121 | 0.191 | 0.000 | 1.000 | 0.773 | 0.198 | 0.229 | 1.000 |
| T11 | 0.166 | 0.246 | 0.000 | 1.000 | 0.121 | 0.195 | 0.000 | 1.000 | 0.722 | 0.244 | 0.098 | 1.000 |
| T12 | 0.184 | 0.246 | 0.000 | 1.000 | 0.122 | 0.174 | 0.000 | 1.000 | 0.678 | 0.234 | 0.164 | 1.000 |
| T13 | 0.198 | 0.271 | 0.000 | 1.000 | 0.119 | 0.180 | 0.000 | 1.000 | 0.618 | 0.252 | 0.046 | 1.000 |
| T14 | 0.146 | 0.222 | 0.000 | 1.000 | 0.099 | 0.164 | 0.000 | 1.000 | 0.671 | 0.202 | 0.168 | 1.000 |
| T15 | 0.148 | 0.216 | 0.000 | 1.000 | 0.130 | 0.196 | 0.000 | 1.000 | 0.857 | 0.150 | 0.296 | 1.000 |
| T16 | 0.097 | 0.186 | 0.000 | 1.000 | 0.074 | 0.153 | 0.000 | 1.000 | 0.733 | 0.186 | 0.239 | 1.000 |
Table 7.
Technical efficiency by technology and year under the metafrontier.
| Technology | 2007 | 2008 | 2009 | 2010 | 2011 | 2012 | 2013 |
|---|---|---|---|---|---|---|---|
| T1 | 0.138 | 0.125 | 0.105 | 0.135 | 0.151 | 0.132 | 0.123 |
| T2 | 0.144 | 0.151 | 0.110 | 0.141 | 0.174 | 0.178 | 0.130 |
| T3 | 0.119 | 0.134 | 0.113 | 0.138 | 0.181 | 0.164 | 0.134 |
| T4 | 0.143 | 0.129 | 0.122 | 0.116 | 0.134 | 0.147 | 0.118 |
| T5 | 0.172 | 0.134 | 0.147 | 0.133 | 0.142 | 0.145 | 0.136 |
| T6 | 0.125 | 0.097 | 0.076 | 0.113 | 0.139 | 0.131 | 0.121 |
| T7 | 0.033 | 0.033 | 0.074 | 0.085 | 0.083 | 0.067 | 0.072 |
| T8 | 0.130 | 0.148 | 0.152 | 0.166 | 0.180 | 0.201 | 0.146 |
| T9 | 0.118 | 0.070 | 0.076 | 0.120 | 0.136 | 0.105 | 0.104 |
| T10 | 0.134 | 0.100 | 0.128 | 0.102 | 0.130 | 0.127 | 0.122 |
| T11 | 0.205 | 0.166 | 0.079 | 0.111 | 0.124 | 0.110 | 0.120 |
| T12 | 0.115 | 0.091 | 0.137 | 0.114 | 0.155 | 0.117 | 0.125 |
| T13 | 0.148 | 0.103 | 0.100 | 0.149 | 0.142 | 0.130 | 0.081 |
| T14 | 0.094 | 0.080 | 0.105 | 0.107 | 0.122 | 0.085 | 0.102 |
| T15 | 0.119 | 0.102 | 0.131 | 0.129 | 0.157 | 0.152 | 0.118 |
| T16 | 0.082 | 0.063 | 0.068 | 0.061 | 0.064 | 0.091 | 0.083 |
| All | 0.125 | 0.100 | 0.110 | 0.114 | 0.130 | 0.125 | 0.113 |
Table 8.
Technical efficiency by technology and organization type under the metafrontier.
| Technology | University | LE | SME | GRI | NRI | GM | Other |
|---|---|---|---|---|---|---|---|
| T1 | 0.141 | 0.091 | 0.050 | 0.128 | 0.101 | 0.036 | 0.088 |
| T2 | 0.153 | 0.000 | 0.051 | 0.138 | 0.092 | 0.000 | 0.115 |
| T3 | 0.161 | 0.175 | 0.048 | 0.107 | 0.124 | 0.026 | 0.058 |
| T4 | 0.131 | 0.083 | 0.045 | 0.130 | 0.092 | 0.116 | 0.097 |
| T5 | 0.146 | 0.073 | 0.035 | 0.137 | 0.060 | 0.000 | 0.132 |
| T6 | 0.148 | 0.065 | 0.038 | 0.118 | 0.082 | 0.000 | 0.010 |
| T7 | 0.070 | 0.003 | 0.034 | 0.077 | 0.064 | 0.016 | 0.008 |
| T8 | 0.204 | 0.066 | 0.042 | 0.169 | 0.096 | n/a | 0.048 |
| T9 | 0.130 | 0.044 | 0.035 | 0.125 | 0.072 | 0.014 | 0.049 |
| T10 | 0.149 | 0.052 | 0.041 | 0.136 | 0.097 | 0.000 | 0.051 |
| T11 | 0.125 | 0.047 | 0.047 | 0.152 | 0.136 | n/a | 0.091 |
| T12 | 0.132 | 0.048 | 0.046 | 0.119 | 0.037 | 0.000 | 0.055 |
| T13 | 0.136 | 0.061 | 0.029 | 0.076 | 0.095 | n/a | 0.056 |
| T14 | 0.127 | 0.046 | 0.047 | 0.157 | 0.102 | n/a | 0.073 |
| T15 | 0.149 | 0.101 | 0.051 | 0.166 | 0.126 | 0.004 | 0.097 |
| T16 | 0.095 | 0.065 | 0.038 | 0.092 | 0.041 | 0.015 | 0.029 |
| All | 0.134 | 0.058 | 0.043 | 0.130 | 0.080 | 0.016 | 0.062 |
© 2018 by the authors. Licensee MDPI, Basel, Switzerland. This article is an open access article distributed under the terms and conditions of the Creative Commons Attribution (CC BY) license (http://creativecommons.org/licenses/by/4.0/).
Share and Cite
MDPI and ACS Style
Park, J.H.; Shin, K. Efficiency of Government-Sponsored R&D Projects: A Metafrontier DEA Approach. Sustainability 2018, 10, 2316. https://doi.org/10.3390/su10072316
AMA Style
Park JH, Shin K. Efficiency of Government-Sponsored R&D Projects: A Metafrontier DEA Approach. Sustainability. 2018; 10(7):2316. https://doi.org/10.3390/su10072316
Chicago/Turabian StylePark, Jung Ho, and Kwangsoo Shin. 2018. "Efficiency of Government-Sponsored R&D Projects: A Metafrontier DEA Approach" Sustainability 10, no. 7: 2316. https://doi.org/10.3390/su10072316
Note that from the first issue of 2016, this journal uses article numbers instead of page numbers. See further details here.