Effects on Willingness to Pay for Marine Conservation: Evidence from Zhejiang Province, China


1
School of Business, Ningbo University, Ningbo 315211, China
2
Ningbo Ecological Civilization Construction Research Base, Ningbo 315211, China
3
Center for Collaborative Innovation on Port Trading Cooperation and Development, Ningbo University, Ningbo 315211, China
*
Authors to whom correspondence should be addressed.
Sustainability 2018, 10(7), 2298; https://doi.org/10.3390/su10072298
Submission received: 28 May 2018
/
Revised: 24 June 2018
/
Accepted: 29 June 2018
/
Published: 3 July 2018
(This article belongs to the Special Issue Environmental Policy for Sustainability)
Abstract
:The willingness to pay (WTP) for marine conservation is an important basis for the design of market-based marine protection strategies and sustainable marine environment development. Whether the individual was willing to pay and how much they would prefer to pay may be affected separately by different factors. Thus, we investigated the probability of paying for marine conservation and the payment amount to obtain evidence regarding the factors that influence the preferences of stakeholders. We considered two marine protected areas in Zhejiang Province, China, where we combined contingent valuation with logit and tobit models to measure the differences in the WTP for marine conservation between tourists and residents. The results showed that most respondents were willing to pay for marine conservation, but they were affected by different factors. The average amounts that the respondents were willing to pay were 216.20 CNY ($34.3) and 172.43 CNY ($27.4) in the Nanji Islands MPA and Putuo Islands MPA, respectively. The probability of respondents’ WTP was closely related to their individual environmental awareness, whereas the payment amount was influenced mainly by personal income. Thus, our results suggest that increasing human environmental cognition and developing differential payment schemes for the marine environment among stakeholders may promote sustainable marine protection development and management.
1. Introduction
Marine ecosystems are closely related to the welfare of human beings because they provide a wide array of services [1]. Marine protected areas (MPAs) have been advocated as effective management vehicles for promoting the long-term conservation of marine ecosystems and to generate substantial benefits in terms of human well-being [2,3]. According to MPAtlas reports (http://www.mpatlas.org), 3.7% of the world’s oceans are currently protected in MPAs and this will increase to 7% after the implementation of currently proposed MPAs or MPA networks. However, the establishment of an MPA often involves conflicts with stakeholders who are highly dependent on marine ecosystems [4,5]. In addition, the effectiveness of MPAs can be impeded by insufficient funding and a high reliance on natural resources by low-income populations [6,7]. Leisher et al. [8] suggested that socioeconomic factors are the primary determinants of the success or failure of MPAs. Islam et al. [9] also showed that participation by local people plays an important role in the effective management of MPAs in Malaysia. Thus, there is a need to prioritize considerations of willingness to participate in decision making by stakeholders to ensure the establishment and sustainable development of MPAs.
In recent decades, numerous studies have investigated the willingness to pay (WTP) for marine ecosystems for different purposes. The first purpose involves evaluating the ecosystem services provided by marine and coastal ecosystems. For example, Christie et al. [10] estimated the WTP for marine ecosystem services, including fishing, coastal protection, water quality, ecosystem resilience, beach recreation, and diving, among Caribbean tourists and residents. A similar case study was also conducted with Japanese residents to explore the monetary value of three main open ocean ecosystem services [11]. It is increasingly recognized that people failing to fully recognize the range of benefits obtained from “ecosystem services” accounts for much of the loss and degradation of ecosystems [12,13], which is likely to negatively impact the welfare of people living in coastal areas [14]. Thus, people who obtain environmental benefits should be expected to pay a certain amount of money to support ecosystem protection [15,16]. Thus, the amount that people are willing to pay could be considered in the design of market-based marine conservation strategies. Indeed, some WTP studies have focused on potential payments for environmental services programs for marine conservation. For instance, Barr and Mourato [17] explored the preferences of fishermen regarding hypothetical marine payments for environmental services management plans in Tanzania, while Castaño-Isaza et al. [18] determined the WTP by tourists for developing payments for environmental services programs to protect the beach in the Colombian Seaflower MPA. In addition, many WTP studies have been conducted to facilitate policymaking during the establishment and management of MPAs. For example, the WTP was evaluated in visitors to establish an MPA for bottlenose dolphins in Croatia [19]. The public preferences for different MPA management regimes and designs were also estimated separately for the North Sea and the U.S. west coast [20,21]. Moreover, the WTP by citizens to support marine biodiversity conservation and maintenance was explored in Italy [22].
The contingent valuation method (CVM) has been employed widely for examining the WTP by different groups throughout the world [23]. Quantitative analyses have been conducted using econometric models based on WTP survey data [24,25]. In these analyses, most studies have focused on exploring heterogeneous preferences and the factors that influence the WTP [26,27,28]. Differences in the WTP have been examined based on gender [29], income [30], culture [31], perception [32], regional location [33,34], and payment vehicle [35]. It was also shown that participation by stakeholders can be changed due to improvements in well-being and ecosystem health trends [36]. Moreover, observations have been presented from the perspectives of stakeholders where differences were found between locals and tourists, and coastal and non-coastal resident [4,37].
It can be concluded that the decision on whether to contribute to the environment would be affected by multiple factors, which can vary among different groups. Furthermore, the impact on the choice behavior of respondents regarding the WTP is related to different factors. Previous studies provided cost and benefit estimates regarding the protection of ecosystem services [38] to help policymakers consider human utility when developing diverse management options [39], but most WTP studies were not sufficiently comprehensive for making marine conservation and management decisions. Thus, to provide effective advice to facilitate the design of marine protection strategies, it is necessary to assess the WTP for marine conservation among different groups to identify the factors that might influence their likelihood of paying and the actual payment amounts.
In this study, we investigated the differences in the WTP for marine conservation by residents and tourists, where we identified the factors that might affect the possibility of paying and the specific amount paid. Considering the regional heterogeneity of preferences, we considered two case studies where we fully analyzed the characteristics and differences in the WTP between stakeholders. The remainder of this paper is organized as follows. In Section 2, we describe the status of the Nanji Islands MPA and Putuo Islands MPA in China. The CVM and survey administered to elicit the WTPs are introduced in Section 3. The main results are presented in Section 4. We discuss the results and their implications in Section 5. We give our conclusions in Section 6.
2. Cases Studies: Two MPAs in Zhejiang Province, China
Zhejiang Province is located in the middle of the southeast coast of China. It has rich marine resources and ranks first in China in terms of the coastline length and number of islands. To protect the marine ecosystem, 13 marine nature protected areas and special protected areas have been established in Zhejiang. According to the characteristics of the MPAs, two typical sites were selected as case studies to investigate stakeholders’ preferences and differences in terms of WTP for marine conservation.
The Nanji Islands MPA located in the eastern part of Pingyang County, Zhejiang Province covers an area of 200 km2. This MPA was established in 1990 and it was one of the first state-level marine nature reserves approved by the State Council. The area is an important gene pool of algae and shellfish in China’s sea areas, and thus it is of great significance for biodiversity conservation in China and the world. The Nanji Islands government had implemented ecological compensation measures since 2011 and guided residents to develop the eco-tourism industry among the national MPA. The residents around the MPA and tourists are the main factors that actually promote the construction of protected areas. Therefore, it is necessary to determine their preferences and the WTP for marine conservation to strengthen the protection in Nanji Islands MPA.
The Putuo Zhongjieshan Islands MPA is located in the eastern part of the Zhoushan Archipelago in Zhejiang Province and it has a total area of 202.9 km2. This MPA was established in 2005 and it was one of the first state-level marine special protection areas designated by the State Oceanic Administration. The rich vegetation resources, island reefs, ports, and tourism have contributed greatly to the rapid development of the local marine economy. To alleviate the contradiction between marine conservation and economic development, the State Oceanic Administration established Putuo Zhongjieshan Islands MPA as a National Marine Park in 2017 and strengthened the management of human activities and behavior. Therefore, it is important to investigate the preferences and WTP for marine conservation among locals and tourists to facilitate the development of the national marine park.
3. Methods
3.1. CVM
CVM is a survey-based technique for eliciting preferences regarding a wide range of non-market environmental changes [40,41]. In surveys, people are asked to state their minimum willingness to accept (WTA) or maximum WTP for a hypothetical change in the level of provision of the good or service of interest [7]. In addition to measuring the non-market value, CVM has been used widely to investigate the associations between socioeconomic factors and ecosystem services [42,43]. In the current study, CVM was employed to measure the WTP for marine conservation by stakeholders and to identify the key factors that affected their preferences.
The only assumptions in CVM are that the respondents know their personal preferences and that they are willing to honestly state their willingness. In particular, the individual has a consumer preference for goods and environmental comforts, and the utility function of consumers can be expressed as:
where q represents the marine environment condition, y is personal income, x denotes other factors that affect individual preferences, and ε are random factors caused by individual preferences and measurement errors. The factor x has also been divided into two categories in this study, in which x1i stands for sociodemographic characteristics, and x2j stands for individual environmental awareness. Assuming that all other conditions remain unchanged, the marine environmental condition q changes from q0 to q1, and the individual utility u will then change correspondingly from U0 to U1. This utility change can be measured using indirect utility functions:
where C is the compensation change expressed in terms of WTP and WTA in CVM. It represents the amount of money that an individual is willing to pay for environmental improvement or to accept for environmental degradation when the utility remains unchanged.
CVM has received some criticism due to “hypothetical bias” [44] and “yes-saying bias” [45], but it can still influence policymakers by indicating that it is feasible to use an economic incentive to make stakeholders protect the environment [46]. Moreover, the experimental bias can be reduced by adopting a reasonable design. Thus, the CVM was used in this study to elicit the WTP to protect marine environments among tourists and residents. Our findings could facilitate the development of related policies for marine conservation.
3.2. Survey Design and Implementation
In this study, we examined the marine conservation preferences in different types of interest groups (such as tourists and residents) and identified the factors that might influence their decisions. According to previous studies, the awareness and knowledge of respondents regarding environmental benefits were an important precondition for eliciting the non-use values ascribed to ecosystems [47]. Thus, a cover letter about the importance of MPAs and ecological services was provided in advance to reduce the possibility of bias among respondents. The CVM questionnaire was comprised of three parts. Part I collected socioeconomic information as general factors that might influence payment decisions, including gender, age, location, education, group type (tourist or local), and income. In particular, interval scale measurements were used for sensitive factors such as income and age. Part II investigated how the awareness of respondents might affect the payment decision, such as their attitudes to marine conservation, understanding of relevant protection policies, satisfaction with the quality of marine water, and personal dependence on the ocean. Part III measured the WTP for marine conservation. If the subject was willing to pay, then the payment amount was elicited. If they were unwilling to pay, then they were asked to give a reason. An open-ended question and a payment card were employed to obtain the responses. For bid departure deviations, the option intervals for the payment card were designed by combining the income levels of local residents and the pre-survey results. Next, an open-ended item was used to ask the respondents for the maximum WTP amount. The key questions were as follows.
Would you be willing to pay for marine conservation, which would lead to an improved environment with high species biodiversity, high water quality, good coastal protection with no threat of flooding, and high-quality recreational facilities?
Yes___ No ___
If yes, how much are you willing to pay for marine conservation per year (CNY)?
1___ 10___ 50___ 100___ 200___ 300___ 500___ 800___ 1000___
Your maximum WTP for marine conservation is_____CNY.
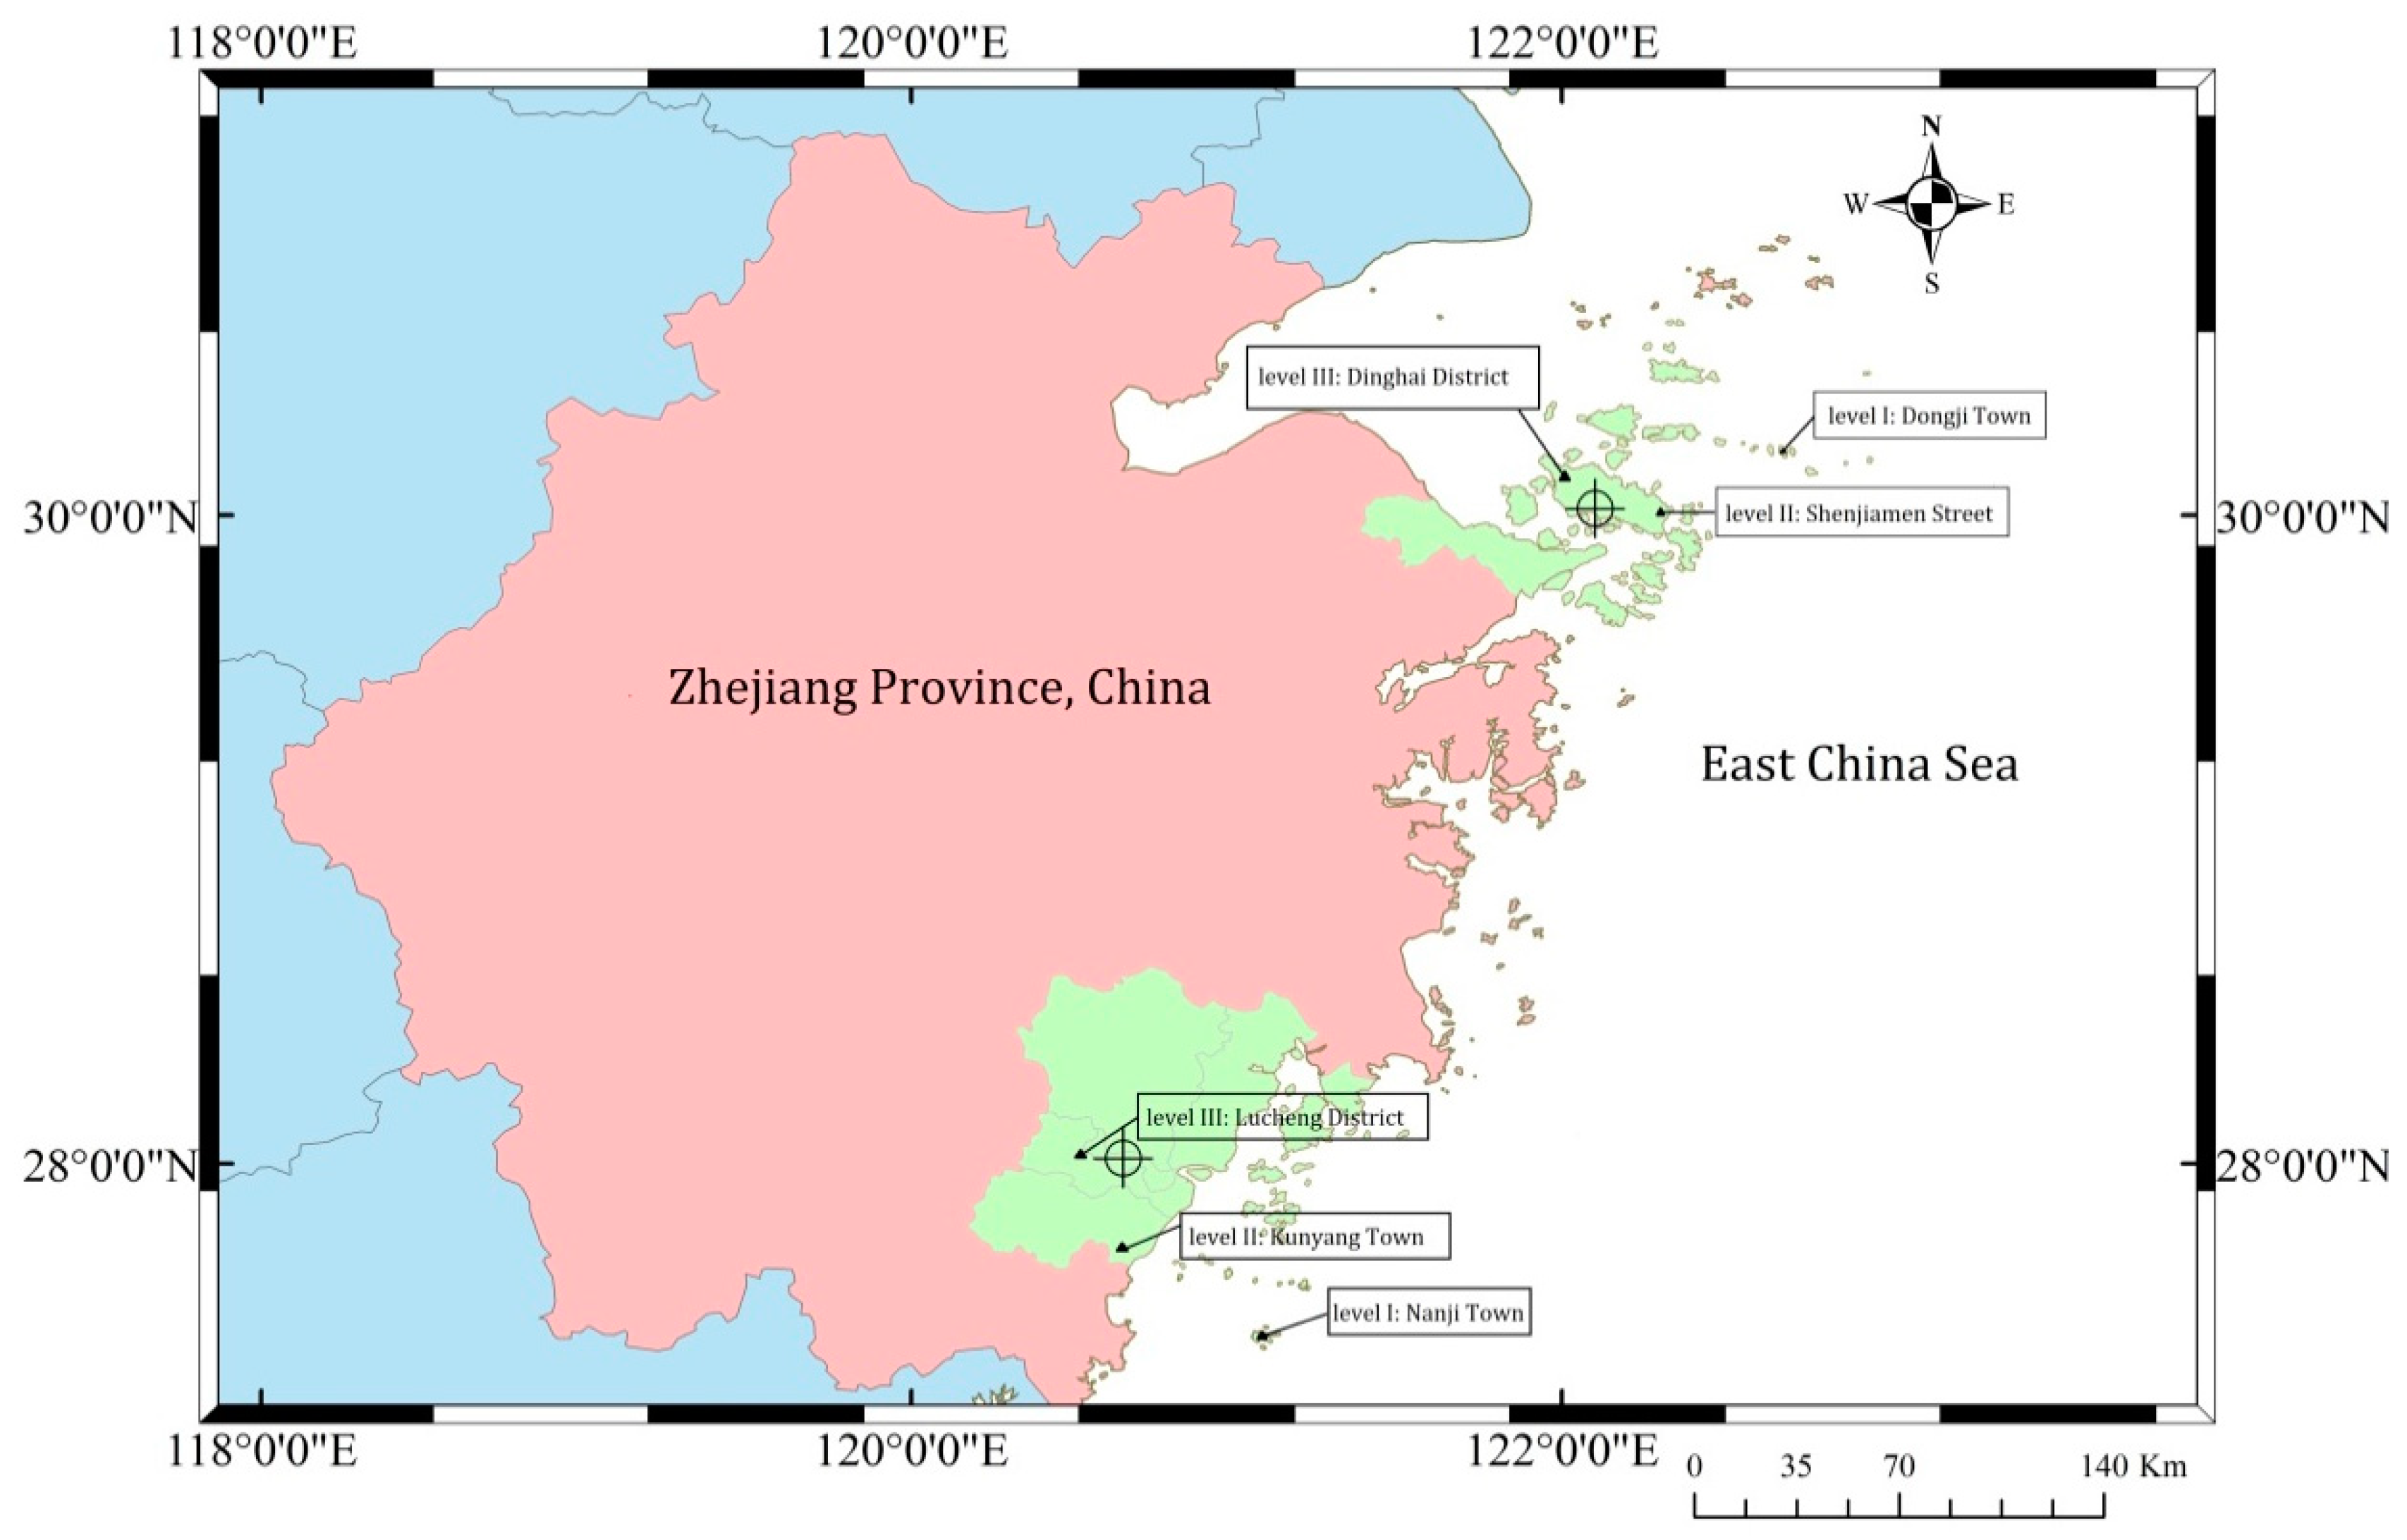
In addition, we examined the influence of spatial heterogeneity on the preferences of respondents. We employed stratified sampling, a typical sampling scheme, and a snowball sampling method in a questionnaire survey. First, each case study area was divided into three levels (I, II, and III) according to the distance from the MPAs. At each level, the government location was selected as a typical area for investigation. The final investigation sites for the Nanji Islands MPA were: Nanji Town (I)—Kunyang Town, Pingyang County (II)—Lucheng District, Wenzhou City (III). The final investigation areas for the Putuo Zhongjieshan Islands MPA were: Dongji Town (I)—Shenjiamen Street (II)—Dinghai District, Zhoushan City (III) (Figure 1). Due to the scattered distribution of residents on the islands, the research team also employed a snowball sampling method to obtain more accurate survey results.
The formal survey was conducted from 4 July to 31 July 2017. In face-to-face interviews, 848 respondents were interviewed and 799 valid questionnaires were collected. Data of uncompleted questionnaires were not included in the analysis. The detailed distribution is shown in Table 1 and the main variables obtained from the survey are shown in Table 2.
3.3. Econometric Model
In this study, two econometric models were employed to investigate the WTP of stakeholders. A logit model was used to investigate the factors that affected the likelihood of respondents paying. A tobit model was used to examine the key factors that influenced the bid values. Therefore, the paying and bidding decisions of stakeholders could be analyzed using this two-step process elicitation format.
Logit model for Willingness decision making analysis: A discrete choice format questions was designed to investigate whether the respondent was willing to pay for marine conservation, as follows.
Thus, a logit model could be used to fit the dichotomous response variables and to investigate the key factors. This model can be expressed as
where P represents the probability of willingness by respondents and x is the explanatory variable. Maximum likelihood estimation is employed to determine the parameter β.
Tobit model for WTP bidding analysis: The variable payment for marine conservation is a restricted dependent variable, as follows.
According to random utility analysis, the WTP can be influenced by environmental and personal variables, as follows:
where e is an independently and normally distributed error term with mean zero and standard deviation σ. Considering the true distribution of willingness, bidding was censored at zero and the tobit model was used to analyze the WTP values, as recommended in other studies to solve the issue of true-zero responses [48,49]. Thus, the conditional expectation for the WTP is given by:
where F and f are the distribution and density function, respectively. Frequently, one of the normal, logistic and extreme distributions is used for the error distribution. Maximum likelihood estimation was also employed to estimate the parameters β and σ.
4. Results
4.1. Descriptive Statistics
The sociodemographic characteristics of the respondents are presented in Table 3. The samples surveyed in the Nanji Islands and Putuo Islands had similar demographic characteristics in terms of their gender, age, education, and income. For example, the two samples had similar gender ratios, with slightly more male respondents than female respondents. The respondents in both studies were mostly young and middle-aged, with ages between 20 and 59 years. The annual household income was mainly distributed between 50,000 and 200,000 CNY, which was similar to the actual per capita income level in Zhejiang Province. The majority of the respondents had attended secondary or higher education, which to some extent ensured that they had sufficient cultural basis and judgment to assess the validity of the questionnaire. In the Nanji Islands and Putuo Islands, 42.61% and 17.25% of the respondents were tourists, respectively. The tourists in both samples were mainly from the level I region, whereas the residents were surveyed in level II and III regions. According to the actual investigations, the residents were few and extremely scattered in the Nanji Islands (level I), so the effective samples in the level I region were mainly tourists with few local residents. From this perspective, the respondents surveyed in level I region mainly reflected the sociodemographic characteristics of tourists, while respondents surveyed in level II and III regions mainly reflected residents’.
The environmental awareness of respondents was surveyed according to the six categories in Table 4. In the Nanji Islands and Putuo Islands, 26.82% and 31.25% of the respondents had high dependence on the ocean, respectively. Moreover, both samples showed the respondent located close to the ocean had a high degree of dependence. For both surveys, the satisfaction of the respondents with the marine environment was relatively low, where the proportions of satisfied, dissatisfied, and neutral attitudes each accounted for about one-third. This also highlighted the urgency of protecting the marine ecological environment. More than half of the respondents had positive attitudes regarding participating in marine protection activities. However, most people were not accepting if the protection behaviors damaged their private interests (62.16% in the Nanji Islands and 67.75% in the Putuo Islands). There was a significant difference in the attitude to preventing others from damaging the ocean, where 55.89% respondents from the Nanji Islands stated yes but only 11.5% of those from the Putuo Islands. Furthermore, the statistics showed that the respondents had a relatively low level of knowledge about marine policy, where 35–42% of the respondents indicated that they did not know any protection policies related to the marine environment.
At the end of the surveys, we determined the Willingness and WTP for marine conservation. The probabilities of “yes” responses for marine conservation were presented in Table 5, and the statistical distribution for WTP amount in different locations was shown in Table 6. It demonstrates that not all of the subjects were willing to pay for marine conservation, and the frequency of bidding 100 CNY was the highest in both cases. However, the average annual WTP amount was slightly higher in the Nanji Islands than the Putuo Islands, i.e., 216.2 and 172.43 CNY, respectively. This result suggests that on average, the respondents from the Nanji Islands and Putuo Islands were willing to pay 216.2 and 172.43 CNY, respectively, for an improved marine environment and ecosystem services. In addition, the data indicated that there were differences in the WTP amounts in terms of the locations of the respondents, with different patterns in both cases. Therefore, we analyzed the WTP for marine conservation by stakeholders in terms of the factors that affected their willingness and the factors that affected the payment amount.
4.2. Modeling Results
The logit modeling results obtained using STATA software are shown in Table 7. According to the estimated marginal effects of the explanatory variables, the variables with important effects on the WTP for marine conservation were identified in both cases.
In the Nanji Islands MPA, the results indicated that the satisfaction, att_protect, and know variables had positive impacts, whereas group and rely had negative impacts on Willingness. Thus, environmental awareness among the respondents significantly affected their likelihood of paying. As expected, higher satisfaction increased the likelihood that respondents would pay. A positive protection attitude was also positively correlated with the WTP by respondents. Increasing the knowledge of policies would positively influence the paying decisions of respondents. The results also indicated that the possibility of being willing to pay for marine conservation was 6.2% lower among tourists than residents. Combined with the statistical analysis of the Nanji Islands MPA data, we found that many respondents who had high reliance on the ocean in the sample were tourists and they had little knowledge of related policies, which may explain why a lower dependence on the ocean was related to a higher probability of paying. Hence, the Willingness variable was comprised of many factors and it was not appropriate for obtaining a one-sided explanation in isolation.
In the Putuo Islands MPA, the results showed that the location, rely, satisfaction, att_protect, and att_loss variables had effects on Willingness. We found that respondents located farther away from the MPA were relatively more likely to pay. The dependence on the ocean was also positively associated with the likelihood of paying by respondents, which was different from the results obtained in the Nanji Islands. The respondents with positive protection attitudes were more likely to pay. However, the likelihood of paying decreased slightly if the respondent was not able to accept damage to their private interests during the marine conservation process. This was consistent with the statistical analysis of marine protection participation by respondents according to the different survey areas.
Furthermore, the tobit model results identified the factors that affected the amounts that individuals were willing to pay for marine conservation (Table 8 and Table 9). To examine the robustness of our estimation, a two-part model was introduced. Within this model, we predicted the probability of having willingness for marine conservation using a logistic regression (1st part, same to logit model) and the WTP amount for marine conservation using an OLS regression (2nd part), where only positive willingness responses were included in the analysis (i.e., willingness = 1). As a result of this model, the significance of the most influencing factors was consistent, which reflected the results would be robust to a certain extent.
In the Nanji Islands MPA, the factors were ranked in terms of importance as: income, group, and know. Income was highly significant at the 1% level and it had a positive effect on the amount. The amount increased with the income of the respondents. The effect of group was also significant, where the average amount for tourists was 88.76 CNY lower than that for residents. In addition, know had positive effects on the payment amount. The amount increased with the knowledge of relevant policies among respondents.
In the Putuo Islands MPA, the payment amounts were associated with income, location, job, education, age, and group in order of importance. Household income still had the most significant effect, which was consistent with the findings in the Nanji Islands MPA. Furthermore, location negatively affected the amount, where the average difference between locations was 40.89 CNY. Another interesting finding was that the amounts were associated with the jobs of the respondents. According to the estimates, administration staff would pay 159.63 CNY more than those in other occupations, and students would pay 90.46 CNY less. Moreover, higher educational levels positively influenced the payment amounts, and older people would generally pay less than younger respondents. In addition, the groups were weakly related to the amount, where tourists would pay 56.07 CNY more than residents on average.
5. Discussion and Implications
5.1. Payment Possibility and Payment Amounts
According to the results obtained using the logit and tobit models, we made some interesting findings, as follows.
First, in both the Nanji Islands MPA and Putuo Island MPA, Willingness and the WTP for marine conservation were related to different factors, where the former depended mainly on individual environmental awareness and the latter was influenced mostly by demographic characteristics, such as income, age, and education. We can conclude that the possibility of paying was based on subjective considerations, where the specific payment amount was significantly influenced by income and the objective ability to actually pay.
Second, both Willingness and WTP were influenced by the types of stakeholders. These differences were reflected in the Nanji Islands MPA by group and in the Putuo Islands MPA by location. Thus, in the Nanji Islands, the residents and tourists differed significantly in terms of their WTP. However, the regional heterogeneity of WTP was more obvious in the Putuo Islands, where the influences of stakeholders varied among different regions.
Third, the factors that affected Willingness and WTP varied among the different cases. The factors that affected Willingness were rely, satisfaction, att_protect, and know in the Nanji Islands MPA, but rely, att_protect, and att_loss in the Putuo Islands MPA. This difference was related to the characteristics of the two MPAs. The Nanji Islands MPA was established earlier than the Putuo Islands MPA, and it also took the lead in implementing some ecological compensation policies. The Nanji Islands are less geographically accessible, which may make the marine environment more attractive. Therefore, knowledge of policies and satisfaction with the marine environment had positive impacts on the willingness among respondents. The Putuo Islands are currently open to the public for free and there is no specific marine ecological compensation policy. Thus, the respondents may have considered their own interests slightly more when considering whether to pay for marine conservation. In terms of the WTP amount, the average amount that respondents in the Nanji Islands were willing to pay was 216.2 CNY, which was higher than that in the Putuo Islands (172.43 CNY). The fare policy might have influenced the payment amount to some extent. In the Nanji islands, the respondents were inclined to use the price of tickets for entering the Nanji Islands (100 CNY) as a reference when selecting the payment amount. By contrast, there was no charge for entering the Putuo Islands, so this phenomenon was not observed.
5.2. Comparisons with Other Studies
Our results are compared with those obtained in related WTP studies in Table 10. This comparison shows that sociodemographic characteristics and environmental awareness were the two main categories of factors that affected the WTP. Moreover, these results also demonstrate that there were significant differences in the WTP among stakeholders, which were related to marine utilization and the distance from marine resources. For example, similar to our results, studies in the UK and Italy also found that the WTP was affected by previously visiting the protected area and the distance from the area.
Among the sociodemographic characteristics, income was the only common factor in each study, where a higher income was correlated with a higher payment amount, whereas the other factors varied among areas. Education always had a positive impact on the WTP [22,51], whereas the effects of age and gender were unclear [20,50]. In addition, job type had an effect in some case, e.g., being a fisherman affected the WTP among tourists in MPAs in Mexico [7].
In terms of awareness, there were several similarities and differences. The degree of satisfaction with the environment in MPAs, assessments of the importance of MPAs (represented by rely in this study), and the knowledge of MPAs were all important factors in previous studies. In different conditions, such as being able to access the MPA, favoring an MPA, institutional trust, and MPA management had important effects on the WTP of respondents, and thus they cannot be ignored. Variables such as survey methods and entrance fees also had effects on the WTP.
5.3. Implications for Marine Environmental Protection
The results obtained in this study provide important guidance for marine environmental conservation and management.
First, we found that most stakeholders were willing to pay for marine conservation. According to the comparisons, the average payment amount was slightly high in this study, which was related to the better development of the local economy. Thus, it may be possible to develop market-based strategies for marine conservation in Zhejiang Province, China.
Second, WTP is a prerequisite for using environmental market tools for environmental protection. The likelihood of the WTP was influenced mainly by individual cognitive factors, which may suggest various strategies. According to the estimates, increasing public enthusiasm could be important for promoting marine conservation. Thus, the government should enhance environmental information provision and increase the public understanding of related protection policies.
Third, we provided more insights into the design of marine protection policies. For instance, the policies need to be formulated in accordance with the preferences and abilities of stakeholders. The payment amounts preferred by tourists and residents differed due to the diverse benefits that they enjoyed from marine ecosystem services. Thus, various payment methods should be implemented for different groups, such as entrance fees and protected actions. Differentiated payment standards based on considerations of the region and income level should also be recommended.
6. Conclusions
In this study, we explored the potential of using market-based approaches to marine conservation by investigating the willingness of different stakeholders to pay for marine conservation. The individual WTP was analyzed in two-step where we determined whether the individual was willing to pay and how much they would prefer to pay. According to this process, a CVM design was used to elicit the preferences of different groups. Logit and tobit models were employed separately to identify the important variables that affected the payment possibility and the payment amounts for marine conservation. In face-to-face interviews, 799 valid questionnaires were collected, and the most important findings obtained in this study were as follows.
Most respondents reported a WTP for marine conservation, where the likelihoods of paying by the respondents were 93.2% and 92.3% in the Nanji Islands MPA and Putuo Islands MPA, respectively, and the average WTP amounts for these respondents were 216.20 CNY ($34.3) and 172.43 CNY ($27.4). Furthermore, there were significant differences in the factors that affected the willingness of individuals to pay and the payment amounts according to the estimates obtained by the models. The payment possibility was influenced mainly by individual environmental awareness factors, such as protection attitudes, related policy knowledge, marine dependence, and other subjective judgments about MPAs, whereas the payment amount was affected significantly by demographic characteristics, such as income, gender, education, age, and other sociodemographic characteristics. Furthermore, stakeholders had different WTP preferences, including tourist and locals, and urban citizens and rural residents. These results could help decision makers to integrate the WTP preferences of stakeholders into decisions regarding MPA management in the future.
Author Contributions
B.Y. had the original idea for the study and wrote the paper. Y.C. contributed to data collection. L.J. contributed to calculation analysis. B.D. contributed to the manuscript modification. All authors have read and approved the final manuscript.
Acknowledgments
This paper is financially supported by National Social Science Fund (18CJY007, 16ZDA050), Philosophical and Social Science Base Project of Zhejiang (16JDGH040), Ningbo Social Science Research Base Project (JD18STWM-2), and K.C. Wong Magna Fund in Ningbo University. We are grateful to Chuanzhong Li of Uppsala University and Yuanyao Ding of Ningbo University for their helpful advice and grateful to the many respondents who agreed to participate in our study. In addition, we thank the editors and the anonymous reviewers of this manuscript for their careful work.
Conflicts of Interest
The authors declare no conflict of interest.
References
- Himes-Cornell, A.; Pendleton, L.; Atiyah, P. Valuing ecosystem services from blue forests: A systematic review of the valuation of salt marshes, sea grass beds and mangrove forests. Ecosyst. Serv. 2018, 30, 36–48. [Google Scholar] [CrossRef]
- Carr, M. Marine protected areas: Challenges and opportunities for understanding and conserving coastal marine ecosystems. Environ. Conserv. 2000, 27, 106–109. [Google Scholar] [CrossRef]
- Potts, T.; Burdon, D.; Jackson, E.L.; Atkins, J.; Saunders, J.; Hastings, E.; Langmead, O. Do marine protected areas deliver flows of ecosystem services to support human welfare? Mar. Policy 2014, 44, 139–148. [Google Scholar] [CrossRef] [Green Version]
- Kamil, K.A.; Hailu, A.; Rogers, A. An assessment of marine protected areas as a marine management strategy in Southeast Asia: A literature review. Ocean Coast. Manag. 2017, 145, 72–81. [Google Scholar] [CrossRef]
- Manaf, A.A.; Samsuddin, M.; Omar, M. Marine park gazettement impacts on Pulau Tinggi community in Mersing, Johor. J. Trop. Mar. Ecosyst. 2011, 1, 35–43. Available online: http://spaj.ukm.my/ekomar/jtme/article/view/12/10 (accessed on 2 April 2018).
- Depondt, F.; Green, E. Diving user fees and the financial sustainability of marine protected areas: Opportunities and impediments. Ocean Coast. Manag. 2006, 49, 188–202. [Google Scholar] [CrossRef]
- Barr, R.; Mourato, S. Investigating the potential for marine resource protection through environmental service markets: An exploratory study from La Paz, Mexico. Ocean Coast. Manag. 2009, 52, 568–577. [Google Scholar] [CrossRef]
- Leisher, C.; Mangubhai, S.; Hess, S.; Widodo, H.; Soekirman, T.; Tjoe, S.; Wawiyai, S.; Larsen, S.N.; Rumetna, L.; Halim, A.; et al. Measuring the benefits and costs of community education and outreach in marine protected areas. Mar. Policy 2012, 36, 1005–1011. [Google Scholar] [CrossRef]
- Islam, G.M.N.; Tai, S.Y.; Kusairi, M.N.; Shuib, A.; Aswani, F.M.N.; Senan, M.K.A.M.; Ahmad, A. Community perspectives of governance for effective management of marine protected areas in Malaysia. Ocean Coast. Manag. 2017, 135, 34–42. [Google Scholar] [CrossRef]
- Christie, M.; Remoundou, K.; Siwicka, E.; Wainwright, W. Valuing marine and coastal ecosystem service benefits: Case study of St Vincent and the Grenadines’ proposed marine protected areas. Ecosyst. Serv. 2015, 11, 115–127. [Google Scholar] [CrossRef]
- Shen, Z.H.; Wakita, K.; Oishi, T.; Yagi, N.; Kurokura, H.; Blasiak, R.; Furuya, K. Willingness to pay for ecosystem services of open oceans by choice based conjoint analysis: A case study of Japanese residents. Ocean Coast. Manag. 2015, 103, 1–8. [Google Scholar] [CrossRef]
- Douglas, L. Encyclopedia of the Anthropocene. In Ecosystems and Human Well-Being; Elias, S.A., Ed.; Oxford University Press: New York, NY, USA, 2018; pp. 185–197. ISBN 978-01-2813-576-1. [Google Scholar]
- Ngoc, Q.T.K. Impacts on the ecosystem and human well-being of the marine protected area in Cu Lao Cham, Vietnam. Mar. Policy 2018, 90, 174–183. [Google Scholar] [CrossRef]
- Van Beukering, P.; Brander, L.; Tompkins, E.; McKenzie, E. Valuing the Environment in Small Islands—An Environmental Economics Toolkit; Joint Nature Conservation Committee: Peterborough, UK, 2007; ISBN 978-18-6107-594-9. [Google Scholar]
- Pagiola, S.; Arcenas, A.; Platais, G. Can payments for environmental services help reduce poverty? An exploration of the issues and the evidence to date from Latin America. World Dev. 2005, 33, 237–253. [Google Scholar] [CrossRef]
- Engel, S.; Pagiola, S.; Wunder, S. Designing payments for environmental services in theory and practice: An overview of the issues. Ecol. Econ. 2008, 65, 663–674. [Google Scholar] [CrossRef] [Green Version]
- Barr, R.F.; Mourato, S. Investigating fishers’ preferences for the design of marine Payments for Environmental Services schemes. Ecol. Econ. 2014, 108, 91–103. [Google Scholar] [CrossRef] [Green Version]
- Castaño-Isaza, J.; Newball, R.; Roach, B.; Lau, W.W.Y. Valuing beaches to develop payment for ecosystem services schemes in Colombia’s Sea flower marine protected area. Ecosyst. Serv. 2015, 11, 22–31. [Google Scholar] [CrossRef]
- Batel, A.; Basta, J.; Mackelworth, P. Valuing visitor willingness to pay for marine conservation—The case of the proposed Cres-Losinj Marine Protected Area, Croatia. Ocean Coast. Manag. 2014, 95, 72–80. [Google Scholar] [CrossRef]
- Brouwer, R.; Brouwer, S.; Eleveld, M.A.; Verbraak, M.; Wagtendonk, A.J.; van der Woerd, H.J. Public willingness to pay for alternative management regimes of remote marine protected areas in the North Sea. Mar. Policy 2016, 68, 195–204. [Google Scholar] [CrossRef]
- Wallmo, K.; Kosaka, R. Using choice models to inform large marine protected area design. Mar. Policy 2017, 83, 111–117. [Google Scholar] [CrossRef] [Green Version]
- Tonin, S. Citizens’ perspectives on marine protected areas as a governance strategy to effectively preserve marine ecosystem services and biodiversity. Ecosyst. Serv. 2018. [Google Scholar] [CrossRef]
- Carson, R.T. Contingent valuation: A user’s guide. Environ. Sci. Technol. 1999, 40, 3463–3473. [Google Scholar] [CrossRef]
- Awad, I.M. Using econometric analysis of willingness-to-pay to investigate economic efficiency and equity of domestic water services in the West Bank. J. Socio-Econ. 2012, 41, 485–494. [Google Scholar] [CrossRef]
- Arabatzis, G.; Malesios, C. An econometric analysis of residential consumption of fuelwood in a mountainous prefecture of Northern Greece. Energy Policy 2011, 39, 8088–8097. [Google Scholar] [CrossRef]
- Yang, X.; Burton, M.; Cai, Y.; Zhang, A. Exploring Heterogeneous Preference for Farmland Non-market Values in Wuhan, Central China. Sustainability 2016, 8, 12. [Google Scholar] [CrossRef]
- Rashid, R.; Muresan, I.C.; Arion, F.H.; Dumitras, D.E.; Lile, R. Analysis of Factors that Influence the Willingness to Pay for Irrigation Water in the Kurdistan Regional Government, Iraq. Sustainability 2015, 7, 9574–9586. [Google Scholar] [CrossRef] [Green Version]
- Combes, J.L.; Hamit-Haggar, M.; Schwartz, S. A multilevel analysis of the determinants of willingness to pay to prevent environmental pollution across countries. Soc. Sci. J. 2018. [Google Scholar] [CrossRef]
- López-Mosquera, N. Gender differences, theory of planned behavior and willingness to pay. J. Environ. Psychol. 2016, 45, 165–175. [Google Scholar] [CrossRef]
- Tyllianakis, E.; Skuras, D. The income elasticity of Willingness-To-Pay (WTP) revisited: A meta-analysis of studies for restoring Good Ecological Status (GES) of water bodies under the Water Framework Directive (WFD). J. Environ. Manag. 2016, 182, 531–541. [Google Scholar] [CrossRef] [PubMed]
- Hynes, S.; Ghermandi, A.; Norton, D.; Williams, H. Marine recreational ecosystem service value estimation: A meta-analysis with cultural considerations. Ecosyst. Serv. 2018. [Google Scholar] [CrossRef]
- Marsh, D.K.; Mkwara, L.; Scarpa, R. Do Respondents’ Perceptions of the Status Quo Matter in Non-Market Valuation with Choice Experiments? An Application to New Zealand Freshwater Streams. Sustainability 2011, 3, 1593–1615. [Google Scholar] [CrossRef] [Green Version]
- Broch, S.W.; Strange, N.; Jacobsen, J.B.; Wilson, K.A. Farmers’ willingness to provide ecosystem services and effects of their spatial distribution. Ecol. Econ. 2013, 92, 78–86. [Google Scholar] [CrossRef]
- Zhao, Y.; Zhang, Y.; Xiong, G.B.; Yan, W. Willingness-to-pay for ecosystem services of Ganjiang River and its value assessment: A regional heterogeneity perspective. Acta Ecol. Sin. 2018, 38, 1698–1710. (In Chinese) [Google Scholar] [CrossRef]
- Syed, S.A.; Hoag, D.; Loomis, J. Is willingness to pay for freshwater quality improvement in Pakistan affected by payment vehicle? Donations, mandatory government payments, or donations to NGO’s. Environ. Econ. Policy Stud. 2017, 19, 807–818. [Google Scholar] [CrossRef]
- Ban, N.C.; Davies, T.E.; Aguilera, S.E.; Brooks, C.; Cox, M.; Epstein, G.; Evans, L.S.; Maxwell, S.M.; Nenadovic, M. Social and ecological effectiveness of large marine protected areas. Glob. Environ. Chang. 2017, 43, 82–91. [Google Scholar] [CrossRef]
- Christie, P. Marine protected areas as biological successes and social failures in Southeast Asia. Am. Fish. Soc. Symp. 2004, 42, 155–164. [Google Scholar] [CrossRef]
- Susilo, H.; Takahashi, Y.; Yabe, M. The Opportunity Cost of Labor for Valuing Mangrove Restoration in Mahakam Delta, Indonesia. Sustainability 2017, 9, 2169. [Google Scholar] [CrossRef]
- Granek, E.F.; Polasky, S.; Kappel, C.V.; Reed, D.J.; Stoms, D.M.; Evamaria, W.K.; Kennedy, C.J.; Cramer, L.A.; Hacker, S.D.; Barbier, E.B.; et al. Ecosystem services as a common language for coastal ecosystem-based management. Conserv. Biol. 2010, 24, 207–216. [Google Scholar] [CrossRef] [PubMed]
- Bisshop, R.C. Mitchell, Robert Cameron, and Richard T. Carson. In Using Surveys to Value Public Goods: The Contingent Valuation Method; Resources for the Future: Washington, DC, USA, 1989; ISBN 978-09-1570-732-4. [Google Scholar]
- Bateman, I.J.; Carson, R.T.; Day, B.; Hanemann, M.; Hanleys, N.; Hett, T.; Jones-Lee, M.J.; Loomes, G.; Mourato, S.; Ozdemiroglu, E.; et al. Economic valuation with stated preference techniques: A manual. Ecol. Econ. 2004, 50, 155–156. [Google Scholar] [CrossRef]
- Martín-López, B.; Iniesta-Arandia, I.; García-Llorente, M.; Palomo, I.; Casado-Arzuaga, I.; Amo, D.G.D.; Gómez-Baggethun, E.; Oteros-Rozas, E.; Palacios-Agundez, I.; Willaarts, B.; et al. Uncovering ecosystem service bundles through social preferences. PLoS ONE 2012, 7, e38970. [Google Scholar] [CrossRef] [PubMed]
- Castro, A.J.; Verburg, P.H.; Martín-López, B.; Garcia-Llorente, M.; Cabello, J.; Vaughn, C.C.; López, E. Ecosystem service trade-offs from supply to social demand: A landscape-scale spatial analysis. Landsc. Urban Plan. 2014, 132, 102–110. [Google Scholar] [CrossRef]
- Neill, H.R.; Cummings, R.G.; Ganderton, P.T.; Harrison, G.W.; Mcguckin, T. Hypothetical surveys and real economic commitments. Land Econ. 1994, 70, 145–154. [Google Scholar] [CrossRef]
- Harris, J.M.; Roach, B. Environmental and Natural Resource Economics: A Contemporary Approach, 3rd ed.; Global Development and Environment Institute at Tufts University: Boston, MA, USA, 2013; ISBN 978-0-7656-3792-5. [Google Scholar]
- Whittington, D.; Pagiola, S. Using contingent valuation in the design of payments for environmental services mechanisms: A review and assessment. World Bank Res. Obs. 2012, 27, 261–287. [Google Scholar] [CrossRef] [Green Version]
- Lindeboom, H.J.; van Kessel, J.G.; Berkenbosch, L. Areas with Special Ecological Values on the Dutch Continental Shelf; RIKZ Report 2005.008 and Alterra Report 1203; Ministerie van Verkeer en Waterstaat: The Hague, The Netherlands, 2005; ISBN 90-369-3415-X. [Google Scholar]
- Ojeda, M.I.; Mayer, A.S.; Solomon, B.D. Environmental valuation of environmental services sustained by water flows in the Yaqui river delta. Ecol. Econ. 2008, 65, 155–168. [Google Scholar] [CrossRef]
- Awad, I.M.; Hollander, R. Toward efficient, equitable and sustainable municipal water supplies for domestic purposes in the west bank: A contingent valuation analysis. Eur. Water 2010, 31, 13–20. Available online: http://www.ewra.net/ew/pdf/EW_2010_31_02.pdf (accessed on 27 February 2014).
- Jobstvogt, N.; Watson, V.; Kenter, J.O. Looking below the surface: The cultural ecosystem service values of UK marine protected areas (MPAs). Ecosyst. Serv. 2014, 10, 97–110. [Google Scholar] [CrossRef] [Green Version]
- Wang, P.W.; Jia, J.B. Tourists’ willingness to pay for biodiversity conservation and environment protection, Dalai Lake protected area: Implications for entrance fee and sustainable management. Ocean Coast. Manag. 2012, 62, 24–33. [Google Scholar] [CrossRef]
Figure 1.
Locations of prefectures considered in this study.


Table 1.
Statistical data obtained from the field survey of willingness to pay (WTP).
| Location | Sample Number | Valid Number | ||
|---|---|---|---|---|
| Nanji Islands MPA | Level I | Nanji Town | 205 | 197 |
| Level II | Kunyang Town | 110 | 98 | |
| Level III | Lucheng District | 115 | 104 | |
| Putuo Zhongjieshan Islands MPA | Level I | Dongji Town | 210 | 200 |
| Level II | Shenjiamen Street | 103 | 100 | |
| Level III | Dinghai District | 105 | 100 | |
Table 2.
List of explanatory variables related to the WTP.
| Variable name | Description | Code | ||
|---|---|---|---|---|
| x1i | Gender | Respondent’s gender | 0 = male 1 = female | |
| Age | Count variable for respondent’s age (years) | 1 ≤ 20 2 = 20–29 3 = 30–39 4 = 40–49 5 = 50–59 6 ≥ 60 | ||
| Job | job1 | Dummy variables for respondent’s job | 1 = fish farmer; 0 = otherwise 1 = administration staff 0 = otherwise 1 = national official 0 = otherwise 1 = merchant; 0 = otherwise 1 = student; 0 = otherwise 1 = non-governmental organizations; 0 = otherwise | |
| job2 | ||||
| job3 | ||||
| job4 | ||||
| job5 | ||||
| job6 | ||||
| Education | Count variable for respondent’s level of education | 0 = no education 1 = attended primary 2 = attended secondary 3 = attended higher | ||
| Group | Dummy for respondents’ group | 1 = tourist 0 = resident | ||
| Location | Count variable for surveys’ location | 1 = level I location 2 = level II location 3 = level III location | ||
| x2j | Rely | Count variable for the degree of dependence on the sea for livelihood | 1 = very low 2 = low 3 = medium 4 = high 5 = very high | |
| Satisfaction | Count variable for respondent’s satisfaction with the ocean’s condition. e.g., seawater quality and biodiversity | 1 = very dissatisfied 2 = not satisfied 3 = neutral 4 = satisfied 5 = very satisfied | ||
| Att_protect | Count variable for respondent’s attitude to participation in marine conservation activities | 1 = very unwilling 2 = unwilling 3 = neutral 4 = willing 5 = very willing | ||
| Att_loss | Dummy for respondent’s attitude to accepting the loss private of interests for protecting the marine environment | 1 = accept 0 = otherwise | ||
| Prevent | Dummy for preventing others from damaging the ocean | 1 = prevent 0 = otherwise | ||
| Know | Count variable for respondent’s understanding of marine protection policy | 1 = do not know 2 = heard about it 3 = know 4 = very knowledgeable | ||
| y | Income | Count variable for the level of respondent’s annual household income (CNY) | 1 ≤ 10,000 2 = 10,000–50,000 3 = 50,000–100,000 4 = 100,000–200,000 5 ≥ 200,000 | |
| C | WTP | Annual payment for marine conservation | Continuous value | |
Data source: obtained from questionnaire.
Table 3.
Descriptive statistics of respondents’ sociodemographic characteristics.
| (%) | Nanji Islands MPA | Putuo Islands MPA | ||||||
|---|---|---|---|---|---|---|---|---|
| Level I | Level II | Level III | Total | Level I | Level II | Level III | Total | |
| Resident | 14.72 | 98.98 | 99.04 | 57.39 | 72 | 93 | 94 | 82.75 |
| Tourist | 85.28 | 1.02 | 0.96 | 42.61 | 28 | 7 | 6 | 17.25 |
| Male | 53.3 | 58.16 | 42.31 | 51.63 | 56 | 39 | 58 | 52.25 |
| Female | 46.7 | 41.84 | 57.69 | 48.37 | 44 | 61 | 42 | 47.75 |
| Age < 20 | 13.71 | 11.22 | 7.69 | 11.53 | 7 | 24 | 14 | 13 |
| Age = 20–29 | 39.59 | 32.65 | 42.31 | 38.6 | 34 | 46 | 61 | 43.75 |
| Age = 30–39 | 20.81 | 31.63 | 27.88 | 25.31 | 25.5 | 17 | 20 | 22 |
| Age = 40–49 | 18.27 | 15.31 | 18.27 | 17.54 | 16.5 | 9 | 5 | 11.75 |
| Age = 50–59 | 5.58 | 5.1 | 1.92 | 4.51 | 11.5 | 3 | 0 | 6.5 |
| Age ≥ 60 | 2.03 | 4.08 | 1.92 | 2.51 | 5.5 | 1 | 0 | 3 |
| Fish farmer | 9.64 | 3.06 | 0 | 5.51 | 20 | 2 | 1 | 10.75 |
| Administration staff | 12.18 | 12.24 | 4.81 | 10.28 | 9 | 6 | 1 | 6.25 |
| National official | 20.3 | 23.47 | 16.35 | 20.05 | 15.5 | 6 | 12 | 12.25 |
| Merchant | 22.34 | 24.49 | 44.23 | 28.57 | 20 | 25 | 32 | 24.25 |
| Student | 13.2 | 13.27 | 17.31 | 14.29 | 15.5 | 41 | 30 | 25.5 |
| Others | 2.03 | 0 | 0.96 | 1.25 | 2 | 1 | 1 | 1.5 |
| No education | 19.8 | 9.18 | 4.81 | 13.28 | 27.5 | 17 | 4 | 19 |
| Primary education | 31.98 | 26.53 | 18.27 | 27.07 | 24 | 29 | 19 | 24 |
| Secondary education | 40.1 | 56.12 | 69.23 | 51.63 | 42 | 52 | 72 | 52 |
| Higher education | 8.12 | 8.16 | 7.69 | 8.02 | 6.5 | 2 | 5 | 5 |
| Income < 10,000 | 4.57 | 5.1 | 2.88 | 4.26 | 3.5 | 6 | 4 | 4.25 |
| Income = 10,000–50,000 | 17.77 | 6.12 | 6.73 | 12.03 | 13 | 29 | 11 | 16.5 |
| Income = 50,000–100,000 | 37.56 | 44.9 | 34.62 | 38.6 | 43.5 | 29 | 48 | 41 |
| Income = 100,000–200,000 | 29.44 | 30.61 | 30.77 | 30.08 | 27 | 33 | 30 | 29.25 |
| Income > 200,000 | 10.15 | 13.27 | 25 | 14.79 | 13 | 3 | 7 | 9 |
Table 4.
Probability distribution of the awareness of marine conservation among respondents.
| (%) | Nanji Islands MPA | Putuo Islands MPA | |||||||
|---|---|---|---|---|---|---|---|---|---|
| Level I | Level II | Level III | Total | Level I | Level II | Level III | Total | ||
| Rely | low | 32.99 | 44.9 | 44.23 | 38.84 | 38 | 31 | 26 | 33.25 |
| medium | 35.53 | 25.51 | 40.38 | 34.34 | 26 | 41 | 49 | 35.5 | |
| high | 31.47 | 29.58 | 15.39 | 26.82 | 36 | 28 | 25 | 31.25 | |
| Satisfaction | no | 33.50 | 23.46 | 45.19 | 34.08 | 31.5 | 25 | 31 | 29.75 |
| neutral | 23.86 | 41.85 | 35.58 | 31.33 | 28.5 | 38 | 38 | 33.25 | |
| yes | 42.64 | 34.69 | 19.22 | 34.58 | 40 | 37 | 31 | 37 | |
| Att_protect | no | 8.12 | 9.18 | 6.73 | 8.02 | 11 | 6 | 9 | 9.25 |
| neutral | 32.49 | 31.63 | 49.04 | 36.59 | 40.5 | 42 | 31 | 38.5 | |
| yes | 59.39 | 59.19 | 44.23 | 55.39 | 48.5 | 52 | 60 | 52.25 | |
| Att_loss | no | 62.94 | 63.27 | 59.62 | 62.16 | 64.5 | 80 | 62 | 67.75 |
| yes | 37.06 | 36.73 | 40.38 | 37.84 | 35.5 | 20 | 38 | 32.25 | |
| Prevent | no | 47.21 | 37.76 | 44.23 | 44.11 | 81.5 | 94 | 97 | 88.5 |
| yes | 52.79 | 62.24 | 55.77 | 55.89 | 18.5 | 6 | 3 | 11.5 | |
| Know | no | 43.15 | 42.86 | 39.42 | 42.11 | 30 | 35 | 44 | 34.75 |
| yes | 56.85 | 57.14 | 60.58 | 57.89 | 70 | 65 | 56 | 65.25 | |
Table 5.
Probability distribution of respondents’ Willingness for marine conservation.
| (%) | Nanji Islands MPA | Putuo Islands MPA | ||||||
|---|---|---|---|---|---|---|---|---|
| Level I | Level II | Level III | Total | Level I | Level II | Level III | Total | |
| Yes | 90.86 | 97.96 | 93.27 | 93.23 | 89 | 95 | 96 | 92.25 |
| No | 9.14 | 2.04 | 6.73 | 6.77 | 11 | 5 | 4 | 7.75 |
Table 6.
Statistical descriptions for WTP of the sample.
| WTP | Nanji Islands MPA | Putuo Islands MPA | ||||||
|---|---|---|---|---|---|---|---|---|
| Level I | Level II | Level III | Total | Level I | Level II | Level III | Total | |
| Min | 0 | 0 | 0 | 0 | 0 | 0 | 0 | 0 |
| Max | 1000 | 1000 | 1000 | 1000 | 1000 | 1000 | 1000 | 1000 |
| Mean | 159.76 | 255.21 | 286.35 | 216.20 | 169.65 | 137.80 | 212.60 | 172.43 |
| Std.Dev. | 198.08 | 252.72 | 268.23 | 238.21 | 238.03 | 136.29 | 231.33 | 216.46 |
Table 7.
Logit model results for the Willingness for marine conservation.
| Variable | Nanji Islands MPA | Putuo Islands MPA | ||
|---|---|---|---|---|
| Marginal Effect | p-Value | Marginal Effect | p-Value | |
| Gender | 0.026 | 0.131 | −0.003 | 0.870 |
| Age | −0.08 | 0.252 | −0.005 | 0.550 |
| Education | 0.007 | 0.515 | 0.012 | 0.340 |
| Location | −0.015 | 0.394 | 0.024 * | 0.081 |
| Group | −0.062 * | 0.062 | 0.015 | 0.485 |
| Income | 0.006 | 0.456 | 0.005 | 0.612 |
| Rely | −0.026 ** | 0.034 | 0.021 * | 0.080 |
| Satisfaction | 0.023 ** | 0.011 | 0.022 ** | 0.017 |
| Att_protect | 0.017 ** | 0.016 | 0.018 ** | 0.023 |
| Att_loss | 0.016 | 0.315 | 0.061 *** | 0.002 |
| Know | 0.029 ** | 0.022 | −0.012 | 0.380 |
| Constant | 0.714 | 0.208 | ||
| Number of observation | 399 | 400 | ||
| Log likelihood | −83.431 | −95.045 | ||
| LR chi2 | 30.70 | 0.001 | 28.01 | 0.003 |
| Pseudo R2 | 0.155 | 0.128 | ||
| Hosmer-Lemeshow | 6.45 | 0.597 | 14.45 | 0.071 |
Notes: * trend close to the significant for α = 0.1, ** significant for α = 0.05, *** significant for α = 0.01.
Table 8.
Model estimates for the WTP for marine conservation in the Nanji Islands MPA.
| Variable | Tobit Model | Two-Part Model | ||
|---|---|---|---|---|
| Marginal Effect | p-Value | Coefficient | p-Value | |
| Gender | 28.400 | 0.246 | 14.080 | 0.568 |
| Age | −0.679 | 0.950 | 2.919 | 0.760 |
| Education | 23.343 | 0.148 | 20.586 | 0.222 |
| Location | 17.576 | 0.473 | 23.784 | 0.371 |
| Group | −88.757 ** | 0.025 | −67.148 * | 0.093 |
| Income | 37.583 *** | 0.003 | 38.158 *** | 0.002 |
| Job1 | 3.963 | 0.945 | −19.742 | 0.738 |
| Job2 | −16.779 | 0.720 | −41.569 | 0.308 |
| Job3 | 48.83 | 0.200 | 55.867 | 0.191 |
| Job4 | 15.791 | 0.655 | 5.919 | 0.871 |
| Job5 | 19.820 | 0.632 | 8.065 | 0.847 |
| Job6 | 109.624 | 0.316 | 83.538 | 0.603 |
| Rely | −24.879 | 0.162 | −9.012 | 0.590 |
| Satisfaction | 18.165 | 0.167 | 5.669 | 0.720 |
| Att_protect | 16.273 | 0.147 | 5.938 | 0.623 |
| Know | 31.664 * | 0.080 | 14.409 * | 0.074 |
| Att_loss | 3.163 | 0.898 | −5.453 | 0.831 |
| Constant | 0.367 | −25.433 | 0.860 | |
| Number of observation | 399 | 373 | ||
| 26 left-censored observations at WTP ≤ 0 373 uncensored observations 0 right-censored observations | 26 observations at willingness = 0 | |||
| Log likelihood | −2588.664 | |||
| LR chi2/F | 53.97 | 0.000 | 2.37 | 0.002 |
| Pseudo R2/R2 | 0.010 | 0.114 | ||
Notes: * trend close to the significant for α = 0.1, ** significant for α = 0.05, *** significant for α = 0.01.
Table 9.
Model estimates for the WTP for marine conservation in the Putuo Islands MPA.
| Variable | Tobit Model | Two-Part Model | ||
|---|---|---|---|---|
| Marginal Effect | p-Value | Coefficient | p-Value | |
| Gender | 10.326 | 0.644 | 8.523 | 0.713 |
| Age | −22.027 * | 0.058 | −15.604 | 0.210 |
| Education | 30.926 ** | 0.049 | 33.693 * | 0.077 |
| Location | 40.886 ** | 0.010 | 36.042 ** | 0.028 |
| Group | 56.069 * | 0.088 | 48.898 | 0.187 |
| Income | 52.121 *** | 0.000 | 57.174 *** | 0.000 |
| Job1 | 11.075 | 0.832 | 31.777 | 0.586 |
| Job2 | 159.630 *** | 0.002 | 122.167 * | 0.070 |
| Job3 | 22.157 | 0.591 | −13.526 | 0.760 |
| Job4 | −29.300 | 0.395 | −61.847 | 0.109 |
| Job5 | −90.464 ** | 0.013 | −102.242 *** | 0.005 |
| Job6 | 112.556 | 0.219 | 81.431 | 0.461 |
| Rely | −15.973 | 0.369 | −36.473 | 0.154 |
| Satisfaction | −14.003 | 0.201 | −28.223 ** | 0.036 |
| Att_protect | 14.726 | 0.147 | 6.888 | 0.488 |
| Know | −17.812 | 0. 275 | −14.125 | 0.348 |
| Att_loss | −14.518 | 0.545 | −35.798 | 0.103 |
| Constant | 0.198 | 294.354 ** | 0.010 | |
| Number of observation | 400 | 369 | ||
| 31 left-censored observations at WTP ≤ 0 369 uncensored observations 0 right-censored observations | 31 observations at willingness = 0 | |||
| Log likelihood | −2529.714 | |||
| LR chi2/F | 59.21 | 0.000 | 2.45 | 0.000 |
| Pseudo R2/R2 | 0.012 | 0.155 | ||
Notes: * trend close to the significant for α = 0.1, ** significant for α = 0.05, *** significant for α = 0.01.
Table 10.
Factors that affected the WTP in different MPA studies.
| MPAs in East China | Mexico’s MPA [7] | Colombian MPA [18] | MPAs in the North Sea (Dutch Part) [20] | UK MPAs [50] | Italy’s MPAS [22] | LPA in Northeast China [51] | |||||
|---|---|---|---|---|---|---|---|---|---|---|---|
| Nanji MPA | Putuo MPA | ||||||||||
| Variables | Willingness | WTP Amount | Willingness | WTP Amount | Tourists’ WTP | Tourists’ WTP | Public WTP | Users’ WTP | Citizens’ WTP | Tourists’ WTP | |
| Sociodemographic characteristic | Age | − | − | + | − | + | |||||
| Education | + | + | + | ||||||||
| Location | + | + | − (travel distance) | ||||||||
| Group | √ | √ | √ | − (have been visited) | |||||||
| Income | + | + | + | + | + | + | + | + | |||
| Job | √ | + (prefer to be a fisherman) | |||||||||
| Gender | + | + | + | ||||||||
| Awareness | Rely | − | + | ||||||||
| Satisfaction | + | − (seawater perception) | |||||||||
| Att_protect | + | + | |||||||||
| Att_loss | + | ||||||||||
| Know | + | + | + | + | + (awareness of being in a PA) | ||||||
| Importance | + | + | |||||||||
| Others | able to access (+) | have been visit (+) | survey method (+); MPA management (+) | favor (+) | entrance fee (−), institutional trust (+) | ||||||
| WTP amount | 216.2 CNY ($34.3) | 172.43 CNY ($27.4) | $12.5–30 | $15–20 | €62–140/household ($76.2–172) | €8.29–8.83 ($10.2–10.8) | €5–21 ($6.1–25.8) | 71.08 CNY ($11.3) | |||
Notes: + positive impact; − negative impact; √ indicator did not have a positive or negative impact.
© 2018 by the authors. Licensee MDPI, Basel, Switzerland. This article is an open access article distributed under the terms and conditions of the Creative Commons Attribution (CC BY) license (http://creativecommons.org/licenses/by/4.0/).
Share and Cite
MDPI and ACS Style
Yu, B.; Cai, Y.; Jin, L.; Du, B. Effects on Willingness to Pay for Marine Conservation: Evidence from Zhejiang Province, China. Sustainability 2018, 10, 2298. https://doi.org/10.3390/su10072298
AMA Style
Yu B, Cai Y, Jin L, Du B. Effects on Willingness to Pay for Marine Conservation: Evidence from Zhejiang Province, China. Sustainability. 2018; 10(7):2298. https://doi.org/10.3390/su10072298
Chicago/Turabian StyleYu, Bing, Yuying Cai, Laiqun Jin, and Bisheng Du. 2018. "Effects on Willingness to Pay for Marine Conservation: Evidence from Zhejiang Province, China" Sustainability 10, no. 7: 2298. https://doi.org/10.3390/su10072298
Note that from the first issue of 2016, this journal uses article numbers instead of page numbers. See further details here.