Analysis of Corporate Entrepreneurship in Public R&D Institutions
by
Alexandru Agapie
1,2,*, 
Cristian Vizitiu
3,
Silvia Elena Cristache
4,
Marian Năstase
5,
Liliana Crăciun
6 and
Anca Gabriela Molănescu
6 1
Department of Applied Mathematics, The Bucharest University of Economic Studies, Calea Dorobantilor 15-17, Bucharest 010552, Romania
2
Institute of Mathematical Statistics and Applied Mathematics, Bucharest 050711, Romania
3
Institute of Space Science, 409 Atomistilor Street, Magurele 077125, Romania
4
Department of Statistics and Econometrics, The Bucharest University of Economic Studies, Calea Dorobantilor 15-17, Bucharest 010552, Romania
5
Department of Management, The Bucharest University of Economic Studies, Str. Caderea Bastiliei 2-10, Bucharest 010374, Romania
6
Department of Economics and Economic Policies, The Bucharest University of Economic Studies, Calea Dorobantilor 15-17, Bucharest 010552, Romania
*
Author to whom correspondence should be addressed.
Sustainability 2018, 10(7), 2297; https://doi.org/10.3390/su10072297
Submission received: 26 May 2018
/
Revised: 28 June 2018
/
Accepted: 2 July 2018
/
Published: 3 July 2018
(This article belongs to the Special Issue Towards Resilient Entrepreneurship and Technological Development in Self-Sustainable Economies)
Abstract
:This paper aimed at establishing a Corporate Entrepreneurship diagnosis model within public R&D institutions. We based our analysis on empirical identification of a generalized set of organizational factors, perceived as intrapreneurship vectors. The quantitative research targeted 50 experienced public entities and was based on validating one of the most popular psychometric instruments in the entrepreneurial literature: the Corporate Entrepreneurship Assessment Instrument (CEAI)—originally intended for the North American economic environment. As recent literature questioned the cross-cultural portability of psychometric instruments, this study intended to validate the five-factor intrinsic structure of CEAI. The five factors deduced by our statistical analysis were: support for opportunity investigations and reinforcement; dynamic environment and recognition; decreased formalization; knowledge sharing; time availability and strategic awareness. Next, the factor scores were used as input variables for a logistic regression procedure, with the output variable being the intrapreneurial value of the respondents’ institutions. Two factors contribute considerably to the predicted intrapreneurial value: support for opportunity investigations and reinforcement and decreased formalization. The validity of the whole approach is supported by the relevance of the original CEAI questionnaire, able to reveal intrapreneurial characteristics, and by the prediction power of the logistic regression model over the intrapreneurial propensity of public institutions.
1. Introduction
Financial stability issues in the Romanian public sector are well known and have been documented in the literature of the last two decades. It started in 1990 with the emergence of the democratic regime, followed by the implementation of major changes in social and economic landscape, which slowly moved towards a functional market economy. This period was also characterized by a gradual reduction of public funding.
The financial problems of the country deepened with the eruption of the economic crisis in 2008, when problems translated upon the public sector due to a strong destabilization of the economic environment. As a result, public investments in Research and Development (R&D) and corresponding infrastructures decreased dramatically, as well as the overall number of public sector employees. As a timely reaction of the Romanian Government to re-launch the R&D sector, measures for increasing the absorption degree of specific funds or even for creating new national funding opportunities were taken.
Under these circumstances, even if the Romanian public and private R&D sectors exhibit a limited experience in the way of achieving sustainable competitive advantage in a globalized economic world, it is mandatory for them to undertake specific entrepreneurial initiatives in order to survive and grow in the frame of fierce competition.
The entrepreneurial initiatives interpreted as ‘deliberate and spontaneous actions, by means of continuously recognition and exploitation of entrepreneurial opportunities’ ([1] (p. 792)) will be implemented by means of corporate entrepreneurship strategy [1,2,3] which in turn will nurture innovation, proactiveness, and risk taking inside the organizations [4].
Entrepreneurship within existing organizations, also called Corporate Entrepreneurship (CE) or intrapreneurship [5], has been extensively investigated by scholars all over the world for the business field in order to obtain ample and comprehensive internal organizational factors in encouraging entrepreneurial behavior of employees. In this regard, myriads of key organizational factors were concocted as aspects related to finance and resources, control and inventiveness, sponsorship, influence, power, time, rewards, organizational structure, risks, management support, and others as [6,7] contended in their ample literature reviews.
Certain scholars have tried to advance research on CE stimulation within the business field, but [6] succeeded in developing a comprehensive psychometric instrument based mainly on factor analysis for diagnosing Corporate Entrepreneurship (CE) culture in the North American industrial environment. Stated as a cornerstone within the entrepreneurial literature, other significant initiatives were extended, as [8] for South African entrepreneurial culture, whereas [9] undertook similar endeavors for analyzing the Romanian business culture.
Taking into account the fact acknowledged by stated literature that most research is oriented towards the private business field, the aim of the present study is to shift the balance by analyzing the entrepreneurial culture within the public institutions. Public institutions, as government-owned and government-funded organizations [10], have also to cope with the globalized and competitive economic environment, and thus they need also to embrace entrepreneurial culture and spirit [11].
In the stated paradigm of very scarce knowledge on entrepreneurship within public institutions, the herein proposed research focuses on the adaptation to the Romanian Public R&D sector of the most popular psychometric instrument in the entrepreneurial literature, namely, as previously stated, the Corporate Entrepreneurship Assessment Instrument (CEAI) developed by Hornsby, Kuratko, and Zahra [6], for the North American economic environment. As already noticed in the literature, cross-cultural portability of psychometric instruments is questionable. We analyze the CEAI from the point of view of the five-factor, 48-item construct validity, with the declared goal of determining the most appropriate factor structure of the Romanian Public R&D Sector.
By identifying the existence of perceived entrepreneurial organizational factors specific to Romanian public R&D institutions, the study proves useful both in diagnosing the intrapreneurial Romanian culture, and in promoting corporate entrepreneurial strategies modeled on employee’s behavior. By fostering proactiveness, out of the box thinking, championing, risk taking attitude, and other aspects, Corporate Entrepreneurship (CE) strategy could have decisive benefits for the Public Research Sector as enabling innovation of all kinds, and furthermore, undertaking technology transfer activities, and building distinctive competence centers as well.
In other words, the Romanian Public Research sector requires an entrepreneurial strategy under the form of CE in order to nurture economic growth, expansions, international prestige, collaborations and so forth, and these could emerge especially by continuous innovations as generating scientific inventions oriented towards fulfilling new needs of people [1], by transfer of technology regarding licensing scientific research and conveying it to the industry for commercial exploitation [12], and as well, by establishing distinctive competence centers as platforms of collaboration based on specific technological niches between public research organizations and industry, with the purpose to capitalize and develop more competencies in both type of entities.
Promoting entrepreneurship has been and is a constant concern of the European Union because this economic process brings innovation, competitiveness, and growth. In line with European policies, in Romania, over recent years (after 2010) there is an increase of entrepreneurial activity through the considerable number of newly set-up businesses. This conclusion is also confirmed by the National Strategy for Research, Development and Innovation 2014–2020, where it is estimated that “in 2020 Romania will become more competitive at the regional and global level, through innovation fed by research and innovation, generating wealth for the citizens”. The basis for competitiveness is “an innovation system in which R&D supports the advance of global added-value chains. In this environment, excellence and entrepreneurship mobilizes a critical mass of operators”. (National Strategy for Research, Development and Innovation 2014–2020).
We highlight that the proposed guideline to gain the effects of CE within R&D institutions is feasible enough in the sense that innovations in terms of scientific inventions have already been done in particular domains. Some relevant examples in this respect are: the telemedicine portable station (based on space telecommunication and navigation, made for satisfying new-user needs and even creating new-user communities by means of extending the capabilities of certain medicine services or giving the possibility to rescue services to undertake telemedical activities for victims in remote, unprivileged areas [13]); technology transfer activities via spin-in and spin-off companies, as in Romania just started with certain strategic projects in the last 3–4 years [14]; center of competences as the Centre of Competence for Space Technologies that stimulates synergic competences and capabilities at the national research-industry level in a specific field of Countermeasures for Human Space Flight [15].
2. Materials and Methods
Since the second half of the 20th century, numerous researchers have been seeking to find a receipt of key factors to foster internal environment in order to pursuit CE [16], more exactly, to stimulate entrepreneurial behavior in terms of recognition/creation and exploitation of new prospective opportunities [17]. As stated from the very beginning, the first step in achieving CE strategy consists in implementing an induced strategic behavior within the companies whereby to bring innovation, and also ref. [18] contended that in order to foster bottom-up workforce entrepreneurial behavior, it is necessary to undertake top-down initiatives. However, in order to achieve great effectiveness of top-down initiatives, it is necessary to scan internal cultures to identify those internal conditions that in their turn can facilitate intrapreneurial activities [7]. Hence, numerous factors were identified in the organizational culture [19], as perceived by employees to foster their intrapreneurial efforts, and afterwards several psychometric instruments were developed and used to diagnose internal intrapreneurial climates.
Even if there is no general acceptance upon the factors that can implement CE efforts, ref. [7] proposed a set of some selected internal factors from literature, considered critical in influencing CE, and carried out an intrapreneurial assessment instrument [20], formed by: management support for intrapreneurship, reward and resource availability, organizational structure, risk taking, and time availability, but the empirical analysis deployed did not support the model throughout all its five factors [6] and therefore the model was afterwards reconfigured and retested. The new developed model, called the Corporate Entrepreneurship Assessment Instrument (CEAI) developed by ref. [6] for the North American economic environment, has been proved to be more comprehensive and at the same time one of the most popular psychometric instruments in the CE literature, whereas the identified factors corresponding to the North American intrapreneurial culture resulted in the following: management support, work discretion, organizational boundaries, rewards/reinforcement, and time availability.
A psychometric instrument such as CEAI brings huge contributions to entrepreneurial literature by establishing a set of stable organizational factors which could endorse the North American employees’ intrapreneurial efforts and in this way representing a baseline for future researches, and at the same time to the practical business field where the intrapreneurial training needs of managers can be assessed [6,7,21]. Developed on the above mentioned five organizational factors, the relevant fact of undertaking the herein intrapreneurial research study lies in the emergence of the CEAI authors’ plea for subsequent empirical researches to validate the instrument’s scale in cross-cultural framework [6,22].
The five factor structure which is loaded on the 48 items of CEAI, can be described as fostering and endorsing entrepreneurial behavior inside existing organizations, through the following aspects [22]: the extent to how top management support is perceived for enabling employees to champion innovative ideas with the corresponding resources; the extent to how work discretion is perceived in terms of failure tolerance, authority, and responsibility delegation etc.; the extent to how the rewards and reinforcements is perceived, of huge importance in fostering innovative and risk-taking attitude; the extent to how time availability is perceived with respect to time and job allowance upon the intrapreneurial activities; the extent to how organizational boundaries are perceived with regard to the proper internal and external flow of information.
In order to gain competitive advantage, organizations of the 21st century must perform innovative and, in consequence, adopt a corporate entrepreneurship strategy in which commitments from all managerial levels will be sustained. In this context, even top management enables a CE vision, the other individuals belonging to first and middle organizational levels have to be committed and behave intrapreneurially. This fact is already well known in the entrepreneurial literature, and also clearly stated by most ranked scholars, as follows: ‘(...) while top management can instigate the strategy, top management cannot dictate it. Those at the middle and lower ranks of an organization have a tremendous effect on entrepreneurial and strategic processes’ [23] (p. 463).
In this context, the present proposed study targets an investigation of CEAI construct validity in order to verify its scale formed by five-factor loaded on 48-items in a different culture from the one it was built, and at the same time to develop a diagnosis model based on CEAI corresponding to Romanian Public R&D culture, as a tool to empower middle and lower organizational ranks to act innovatively, and furthermore to gain a proactive and risk-taking attitude.
Incidentally, our study addresses also the problem of cross-cultural transfer of psychometric instruments from psychology. Indeed, the application of such instruments across different cultures without possible adaptations may severely affect the validity of the respective instruments [24,25,26]. Due to the way in which individuals perceive their social and cultural milieu, they show certain forms of behavior which influence in their turn activities of interpreting and responding to the questionnaires. A similar application of CEAI to the South African business environment resulted in an eight-factor solution [8]. Under these circumstances, there stands out a real need and opportunity at the same time to investigate the construct validity of the five-factor 48-item CEAI, psychometric instrument developed in North American intrapreneurial culture, in order to validate and adapt it to Romanian Public R&D sector by identifying a proper factor structure to contribute at the intrapreneurial evaluation of this organizational culture.
As for the statistical part, our study makes use of two techniques, factor analysis and logistic regression, each to be briefy described as follows. All computation has been done with SPSS.
Factor analysis (FA), also known as principal component analysis, is an instrument for clustering large sets of data (random variables). The clusters are centered on some pivotal elements—the factors—which aim at bringing to light the otherwise undistinguishable correlations among the variables [27]. Rigorously, the model consists in a set of equations [28],
where Xi represent the observed variables (with cardinal number p, here p = 48) measured for the n subjects, n = 48. Each variable is standardized to have variance one. Fi correspond to the (m) factors, matrix components aij correspond to the factor loadings, while ei correspond to the errors associated to variables. Under the common assumptions—Fi are independent random variables with expected value zero and variance one; ei are independent; Fi and ej are also independent for all (i, j)—Equation (1) gives:
with R the correlation matrix. The sum of squared loadings (SSL) predicted from the factors for each variable is called communality, and it represents the variance that a particular variable Xi has in common with all other variables, through the set of common factors Fj. The most important issue in applying factor analysis is the number of factors to be extracted. A rational assumption is: m significantly smaller than p. In practice, one runs the dedicated software SPSS, e.g., [29] with either a fixed number of factors, or with the number of factors to be determined by the program. In our analysis with 48 variables we followed refs. [28,30] using the eigenvalue criterion for deciding the number of factors. In short, that means that we look at the eigenvalues of matrix R and identify the number of factors with the number of eigenvalues larger than 1. The (orthogonal) technique of rotation varimax is applied next, in order to rescale correlations between factors and variables—what is small becomes smaller, what is large becomes larger. Once the rotated matrix A+ is obtained, one can compute the communalities associated to each variable, and then the proportion of variance in the solution, accounted for by a factor—as the SSL for that particular factor, divided by the sum of communalities.
Along with the reduction procedure from the previous section, factor scores were computed for each factor (by the SPSS program), to be used in a follow-up logistic regression analysis. The final goal of this analysis is to investigate the capability of the factors in predicting entrepreneurial value (propensity) in Romanian Public R&D institutions. A similar two-stage statistical analysis (factor + regression), but for detecting reading abilities within human subjects, was performed in behavioral psychology by [31].
Notice that factor scores are different from the factor loadings. While a factor loading states the correlation between an item (question) and a factor (thus being an actual number), a factor score is a random variable, depicting the latent (indirect) scores of each respondent on the respective factor—derived from the direct answered scores of each respondent on the items that build that factor. The factor scores themselves are computed via least square regression, and they predict the location of each respondent on the factor [27,32]. According to [33], the least square method applied for computing the factor scores is a multivariate regression procedure, taking into account the correlations between factors, between factors and items, and between the items themselves. The resultant dependent variables, are the factor scores, which are standardized to a mean of zero.
The goal of this analysis is to predict/assess entrepreneurial propensity of an institution, based on the answers to our initial CEAI questionnaire provided by respondents from those institutions, reduced to five significant factors. The entrepreneurial propensity is the dependent (outcome/predicted) variable, which for simplicity takes only binary values (YES = 1, NO = 0), while the factors are the independent variables (predictors) used in the logistic regression technique. We built the dependent variable by asking an expert (taken from outside the range of questionnaire respondents) to assign 0/1 values to each of the institutions represented in the responses, based on her personal assessment of the entrepreneurial propensity of the respective institution.
Mathematically, a logistic regression model assumes a linear relationship between the logit-transformed probability of success (value 1 in the binary predicted variable) and the group of predictors. If we denote by Y the binary predicted variable, then the probability of success is p = Prob (Y = 1), and the so-called odds ratios (or simply odds) of success are defined as the fraction p/(1 − p). Moreover, the logarithmic function applied to the odds will transform the initial [0, 1] range of probabilities into the unbounded interval (−∞, +∞). If we denote by X1, …, Xn the predictor variables, the logistic regression applies MAX LIKELIHOOD for determining parameters β0, β1, …, βn in the following equation [34]:
3. Results
3.1. Five Factor Structure
The practical question of this study is: What would the factor structure of the 48-item CEAI be, when factor-analyzed on a Romanian public sector sample?
To this end we performed an exploratory factor analysis in the SPSS, extraction method—principal component, orthogonal varimax rotation, on the 48-item CEAI on a sample of n = 48 middle men employees from Romanian public R&D institutes. Out of the initial 48 variables (items), 14 exhibited eigenvalues larger than one. To improve the interpretation of factors, we dropped the items that loaded significantly on more than one factor. In order to gain consistency to the factor structure, we omitted the factors that carried only one item. Following ref. [35], we imposed a 0.512 threshold on the factor loadings associated to the variables. We used that as a rule of thumb: the items with lower loadings were also discarded. As a result, the set of variables was significantly reduced from 48 down to 39. Next, we ran the same program on the reduced set, but this time with a fixed number of factors, eight. For each factor, we checked for internal consistency using the Cronbach’s α coefficient, and we discarded the three factors (and corresponding items) that were below the minimal acceptance threshold of 0.5—see George and Mallery [29]. Again, the rules from the first run were applied, cutting the set of variables down to 21. A final run was performed on the set of 21 items, with fixed number of factors, five. The results for the five-factor structure are depicted in Table 1. All the data used for input in the SPSS can be found in Supplementary files Public.xls and Public.sav.
The five factors were identified as: (1) support for opportunity investigations and reinforcement; (2) dynamic environment and recognition; (3) decreased formalization; (4) knowledge sharing; (5) time availability and strategic awareness. In Table 2 the resulting 21 items are illustrated, together with the five identified factors.
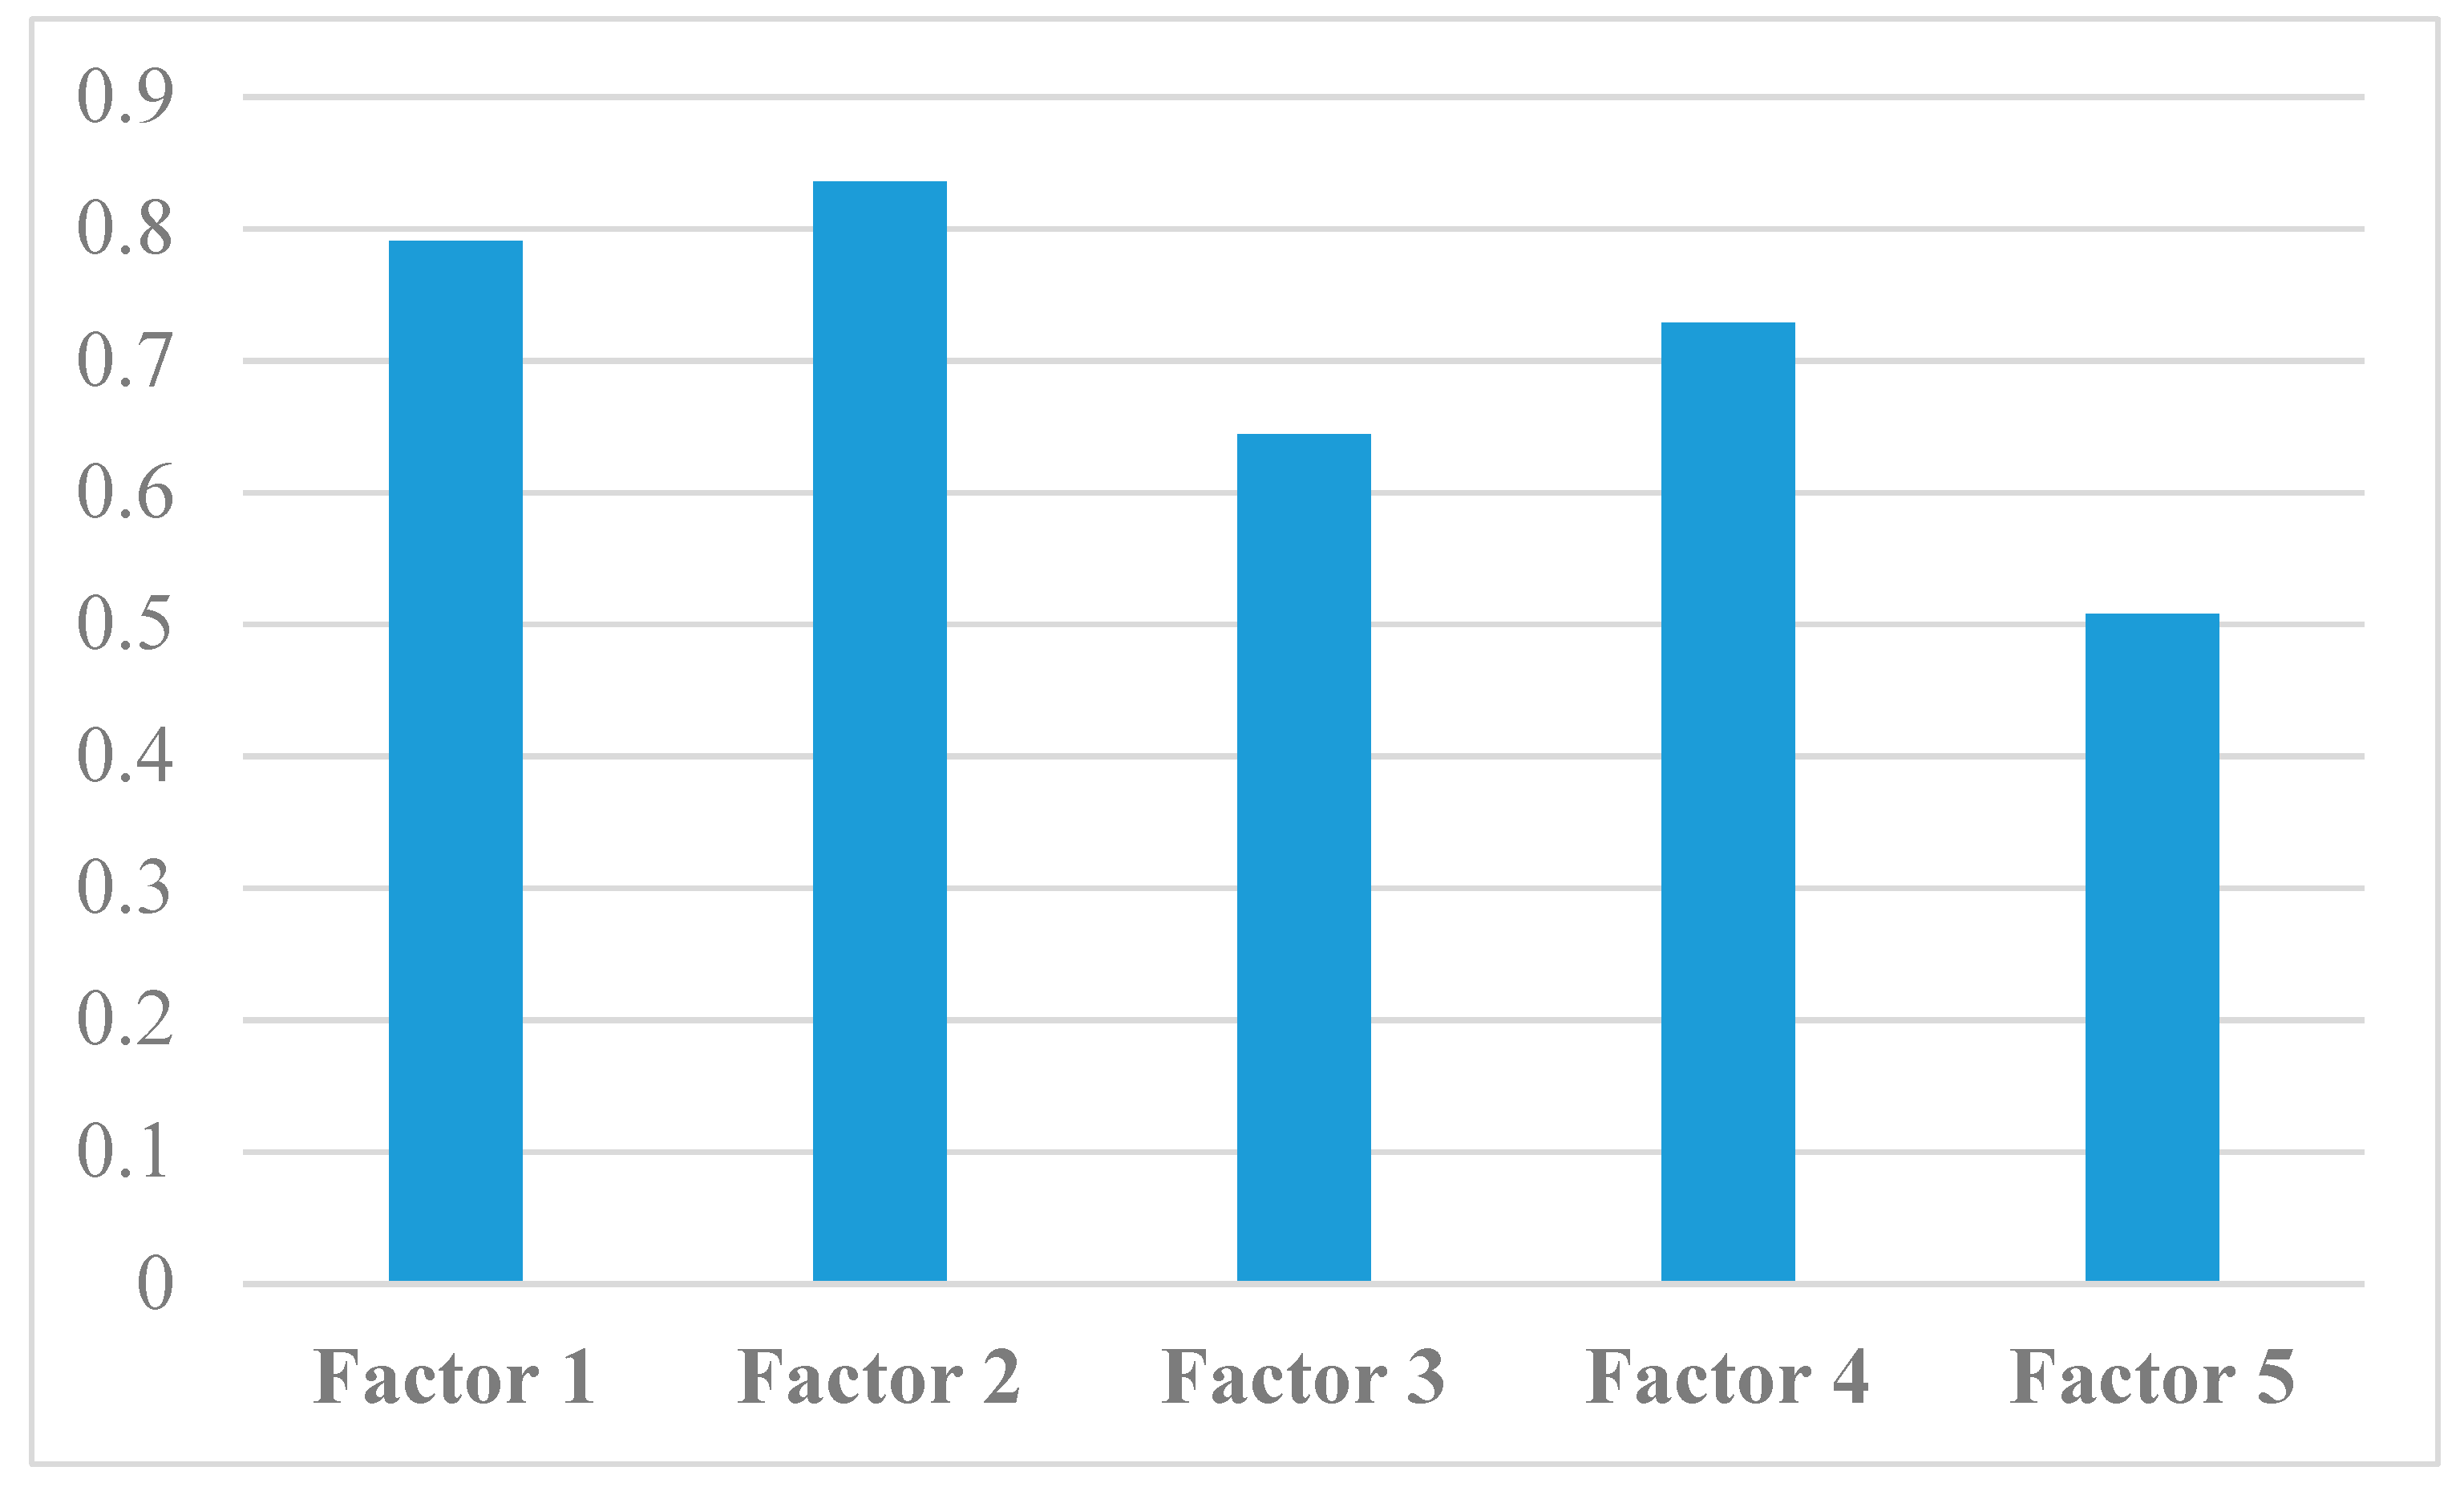
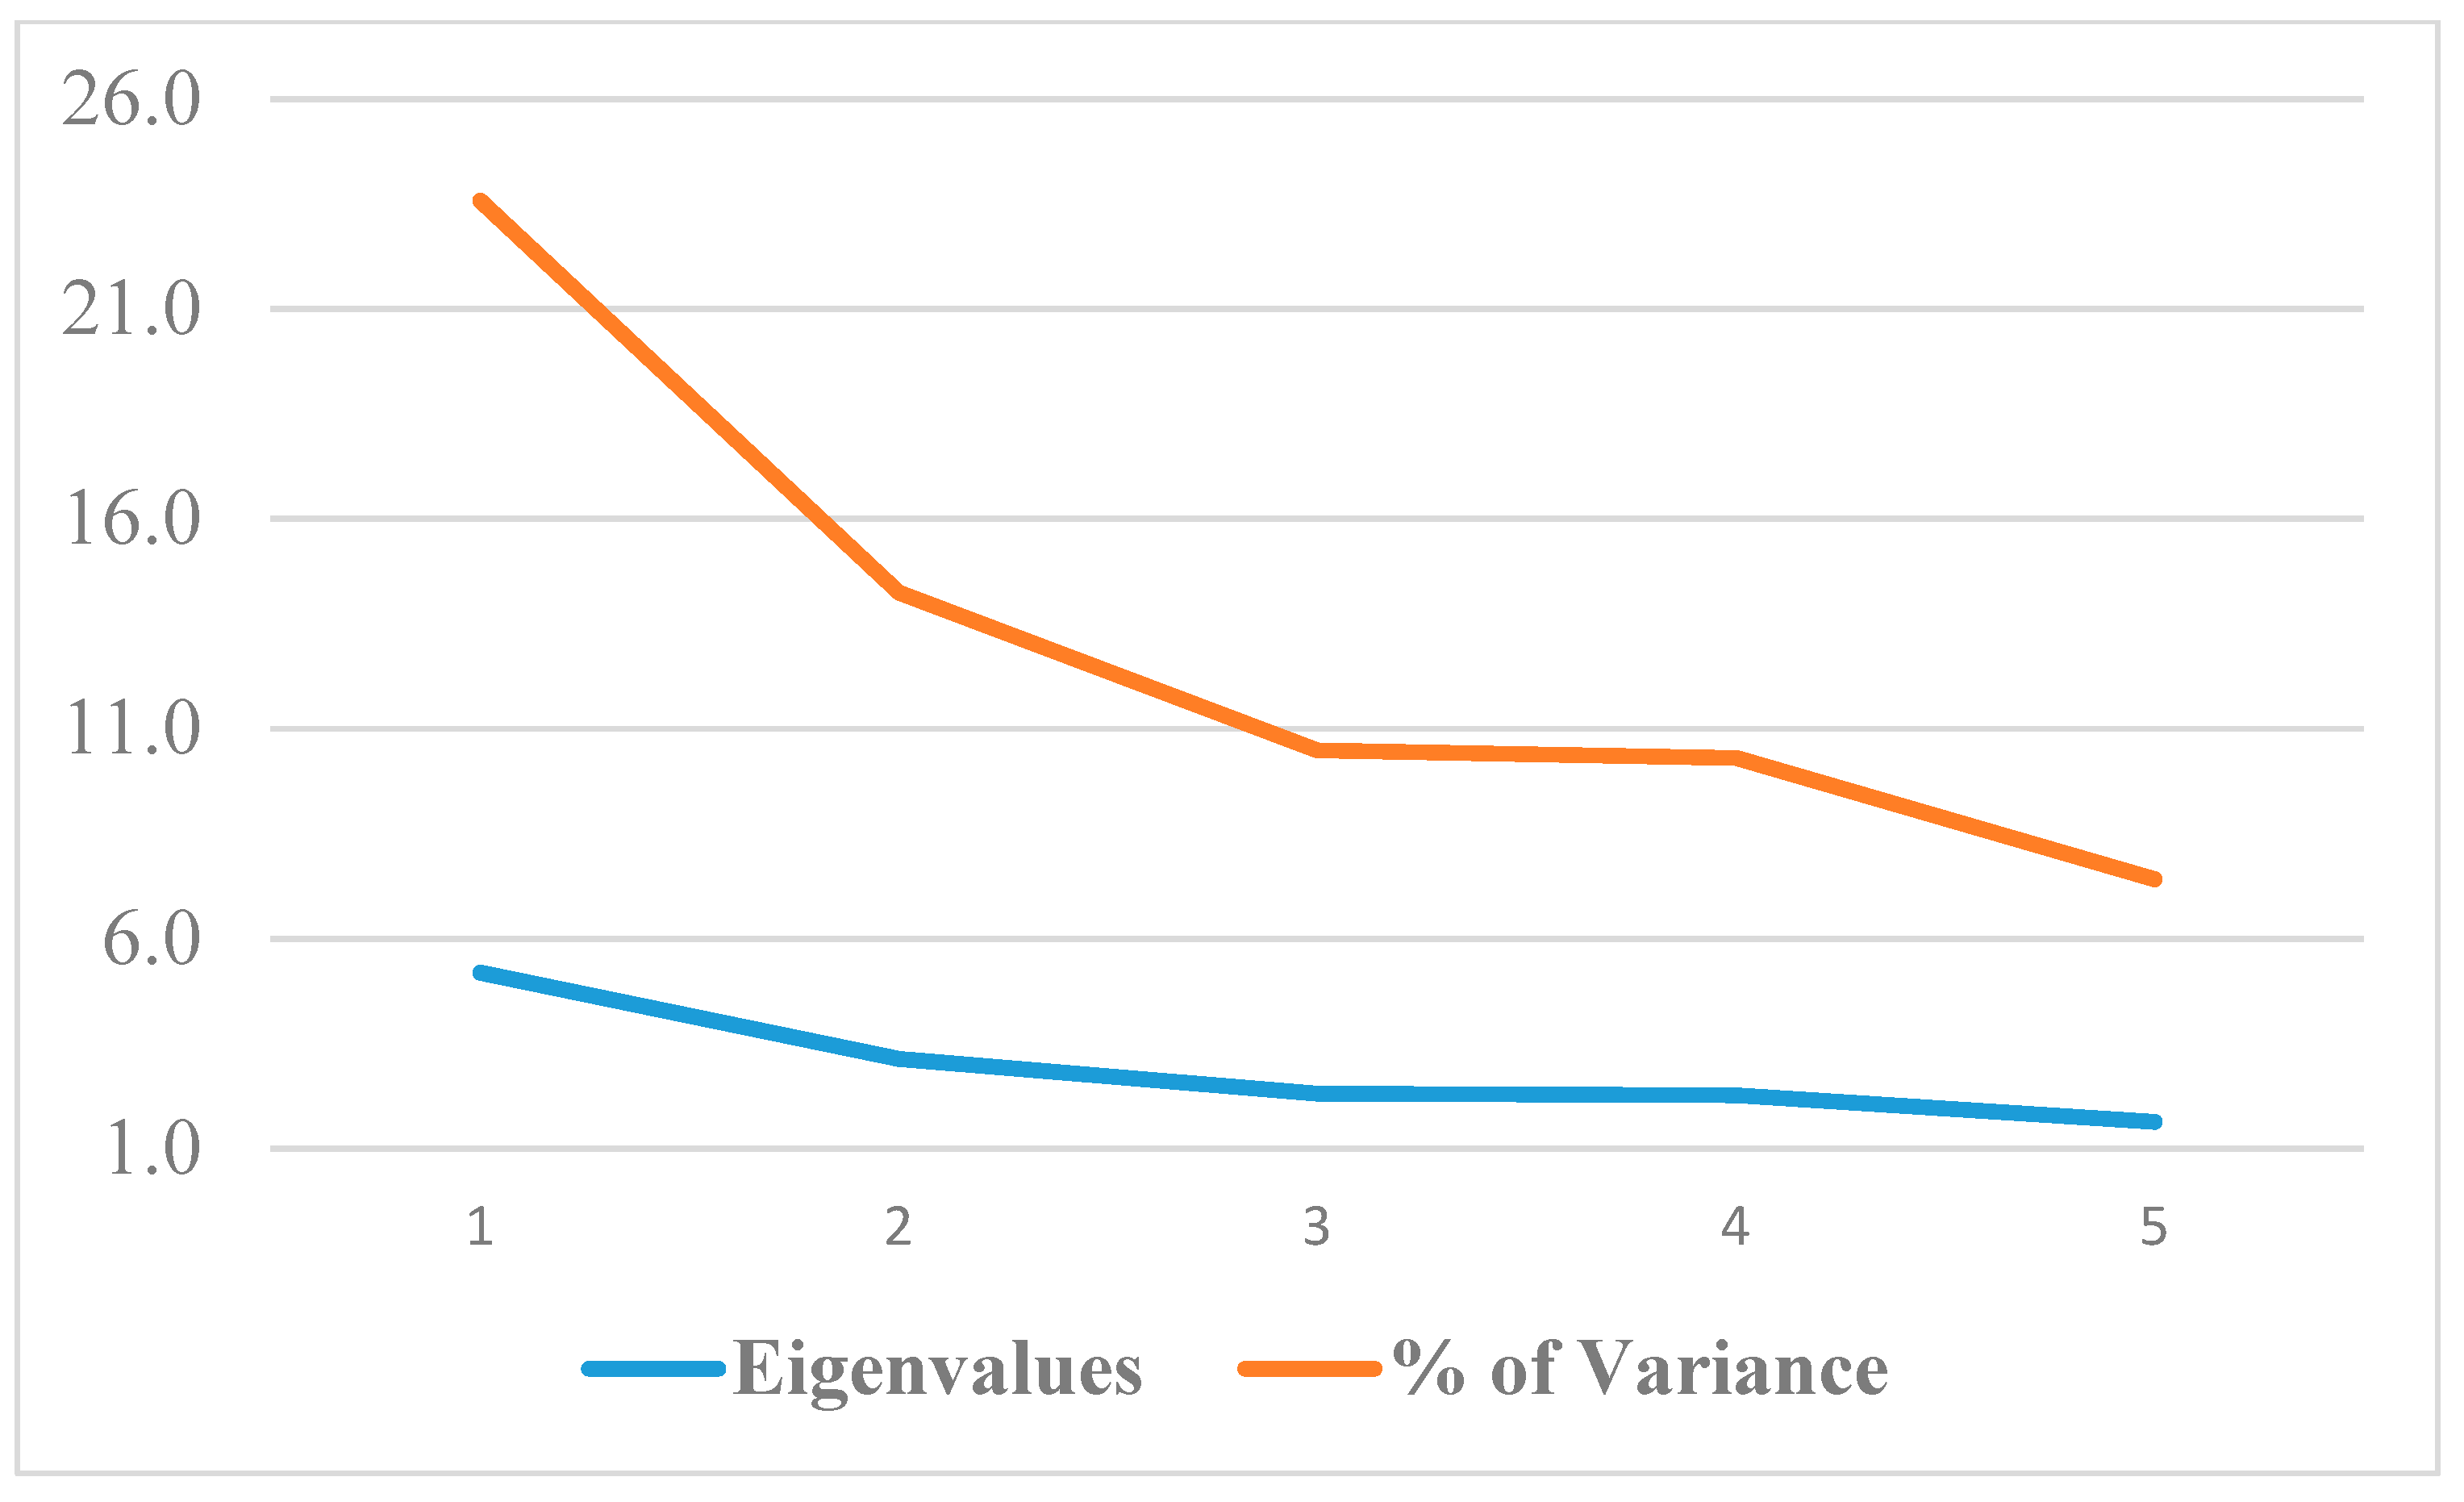
The Cronbach’s α coefficients identified for these factors were: 0.791, 0.836, 0.644, 0.729, and 0.508 (Figure 1). The total variance explained by the five factors is 66.023%, whereas the individual eigenvalues and percentages of variance explained are depicted in Figure 2.
A detailed interpretation of each of the five factors customized on Romanian public R&D culture is provided in Table 3.
The factors presented in Table 3, contrast with previous analyses [6,8,9]: besides the common factors as work discretion, organizational boundaries, as being equivalent to a certain degree with knowledge sharing, time availability, reinforcement; the actual distinction lies in the fact, the Romanian intrapreneurial public culture demands also for aspects such as support for opportunity investigations, dynamic environment and recognition, decreased formalization, and strategic awareness.
After identifying what the factors represent conceptually, the next goal of the statistical analysis is to build a logistic regression model for predicting entrepreneurial propensity.
3.2. Logistic Regression Analysis
Regression coefficients β0, β1, …, βn in Equation (3) were found in our case by applying the corresponding SPSS procedure, as described in the following. The SPSS logistic regression algorithm terminated in seven iterations, while our predictors explain between 49.6% and 69.8% of the variation—see Table 4, which is a lax interpretation of the Cox & Snell and Nagelkerke R values.
Alternatively, an actual R Square value accounting for the proportion of shared variation between variables was calculated by squaring the φ-coefficient [27]. The φ-coefficient is the Pearson correlation coefficient between two dichotomous random variables, in our case the predicted group membership (provided by the logistic regression program) and the actual group membership (provided by the expert). SPSS yielded an φ-coefficient of 0.806—see Table 5—which gives an R Square value of 0.649. The interpretation is that our predicted group membership explains 64.9% of the variation in the actual group membership, which is a very good proportion of variance accounted for. Nota bene, this value lies between the margins 49.6% and 69.8% provided in Table 4.
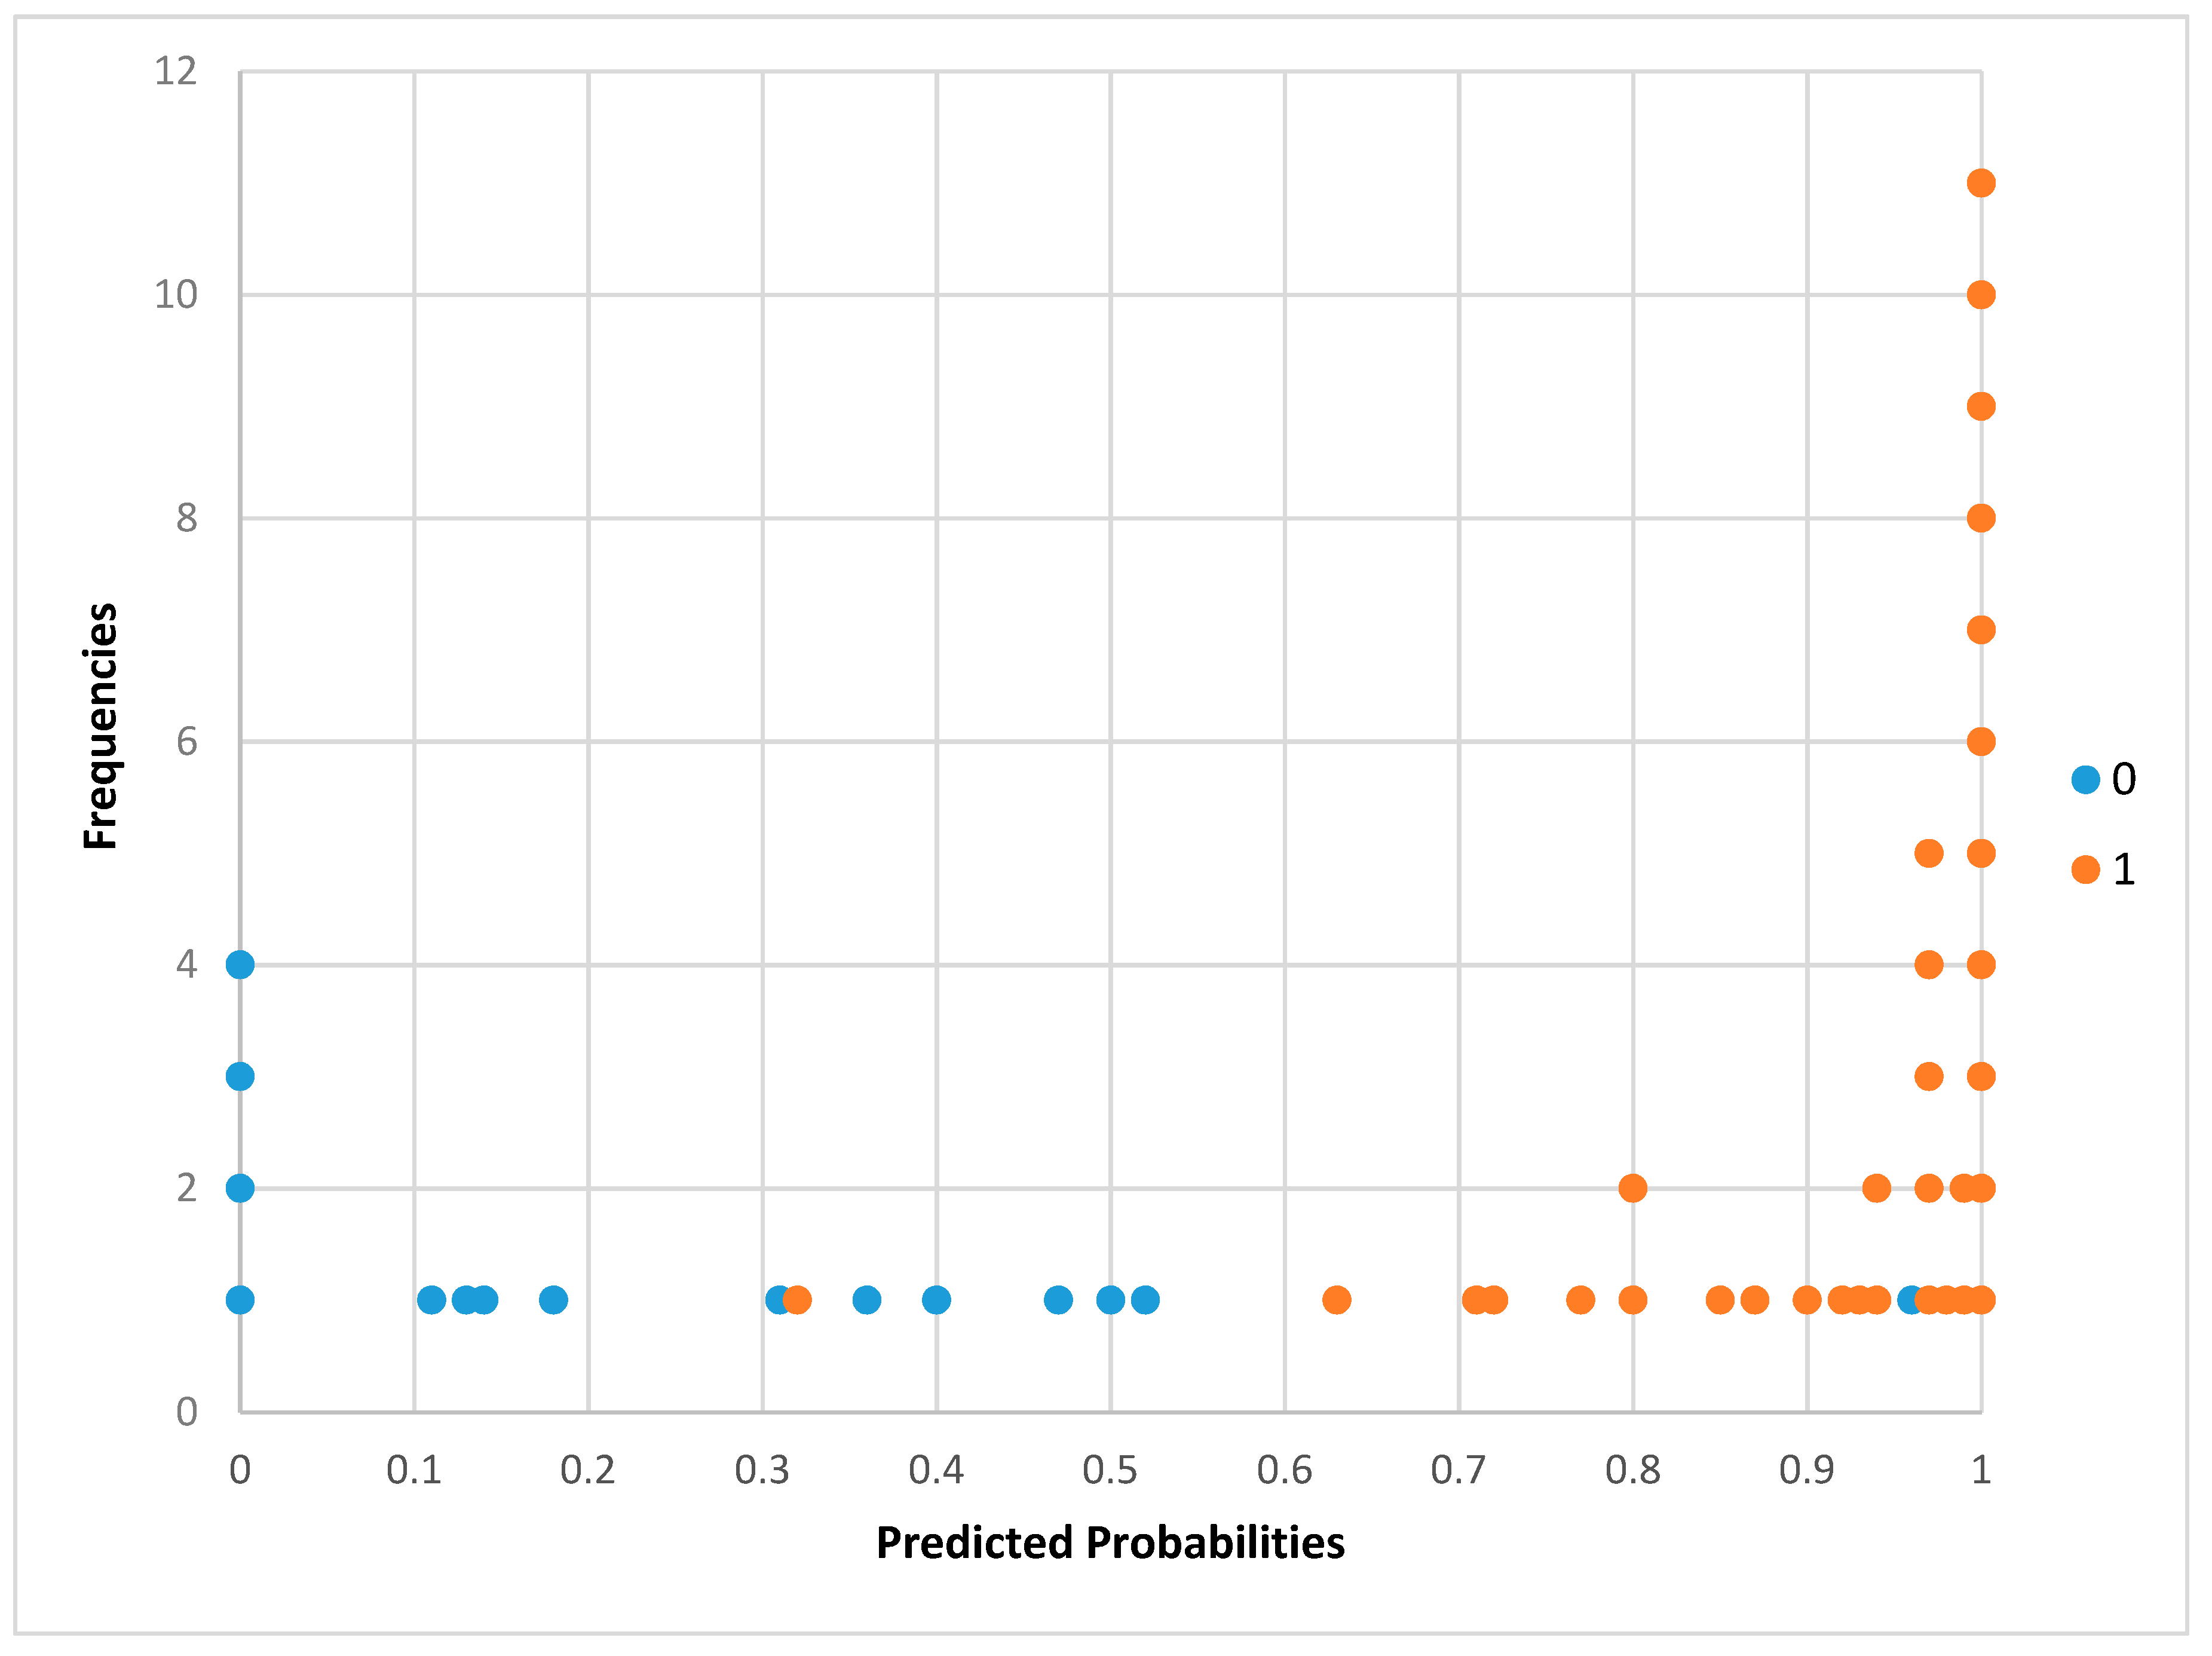
The classification accuracy of our model is depicted in Table 6. The logistic regression exhibits an overall classification rate of 91.7%, namely it classifies correctly 93.9% of the respondents belonging to entities with entrepreneurial value, respectively 86.7% of the respondents belonging to entities without entrepreneurial value.
Figure 3 provides a graphical representation of results in Table 6. The practical goal of our analysis consists in predicting probabilities and group memberships. A predicted probability depicts the likelihood that a particular case (respondent) falls into the target group coded 1—meaning that the belonging institution of the respondent has entrepreneurial value. Predicted probabilities are used for computing (predicted) membership values: all cases with probability larger than 0.5 are assigned to group 1, all others to group 0—the group of entities without entrepreneurial value.
Table 7 gives an indication on the individual predictors and their individual role within the classification accuracy obtained. The regression coefficients (column B) correspond respectively to parameters β1, …, β5, β0 in Equation (3) and can be interpreted as change in log odds or logits. Yet not all coefficients contribute significantly to the regression model, only Factor 1 and Factor 3. This is a result of inspecting column Sig, where only these two coefficients are statistically significant. The same result is read in column Exp(B), where entries larger than 1 corresponding to Factor 1 and 3 are interpreted as follows: for any one unit increase in the predictor, odds of success are increased by a factor of 4.528 (respectively 26.489).
The conclusion is straightforward: Factor 1 (support for opportunity investigations and reinforcement) and Factor 3 (decreased formalization) have a huge impact on the entrepreneurship value of the institution, within Romanian intrapreneurial culture. Consequently, prediction of the entrepreneurship propensity could be done via top management instigated organizational procedures, policies, rules, and especially vision. In the context herein, these aspects are translated from bottom-up perspective into employees’ endorsement for participating in networking events promoting the organization’s mission and their fields of expertise and competencies, decision making style and hierarchical supervision on one hand, and on the other hand into employees’ reinforcement and tolerance for failure.
The last column in Table 7 depicts the 95% Confidence Intervals for the odds ratios of the five coefficients. If value 1 falls between the lower and upper bound of the interval, one cannot reject the null hypothesis—that is, the odds ratio being equal to 1—which actually means that the respective predictor does not have a significant influence on the odds of the target group membership; this is the case with Factor 2, 3, and 5. On the contrary, if value 1 falls outside the confidence interval, one interprets the respective predictor as significant for the overall fit of the model; this happens with Factor 1 and 3, and is consistent with the previous interpretation of the results in column Sig.
4. Discussion
To our knowledge, this is the first attempt of applying an instrument for measuring intrapreneurship assessment like CEAI for public institution culture. The analysis of corporate entrepreneurship in public Romanian R&D institutions was two-fold. First, the validity of CEAI was tested on our emergent, post-communist organizational culture, significantly different from the North-American business culture for which this psychometric instrument was initially created. The statistical analysis reduced the original 48 items of the survey down to a five-factor structure, consistent with previous literature on corporate entrepreneurship. The five factors revealed for the case of Romania were: support for opportunity investigations and reinforcement; dynamic environment and recognition; decreased formalization; knowledge sharing; time availability and strategic awareness.
Previously unaddressed by the CEAI literature, a logistic regression analysis followed the factor analysis. To that end, we used the ensuing factor scores as input variables in a logistic regression procedure (not part of the established), the output being a binary variable accounting for either YES or NO, corresponding to the entrepreneurial propensity of the institutions in study, as evaluated by an independent expert. The logistic analysis stressed two of the five factors as contributing significantly to the predicted output: support for opportunity investigations and reinforcement and decreased formalization. For these two, regression coefficients are positive and larger than one, suggesting that if public institutions focus on them the result will be encouraging entrepreneurship.
Therefore, after adding up logistic regression to factor analysis, CEAI could be used as a diagnosis instrument for identifying entrepreneurial commitment within organizational Romanian public culture and consequently to shape employees’ behavior by top-down initiatives, gaining innovations, technology transfer activities, and distinctive competence centers. This fact represents a considerable incentive for public intrapreneurial real practice, whereby innovations, technology transfer activities as business venturing activities can be fostered and distinctive competence centers with regard to strategic renewals can be built.
As for the insistently proclaimed limited cross-cultural portability of psychometric instruments, apparently our study confirms the hypothesis, in the sense that the five factors obtained are fundamentally different (with respect to their intrinsic item structure) from the factors obtained in similar analyses but for different cultural and business environments. Yet, taking into consideration the consistent results of our study, comparable to previous similar iterations, we can conclude that the CEAI construct has proved valid on the Romanian public sector.
5. Conclusions
The first part of the study targeted investigation on the CEAI construct validity according to Romanian public R&D organizational culture, materializing in a 5-factor structure loaded on 21 items, implicitly implementing a psychometric instrument able to diagnose CE exclusively for the institutions within the assumed Romanian context.
The 5-factor 21-item instrument proves to be an outstanding CE instrument for Romanian strategic management and, as well, for international strategic management through the practical implications and the significant comparisons between Romanian and North American cultures. Hence, the practical benefit consists in the important input given to the Romanian public R&D top management to diagnose, stimulate through training programs and formal/informal meetings, the needed entrepreneurial behavior for achieving CE.
The aggregated CEAI factor and regression model highlight the existence of stable organizational factors which could foster intrapreneurial activities, out of which two are of excessive significance: support for opportunity investigations and reinforcement and decreased formalization. Hence, aspects such as employees’ endorsement into networking activities and awareness events for collaborations, R&D programs and funding schemes identification, employees’ reinforcement for more decentralized decision-making within their specific R&D field of expertise, and decreased formalization within the organization, are all factors of paramount importance in predicting the organization’s entrepreneurial propensity.
As the private-industrial and public R&D environments are different, the CE effects were analyzed especially with respect to the private sector (in terms of innovations, new ventures and strategic renewal), this paper proposes a novel translation of CE effects onto public R&D organizations. Concrete applicability of previous factor/regression statistical analysis fosters, if properly used by policy- and decision-makers, innovations in terms of scientific inventions fulfilling new-user needs or even creating new-user communities; technology transfer activities for developing new companies in terms of spin-in and/or spin-off ventures, as well as distinctive competence centers as collaborative platforms between research organizations and industry based on specific technologic niches.
The comparison between private North American and Romanian public entrepreneurial cultures indicates that regardless of the similarities such as management support, rewards, and reinforcement, the North American entrepreneurial culture promotes work discretion in terms of failure tolerance and authority delegation, whereas the Romanian counterpart calls for decreased formalization, recognition, and opportunity investigations support. We may state that the Romanian R&D culture needs more structural freedom and decentralization concerning decision making, authority, networking, and recognition. A possible explanation could be that within Romanian R&D public institutions employees are struggling to propose projects and apply for government or/and international agencies grants, while in the North American case, employees are struggling to gain funds by persuading the top management of the respective companies. Despite the complexity of both situations, the first instance is seen as confined, while the second could be characterized by self-determination and independence. Within the Romanian R&D public sector, deeply rooted in a former communist regime, CE adoption could be a real solution for the current fragile democratic regime unable to provide R&D grants, especially through the lens of the proposed guidelines by delivering: innovations, technology transfer activities, and competence centers development.
Supplementary Materials
The following are available online at https://www.mdpi.com/2071-1050/10/7/2297/s1: Public.xls, Public.sav.
Author Contributions
Conceptualization, A.A., C.V. and M.N.; Methodology, A.A. and C.V.; Software, A.A. and S.E.C.; Formal Analysis, S.E.C., L.C., and A.G.M.; Investigation, C.V., A.A., and M.N.; Resources, C.V.; Data Curation, C.V., L.C., and A.G.M.; Writing—Original Draft Preparation, A.A. and C.V.; Writing—Review and Editing, A.A., C.V., and S.E.C.
Funding
This research received no external funding.
Conflicts of Interest
The authors declare no conflict of interest.
References
- Vizitiu, C.; Valeanu, V.; Tantau, A.D. Space based mobile telemedicine assisted by specific Systems Engineering approach. In Proceedings of the 6th International Conference on Recent Advances in Space Technologies, Istanbul, Turkey, 12–14 June 2013; pp. 789–793. [Google Scholar]
- Soare, I.; Cristache, N.; Dobrea, C.R.; Nastase, M. The rural touristic entrepreneurship—New opportunities of capitalizing the rural tourist potential in the context of durable development. Eur. J. Sustain. Dev. 2017, 6, 231–252. [Google Scholar] [CrossRef]
- Ireland, R.D.; Covin, J.G.; Kuratko, D.F. Conceptualizing corporate entrepreneurship strategy. Entrepreneurship Theory Pract. 2009, 33, 19–46. [Google Scholar] [CrossRef]
- Miller, D. The correlates of entrepreneurship in three types of firms. Manag. Sci. 1983, 29, 770–791. [Google Scholar] [CrossRef]
- Pinchot, G. Intrapreneuring: Why You Don’t Have to Leave the Corporation to Become an Entrepreneur; Harper & Row: New York, NY, USA, 1985. [Google Scholar]
- Hornsby, J.S.; Kuratko, D.F.; Zahra, S.A. Middle managers’ perception of the internal environment for corporate entrepreneurship: Assessing a measurement scale. J. Bus. Ventur. 2002, 17, 253–273. [Google Scholar] [CrossRef]
- Kuratko, D.F.; Montagno, R.V.; Hornsby, J.S. Developing an intrapreneurial assessment instrument for an effective corporate entrepreneurial environment. Strateg. Manag. J. 1990, 11, 49–58. [Google Scholar]
- Van Wyck, R.; Adonisi, M. An eight-factor solution for the Corporate Entrepreneurship Assessment Instrument. Afr. J. Bus. Manag. 2011, 5, 3047–3055. [Google Scholar]
- Vizitiu, C.; Agapie, A.; Paiusan, R.; Hadad, S.; Nastase, M. Adapting corporate entrepreneurship assessment instrument for Romania. S. Afr. J. Bus. Manag. 2018, 49, 1–7. [Google Scholar] [CrossRef]
- Rainey, H.G. Understanding and Managing Public Organizations, 4th ed.; Jossey-Bass: San Francisco, CA, USA, 2009. [Google Scholar]
- Diefenbach, F.E. Entrepreneurship in the Public Sector: When Middle Managers Create Public Value; Gabler Research; Gabler Verlag: Wiesbaden, Germany, 2011. [Google Scholar]
- Fenga, H.I.; Chena, C.-S.; Wanga, C.H.; Chiang, H.C. The role of intellectual capital and university technology transfer offices in university-based technology transfer. Serv. Ind. J. 2012, 32, 899–917. [Google Scholar] [CrossRef]
- Tantau, A.D.; Vizitiu, C.; Valeanu, V. The responsibility of telemedicine focused organizations in regards to creating compliant end users products and services. Amfiteatru Econ. J. 2014, 16, 108–122. [Google Scholar]
- Vac, S.C.; Vac, L.M.; Nas, V.L. Research, Innovation and Technology transfer: Concepts, World wide Experience and Prospects for its Development in Romanian Universities. Bull. USAMV Ser. Agric. 2015, 72, 251–262. [Google Scholar]
- Vizitiu, C.; Marin, M.; Nistorescu, A.; Valeanu, V.; Hillerin, P. Competitive sustainability within research institutions. Case study: Centre of competence for space technologies—STARWALKER. Adv. Bus. Relat. Sci. Res. J. 2015, 6, 1–14. [Google Scholar]
- Christensen, K.S. Enabling intrapreneurship: The case of a knowledge-intensive industrial company. Eur. J. Innov. Manag. 2005, 8, 305–322. [Google Scholar] [CrossRef]
- Peltola, S. Can old firm lean new tricks? A corporate entrepreneurship approach to organizational renewal. Bus. Horiz. 2012, 55, 43–51. [Google Scholar] [CrossRef]
- Bosma, N.; Stam, E.; Wennekers, S. Intrapreneurship Versus Independent Entrepreneurship: A Cross-National Analysis of Individual Entrepreneurial Behavior; Discussion Paper Series; Utrecht School of Economics, Tjalling C. Koopmans Research Institute: Utrecht, The Netherlands, 2011. [Google Scholar]
- Nastase, M.; Valimareanu, I. Building a Strong Organizational Culture for Sustainable Development of Tourism Companies. Rev. Int. Comp. Manag. 2017, 18, 122–130. [Google Scholar]
- Antoncic, B.; Hisrich, R.D. Intrapreneurship: Construct refinement and cross-cultural validation. J. Bus. Ventur. 2001, 16, 495–527. [Google Scholar] [CrossRef]
- Thornberry, N. Corporate entrepreneurship: Antidote or oxymoron? Eur. Manag. J. 2001, 19, 526–533. [Google Scholar] [CrossRef]
- Hornsby, J.S.; Holt, D.T.; Kuratko, D.F. The dynamic nature of corporate entrepreneurship: Assessing the CEAI. In Proceedings of the Annual Meeting of the Academy of Management, Anaheim, CA, USA, 8–13 August 2008; pp. 1–6. [Google Scholar]
- Kuratko, D.F. The entrepreneurial imperative of the 21st century. Bus. Horiz. 2009, 52, 421–428. [Google Scholar] [CrossRef]
- Craciun, L.; Nastase, M.; Stamule, T.; Vizitiu, C. Leadership in Romanian Small to Medium Enterprises. Sustainability 2015, 7, 4183–4198. [Google Scholar] [CrossRef] [Green Version]
- De Klerk, M.; Boshoff, A.; Van Wyk, R. Measuring meaning in life in South Africa: Validation of an instrument developed in the USA. S. Afr. J. Psychol. 2009, 39, 314–325. [Google Scholar] [CrossRef]
- Meiring, D.; Van de Vijver, F.J.R.; Rothmann, S. Bias in an adapted version of the 15FQ+ in South Africa. S. Afr. J. Psychol. 2006, 36, 340–356. [Google Scholar] [CrossRef]
- Tabachnick, B.G.; Fidell, L.S. Using Multivariate Statistics, 5th ed.; Pearson: Boston, MA, USA, 2007. [Google Scholar]
- Habing, B. University of South Carolina, Columbia, SC, USA. Exploratory factor analysis. Personal communication, 2003. [Google Scholar]
- George, D.; Mallery, P. SPSS for Windows Step by Step: A Simple Guide and Reference, 4th ed.; Allyn & Bacon: Boston, MA, USA, 2013. [Google Scholar]
- Hair, J.F., Jr.; Anderson, R.E.; Tatham, R.L.; Black, W.C. Multivariate Data Analysis, 5th ed.; Prentice Hall: Upper Saddle River, NJ, USA, 1998. [Google Scholar]
- Bell, S.M.; McCallum, R.S.; Cox, E.A. Toward a research-based assessment of dyslexia: Using cognitive measures to identify reading disabilities. J. Learn. Disabil. 2003, 36, 505–516. [Google Scholar] [CrossRef] [PubMed]
- Grice, J.W. Computing and evaluating factor scores. Psychol. Methods 2002, 6, 430–450. [Google Scholar] [CrossRef]
- DiStefano, C.; Zhu, M.; Mindrila, D. Understanding and Using Factor Scores: Considerations for the Applied Researcher. Pract. Assess. Res. Eval. 2009, 14, 1–11. [Google Scholar]
- UCLA: Statistical Consulting Group. How Do I Interpret Odd Ratios in Logistic Regression? Available online: https://stats.idre.ucla.edu/other/mult-pkg/faq/general/faq-how-do-i-interpret-odds-ratios-in-logistic-regression/ (accessed on 10 April 2018).
- Stevens, J. Applied Multivariate Statistics for the Social Sciences, 4th ed.; Lawrence Erlbaum: Mahwah, NJ, USA, 2002. [Google Scholar]
Figure 1.
Cronbach’s α coefficients.

Figure 2.
Total variance explained.

Figure 3.
Observed groups by logistic regression.


Table 1.
Five-factor solution for the Corporate Entrepreneurship Assessment Instrument (CEAI).
| Factor 1 | Factor 2 | Factor 3 | Factor 4 | Factor 5 | |||||
|---|---|---|---|---|---|---|---|---|---|
| Item | Load | Item | Load | Item | Load | Item | Load | Item | Load |
| Q14 | 0.680 | Q1 | 0.855 | Q11 | 0.724 | Q4 | 0.753 | Q3 | 0.816 |
| Q15 | 0.536 | Q2 | 0.808 | Q24 | 0.650 | Q23 | 0.722 | Q18 | 0.642 |
| Q19 | 0.749 | Q12 | 0.859 | Q30 | 0.842 | Q47 | 0.827 | ||
| Q26 | 0.832 | Q17 | 0.582 | ||||||
| Q27 | 0.861 | ||||||||
| Q28 | 0.741 | ||||||||
| Q33 | −0.517 | ||||||||
| Q35 | 0.695 | ||||||||
| Q37 | 0.799 | ||||||||
Table 2.
Factors vs. items.
| Factor 1: Support for opportunity investigations and reinforcement 1. Individuals with successful innovative projects receive additional reward and compensation for their ideas and efforts beyond the standard reward system. 2. There are several options within the organization for individuals to get financial support for their innovative projects and ideas. 3. The term ‘‘risk taker’’ is considered a positive attribute for people in my work area. 4. This organization provides the chance to be creative and try my own methods of doing the job. 5. This organization provides freedom to use my own judgment. 6. This organization provides the chance to do something that makes use of my abilities. 7. I seldom have to follow the same work methods or steps for doing my major tasks from day to day. 8. The rewards I receive are dependent upon my work on the job. 9. My supervisor will give me special recognition if my work performance is especially good. |
| Factor 2: Dynamic environment and recognition 1. My organization is quick to use improved work methods. 2. My organization is quick to use improved work methods that are developed by workers. 3. Many top managers have been known for their experience with the innovation process. 4. People are often encouraged to take calculated risks with new ideas around here. |
| Factor 3: Decreased formalization 1. Senior managers encourage innovators to bend rules and rigid procedures in order to keep promising ideas on track. 2. I feel that I am my own boss and do not have to double check all of my decisions. 3. It is basically my own responsibility to decide how my job gets done. |
| Factor 4: Knowledge sharing 1. During the past year, my immediate supervisor discussed my work performance with me frequently. 2. People are encouraged to talk to workers in other departments of this organization about ideas for new projects. 3. In my organization, developing one’s own ideas is encouraged for the improvement of the company. |
| Factor 5: Time availability and strategic awareness 1. My job is structured so that I have very little time to think about wider organizational problems. 2. My job description clearly specifies the standards of performance on which my job is evaluated. |
Table 3.
Factor interpretation customized on Romanian public culture.
| No. | Factor | Interpretation |
|---|---|---|
| 1 | support for opportunity investigations and reinforcement | organization’s attitude to endorse employees’ formal and informal networking, as well their participations to all kind of awareness events etc., but also referring to the extent to which one perceives how superior managers strengthen the individuals’ beliefs |
| 2 | dynamic environment and recognition | the extent to which one perceives the organizational ability to stay up to date from the quality and information management point of view, and also the acknowledgement for achievements |
| 3 | decreased formalization | the extent to which one perceives the tolerance for failure, decision making centralization, authority and responsibility delegation, supervision, and as well the extent to which aspects such as organizational procedures, policies, rules, job and even furthermore employees’ behavior are unclearly established, standardized in an organization |
| 4 | knowledge sharing | the extent by which one perceives the knowledge dynamics in terms of vertical or lateral communication within the organization |
| 5 | time availability and strategic awareness | the extent by which one perceives leisure or unstructured time during work, respectively the meaning and implications of the organization’s/department’ vision |
Table 4.
Logistic regression summary.
| Step | −2 Log Likelihood | Cox & Snell R Square | Nagelkerke R Square |
|---|---|---|---|
| 1 | 26.716 * | 0.496 | 0.698 |
* Estimation terminated at iteration number 7 because parameter estimates changed by less than 0.001.
Table 5.
Correlation between actual and predicted group membership.
| Actual Group | Predicted Group | ||
|---|---|---|---|
| Actual group | Pearson Correlation | 1 | 0.806 * |
| Sig. (2-tailed) | 0.000 | ||
| N | 48 | 48 | |
| Predicted group | Pearson Correlation | 0.806 * | 1 |
| Sig. (2-tailed) | 0.000 | ||
| N | 48 | 48 | |
* Correlation is significant at the 0.01 level (2-tailed).
Table 6.
Case classification.
| Observed | Predicted | ||||
| Entrep._Value | Percentage Correct | ||||
| 0.00 | 1.00 | ||||
| Step 1 | Entrep._Value * | 0.00 | 13 | 2 | 86.7 |
| 1.00 | 2 | 31 | 93.9 | ||
| Overall Percentage | 91.7 | ||||
* The cut value is 0.5.
Table 7.
Coefficients in logistic regression.
| B | S.E. | Wald | df | Sig. | Exp (B) | 95% C.I. for EXP (B) | ||
|---|---|---|---|---|---|---|---|---|
| Lower | Upper | |||||||
| FACTOR 1 | 1.510 | 0.557 | 7.347 | 1 | 0.007 | 4.528 | 1.519 | 13.493 |
| FACTOR 2 | −1.057 | 0.604 | 3.063 | 1 | 0.080 | 0.348 | 0.106 | 1.135 |
| FACTOR 3 | 3.277 | 1.133 | 8.365 | 1 | 0.004 | 26.489 | 2.875 | 244.024 |
| FACTOR 4 | −0.158 | 0.516 | 0.094 | 1 | 0.759 | 0.854 | 0.311 | 2.345 |
| FACTOR 5 | 0.946 | 0.651 | 2.110 | 1 | 0.146 | 2.575 | 0.719 | 9.223 |
| Constant | 1.730 | 0.656 | 6.958 | 1 | 0.008 | 5.643 | ||
© 2018 by the authors. Licensee MDPI, Basel, Switzerland. This article is an open access article distributed under the terms and conditions of the Creative Commons Attribution (CC BY) license (http://creativecommons.org/licenses/by/4.0/).
Share and Cite
MDPI and ACS Style
Agapie, A.; Vizitiu, C.; Cristache, S.E.; Năstase, M.; Crăciun, L.; Molănescu, A.G. Analysis of Corporate Entrepreneurship in Public R&D Institutions. Sustainability 2018, 10, 2297. https://doi.org/10.3390/su10072297
AMA Style
Agapie A, Vizitiu C, Cristache SE, Năstase M, Crăciun L, Molănescu AG. Analysis of Corporate Entrepreneurship in Public R&D Institutions. Sustainability. 2018; 10(7):2297. https://doi.org/10.3390/su10072297
Chicago/Turabian StyleAgapie, Alexandru, Cristian Vizitiu, Silvia Elena Cristache, Marian Năstase, Liliana Crăciun, and Anca Gabriela Molănescu. 2018. "Analysis of Corporate Entrepreneurship in Public R&D Institutions" Sustainability 10, no. 7: 2297. https://doi.org/10.3390/su10072297
Note that from the first issue of 2016, this journal uses article numbers instead of page numbers. See further details here.