1. Introduction
In most parts of the world, the increasing age structure of the population (hereafter called “aging”) is a common phenomenon due to lower fertility rates and longer life expectancy [
1]. Without controversy, aging has a negative effect on labor participation based on a reduction of working-age people [
2], which implies a declining labor supply. However, the relationship between aging and productivity is not settled [
3]. Aging is associated with positive factors of productivity, such as experience and skills, as well as negative factors such as technical knowledge and creativity. Considering that productivity is closely related to economic growth, the impact of aging on development issues is also not settled. In other words, previous studies do not answer the question of whether sustainable development is possible in terms of aging and productivity.
Many studies have investigated the effect of aging on productivity for many industries, and find different results depending on industrial characteristics [
4]. Even though aging is severe in the agricultural sector of many countries, due to rural–urban migration from industrialization and urbanization, only a few studies, such as Abdulai and Eberlin [
5], Chen et al. [
6], and Li and Sicular [
7] have investigated the effects of aging on agricultural productivity (efficiency). In addition, previous literature on farm technical efficiency does not focus on the role of aging. They normally assume an inverted-U relationship between aging and technical efficiency to control the aging effect on farm technical efficiency, and find that age has a positive effect on farm efficiency up to a certain point, and a negative effect after that.
However, the inverted-U assumption is suspect, since there is no consensus about the total effects from aging on dependent skills such as experience and physical and cognitive skills. To be specific, Skirbekk [
8] finds that older workers have higher productivity compared with younger workers in jobs that require experience and verbal abilities, such as word power, analogies, sentence correction, and verbal reasoning. On the other hand, Stones and Kozma [
9] investigate how physical abilities decline with age, at least beyond the age of 30 to 35. Salthouse [
10] finds that the effect of age on cognitive skills, such as memory, reasoning, spatial visualization, and speed for digital symbols, varies depending on data type. When cross-sectional data are used, age has a negative effect on cognitive skills, whereas age has a positive effect for longitudinal comparisons. This suggests that older individuals have lower cognitive skills at a point in time, but that older people now have better cognitive skills than older people decades ago. To sum up, the literature is unclear about the exact relationship between aging and productivity.
To find the correct relationship between aging and farm technical efficiency, we should relax the assumption of an inverted-U relationship. One way to relax this assumption is the method of Wang [
11] on the stochastic frontier production function (SFPF). Contrary to the previous literature with age and age square, Wang [
11] allows a variable (age in this case) to have a more flexible effect on farm efficiency within an SFPF by relaxing the monotonicity assumption; so, we are able to estimate the average marginal effect of age on farm efficiency without the assumption of the predetermined quadratic structure of aging effect. We believe that the method of Wang [
11] allows us to find the overall shape of the age effect on farm efficiency. It is important to evaluate the role of aging on agricultural sustainable development.
This study focuses on South Korea (hereafter called “Korea”), which has experienced a rapid aging phenomenon that is particularly severe in the agricultural sector. According to the Farm Household Economic Survey (FHES), the average age of a Korean farm manager has increased from 59.9 to 68.3 between 2003–2015 (
http://kostat.go.kr/portal/eng/surveyOutline/1/6/index.static). This rapid aging of Korean farmers can be explained by rapid industrialization. Rural-to-urban migration in Korea has been especially severe, since Korea has a comparative disadvantage in agriculture. Based on the revealed comparative advantage (RCA) results of Yoon and Kim [
12], Korea has a comparative disadvantage in the agricultural sector. In addition, agricultural imports have increased due to reduced trade barriers from free trade agreements (FTA) since the 2000s. The Korea government has reformed its agricultural subsidy system from market price supports to decoupled income subsidies since 2005 to protect and sustain the agricultural sector in line with the World Trade Organization (WTO) Agricultural Agreement. Decoupled income subsidy is defined as a government payment that is not linked to the farm production, whereas couple income subsidy is directly related to farm production. In other words, a financial support is provided to the farmers regardless of the farm production with the decoupled income subsidy. The effect of the income support program on technical efficiency is unclear, since Zhu and Lansink [
13] point out that there is a controversial income effect from the subsidy. If the income effect from the subsidy leads farmers to invest in facilities or technologies, then the income subsidy will have a positive effect on farm efficiency. If the income effect reduces the invest motivations of farmers, then the income subsidy will have a negative effect on technical efficiency. However, the impact of the income subsidy on agricultural efficiency in Korea has not been investigated.
The main objective of this study is to investigate the impact of aging on farm productivity in Korea by employing the FHES dataset. We capture the different marginal effect of age on farm efficiency by assuming a non-monotonic property of the effect, as suggested by Wang [
11]. Furthermore, this paper tests the impact of the current income subsidy on farm efficiency in Korea, and examines what factors are important to improve farm efficiency by exploring farm and farmer characteristics. From the results, we also try to infer the role of aging on agricultural sustainable development in Korea, as well as the role of income subsidy or other key factors.
2. Literature Review
Although aging is related to productivity by many factors, such as physical skills, cognitive skills, and experience, a profile of age-productivity may differ by industry, since each industry requires different activities and skills [
4]. In this regard, many studies such as Börsch-Supan and Weiss [
14], Cardoso et al. [
15], Crepon et al. [
16], and Daveri and Maliranta [
17] have investigated the impact of aging on productivity by focusing on the non-agricultural sector in different countries or industries. According to Li and Sicular [
7], aging is potentially severe in the agricultural sector compared to other sectors; however, only a few studies have investigated the relationships between age and productivity in the agricultural sector based on our best knowledge.
Most of the studies that have focused on age and agricultural productivity examined farm technical efficiency with an assumed inverted-U relationship between age and technical efficiency. Bravo-Ureta et al. [
18] reviewed 167 farm-level technical efficiency studies to examine the impact of various attributes on technical efficiency estimates using meta-regression analysis. Among 167 reviewed studies, only 23 studies incorporated an age variable to estimate farm efficiency, and of those, seven studies used age and age-square to impose the inverted-U assumption. The other studies assumed a linear relationship between age and farm efficiency.
Liu and Zhuang [
19] investigated operator age, which is one of their efficiency variables, in order to capture the impact of physical strength and farm experience on efficiency by employing farm-level data in China from a rural household sample survey in 1990. They found that farm efficiency increases until the household head reaches the age of 40, and declines afterward. Abdulai and Eberlin [
5] measured the technical efficiency of maize and bean farmers based on a cross-section survey of 120 households in Nicaragua during April 1994 and March 1995. They found that improvements in technical efficiency were explained by the operator’s education, age, access to credit, and family size. They also found that the farm’s efficiency increased as the household head ages initially, but begins to decrease the age of 38.7 years for maize and 39.5 years for beans. Fuwa et al. [
20] utilized farm-level and plot-level rice data to estimate a translog stochastic frontier production function for farms in eastern India. They incorporated the household head’s age as a proxy for farming experience, and found that learning from experience plays an important role in increasing farm efficiency. A recent study by Li and Sicular [
7] employed a translog stochastic frontier production function to estimate the impact of age on the technical efficiency of Chinese crop producers using a panel survey data from 2004 to 2008. They found that a farm’s technical efficiency increased until the farmer was 45 years old, and declined after that. They argued this relationship captures the lack of incentives and motivation, risk-aversion tendency, and lower ability or willingness of older farmers to adopt new technology.
The results of previous studies such as Abdulai and Eberlin [
5] and Li and Sicular [
7] suggested the existence of a maximum farm efficiency according to age, which is driven by the assumption of an inverted-U shape. However, there is no evidence or validation for using a specific form on the relationship between age and farm efficiency. Considering that aging can be positively or negatively correlated with productivity, a specific functional assumption about the relationship between age and farm technical efficiency may not be appropriate. This paper utilizes the non-monotonic assumption initially suggested by Wang [
11] to investigate the relationship between aging and farm productivity in Korea.
3. Data
This study utilizes the Korean Farm Household Economic Survey (FHES), which is an annual national survey conducted by Statistics Korea. About 3000 farm households are randomly selected and replaced every five years by Statistics Korea. The FHES contains detailed information about managerial characteristics and economic activities such as the farm resources, financial conditions, revenues, and expenses of sample households. The FHES originally started in 1953, and is designed to improve agricultural management and establish agricultural policies. FHES is similar to the Agricultural Resource Management Survey (ARMS) of the United States Department of Agriculture (USDA) in terms of the overall survey procedures, questionnaires, and data generating systems. This paper employs two sample periods of the FHES between 2008–2015 to capture the most recent information. Specifically, our unbalanced panel dataset is composed of two different sub-panels spanning a five-year (2008–2012) and a three-year (2013–2015) period, respectively. The maximum, minimum, and average time period of farm households on our dataset are five, one, and 3.2, respectively. Among all of the types of farms in Korea, we selected crop farms that receive more than one-half of their total farm revenues from crops. In the FHES database, crops consist of six categories: rice, other grains, vegetables, fruits, flowers, and special crops (including medical crops such as ginseng). Meanwhile, livestock and dairy farms are not included in our sample due to their different production structure compared with crop farms.
To estimate farm efficiency, both production and inefficiency functions need to be considered simultaneously in a stochastic frontier production model [
21]. For the farm production function, we use total farm sales of crops, which are the main agricultural products of Korean farmers as an output, and land, labor, capital, and intermediates as four inputs. Cultivated land and labor are measured in
area and
hours, respectively. Agricultural fixed assets other than land and livestock are used as proxies for capital input, and are measured in value terms. Expenditures on fertilizer, pesticide, seed, water, electricity, fuel, etc. are used as intermediate inputs and measured in value terms. All of the values are deflated by 2010 prices using product-specific nationwide price indices to remove systematic variation in prices. To investigate the sources of inefficiency in farm production, we incorporate the following characteristics as explanatory variables: leading farmer’s age, gender, educational attainment, family size, the proportion of family labor relative to total labor hours, farm household’s liability (or debt) ratio, the share of non-agricultural revenue in farmers’ income, and the share of decoupled income support in farm income.
Table 1 shows the descriptive statistics for all of the variables used in the analysis (from 2008 to 2015). Farm outputs, total labor, cultivated arable land, intermediate input expenditures, and fixed agricultural assets vary greatly, because this is farm-level data. This also indicates that farm crop production and the structure of inputs have changed much since 2008. The average age and average educational attainment are 66.7 and 8.1, respectively, indicating that Korean farmers are old and not very educated. Considering the family size and percent of labor supplied by the family, 2.6 and 78.2%, respectively; in other words, most Korea crop farms are small.
The debt ratio, which is defined as the total debt of the farm household divided by its agricultural assets, has a high standard deviation and rose rapidly on average from 1.5% in 2008 to 23.5% in 2015.
This phenomenon could indicate that the deficit between income and expense has an increasing trend, since farm investment does not increase during the sample period with respect to inputs of capital and the intermediate good (
Table 1). The higher debt ratio may have a negative effect on farm efficiency due to credit constraints on purchasing sufficient inputs or adopting effective technologies. As shown in
Table 2, non-agricultural revenue accounts for about one-third of farm household revenue in Korea.
There are two main schemes of decoupled income subsidies, which are separately recorded in the FHES as Public subsidy and Agricultural subsidy. The main public subsidy is the Basic Old Age Pension (BOAP) system for those aged 65 and over, which was launched in 2008 with a monthly allowance of up to 90,000 won. The Korean government reformed this system in 2014 by restricting its qualification to the elderly in the bottom 70% income group as well as by linking the BOAP to the National Pension (NP) so that the maximum monthly allowance increased to 200,000 won depending on what the NP plan pays to a recipient. It is considered effective for income redistribution, particularly in super-aged rural areas. Direct payments are the other types of targeted support for farmers. Among agricultural direct payments, the fixed payment for paddy fields enrolled for the 1998–2000 crop years is a representative decoupled direct payment in Korea. In 2005, Korea established an income support program for rice farmers, and abolished the “Rice Purchase Program”, which was one of market price support programs. The income support program is composed of a fixed payment scheme for paddy fields and deficiency payment for the targeted rice price. From the recent Korea notifications for domestic agricultural supports to the WTO, the average fixed direct payment for paddy fields was 646 billion won during the period from 2008 to 2011. It occupies about 10% of the average total domestic support and 1.6% of the average total agricultural production at the same period (WTO, G/AG/N/KOR/43, 53 available at docsonline.wto.org). The amount of the payment is 700,000 won/ha, and is not related to the type or volume of production. The sum of the two subsidies is used as the variable ‘decoupled income subsidy’.
The main variable, Age, is expected to have a significant relationship with production efficiency, since age is related to a farmer’s skills and experience. As mentioned before, the age-dependent physical and cognitive skills are not likely to change much until a certain age, but they will decline thereafter. Experience is expected to have a positive relationship with farm efficiency, and the effect of experience on efficiency also might decrease with additional years of farming after a certain point. Therefore, the combined effect of age-dependent skills and experience on farm efficiency are expected to have a non-linear relationship.
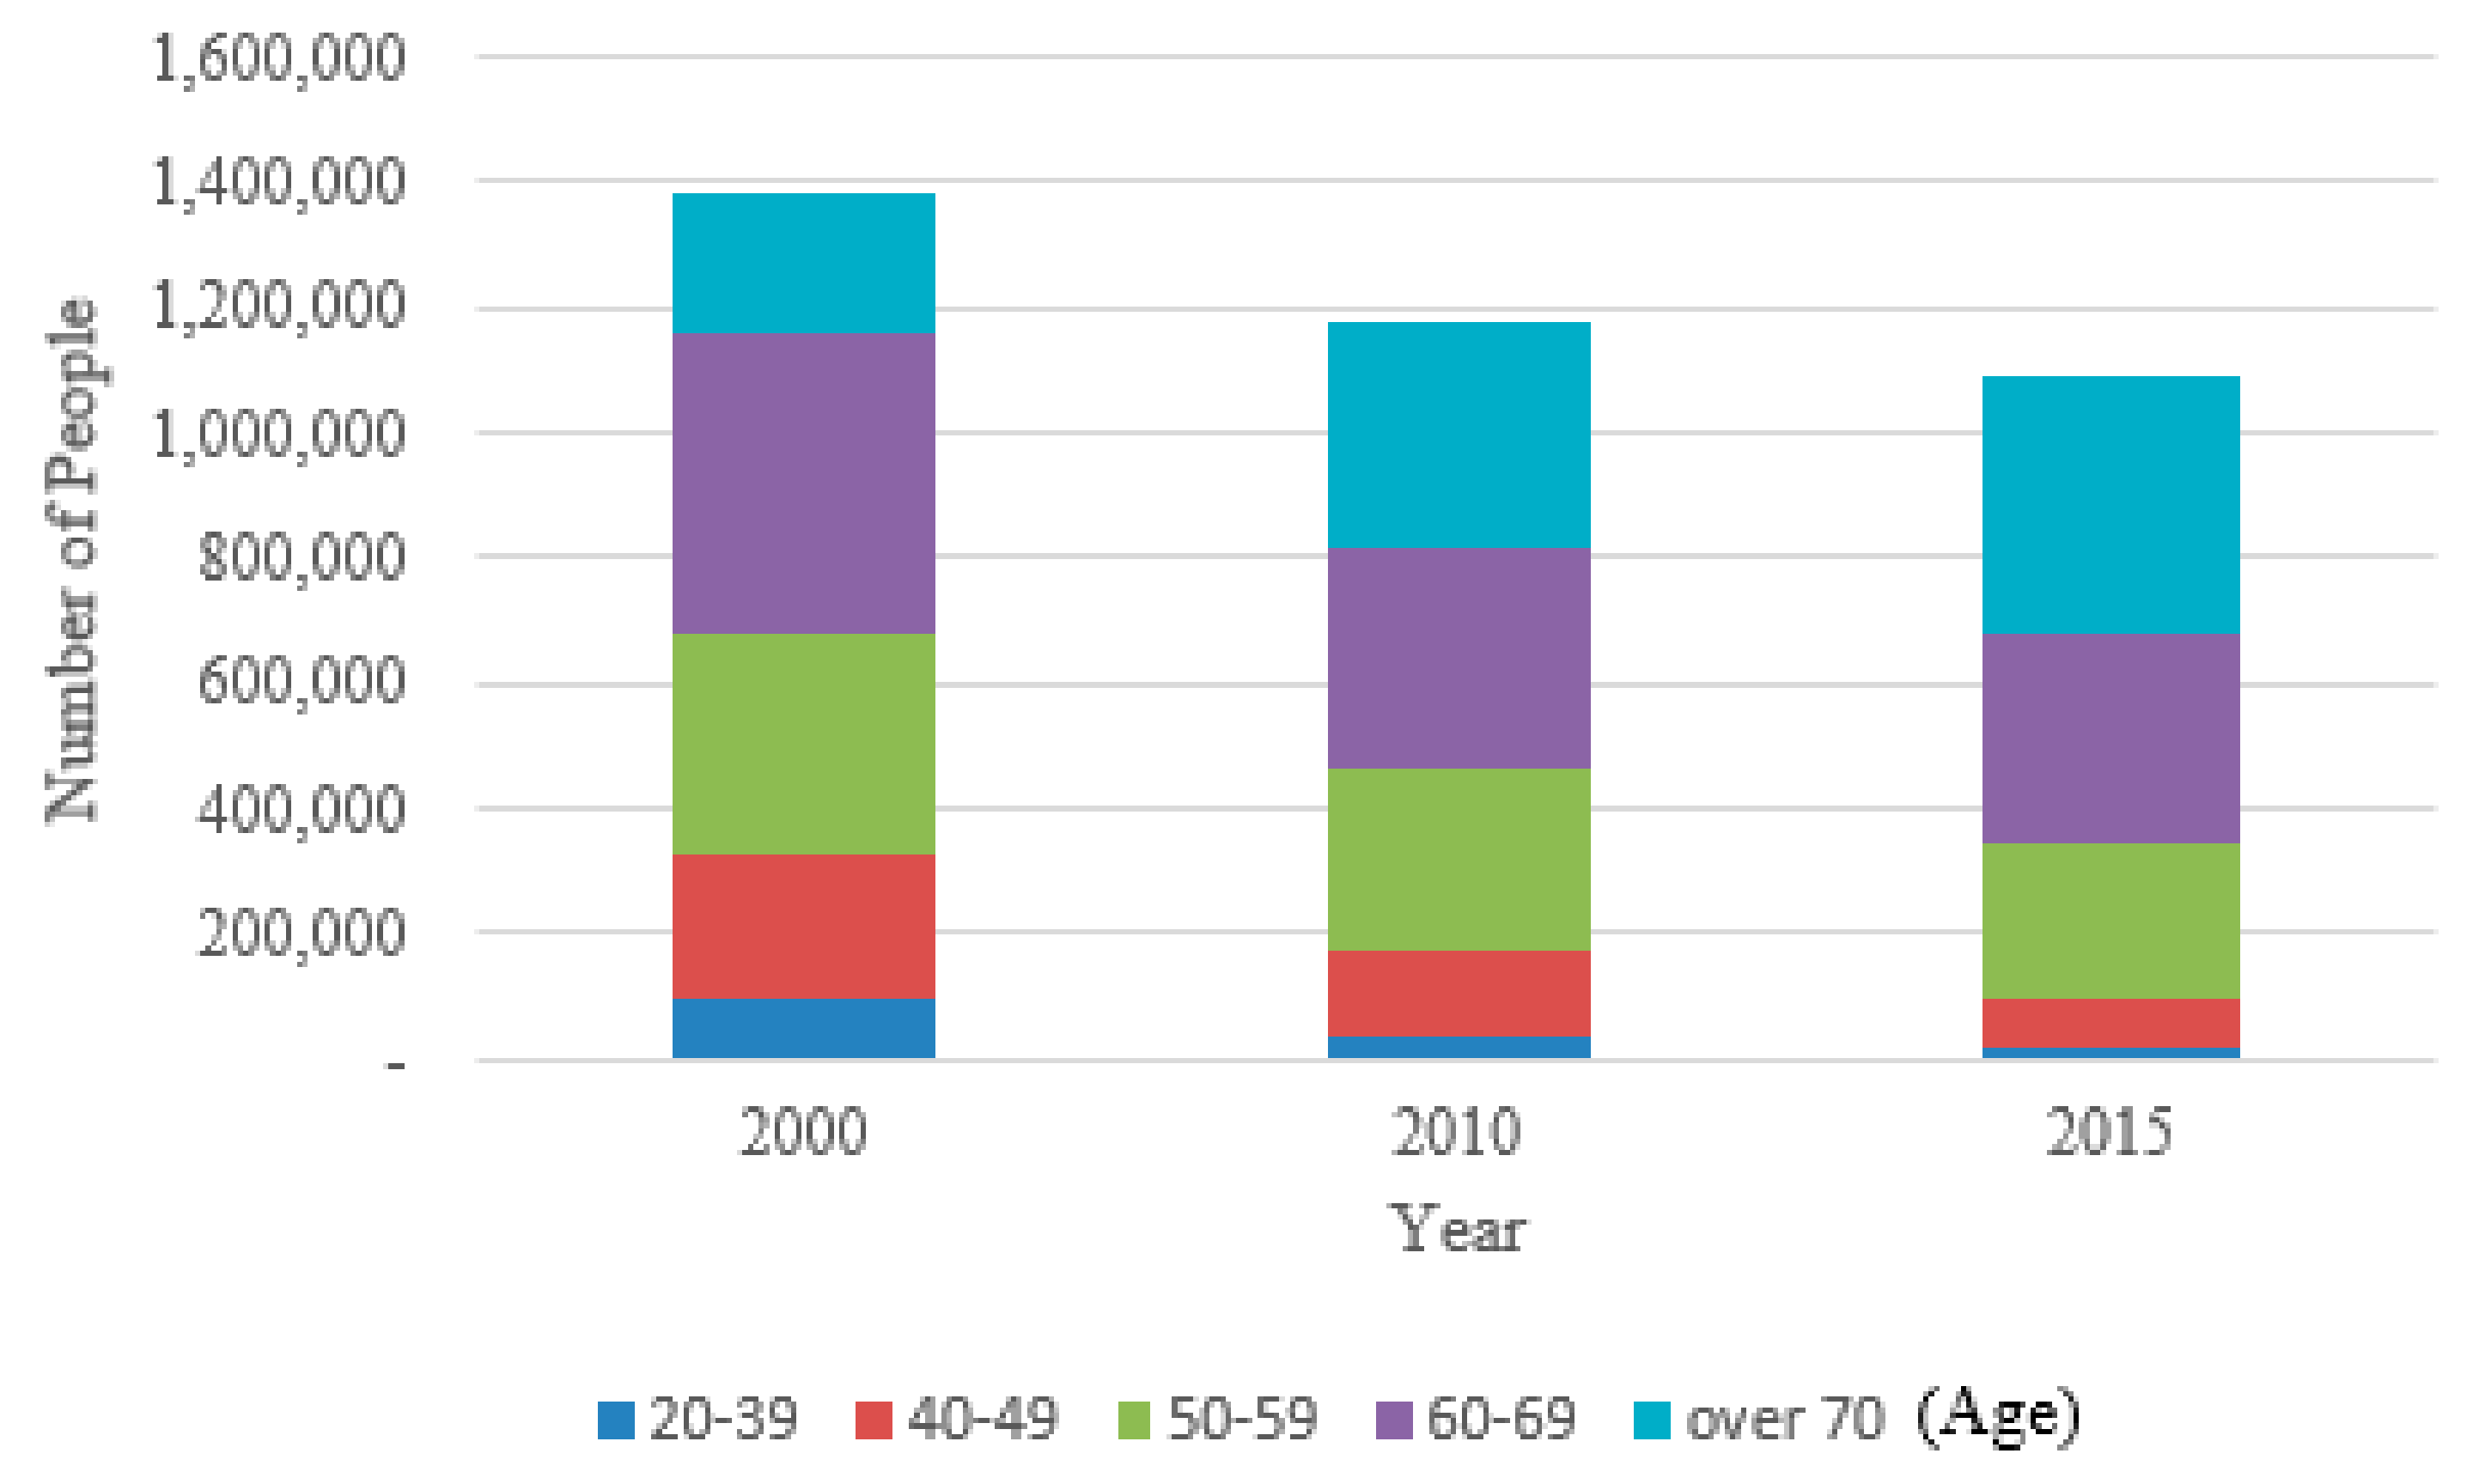
Figure 1 illustrates how the age distribution of Korean farm operators has changed. It shows that the average age has increased in the last 15 years. The proportion of the population aged 65 and older in farm households was 38.4% in 2015, which is more than three times the average for Korea (
http://kostat.go.kr). In our sample, a super-aged agricultural sector is reconfirmed by the proportion of farm operators aged 70 and older reaching 30.9% in 2010 and increasing by 6.9 percentage points by 2015.
Educational attainment, or human capital, is expected to be positively associated with farm efficiency. A higher level of human capital results in the reallocation of farm resources more effectively in response to changes in relevant information, technology, and economic conditions.
Table 3 shows how aging and education are inversely related. In our sample, most farmers under age 50 had more than a high school education (12 years), whereas most farmers over 50 had less than a middle school education (9 years).
5. Results
The results of the estimated stochastic frontier functions with Cobb–Douglas and translog forms are presented in
Table 4. Based on the results of the likelihood ratio test (LR test), we find that the translog is preferred over Cobb–Douglas. Specifically, the LR test statistics are
with a
p-value of 0.000, which indicates that the translog is preferred to the Cobb–Douglas function. The estimated input elasticities from the two production frontiers are similar, despite the strict assumptions embedded in the Cobb–Douglas functional form. Based on
Table 3, the estimated output elasticities in the translog for labor, capital, land, and intermediate inputs are 0.48, 0.07, 0.25, and 0.33, respectively. We use transformed data where the output and five inputs are measured relative to their sample means, so that the translog elasticities evaluated at means are simply the parameter estimates (
) themselves. Labor has the largest elasticity, followed by intermediate input and land. These results are similar to Kwon and Lee [
31], who investigated Korea rice farm productivity. The sum of the elasticities of all of the inputs is 1.12, which is statistically different from 1 (
with a
p-value of 0.000), suggesting increasing returns to scale for crop farms in Korea. Even though crop farms in Korea have increasing returns to scale, the share of agriculture value added in GDP has decreased since 1990 based on the World Bank Database. A possible explanation is the limitations on agricultural land and labor due to strong competition in manufacturing and service industries. In addition, Korea has chosen an export-led growth policy based on manufacturing goods, which leads to a shift in labor and land toward the manufacturing sectors. The low elasticity of capital is not consistent with previous studies, such as Battese and Broca [
32], Fuwa et al. [
20], and Sharif and Dar [
33]. This result could be explained by excessive investments in agriculture from the large-scale government subsidies that aim to compensate for losses in the agricultural sector from trade liberalization, such as the 1990s WTO regime and free trade agreements (FTAs).
Based on the LR test result, this study only focuses on the results of efficiency estimators in the translog function. The estimated value of 3.65 (
) represents the relative ratio between the truncated standard errors in the inefficiency function and the standard errors in the random errors of the stochastic frontier function. This result indicates that any variation in technical inefficiency is a significant component of the total variation of output [
21]. The technical inefficiency term,
, represents a loss in farm productivity. Our empirical results reveal that age, education, gender, the debt ratio, and the share of decoupled income support are negatively associated with efficiency. On the other hand, family size appears to have a positive effect on efficiency.
The variable of
Age has a negative (positive) effect on farm efficiency (inefficiency).
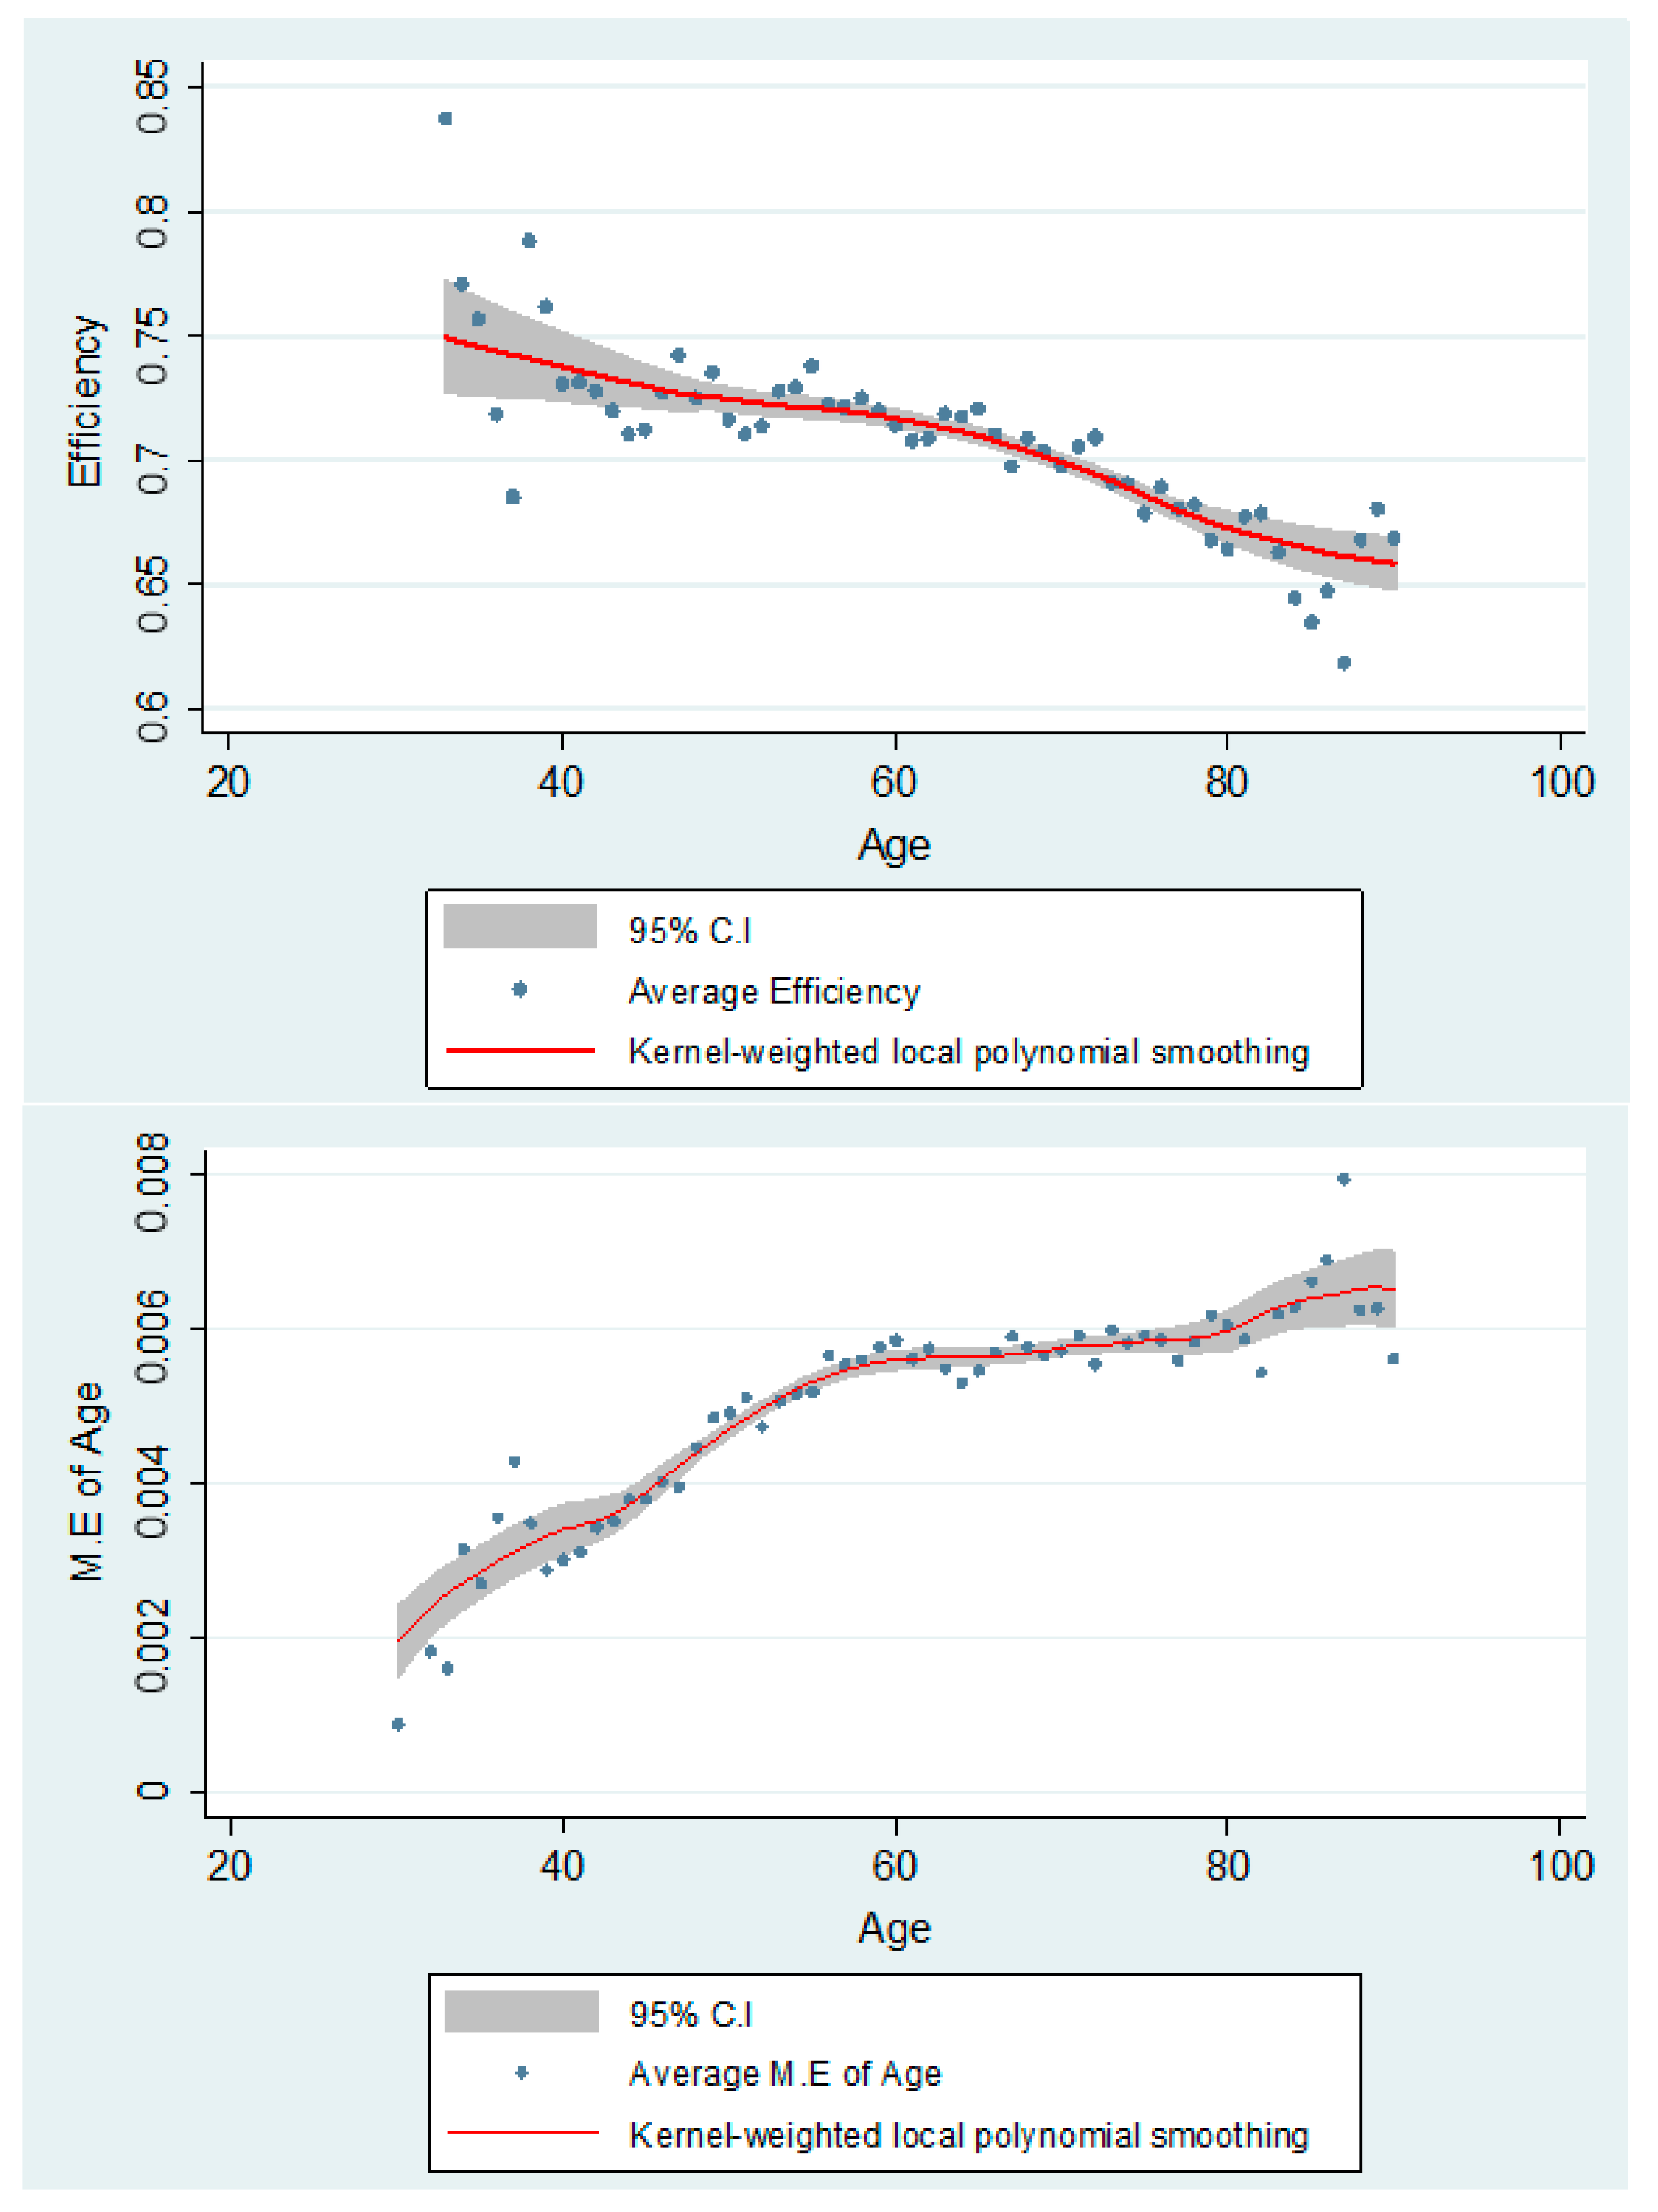
Figure 2 is composed of two graphs. The top graph represents the overall farm efficiency according to age, and the bottom graph shows the average marginal effect of age on farm inefficiency. According to
Figure 2, the marginal efficiency and therefore average efficiency declines consistently for each higher-age group.
Figure 2 shows the results of a Kernel-weighted local polynomial smoothing for the technical efficiency findings for various groups. The first graph shows the average efficiency by the age of the farmer. The second graph shows the marginal effect of age on farm inefficiency. This finding contrasts with previous literature such as Abdulai and Eberlin [
5] and Li and Sicular [
7], who assumed an inverted-U relationship between age and farm efficiency. The negative marginal effect of age on farm efficiency increases with age. In other words, farm efficiency is continuously decreasing in age.
The negative effect of education on farm efficiency is consistent with recent studies for China [
6,
7] and the U.S. [
34]. On the other hand, our finding is contrary to those of Abdulai and Eberlin [
5], Battese and Broca [
32], and Liu and Zhuang [
19], which use data for developing countries. These results contradict human capital theory, and might be explained by the very low levels of education in the sample. In our sample, 41.7% of farm leaders had only a primary school education, and 9.1% of them had no schooling at all. Another possible explanation for the negative effect of education is job switching from agriculture to non-agricultural industries; people with higher skills don’t stay in agriculture. Goodwin and Mishra [
34] argued that the higher educational attainment of farmers may cause more job switching from agriculture to non-agriculture. Considering that Korea is one of the most rapidly developing industrialized countries, the probability of job switching out of agriculture appears to be high compared with developing and less-industrialized countries.
Larger families tend to be more efficient than smaller families, because they have enough family labor for farm operations. Yet a higher share of family labor reduces the efficiency of crop production. This finding is contrary to the findings of Zhu and Lansink [
13], who found that family labor is more motivated or better skilled than hired labor. Since Korean farmers are aged and less educated, our contradictory results with Zhu and Lansink [
13] are not surprising. We also find that female farm managers, occupying only 8% but with a gradually increasing trend in our sample, are less efficient than male farm managers.
The debt rate is negatively associated with farm efficiency, indicating that less accessibility to credit discourages farm innovations. The ratio of non-agricultural to agricultural revenue, implying the income dependence of household on non-farm work, shows a negative relationship with farm efficiency. This result is consistent with previous literature such as Abdulai and Eberlin [
5] and Huffmann [
35], but contrary to Li and Sicular [
7] and Zhengfei and Oude Lansink [
36]. The negative effect indicates that non-farm income in rural areas does not lead the farmer to invest in the farm business to increase farm efficiency.
The share of decoupled income subsidies in total farm income is negatively associated with farm efficiency. This is supported by the findings from Hennessy [
37], Sckokai and Moro [
38], Serra et al. [
39], and Zhengfei and Oude Lansink [
36] in that increased income from decoupled subsidies lowers the motivation for enhancement efforts toward farm productivity. Since farmers in Korea are older, the income subsidy may not give motivations for innovations (remember that much of the subsidy is targeted toward older Koreans). The decoupled support might be good to alleviate poverty, but it does nothing to support the agricultural industry in Korea.
Table 5 presents the contribution of specific variables to efficiency change. During the sample period of 2008 to 2015, farm efficiency fell by 0.084. Over 50% of this fall in farm efficiency is accounted for by changes in age (30%), education (4%), family size (12%), and share of family labor (6%). The effect of the aging farm population was the factor that had the largest effect among the variables.
6. Conclusions and Policy Implications
This paper investigates the impact of age on farm efficiency in Korea using the FHES longitudinal dataset from 2008 to 2015 to examine the unclear relationship between aging and productivity. We employ a translog stochastic frontier model based on Battese and Coelli [
21] that allows an estimation of the farm production and efficiency functions simultaneously. Utilizing non-monotonic assumptions by Wang [
11], this study examines the different marginal effects of age on farm efficiency. We also estimate the effect of Korea’s income subsidy on farm efficiency, as well as other demographic variables.
Our results present that farmer age has a negative effect on farm efficiency for all of the age groups in Korea. The magnitude of the marginal effect of age on farm efficiency increases with age, and recent decreases in farm efficiency are largely explained by age. In other words, the aging structure of the agricultural sector in Korea is the key factor hindering the development of sustainable agricultural in Korea. Furthermore, we find that the Korean income subsidy has a negative effect on farm efficiency, which implies even though Korea farmers earn more incomes, they do not tend to invest their extra money in producing the agricultural products. One possible explanation is the super aging structure of the agricultural sector in Korea. Aged farmers do not have an incentive to invest their money in long-term perspectives, since they will retire soon. The report of the Korea Rural Economic Institute (KREI) in 2016 found that farmers under 65 years old tend to invest much more than other groups of farmers (
http://lib.krei.re.kr/pyxis-api/1/digital-files/605ba745-b4f3-2a94-e054-b09928988b3c). In turn, aging also hinders the impact of government policy on sustainable agricultural development in Korea.
Findings from this study have policy implications for the existing literature on age and farm efficiency, as well as sustainable agricultural development. First, this study finds that farm efficiency in Korea is continually decreasing in age, but it is not linear, based on the non-monotonic assumption proposed by Wang [
11]. This implies that the recent policy of Korea, “Returns to the Farm and Rural program”, is appropriate for achieving agricultural sustainable development in Korea. However, policy makers in Korea should be careful about their target people’s age. Recently, most people who are more than 50 years old participate in the “Returns to the Farm and Rural program”. Thus, policy makers should develop a specific incentive policy to encourage young people to participate this program for the achievement of sustainable development.
Second, the negative effect of income subsidy in Korea indicates that farmers do not invest their income subsidy back into the farm. As we mentioned, this result might reflect the super-aged structure of Korean agriculture, or its lack of comparative advantage. In turn, policy makers should consider coupled subsidies rather than decoupled subsidies. Regarding decoupled income subsidy, farmers do not have any duties to invest subsidies in their production. On the other hand, coupled subsidies force farmers to invest money in their production processes. Even though the restriction may cause costs, coupled subsidies are more appropriate for the development of sustainable agriculture.


