Integrating CFD and GIS into the Development of Urban Ventilation Corridors: A Case Study in Changchun City, China


1
College of Geo-Exploration Science and Technology, Jilin University, Changchun 130026, China
2
Changchun Institute of Urban Planning and Design, Changchun 130000, China
*
Author to whom correspondence should be addressed.
Sustainability 2018, 10(6), 1814; https://doi.org/10.3390/su10061814
Submission received: 23 April 2018
/
Revised: 24 May 2018
/
Accepted: 29 May 2018
/
Published: 31 May 2018
(This article belongs to the Special Issue Climate Resilient Urban Development)
Abstract
:Given the situation of urban expansion and environmental deterioration, the government and researchers are paying considerable attention to ventilation corridors. The construction of urban ventilation corridors requires quantitative data support. Computational fluid dynamics (CFD) has advantages in the fine assessment of wind environment, and a geographic information system (GIS) has excellent performance in spatial analysis. With Changchun City used as an example, this study proposes the establishment of ventilation corridors on an urban scale to mitigate the urban-heat-island effect, and to accelerate the diffusion of air pollution. CFD simulations provided detailed spatiotemporal characteristics of wind speed and wind direction at various heights. These simulations were useful for identifying potential ventilation corridors. In general, the wind-speed and wind-direction characteristics at a height of 30 m clearly indicated potential ventilation corridors. Potential paths existed in the leading wind and south–north directions. The areas that required improvement were favorably situated in the path of potential ventilation corridors. The main roads, green spaces, and water had good connectivity. A total of five ventilation corridors were constructed, and they will directly affect the poor urban thermal environment, and enhance the mobility of air.
1. Introduction
China previously underwent a dramatic urbanization process. Its urbanization level was 49.9% in 2010, and reached 57.35% by 2016 [1]. With the increase in the built-up area, the urbanization process significantly changed the nature of urban land use and the urban spatial structure [2,3]. Urbanization led to a series of ecological environmental problems, such as vegetation reduction, the urban heat island (UHI) effect, and haze [4,5,6,7]. A city is a place where human life is concentrated. Thus, improving the urban climate environment is essential in creating a green and livable city.
As the city expands, its three-dimensional (3D) structure also changes. The number of high-rise buildings is constantly increasing [8,9], which changes the city wind environment. Urban wind speed has generally exhibited a declining trend, and windy weather has also decreased. Such deterioration is not conducive to the diffusion of heat, thereby aggravating the UHI effect [10,11,12,13].
Urban ventilation channels have become the focus of planning in China. From 2002 to April 2016, 36 cities in 17 provinces and regions in China were the subject of 63 special plans, or related research on urban ventilation corridors [14]. In recent years, the government has paid significant attention to the development of urban corridors. At the end of 2015, the Central City Working Conference presented a plan to enhance the rationality of the urban layout, urban permeability, and microcirculation capacity. In June 2016, the National Development and Reform Commission and the Ministry of Housing and Construction jointly issued an action plan for urban adaptation to climate change, which explicitly demanded an urban natural ventilation corridor be opened up to increase air mobility in cities [8,9].
The common idea of research on ventilation corridors is to conduct initial scientific research on the wind environment. Some studies assessed the urban wind environment by using statistics from numerous meteorological stations [15,16], and wind field evaluation based on computational fluid mechanics supplied additional details. However, such study methods require extra data and time, and are mostly focused on a block or a single-building scale; research on a city scale is rare [17,18,19,20]. Evaluation based on geographic information systems (GIS) and remote sensing (RS) has the advantages of easy access to data sources, and a large scale [21,22]. Many achievements were made with regard to potential urban ventilation corridors because of the urban spatial layout. However, this idea requires further consideration given the actual situation of a wind field [23,24,25,26,27]. The advantages of computational fluid dynamics (CFD) and GIS must be integrated to provide reference for the planning and construction of ventilation corridors.
This study aimed to construct urban ventilation corridors through quantitative analysis. To achieve our objective, we (1) established an urban-scale digital simulation model of the central area of Changchun, and transformed the complex urban space into a digital model that could be simulated in CFD; (2) simulated the characteristics of the wind environment during summer and winter in Changchun City on a city scale; and (3) proposed ventilation-corridor settings to improve the urban wind environment, and to alleviate the UHI effect.
2. Materials and Methods
2.1. Study Area
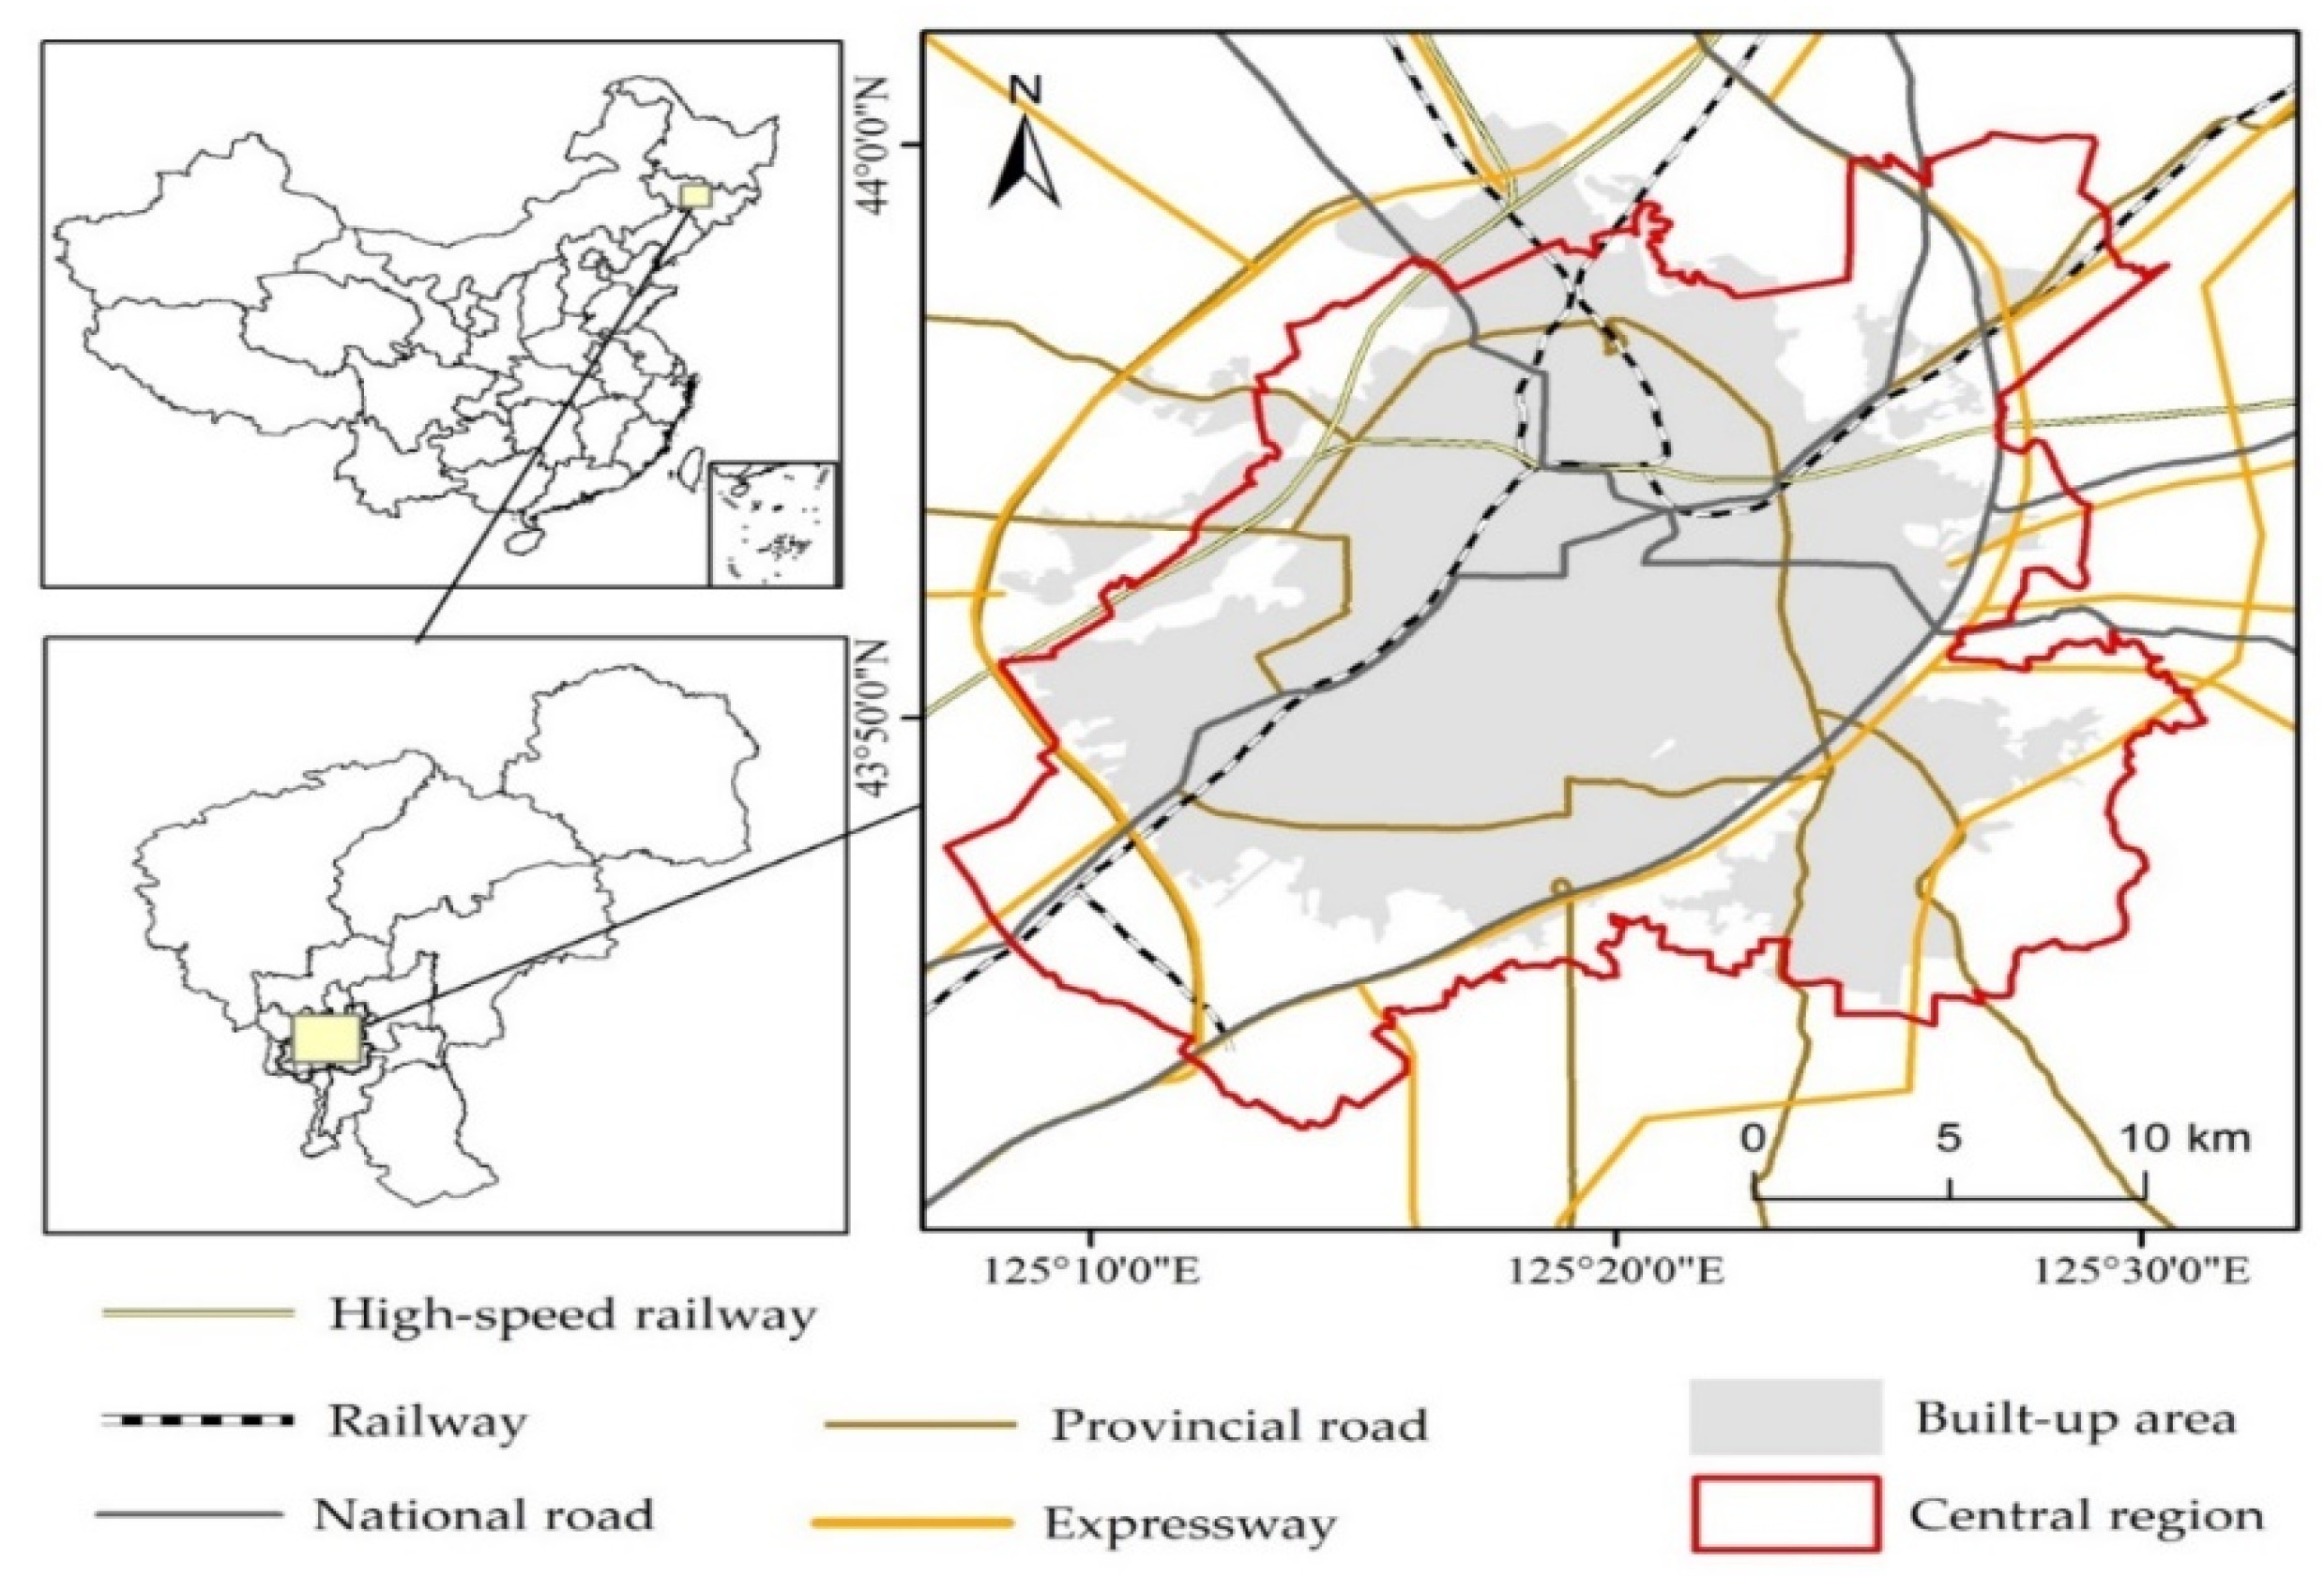
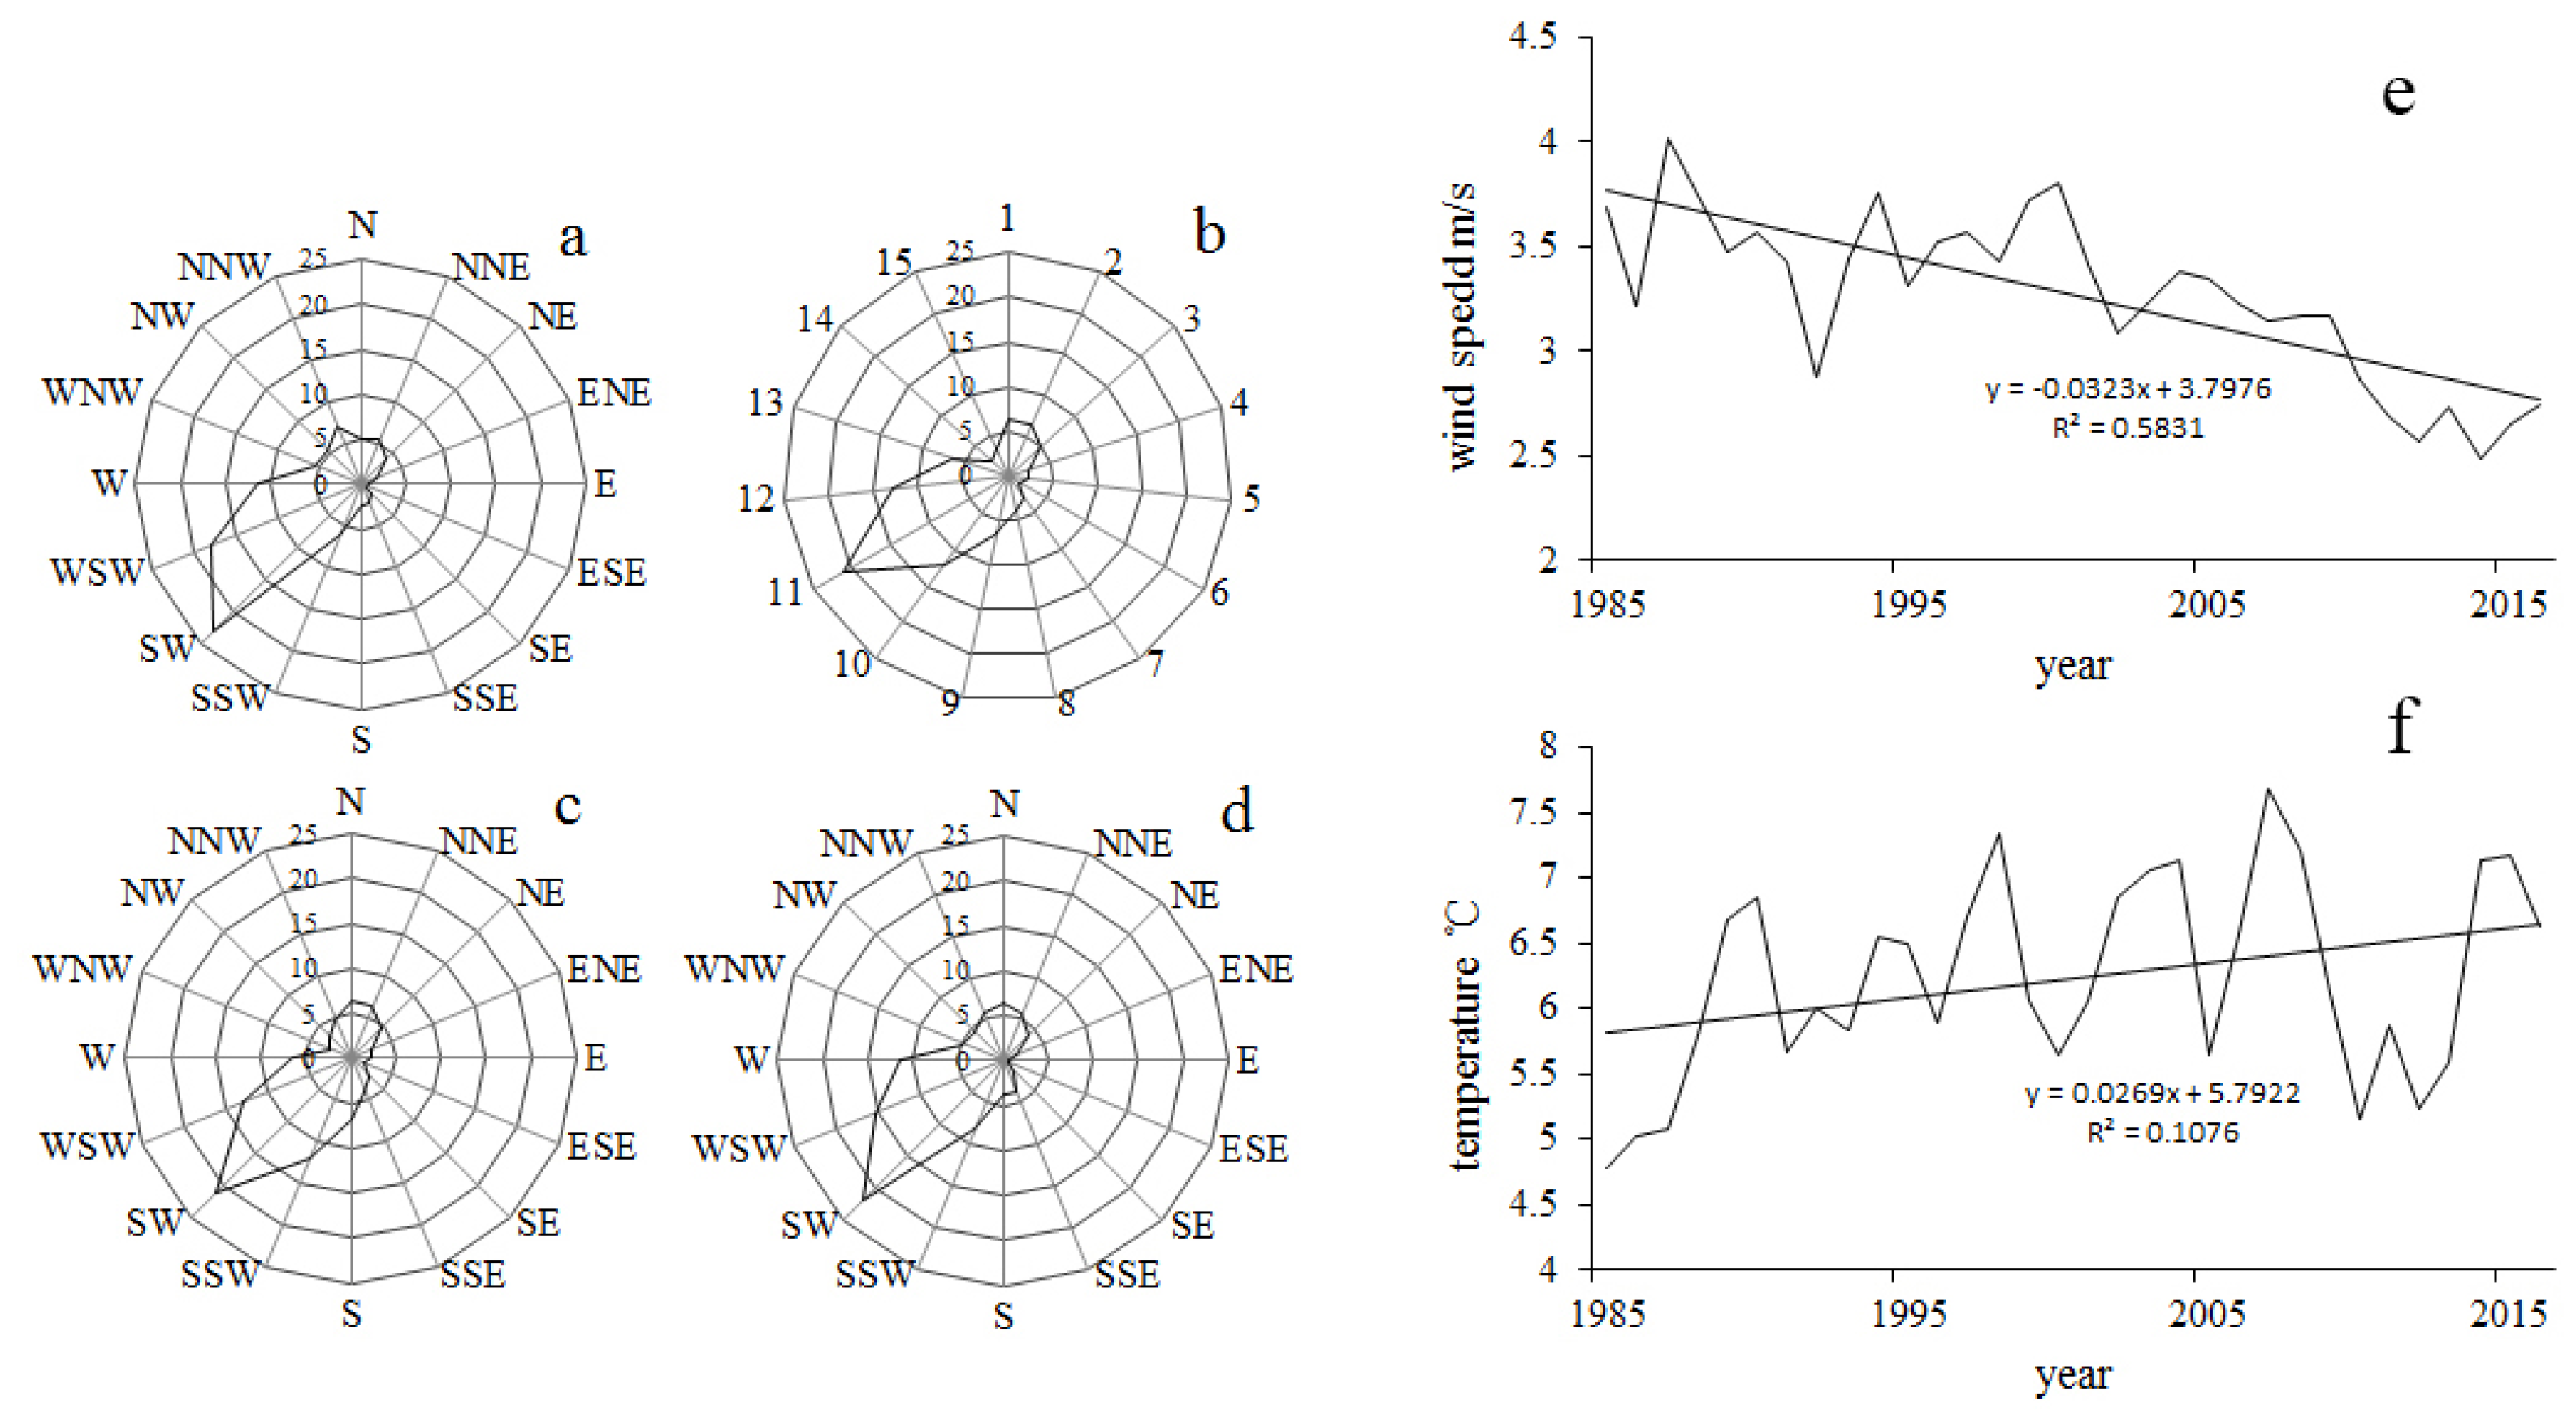
Changchun City (43°14′ N–44°05′ N, 125°03′ E–126°00′ E) is the capital of Jilin Province, and the natural geographical center of northeast China with an altitude of 250–350 m above sea level (Figure 1). Its climate is characterized by temperate continental monsoons, and has obvious seasonal variations, with the highest temperatures in July (mean value: 23.1 °C) and the lowest temperatures in January (mean value: −15.1 °C) [28]. The predominant wind direction is southwest, the wintertime is long, and most buildings are heated by coal. In the past 30 years, an obvious increasing trend was observed in the mean air temperature. The annual average wind speed in Changchun has fluctuated, and the overall wind speed has exhibited a significant downward trend. Our research area was set as the central region of Changchun City planning, which was the main construction area of the city (Figure 2).
2.2. Data Sources
The original data used in the study were divided into two major categories, namely spatial data, which included terrain, architecture, green space, and water-system space data; and meteorological data recorded in tabular form.
The raster terrain data were generated through elevation points extracted from a 1:500 topographic map, using the inverse-distance-weighting method. The building data were obtained through the following process: firstly, the building boundaries and building height data were extracted from the 1:500 topographic map; then, the high-resolution worldview image of 2016 was loaded into ArcGIS for building boundary renovation; finally, the updated height of the building was estimated through a street-view map. The distribution data of green space and water were extracted from the 2016 worldview image, on the basis of the object-oriented classification method using eCognition8.9 software. Monthly meteorological data from 1985–2016, and daily meteorological data from July 2016 to July 2017 were acquired from the meteorological data sharing network (http://data.cma.cn/). Air quality index (AQI) is defined as a dimensionless index that describes the air quality based on six atmospheric pollutants, namely PM2.5, PM10, SO2, CO, NO2, and O3, measured at the monitoring stations throughout each city in China. AQI is an index that presents air quality to the public, allowing people to arrange their activities and schedules accordingly. The daily AQI data were collected from the website of the Changchun Municipal Environmental Protection Bureau (http://www.ccepb.gov.cn/). A high index corresponds to poor air quality. Daily AQI is calculated as follows [29]:
where is the individual air quality index (IAQI) of pollutant , is the concentration of pollutant , is the high value of the concentration limit of the pollutant described by , is the low value of the concentration limit of the pollutant described by , is the corresponding IAQI of , and is the corresponding IAQI of (Table 1).
2.3. Methods
2.3.1. Data Preprocessing
GIS has advantages in data processing, and spatial analysis. The data processing function of GIS was used for the processing of building, terrain, and meteorological data. For spatial analysis, the GIS clustering analysis model was used to identify the homogeneous blocks. The inverse-distance-weighted interpolation method was used in ArcGIS to describe the spatial distribution of air quality. The functions of buffer analysis and overlay analysis were used in the identification of spatial patterns of areas that required improvement, and of potential air guide channels.
The complex city was transformed into a digital model that was simulated in CFD. The distributions of building density, population density, and greening degree in various areas of the city differed in this model. Various thermal characteristics were noted under the same urban climate conditions. In this study, regions with similar features were considered as a whole. In accordance with the current layout of the city, with the city’s main roads, mountains, rivers, lakes, and other conditions as boundaries, the central area of Changchun was divided into separate blocks. The average area of the 3393 blocks was 9.5 ha.
Grouping analysis performed a classification procedure that tried to find natural clusters in data. Given the number of groups to create, it looked for a solution where all the features within each group were as similar as possible, and all the groups themselves were as different as possible. Feature similarity was based on the set of attributes. The value was computed for each variable, and reflected how much of the variation in the original data was retained after the grouping process. The larger the value was for a particular variable, the better that variable was at discriminating among features.
where is the total sum of squares, and is the explained sum of squares. is calculated by squaring and then summing deviations from the global mean value for a variable. is calculated in the same way, except deviations are group by group, and every value is subtracted from the mean value for the group it belongs to, before being squared and summed.
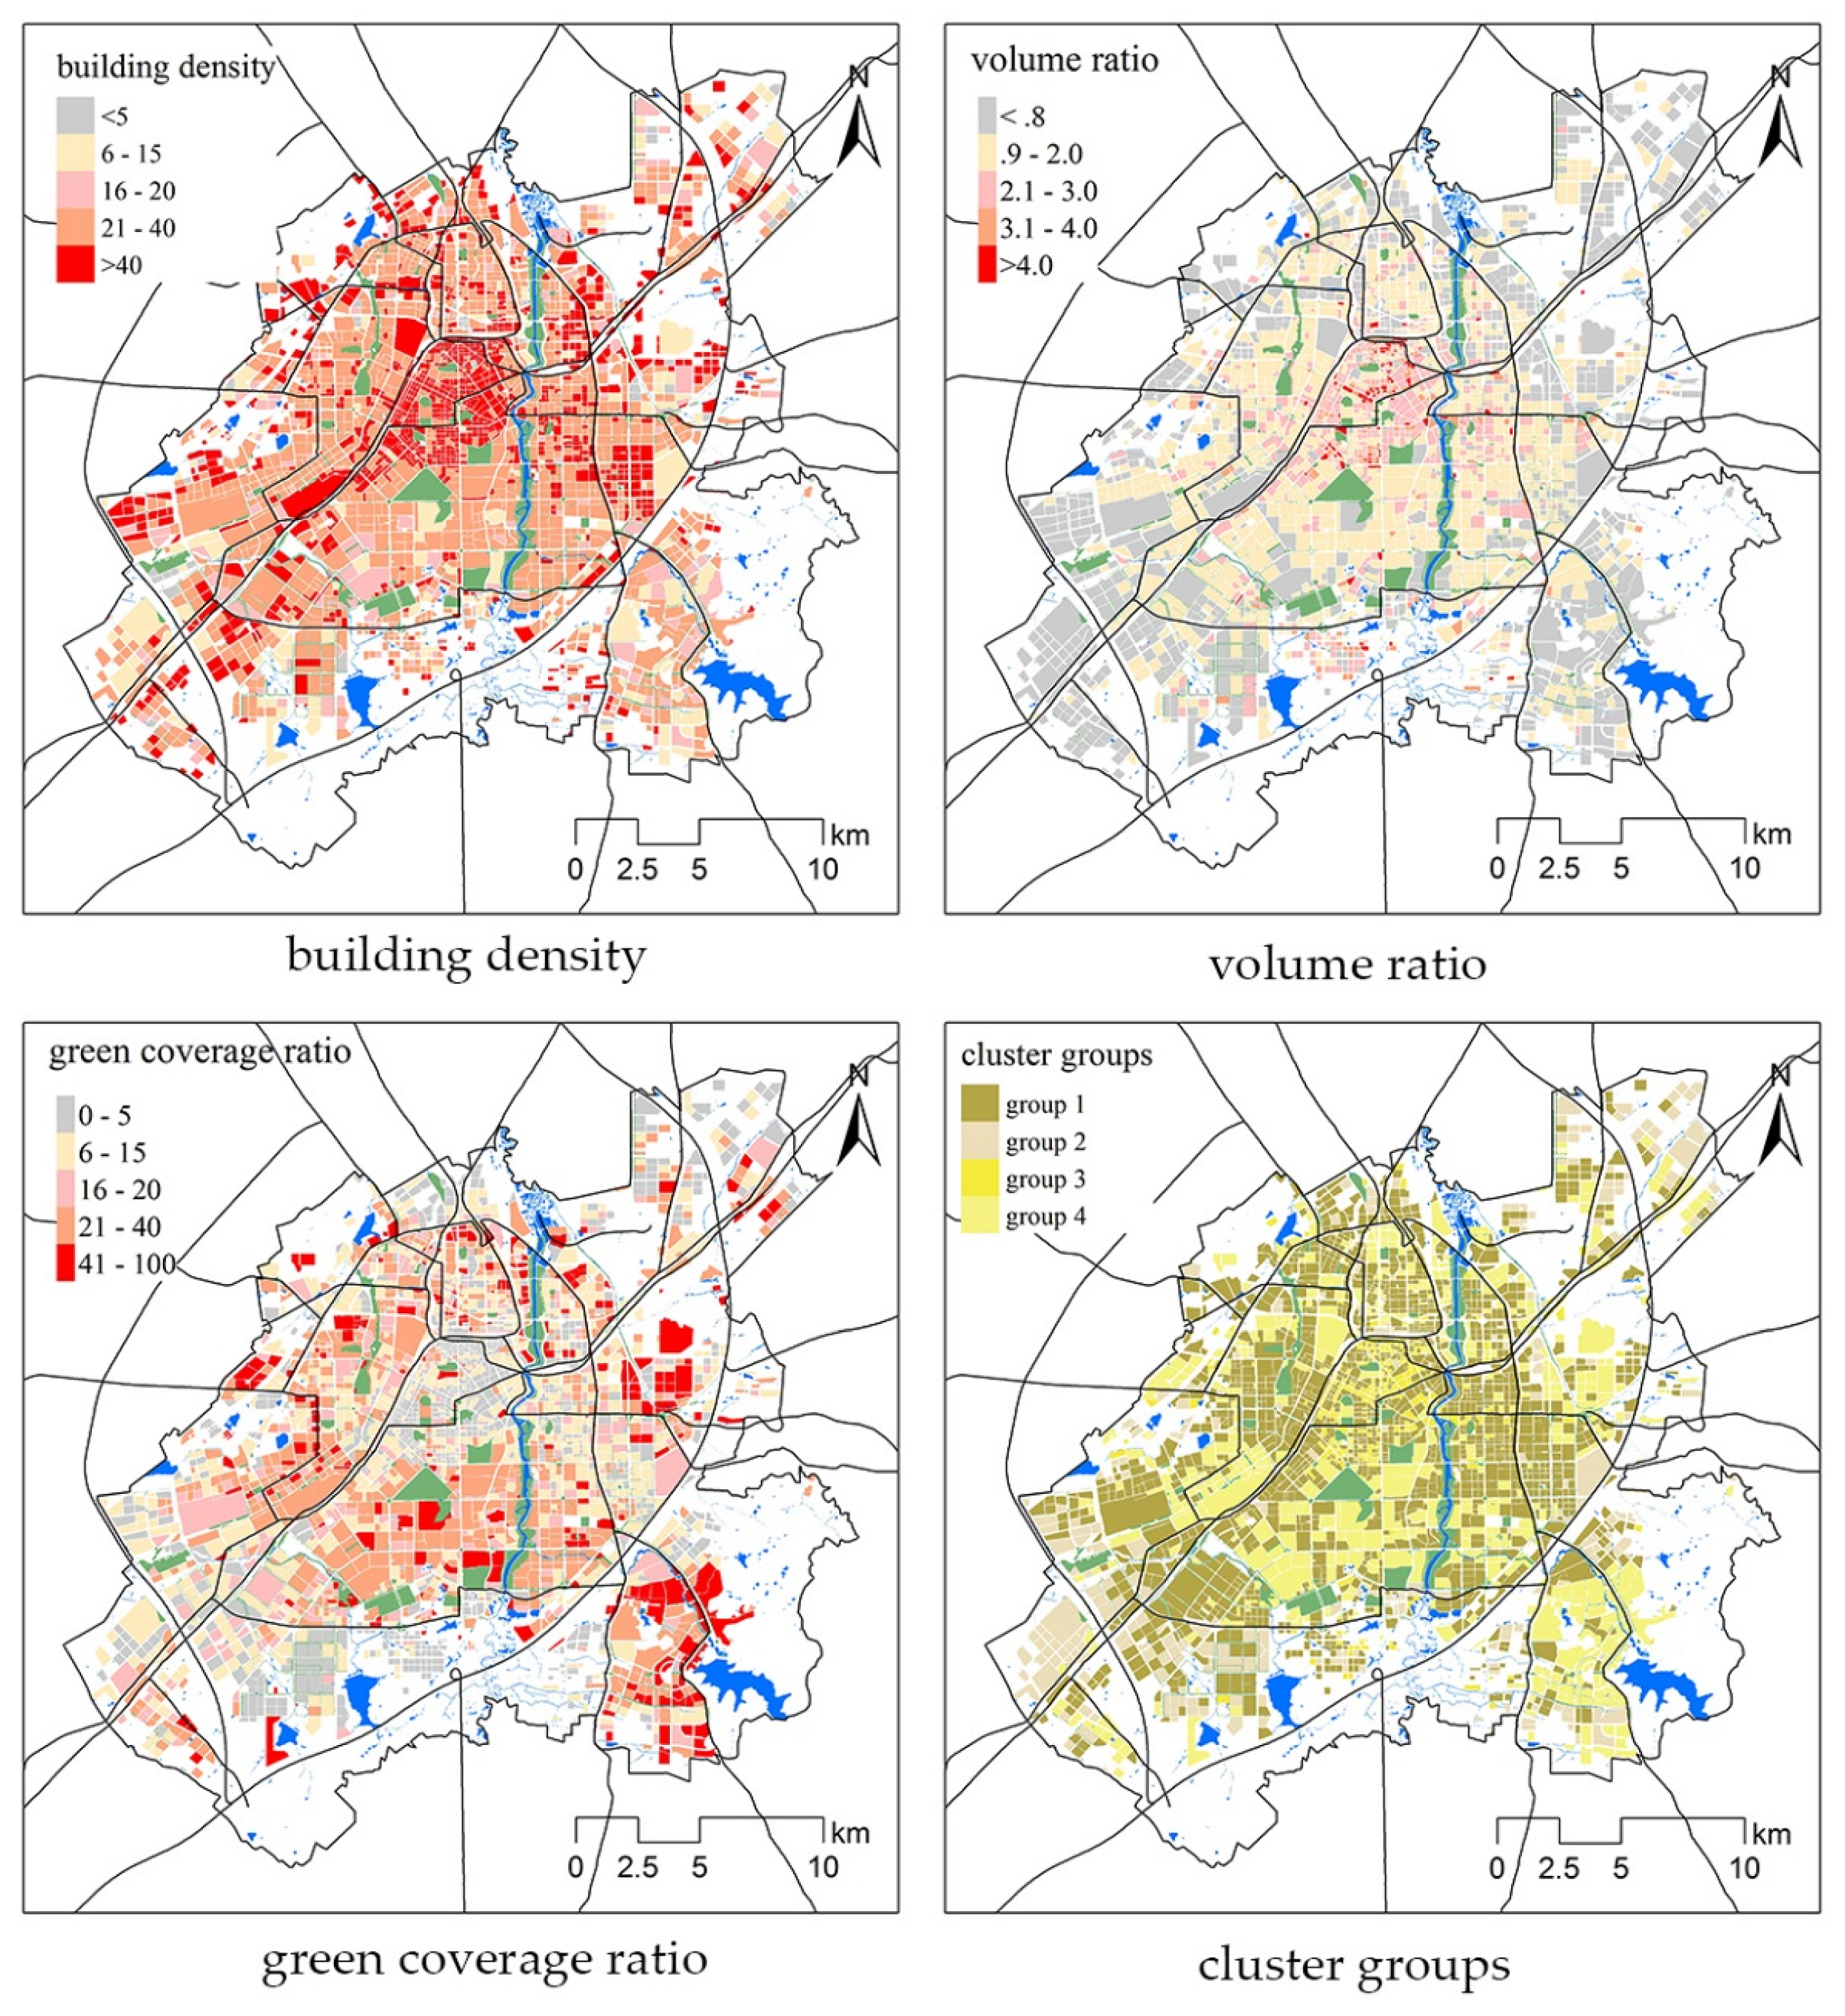
According to the building data and the underlying surface data, the mean building height, building density, volume ratio, and green coverage ratio in each block were calculated (Figure 3). Grouping analysis was implemented in ArcGIS. Blocks were divided into four groups on the basis of the blocks’ attributes (Figure 4).
Building density, which is also known as building coverage, is the main index that reflects the economic efficiency of construction land use. It refers to the ratio of the total base area of buildings to the total area of land planned for construction. This index is formulated as follows [30]:
where is the building density, is the total base area of buildings, and is the total area of land planned for construction.
Volume ratio is a measure of the intensity of construction land use. It refers to the ratio of the total floorage of all buildings, within the scope of the project, to the total area of the land planned for construction.
where R is the volume ratio, and and are the total floorage and total area of land planned for construction, respectively.
The coverage ratio of green space is one of the basic indexes that express the greening level of a city. It refers to the ratio of the total area of green space to the total area of the planning and construction land used in the scope of the project.
where D is the green coverage, is the total green area, and is the total area of construction land.
The mono-window algorithm (MWA) was used to map land surface temperature (LST). Through the radioactive transfer equation, Landsat thermal-infrared (TIR) data establish direct contact with LST. Many retrieval algorithms were proposed based on various assumptions for various data sources. Among these algorithms, the MWA was used to map LST, in which only three parameters were required: emissivity, transmittance, and effective mean atmospheric temperature. The basic form of MWA can be written as follows:
where = −67.366351, = 0.458606, = ετ, , and is the LST. is the at-sensor brightness temperature of the Landsat TIR band , ε is the land surface emissivity of band , is the atmospheric transmittance of band , which can be obtained on the United States Geological Survey (USGS) website based on the time of image acquisition, and the central latitude and longitude of an image; and is the effective mean atmospheric temperature, which can be calculated using air temperature [31].
2.3.2. Simulation Time Selection
Considering that this study aimed to alleviate the UHI effect, and improve the air environment to enhance human comfort, the dates during the summer (June–August) with the highest temperatures, and the adjacent dates with similarly high daily maximum temperatures were selected. Air pollution mainly occurs in winter (December–February). Heating and straw-incineration periods also occur at this time. Thus, the dates with the poorest air quality were selected.
From July 2016–July 2017, the highest temperatures appeared in July 2017. From 5 July to 7 July, the daily maximum temperature exceeded 30 °C. Accordingly, 7 July was selected as the summer simulation date. From December 2016–February 2017, the most severe pollution date appeared in January. Accordingly, January 8 was chosen as the winter simulation date.
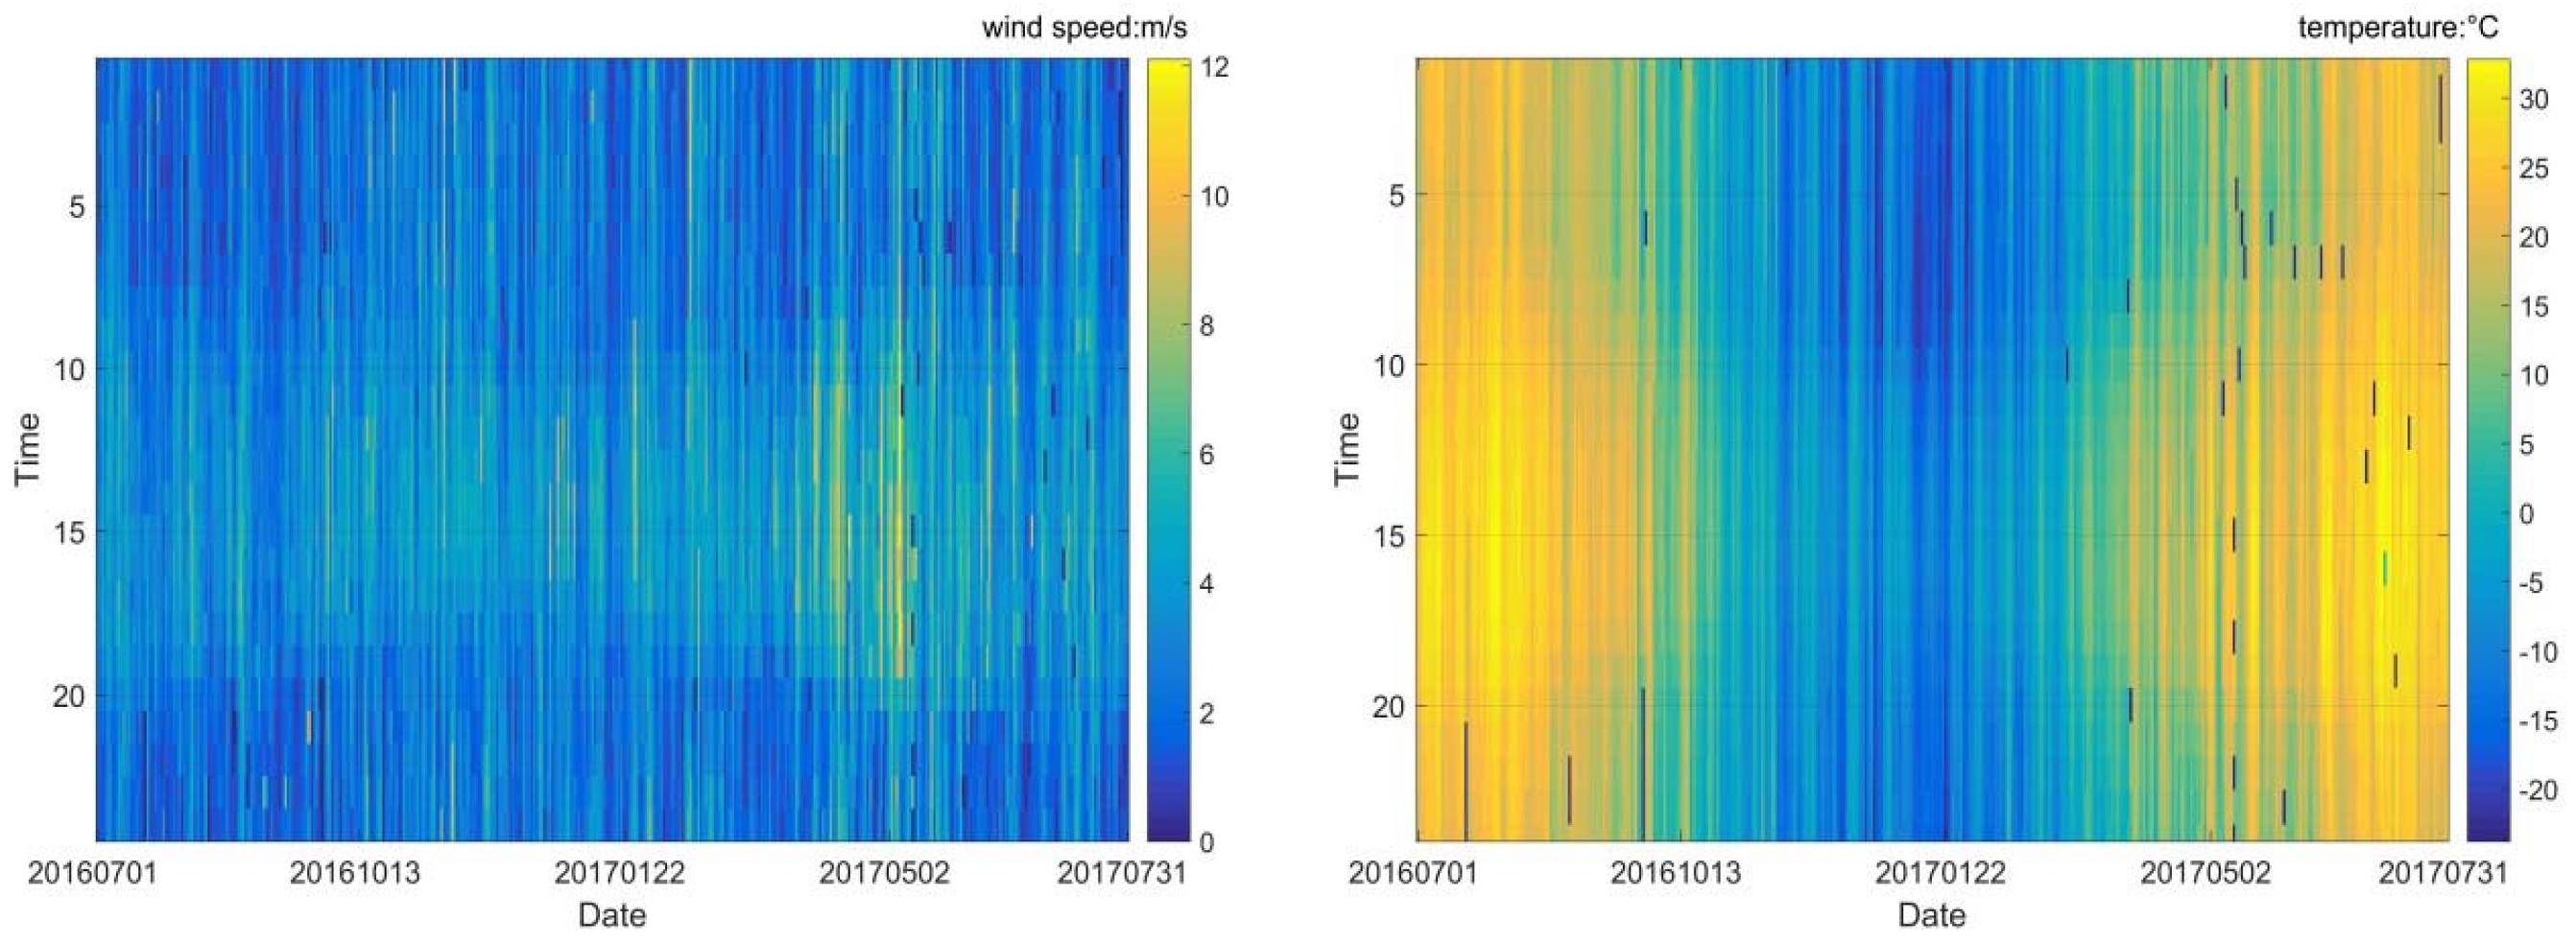
On the basis of the hourly meteorological data, the maximum wind speeds in Changchun were detected in spring, followed by autumn and winter. The lowest wind speed was found in the summer. Generally, the largest wind speed in Changchun appeared in the daytime. From July to January 2017, the high-speed wind duration was short, appearing only at around 12:00 p.m. From March to June, the high-speed wind lasted from 8:00 a.m. to 8:00 p.m. Across different seasons, Changchun had a large temperature difference. On a typical day, the highest temperatures appeared between 11:00 a.m. and 6:00 p.m. (Figure 5). High-speed wind and high temperatures appeared frequently in the afternoon, considering daytime as the time when people were outdoors, with the leading wind direction in Changchun. Finally, 12:00 p.m. on 8 January 2017, and 6:00 p.m. on 7 July 2017 were selected as the simulation times (Table 2).
2.3.3. Simulation Height Selection
The following heights were selected to simulate the meteorological features: 1.5 m for pedestrian height, 10–30 m for human living environment height, and 100 m for city canopy area [14].
2.3.4. CFD Model Establishment and Simulation
Firstly, a block 3D model was established according to terrain in the Autodesk InfraWorks software, based on the mean building height in the block. The model was then converted into the form (.dxf), identifiable by the Ecotect software. Secondly, the blocks were given various material attributes according to the average building density, volume ratio, and green ratio of each group. Blocks in group 1 and group 3 with high volume ratios or building densities were treated as cement, blocks in group 2 with low green coverages and low building densities were treated as brick, and blocks in group 4 with high green coverages and low building densities were treated as clay. Green space and water were assigned in Ecotect as two separate classes.
We chose WinAir as a CFD solver, which can be used in conjunction with Ecotect. The WinAir model was suitable for analyzing the response of the wind environment to the shape of the blocks, and had a high calculation speed. The model was efficient and feasible for studying the regional wind environment.
In this macro-scale research, the simulation area was divided into 99 rows and 99 columns, and the actual ground grid size was 320 m × 320 m. Finally, the meteorological information for the selected simulated times was used for the simulation parameters in Ecotect. The meteorological data of the Changchun area were used as the simulated boundary conditions. The entrance was set to the windward side of the area, the inlet wind speed was set to 4 m/s, the pressure outlet was set to the leeward side and the top of the region, the air viscosity was 1.8 × 10⁻⁵ Pa·s, and the surfaces of the ground and the blocks were set to a rough wall without slip. The total number of simulated iterations was set as 500 times, so as to obtain stable results.
3. Results and Discussion
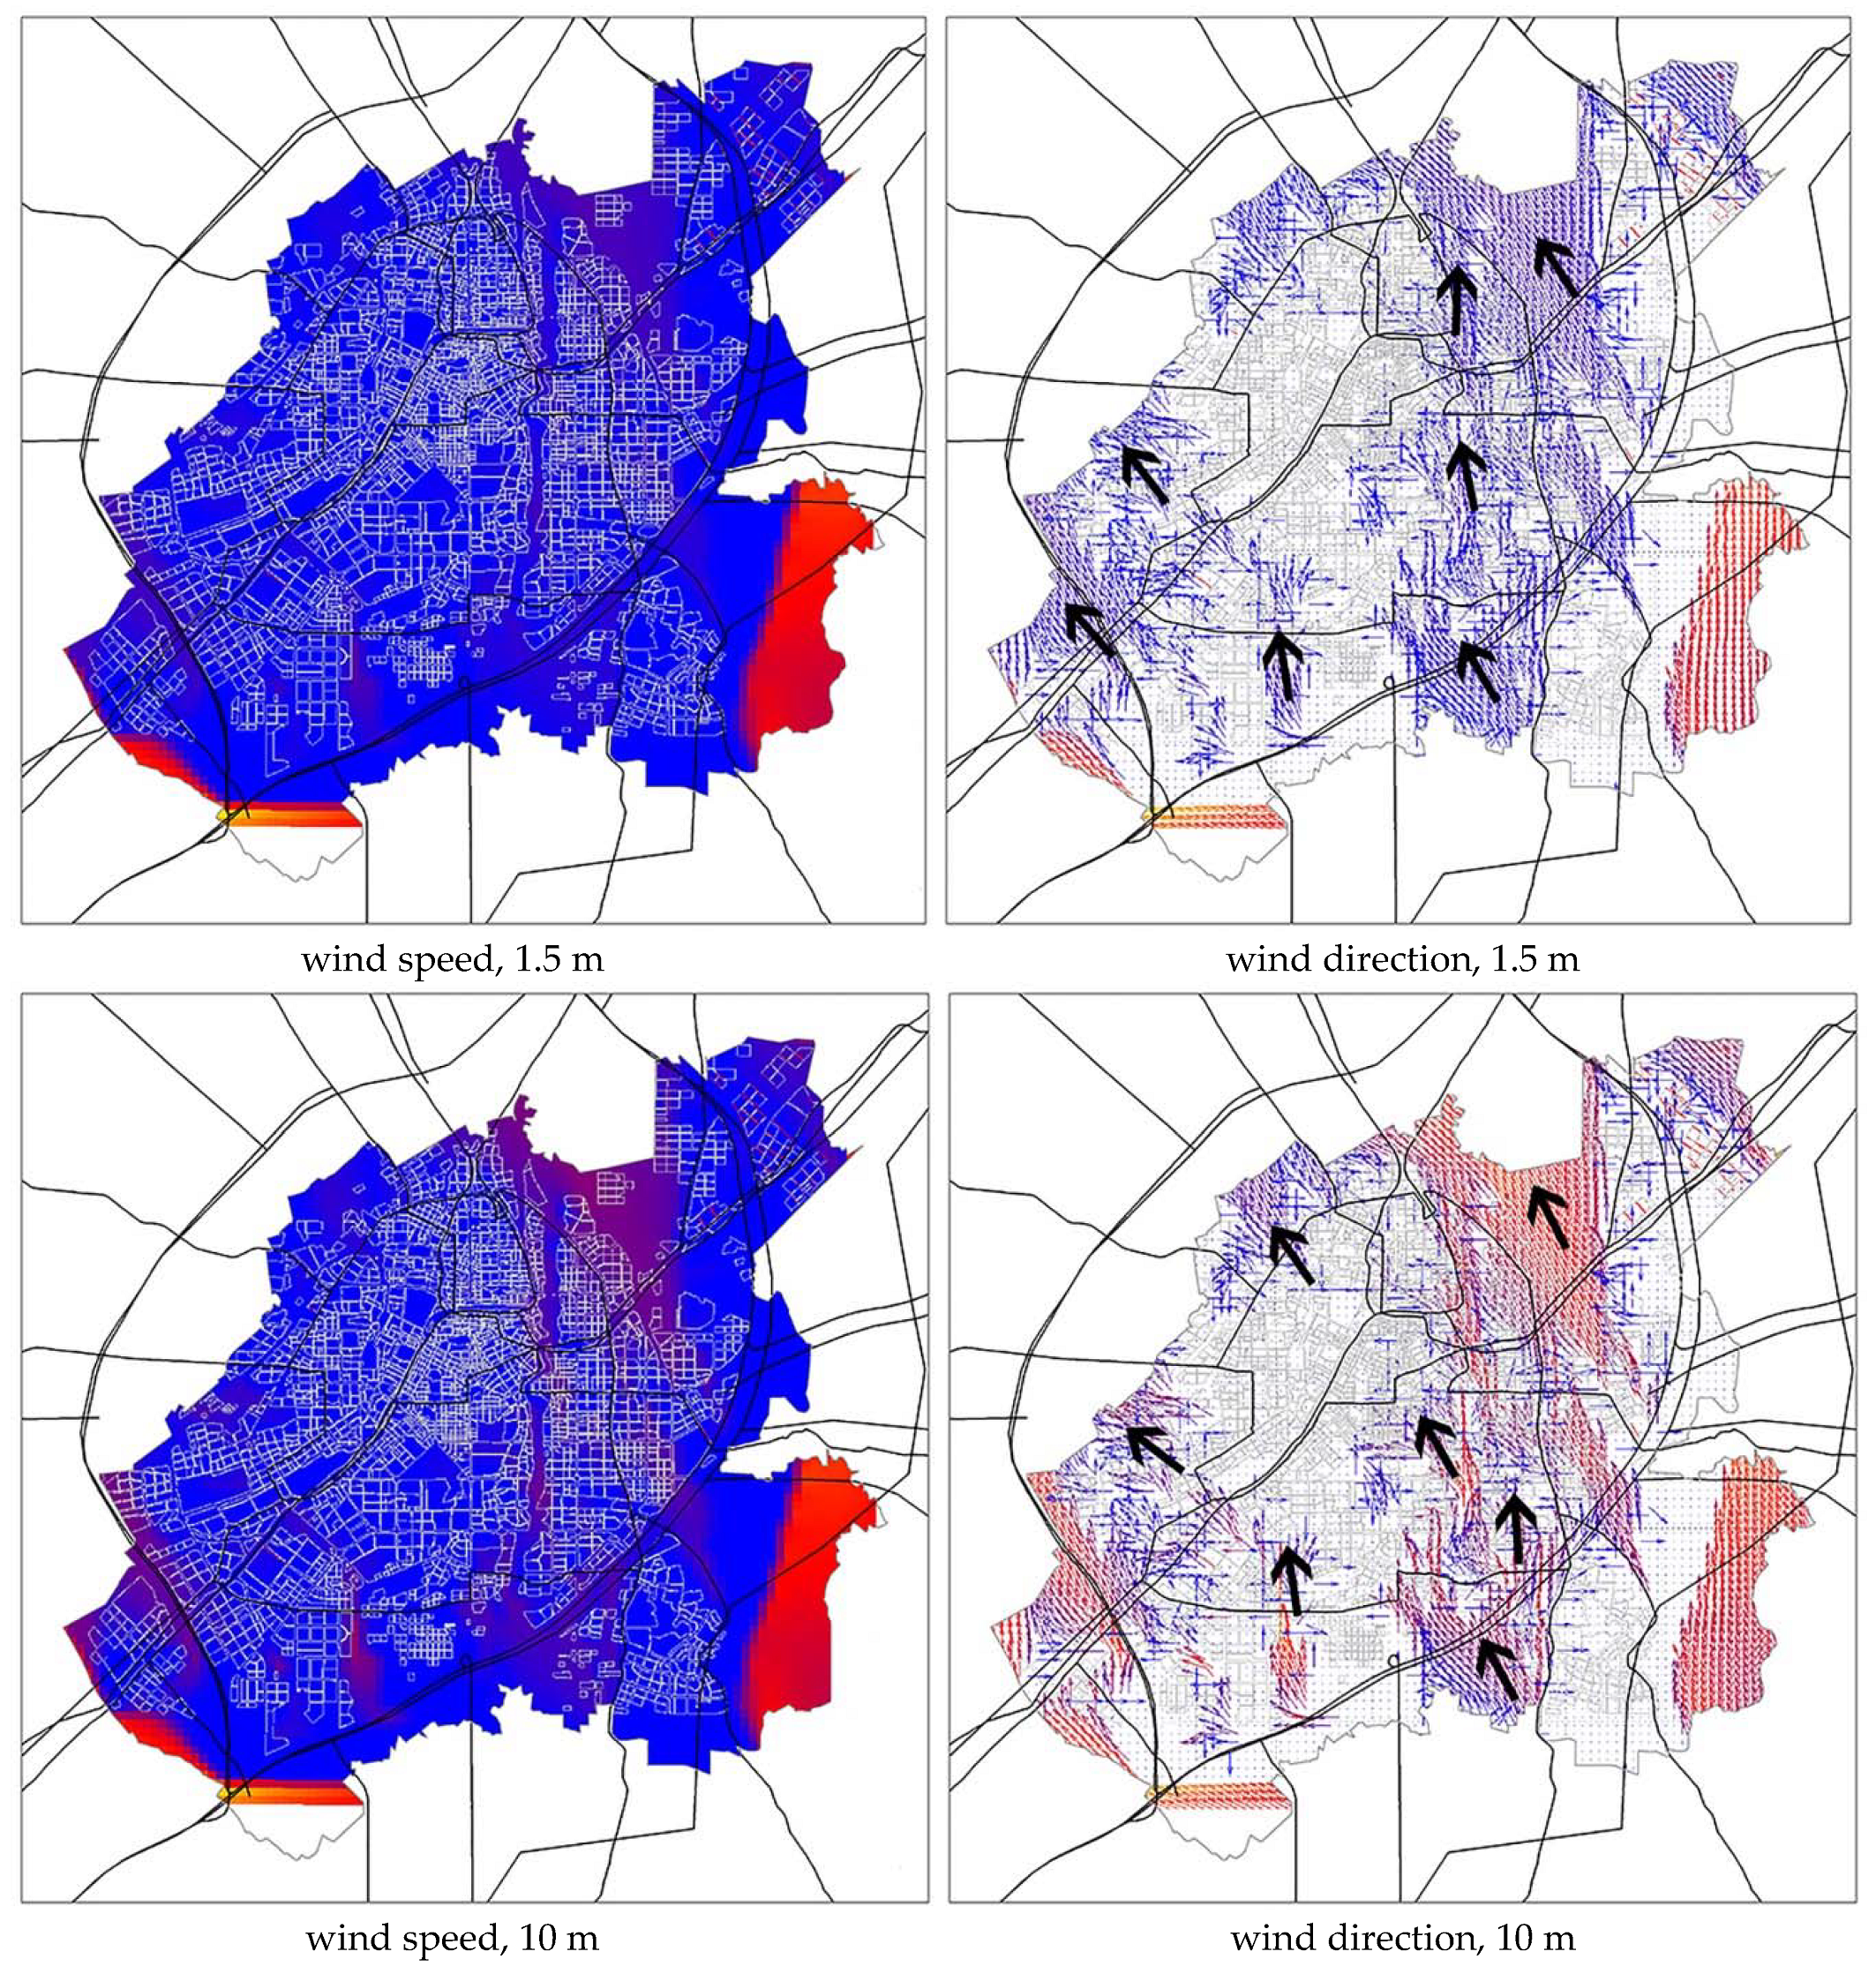
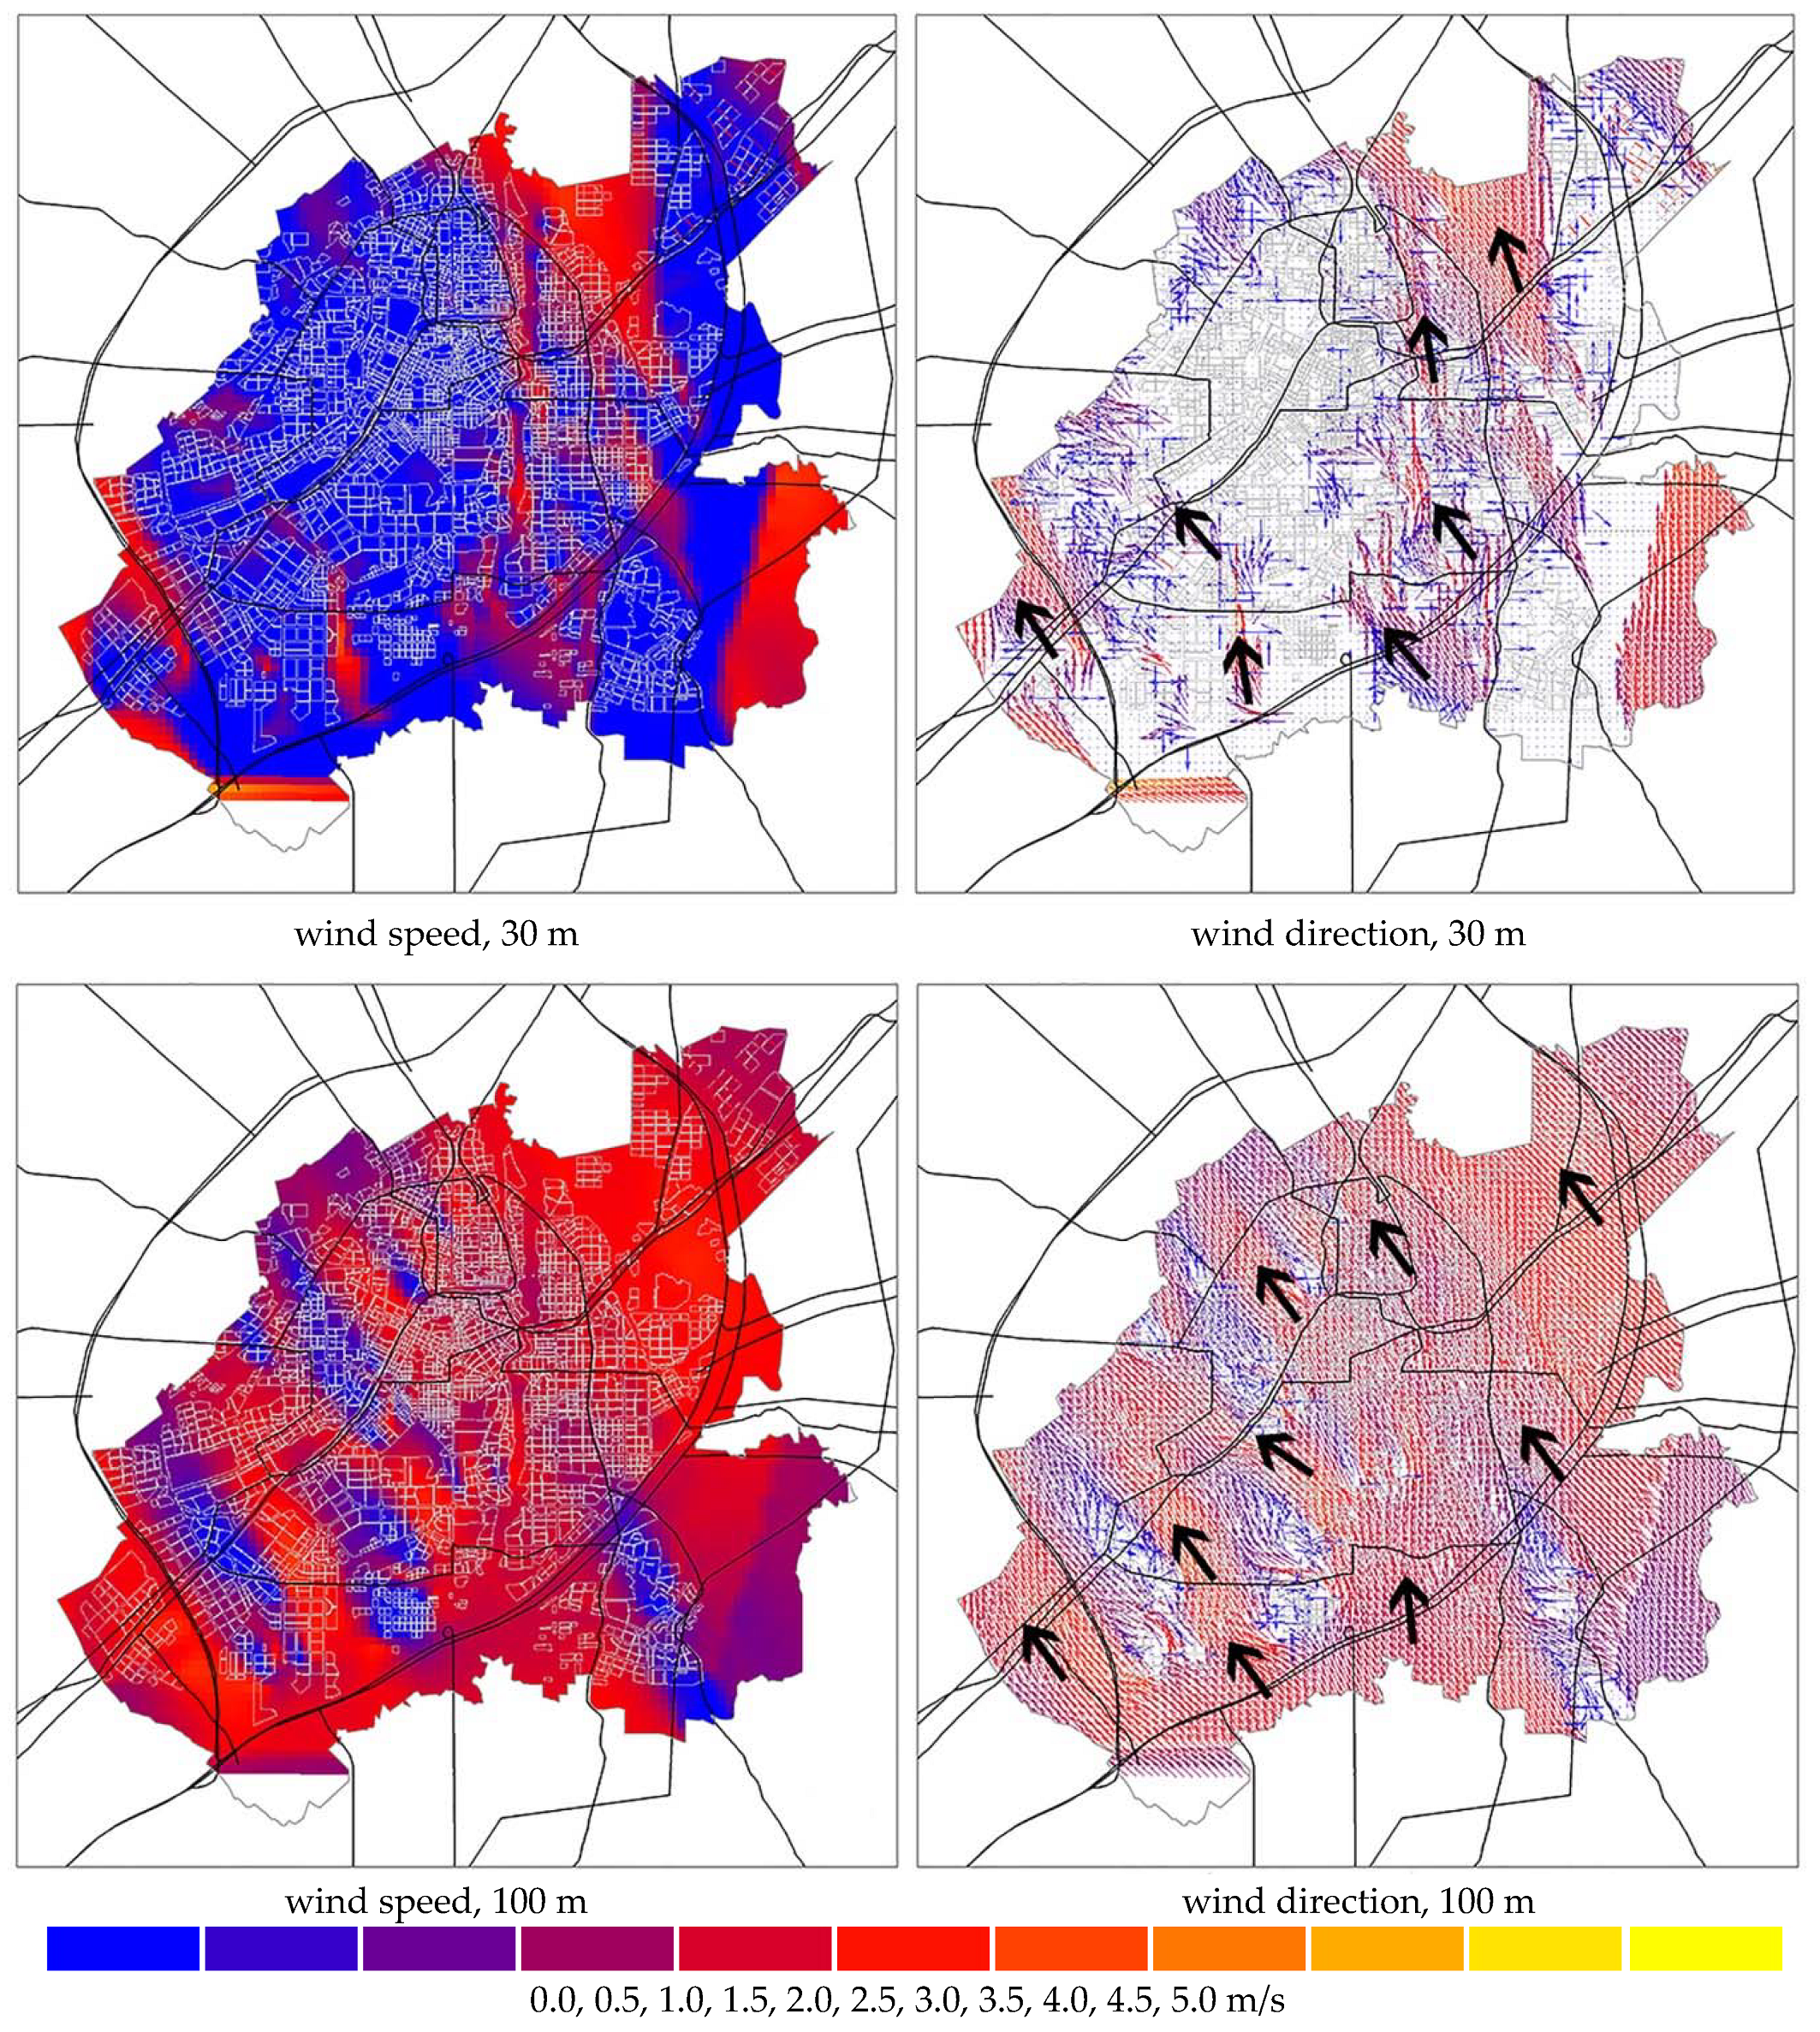
3.1. Characteristics of Winter Wind Field
The wind speed was distinctly different at various heights (Figure 6). At the height of 1.5 m, the wind speed was basically lower than 1 m/s. At heights of 10 m and 30 m, many buildings had no shelter effect on the wind field. Wind speed had a significantly enhanced effect. At the same time, wind on the south and north sides of the study area converged to the center. Finally, the highest value of wind speed was superimposed on Jilin Road. At the height of 100 m, the wind speed of the entire research area reached over 3 m/s. However, relatively low-speed wind occurred because of the development of high-rise buildings in southern Changchun in recent years.
The difference in wind direction was not apparent at various heights. In the beginning, wind basically entered the research area from the southwest. The direction of the wind changed in various regions. The direction of the northern wind changed to a southeast direction through the most northern part of the block, while the southern direction of the wind changed to a northeast one, and the two converged on the east side before leaving the research area. At the heights of 1.5 m and 10 m, the wind speeds in the center were small because of the blockage caused by buildings, and Jilin Road was the main outlet at heights of 30 m and 100 m.
In general, the characteristics of the 30-m-high ventilation corridor were obvious, and potential paths existed in the leading wind direction. At the same time, the area below 30 m was the main space for human habitation, which was suitable for ventilation corridor development on an urban scale.
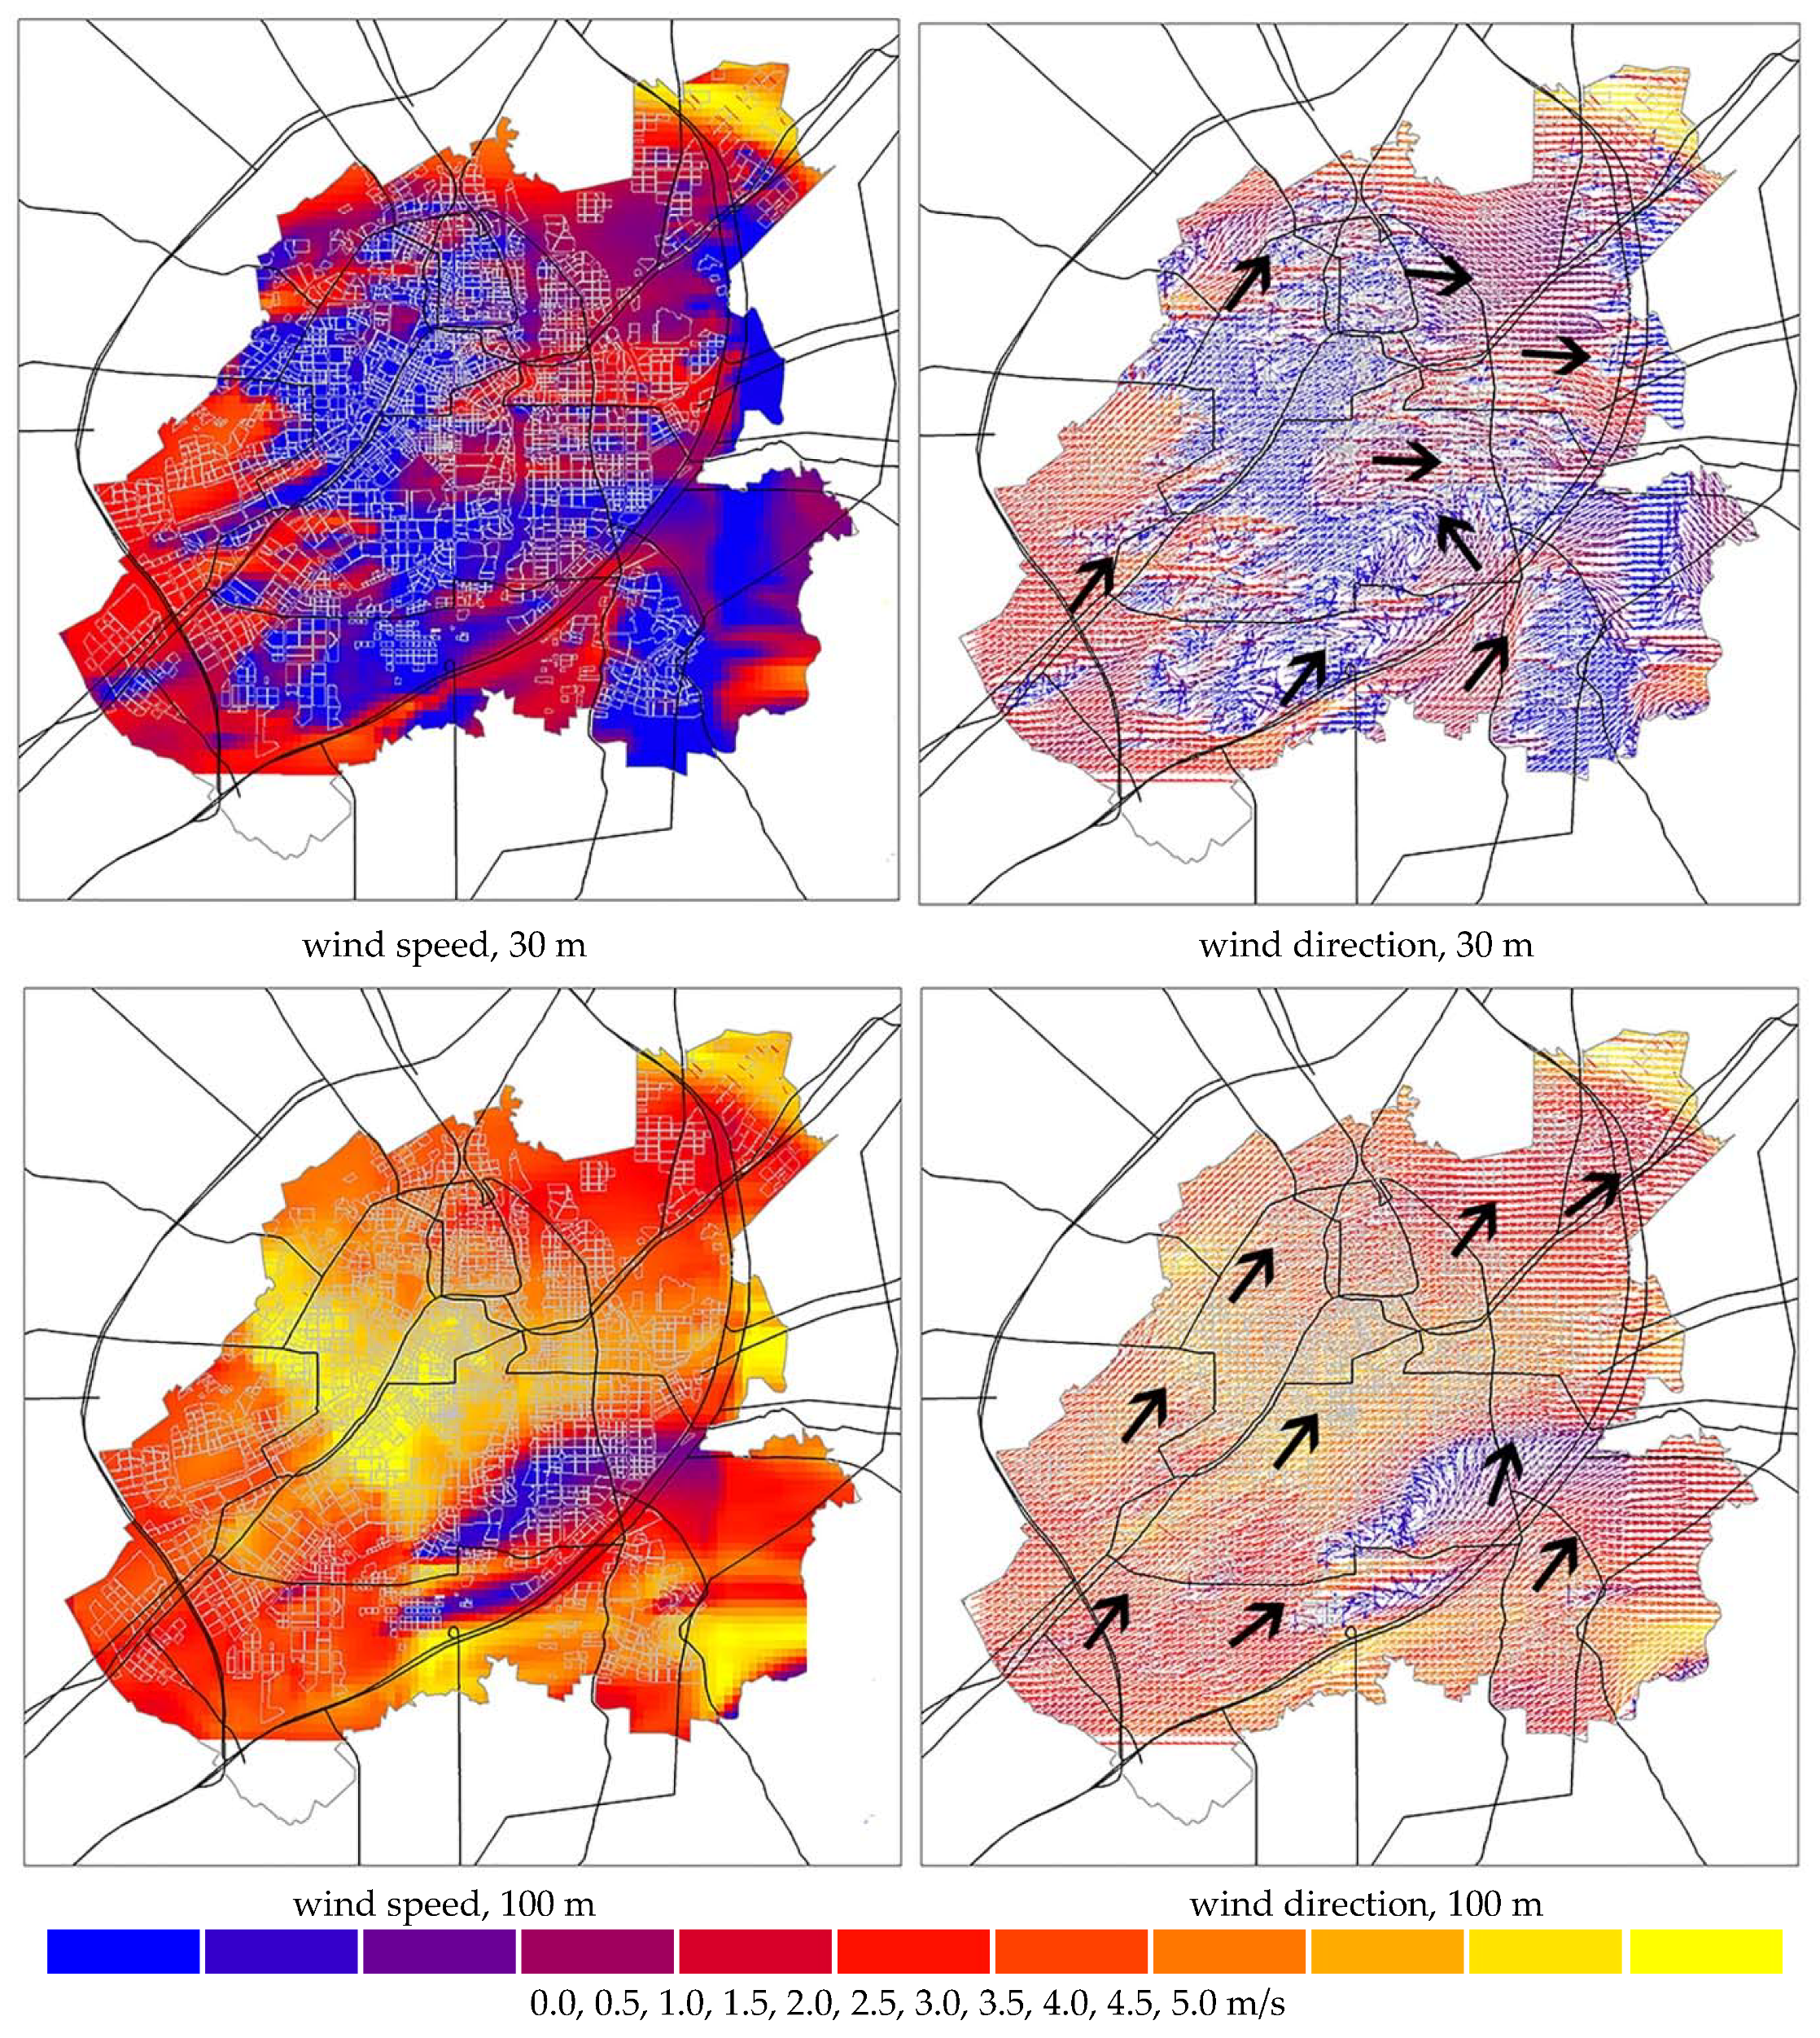
3.2. Characteristics of Summer Wind Field
The wind was toward the south direction, and the city-road direction, thereby increasing the prominence of the potential wind corridor. The wind was slightly blocked at the heights of 1.5 m, 10 m, and 30 m in the center of the city. The wind mobility in the east side of Changchun was better than that in the west side. At the height of 1.5 m, the wind speed in the study area was lower than 1 m/s. At the height of 10 m, a high-wind-speed region was formed in the north and west of the beltway. At the height of 30 m, the wind speed displayed an evident increase, and the wind speed in the entire eastern region was basically above 5 m/s. At the height of 100 m, the wind speed of the entire research area was nearly 10 m/s. However, in a few areas with concentrated high-rise buildings, the wind speed was still low, and the wind corridors were mainly distributed along the northwest direction. Potential paths were noted at the height of 30 m along the Yitong River (Figure 7).
3.3. Spatial Pattern of Areas Requiring Improvement
Land surface temperatures were derived from the RS image of LandSat to identify areas affected by high temperature. The high-temperature areas included the railway station, east of People’s Street, north of Liberation Road, and southeast of the central area. These areas exhibited the following characteristics: low elevation, high population density, high building density, narrow roads, and few green spaces. High temperatures were also observed in the southwestern parts of the research area, which were covered by a vast expanse of cement ground (Figure 8).
On the basis of the AQI from meteorological stations, the inverse-distance-weighted interpolation was used in ArcGIS to describe the spatial distribution of air quality. In general, the southwest regional air pollution was more serious than that in other areas, and the ventilation environment in the region required improvement, with a need for reduction in pollution levels. Air quality was better in Jingyue than in other areas (Figure 8).
3.4. Potential Air Guide Channel
Guide channels lead the air to areas that require improvement. Corridors must be wide and have no tall buildings or trees. Moreover, corridors must be in a straight line or have a small arc. In green spaces, water connected with the road provides an ideal guide channel for the ventilation corridors.
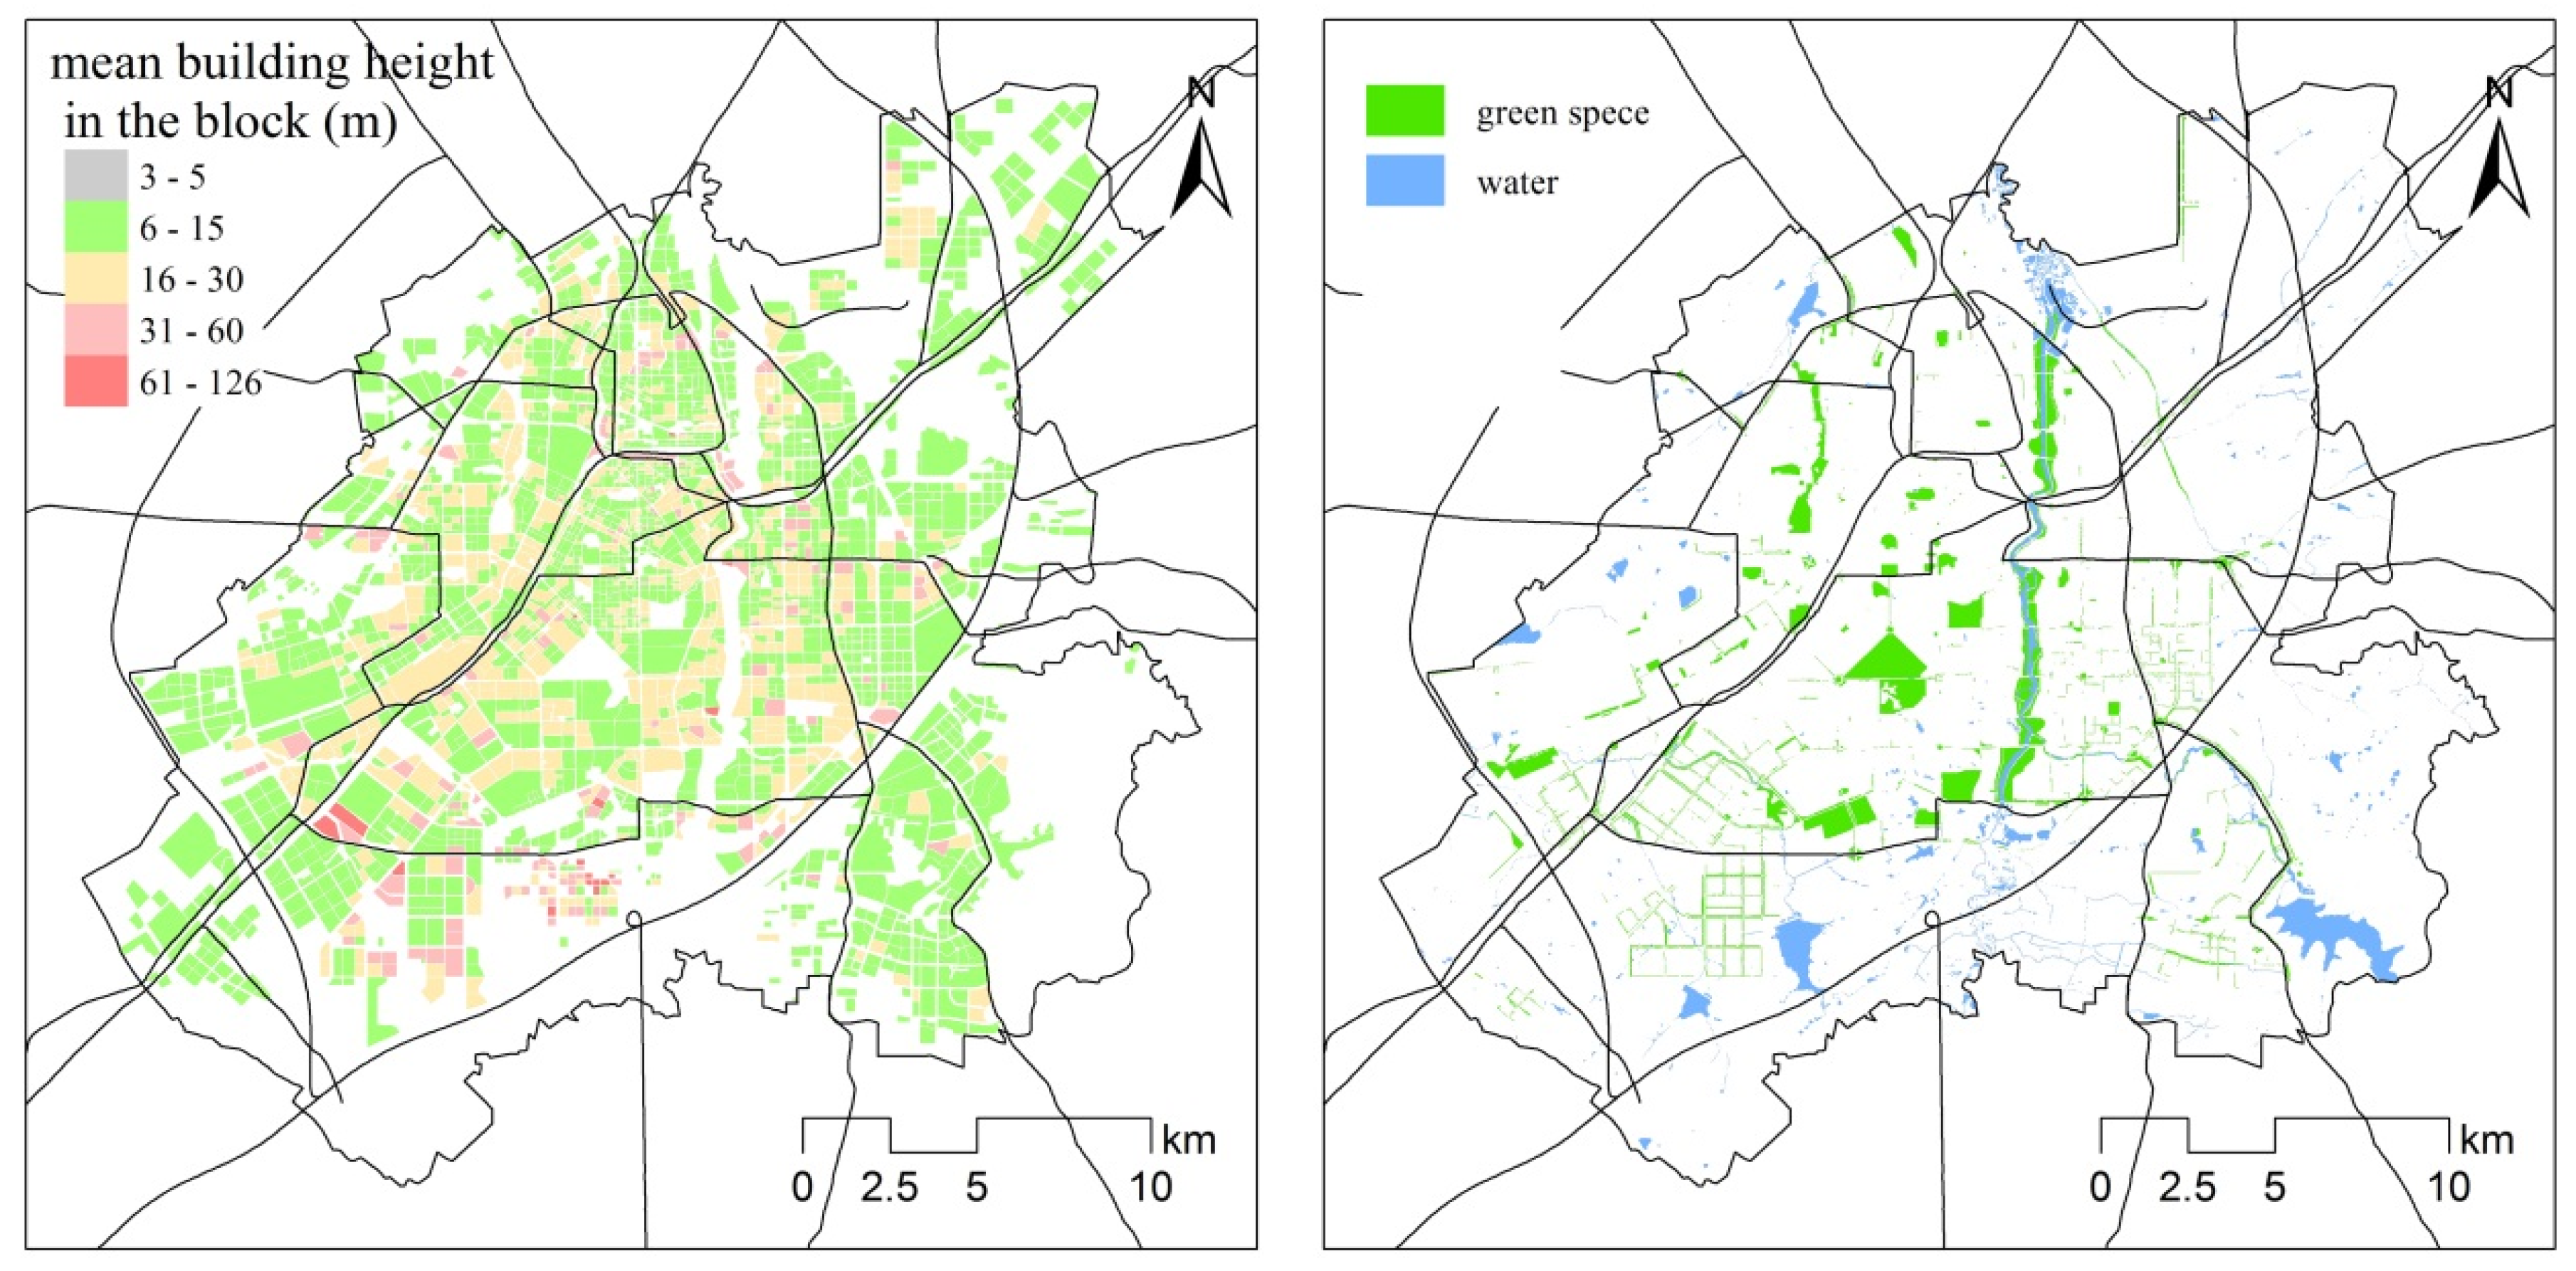
The length of the guide channel in a certain direction must be at least 500 m, and preferably above 1000 m. The width of the channel should be at least 1.5 times that of the edge of the forest or the building. In any case, the width of the channel should not be less than 30 m, and should preferably be 50 m [14]. The main road in Changchun had six or eight lanes which were 60–120 m wide within the red line of the urban road. Buildings below the height of 30 m accounted for 95% of the total buildings (Figure 9). Thus, the road was suitable for the construction of a guide channel.
The green spaces and water bodies of Changchun had good spatial continuity. Many parks in Changchun were larger than 100 hectares; these parks included the South Lake Park, the Sculpture Park, and the Urban Wetland Park. Having many parks is rare for cities on the level of Changchun. While constructing large parks, the government of Changchun built small green spaces that connected the large and medium-sized parks, in an effort to maintain the continuity of urban green space. The terrain of Changchun changes gradually, and is elevated in the west and south, but low-lying in the east and north. The main river moves in a direction of south to north. These characteristics will allow the southwest wind to pass through the city (Figure 9).
3.5. Development of Potential Ventilation Channels
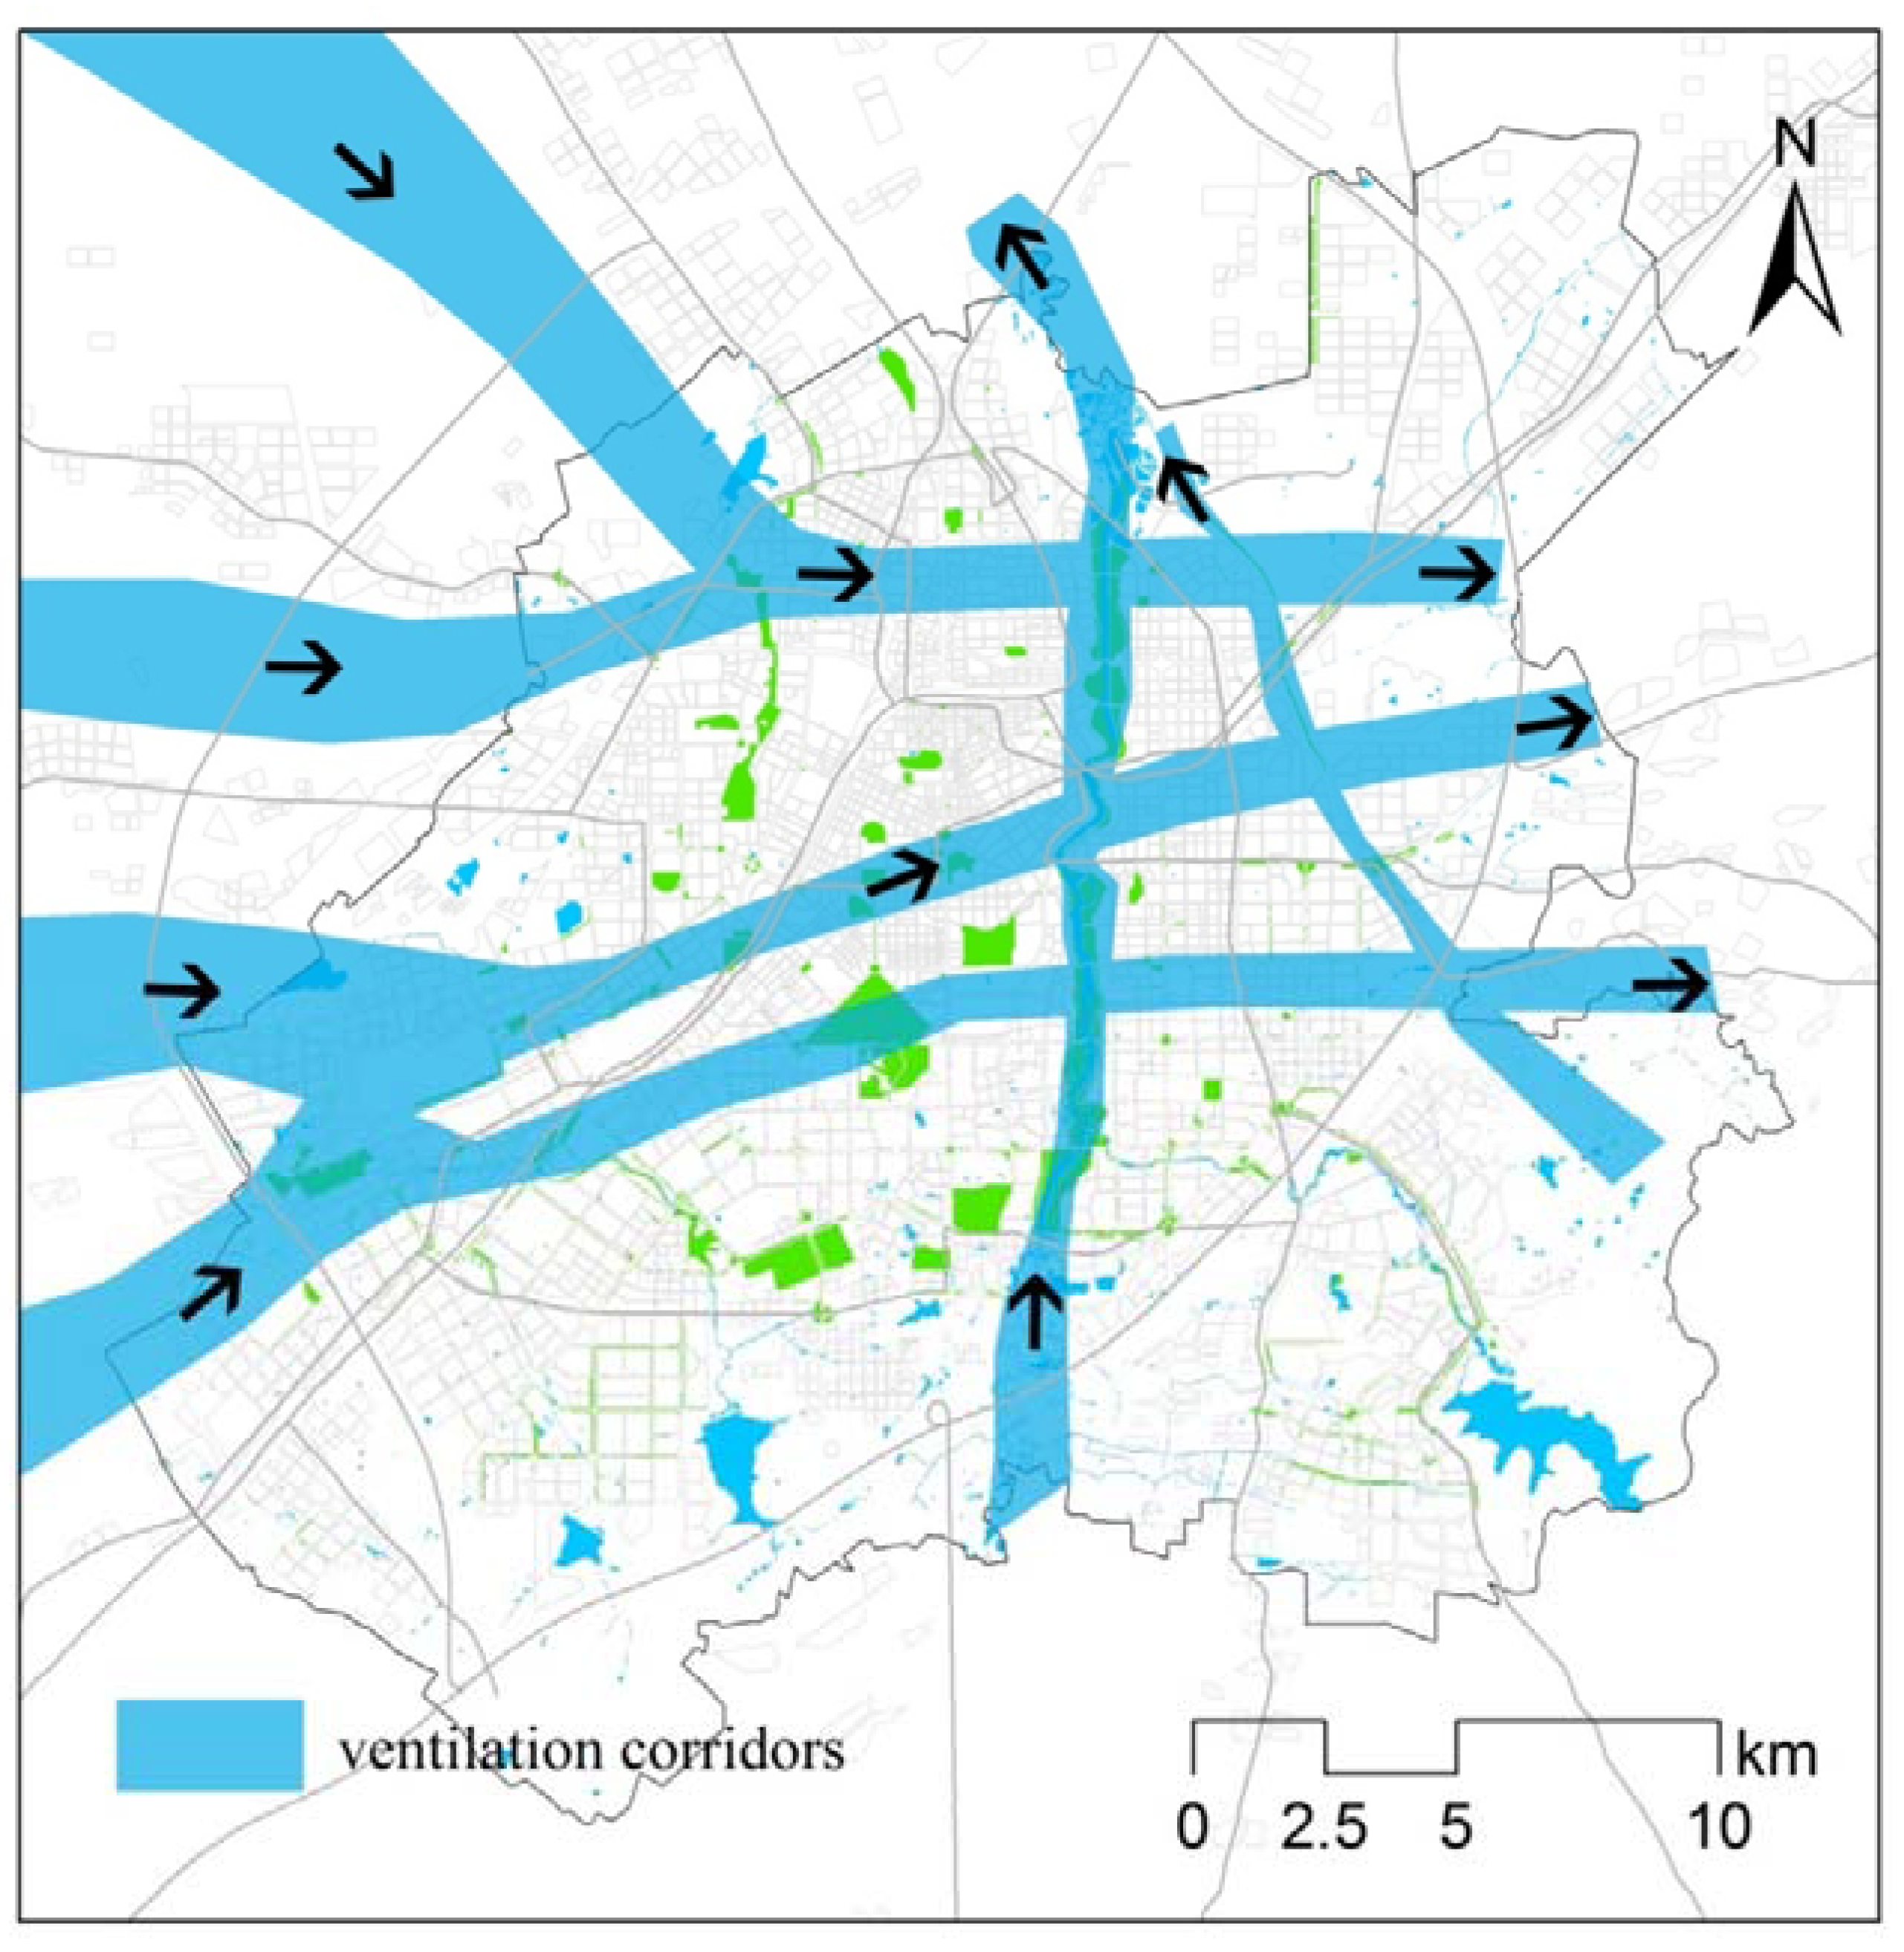
Ventilation corridors mainly rely on existing green spaces, main roads, and water systems. Moreover, efforts are made to ensure that the ventilation corridors have a small radius. The predominant wind direction in Changchun was southwest, and a ventilation corridor in the southwest–northeast direction was considered. Five ventilation corridors were developed. Fresh air can reach the inner city through the ventilation corridors to alleviate the UHI effect, and to accelerate pollution diffusion (Figure 10).
3.6. Implications for Climate-Resilient Urbanization
UHI causes hot days to feel hotter. Extreme heat directly concerns the health and well-being of human beings, and long-term changes in the average temperature also affect the natural environment. Ventilation corridors can directly affect the poor urban thermal environment, and enhance the mobility of air, thereby reducing the intensity of the hot weather, improving the air quality, and enhancing the resilience of the city’s response to climate change [32]. Practical implementation advice, and financial and technical resources should be used to support the implementation of the corridors’ construction. Using land belonging to the country of China, government departments should play a leading role in the construction of urban ventilation corridors. Various strategies for the planning and implementation of ventilation corridors should be adopted according to various circumstances. For built-up areas, potential ventilation corridors should be delineated, and realized gradually upon urban renewal. For new urban areas and new industrial areas, various climatic and environmental factors should be integrated, the location and layout should be carefully selected, the height of the buildings should be controlled, and the directions and development intensity of streets should be determined [14]. A buffer zone should be established to control the height, and land use along the ventilation corridor, and specific plans should be established in land-use planning, and urban design.
4. Conclusions
Providing quantitative data support is highly significant for the construction of urban ventilation corridors in cases of urban expansion, and environmental deterioration. CFD has advantages in the fine assessment of wind environment, and GIS exhibits excellent performance in spatial analysis. With Changchun as an example, this study proposes the establishment of ventilation corridors on an urban scale to mitigate the UHI effect, and to accelerate the diffusion of air pollution.
CFD simulations provided detailed spatiotemporal characteristics of wind speed and wind direction at various heights; such information is useful when identifying potential ventilation corridors. In general, the wind-speed and wind-direction characteristics at a height of 30 m indicated potential ventilation corridors. Potential paths were found in the leading wind and south–north directions. The areas that required improvement were favorably situated in the path of potential ventilation corridors. The main roads, green spaces, and water had good connectivity. A total of five ventilation corridors were constructed, and these corridors will directly affect the poor urban thermal environment, and enhance the mobility of air.
This study developed ventilation corridors on an urban scale. Further studies must be conducted on block and building scales, and on the relationship between wind environment and land use or building layouts, so as to develop a ventilation-corridor system as a unit, and as an organic whole.
Author Contributions
S.C. and Q.J. designed the paper. S.C. and Y.Z. collected the data, and wrote the paper. All authors have read and approved the final manuscript.
Acknowledgments
This study is supported by Chinese National Science Foundation (No. 41371332), and the project is funded by the China Geological Survey (DD20160077). The authors would like to thank the anonymous reviewers and handling editors for their constructive comments.
Conflicts of Interest
The authors declare no conflict of interest.
References
- Gu, C.; Hu, L.; Ian, G. China’s Urbanization in 1949–2015: Processes and Driving Forces. Chin. Geogr. Sci. 2017, 27, 847–859. [Google Scholar] [CrossRef]
- Tian, L.; Li, Y.; Shao, L.; Zhang, Y. Measuring Spatio-temporal Characteristics of City Expansion and Its Driving Forces in Shanghai from 1990 to 2015. Chin. Geogr. Sci. 2017, 27, 875–890. [Google Scholar] [CrossRef]
- Gao, B.; Huang, Q.; He, C.; Sun, Z.; Zhang, D. How does sprawl differ across cities in China? A multi-scale investigation using nighttime light and census data. Landsc. Urban Plan. 2016, 148, 89–98. [Google Scholar] [CrossRef]
- Lin, S.; Sun, J.; Marinova, D.; Zhao, D. Effects of Population and Land Urbanization on China’s Environmental Impact: Empirical Analysis Based on the Extended STIRPAT Model. Sustainability 2017, 9, 825. [Google Scholar] [CrossRef]
- Alberti, M. Maintaining ecological integrity and sustaining ecosystem function in urban areas. Curr. Opin. Environ. Sustain. 2010, 2, 178–184. [Google Scholar] [CrossRef]
- Chang, C.; Lee, X.; Liu, S.; Schultz, N.; Xiao, W.; Zhang, M.; Zhao, L. Urban heat island in China enhanced by haze pollution. Nat. Commun. 2016, 7, 12509. [Google Scholar]
- Peng, J.; Shen, H.; Wu, W.; Liu, L.; Wang, Y. Net primary productivity (NPP) dynamics and associated urbanization driving forces in metropolitan areas: A case study in Beijing City, China. Landsc. Ecol. 2016, 31, 1077–1092. [Google Scholar] [CrossRef]
- Qin, J.; Fang, C.; Wang, Y.; Li, G.; Wang, S. Evaluation of Three-dimensional Urban Expansion: A Case Study of Yangzhou City, Jiangsu Province, China. Chin. Geogr. Sci. 2016, 25, 224–236. [Google Scholar] [CrossRef]
- China’s Focus: The “Wind Corridor” in the Capital of China Is Expected to Reduce Haze. Available online: http://www.xinhuanet.com/2016-02/23/c_1118135383.htm (accessed on 23 February 2016).
- Gal, T.; Linderg, F.; Unger, J. Comparing continuous sky view factor using 3D urban raster and vector databases: Comparison and application to urban climate. Theor. Appl. Climatol. 2009, 95, 111–123. [Google Scholar] [CrossRef]
- Wang, H.; Zhang, Y.; Tsou, J.Y.; Li, Y. Surface Urban Heat Island Analysis of Shanghai (China) Based on the Change of Land Use and Land Cover. Sustainability 2017, 9, 1538. [Google Scholar] [CrossRef]
- Weber, S.; Kordowski, K.; Kuttle, W. Variability of particle number concentration and particle size dynamic in an urban street canyon under different meteorological conditions original research. Sci. Total Environ. 2013, 4, 2215–2223. [Google Scholar]
- Tanaka, T.; Moriyama, M. Urban Environmental Climate Maps for supporting Environmental and urban planning works in local government. J. Technol. Des. 2011, 17, 687–692. [Google Scholar] [CrossRef]
- Ren, C. Urban Ventilation Assessment and Wind Corridor Plan: Creating Breathing Cities, 1st ed.; China Architecture & Building Press: Beijing, China, 2016; pp. 3–5. ISBN 978-7-112-20012-2. [Google Scholar]
- Du, W.; Fang, X.; Liu, Y.; He, Y.; He, J. Construction of Ventilation Corridors in the Beijing Central Urban Area Based on Meteorology and GIS Technology. Urban Plan. Forum 2016, 231, 79–85. [Google Scholar]
- Sun, W.; Wang, Y.; Chen, D.; Chen, S. Wind fields and the development of wind corridors in the urban metropolis of the Pearl River Delta. Acta Ecol. Sin. 2012, 32, 5630–5636. [Google Scholar] [CrossRef]
- King, M.F.; Khan, A.; Delbosc, N.; Gough, H.L.; Halios, C.; Barlow, J.F.; Noakes, C.J. Modelling urban airflow and natural ventilation using a GPU-based lattice-Boltzmann method. Build. Envion. 2017, 125, 273–284. [Google Scholar] [CrossRef]
- Heidari, A.; Sahebzadeh, S.; Dalvand, Z. Natural Ventilation in Vernacular Architecture of Sistan, Iran; Classification and CFD Study of Compound Rooms. Sustainability 2017, 9, 1048. [Google Scholar] [CrossRef]
- Li, L.; Wu, D.; Zhang, L.; Yuan, L. Ventilation assessment on urban-block detailed planning based on numerical simulation. Acta Sci. Circumst. 2012, 32, 946–953. [Google Scholar]
- Wang, G.; Wang, X.; Miao, S. Numerical simulation of atmospheric environments for urban sub-domain planning. J. Tsinghua Univ. 2006, 46, 1489–1494. [Google Scholar]
- Eum, J.H.; Scherer, D.; Fehrenbach, U.; Koppel, J.; Woo, J.H. Integrating urban climate into urban master plans using spatially distributed information—The Seoul example. Land Use Policy 2013, 34, 223–232. [Google Scholar] [CrossRef]
- Yuan, C.; Ren, C.; Ng, E. GIS-based Surface Roughness Evaluation in the Urban Planning System to Improve the Wind Environment: A study in Wuhan, China. Urban Clim. 2014, 10, 585–593. [Google Scholar] [CrossRef]
- Liu, Y.; Fang, X.; Cheng, C.; Luan, Q.; Du, W.; Xiao, X.; Wang, H. Research and application of city ventilation assessments based on satellite data and GIS technology: A case study of the Yanqi Lake Eco-city in Huairou District, Beijing. Meterol. Appl. 2016, 23, 320–327. [Google Scholar] [CrossRef]
- Zhang, Y.; Li, X. Study on Urban Ventilation Channels Planning Based on Optimization of the Spatial Layout in Urban Green Space: A Case Study of Jinzhong. Urban Dev. Stud. 2017, 24, 35–41. [Google Scholar]
- Chun, B.; Guldmann, J.M. Spatial statistical analysis and simulation of the urban heat island in high-density central cities. Landsc. Urban Plan. 2014, 125, 76–88. [Google Scholar] [CrossRef]
- Suder, A.; Szymanowski, M. Determination of Ventilation Channels in Urban Area: A Case Study of Wrocław (Poland). Pure Appl. Geophys. 2014, 171, 965–975. [Google Scholar] [CrossRef]
- Ng, E.; Yuan, C.; Chen, L.; Ren, C.; Fung, J. Improving the wind environmen in High-Density cities by understanding urban morphogogy and surface roughness: A study in Hong Kong. Landsc. Urban Plan. 2011, 101, 59–71. [Google Scholar] [CrossRef]
- Ma, S.; Chen, W.; Zhang, S.; Tong, Q.; Bao, Q.; Gao, Z. Characteristics and cause analysis of heavy haze in Changchun City in Northeast China. Chin. Geogr. Sci. 2017, 27, 989–1002. [Google Scholar] [CrossRef]
- Liu, P. Understanding the Individual Air Quality Index (IAQI) calculation and calculating quickly. Heilongjiang Environ. J. 2014, 38, 25–27. [Google Scholar]
- Guo, F. Correlation Research on Urban Micro-Climate and Urban Morphologies-Taking Dalian Lingshui Bay as an Example. Master’s Thesis, Dalian University of Technology, Dalian, China, 2016. [Google Scholar]
- Yang, C.; He, X.; Yan, F.; Yu, L.; Bu, K.; Yang, J.; Chang, L.; Zhang, S. Mapping the Influence of Land Use/Land Cover Changes on the Urban Heat Island Effect—A Case Study of Changchun, China. Sustainability 2017, 9, 312. [Google Scholar] [CrossRef]
- Kiddle, G.L.; McEvoy, D.; Mitchell, D.; Jones, P.; Mecartney, S. Unpacking the Pacific Urban Agenda: Resilience Challenges and Opportunities. Sustainability 2017, 9, 1878. [Google Scholar] [CrossRef]
Figure 1.
Location of the study area.

Figure 2.
Wind rose map of Changchun in spring, summer, autumn, and winter (a–d); yearly average wind speed from 1985–2016 (e); and yearly average temperature from 1985–2016 (f).
Figure 2.
Wind rose map of Changchun in spring, summer, autumn, and winter (a–d); yearly average wind speed from 1985–2016 (e); and yearly average temperature from 1985–2016 (f).

Figure 3.
General process of the study.

Figure 4.
Factors of cluster analysis, and their results.

Figure 5.
Hourly wind speeds and temperatures from July 2016–July 2017.

Figure 6.
Wind speeds and directions at various heights (12:00 p.m., 8 January 2017).


Figure 7.
Wind speeds and directions at various heights (6:00 p.m., 7 July 2017).


Figure 8.
Distribution of areas requiring improvement.

Figure 9.
Mean building height, and distribution of water.

Figure 10.
Proposed ventilation corridors.


Table 1.
Individual air quality indexes (IAQIs) and their corresponding pollutant concentration limits.
Table 1.
Individual air quality indexes (IAQIs) and their corresponding pollutant concentration limits.
| IAQI | SO2 24 h Average (g/m3) | NO2 24 h Average (μg/m3) | PM10 24 h Average (μg/m3) | CO 24 h Average (μg/m3) | O3 8 h Average (μg/m3) | PM2.5 24 h Average (μg/m3) |
|---|---|---|---|---|---|---|
| 0 | 0 | 0 | 0 | 0 | 0 | 0 |
| 50 | 50 | 40 | 50 | 2 | 100 | 35 |
| 100 | 150 | 80 | 150 | 4 | 160 | 75 |
| 150 | 475 | 180 | 250 | 14 | 215 | 115 |
| 200 | 800 | 280 | 350 | 24 | 265 | 150 |
| 300 | 1600 | 565 | 420 | 36 | 800 | 250 |
| 400 | 2100 | 750 | 500 | 48 | 1000 | 350 |
| 500 | 2620 | 940 | 600 | 60 | 1200 | 500 |
Table 2.
Meteorological data for the simulation times.
| Time | Wind Direction | Wind Speed | Temperature | Relative Humidity |
|---|---|---|---|---|
| 7 January, 12:00 p.m. | 251° SW | 1.7 m/s | −6.7 °C | 61% |
| 7 July, 6:00 p.m. | 146° SSE | 3.0 m/s | 27.1 °C | 73% |
© 2018 by the authors. Licensee MDPI, Basel, Switzerland. This article is an open access article distributed under the terms and conditions of the Creative Commons Attribution (CC BY) license (http://creativecommons.org/licenses/by/4.0/).
Share and Cite
MDPI and ACS Style
Chang, S.; Jiang, Q.; Zhao, Y. Integrating CFD and GIS into the Development of Urban Ventilation Corridors: A Case Study in Changchun City, China. Sustainability 2018, 10, 1814. https://doi.org/10.3390/su10061814
AMA Style
Chang S, Jiang Q, Zhao Y. Integrating CFD and GIS into the Development of Urban Ventilation Corridors: A Case Study in Changchun City, China. Sustainability. 2018; 10(6):1814. https://doi.org/10.3390/su10061814
Chicago/Turabian StyleChang, Shouzhi, Qigang Jiang, and Ying Zhao. 2018. "Integrating CFD and GIS into the Development of Urban Ventilation Corridors: A Case Study in Changchun City, China" Sustainability 10, no. 6: 1814. https://doi.org/10.3390/su10061814
Note that from the first issue of 2016, this journal uses article numbers instead of page numbers. See further details here.