The Impact of the Allocation of Facilities on Reducing Carbon Emissions from a Green Container Terminal Perspective


State Key Laboratory of Coastal and Offshore Engineering, Dalian University of Technology, Dalian 116024, China
*
Author to whom correspondence should be addressed.
Sustainability 2018, 10(6), 1813; https://doi.org/10.3390/su10061813
Submission received: 2 May 2018
/
Revised: 26 May 2018
/
Accepted: 30 May 2018
/
Published: 31 May 2018
(This article belongs to the Section Sustainable Transportation)
Abstract
:The main contribution of this paper is to quantify the impact of the allocation of facilities, including the number of facilities and the fuels adopted by facilities, on carbon emissions. In order to deal with the complex queuing network of container terminals, a simulation model is established with the changing of the number of and the fuel adopted by facilities as inputs. Firstly, the operation process and complex queuing network of container terminals are described to explain why simulation technology needs to be used. Then, various simulation experiments based on a container terminal in Algeria are designed and carried out. Finally, the carbon emissions from facilities and ships at berth and inside container terminals, and the total carbon emissions inside container terminals, are obtained and analyzed. Results show that the emissions from facilities are only a small fraction of the total emissions of container terminals. Improving the number of trucks and yard cranes can help reduce carbon emissions, but when the number continues to rise, the emissions are decreased very slightly. The results obtained and proposed method can be applied to build a green container terminal, which can also be used for similar problems.
1. Introduction
As major hubs in global supply chains, container terminals play a significant role in energy consumption, and even climate change due to carbon emissions. Port facilities, referring to handling equipment and trucks, are major energy consumers, and have been becoming the main sources of carbon emissions. For example, according to the data from the Inventory of Air Emissions, the emissions from port facilities in 2016, which accounted for about 18% of total emissions, had increased by 18.6% compared to the data in 2005 [1]. Reducing carbon emissions and the efficient use of port equipment in container terminals are vital to achieving the climate and environmental goal of green port construction [2]. Reasonable allocation of facilities, including the number of facilities and the fuels adopted by facilities, can help reduce carbon emissions. However, how to quantify the impact of the allocation of facilities on carbon emissions is still a problem that needs to be solved.
Efforts to reduce carbon emissions from ports mainly focus on visiting ships inside the ports, since almost half of emissions were attributed to ship movement [3]. Most of the previous works related to the mitigation strategies of ships mainly focus on on-shore power supply [4], alternative fuels [5], and reduced speed in the waterway [6]. The emissions from port facilities (e.g., quay cranes, yard cranes and trucks) in container terminals have recently been regarded as a problem and corresponding research has been conducted. For example, He et al. [7] allocated quay cranes for berths by developing a dynamic-allocation objective programming model to minimize the total energy consumption of quay cranes. Yu et al. [8] solved the quay crane scheduling problem by building a mixed-integer nonlinear programming model to minimize the total fuel emissions of all ships during the voyages. Wang et al. [9] established an allocation optimization model of quay cranes with a limit of carbon emissions. In order to reduce emissions from idling trucks, Chen et al. [10] built a bi-objective model by optimizing the arrival patterns and waiting time of trucks. Sha et al. [11] scheduled yard cranes with a consideration of moving and turning distance and practical operation rules by developing a novel integer-programming model to minimize the total energy consumption of yard cranes from a low carbon perspective. Besides, for the energy replacement problem of yard cranes with energy consumption changing from diesel to electricity, Peng et al. [2] combined an allocation resource mathematical model and a simulation model of the whole port operation network to schedule the time of energy replacement for each yard crane, where the objective function was minimizing carbon emissions. Yang et al. [12] analyzed the sources of carbon emissions, measured the carbon emissions in the port system, and suggested two approaches to reduce carbon emissions.
The literature mentioned above only focused on a component or a part of the container terminal operation system by proposing a mathematic model to solve the problems of deciding arrival patterns, travelling rules, or energy replacement time etc. of facilities, but little attention is paid to the coordinated operations of facilities. For the coordinated scheduling of quay cranes, internal trucks, and yard cranes, He et al. [13] formulated a mixed integer-programming model, where one of two objectives was minimizing the total transportation energy consumption of all tasks. Results show that the “Energy-saving strategy” can evidently save more energy cost than the “Time-saving strategy”. Graf von Westar and Schinas [14] combined fuzzy optimization and mixed flows of full and empties, and suggested holistic reconsideration of the operational plan that leads to cost and emissions reductions.
The existing literature shows that the carbon emissions always work as one objective function or constraint condition in a mathematic model, when a green, low-carbon, or environmental friendly port is introduced, developed, and studied. However, it is still a challenge to estimate how much the carbon emissions can be affected by the allocation of facilities. Most of the works related to the allocation of facilities in container terminals focus on the allocation, assignment, and scheduling of quay cranes, yard cranes, and trucks.
For the allocation of quay cranes, studies mainly concentrate on minimizing the total cost and handling makespan. For example, Tavakkoli-Moghaddam et al. [15] solved the quay crane scheduling and assignment problem to minimize the total cost by presenting a novel MIP model with the method of the Genetic Algorithm. A model is developed for the quay crane assignment and scheduling problem with the aim of minimizing the handling makespan of ships [16]. Aiming to minimize the makespan of container terminals, Fu et al. [17] analyzed the integrated quay crane assignment and scheduling problem with respect to the travels of cranes from one ship to another ship.
Fewer studies have been done on yard cranes allocation, and most literature has focused on minimizing the number, workload, and handling cost of yard cranes. For instance, Kaysi et al. [18] developed a linear integer program to solve the problem of allocating a minimum number of cranes used in both quay and yard sides. In order to distribute the workload equally among yard cranes, an exact polynomial-time solution procedure is proposed to allocate yard cranes [19]. Jiang and Jin [20] formulated an MIP model with the purpose of minimizing the yard crane cost and guaranteeing the requirements of container allocation by the method of novel branch-and-price.
For the allocation problems of internal trucks, He et al. [21] allocated internal trucks which share the assignment among multiple container terminals to minimize the total overflowed workloads and transferring costs by developing an integer-programming model. Most of the literature about internal trucks has mainly focused on the scheduling of trucks. For example, Chen et al. [22] scheduled crane handling and truck transportation integrally to minimize the makespan of ships by developing a constraint-programming model; Tang et al. [23] scheduled quay cranes and trucks jointly considering the coordination work between them to minimize the total idle time.
The existing literature shows that a mathematic model is always proposed to solve the allocation problem of facilities in container terminals with the purpose of minimizing the total cost, makespan, and carbon emissions etc. However, a container terminal operation system is very complicated and stochastic, including many sub-systems, such as ships berthing and being handled by the quay cranes subsystem, containers assignment and being transported to the yard/berth/gate subsystem, and containers being handled by facilities etc. It is very hard to describe the proposed problem using a stochastic mathematical model [2]. The components of the complicated operation system are interconnected queuing systems that interact with and influence one another, which results in difficulty in formulating how the allocation of facilities influences the emissions from a container terminal operation system considering the uncertainty inherent to the container terminal operation system.
In order to cope with the high uncertainties involved in a complex operation system, a simulation model is always used. For example, Legato et al. [24] combined a discrete event simulator and an integer-programming model to determine the number of cranes for each ship. A simulation model was used to determine how many handling facilities should be allocated to increase the capabilities of a Turkish port [25]. Considering the integrated assignment of berths, tugboats, and quay cranes, an integrated simulation model of port resource allocation was developed by [26]. He et al. [27] proposed an integrated simulation-optimization model for the yard crane scheduling problem to obtain the trade-off between energy consumption and efficiency. A container terminal operation simulation model was established to realize the scheduling of quay cranes and trucks, and the allocation of trucks is suggested [28]. Considering the uncertainty and dynamics in the process of container handling, AI-Dhaheri et al. [29] applied a simulation-based Genetic Algorithm for the stochastic mixed integer programming model to solve the problem of quay crane scheduling. Simulation technology works well in dealing with problems in a complex, stochastic, and comprehensive system. Therefore, a simulation model will be established in this paper to discuss how to quantify the impact of the allocation of facilities on carbon emissions in container terminals.
The contribution of this paper is to provide a method for quantifying how the allocation of facilities affects carbon emissions. Numerical simulation models are formulated in consideration of three kinds of facilities, including quay cranes, yard cranes, and trucks to analyze the impact of the number of facilities and the fuels adopted on carbon emissions. The remainder of this paper is organized as follows. Section 2 focuses on materials and methods, including queuing network models in container terminals, carbon emission formulation, and simulation of carbon emissions in container terminals. Then, the results employed to analyze the impact of the allocation of facilities on carbon emissions are presented in Section 3, followed by conclusions and discussions in Section 4.
2. Materials and Methods
According to the Design Code of Container Terminal for Sea Port [30], the number of yard cranes and trucks depends on the number of quay cranes, and generally, the ratio of the number of yard cranes and trucks to that of quay cranes is (2~4):(3~7):1. The ratio is obtained based on the investigation of major container terminals in China, whose throughput capacity is fully developed with the balance of each sub-system of terminals. However, the ratio is provided without considering the impact on carbon emissions and the environment. Therefore, how to quantify the impact of the ratio on carbon emissions is one of the issues we will discuss in the paper.
Another challenge that needs to be solved in the paper is how to estimate the impact of energy replacement on carbon emissions. The reason why we define the energy replacement as one of the allocation problems is that the fuel adopted is replaced, which means the type of facilities is changed. This paper focuses on the energy replacement of yard cranes and trucks. Rubber tire container gantry cranes (RTGs) and traditional trucks, which are driven by diesel, are replaced by electric RTGs and Automatic Guided Vehicles (AGVs) to reduce carbon emissions and noise in port areas. However, from the perspective of a life cycle, it is hard to say which one is more environment-friendly.
Over the last few years, regarding uncertainties in real conditions, stochastic and fuzzy methods are two effective strategies to resolve uncertain situations, while robust optimization has recently been applied to overcome problems under uncertainties, like the layout problem [31] and hub location problems [32]. For example, Karamyar et al. [33] developed a bi-objective integrated optimization model to formulate location-allocation and scheduling problems with uncertain budgets, and applied a robust optimization and Benders decomposition algorithm to solve the problems with only one uncertain situation. However, a container terminal operation system includes many complicated and stochastic queuing networks such as a ships entering and leaving ports sub-system, ships berthing and being handled sub-system, containers assignment, and being transported by trucks sub-system, which places the system in a place which means that the problem proposed is very difficult to describe using an optimization model. Even if the optimization model could be developed, it is still very hard to solve using an optimization algorithm. Nevertheless, a simulation strategy is always used to cope with these kinds of problems under uncertainties in the operation system. Thus, this paper will show how the above two issues are solved. The operation process and complex queuing networks of container terminals are described below to explain why simulation technology needs to be used instead of an optimization model.
2.1. Queuing Network Models in Container Terminals
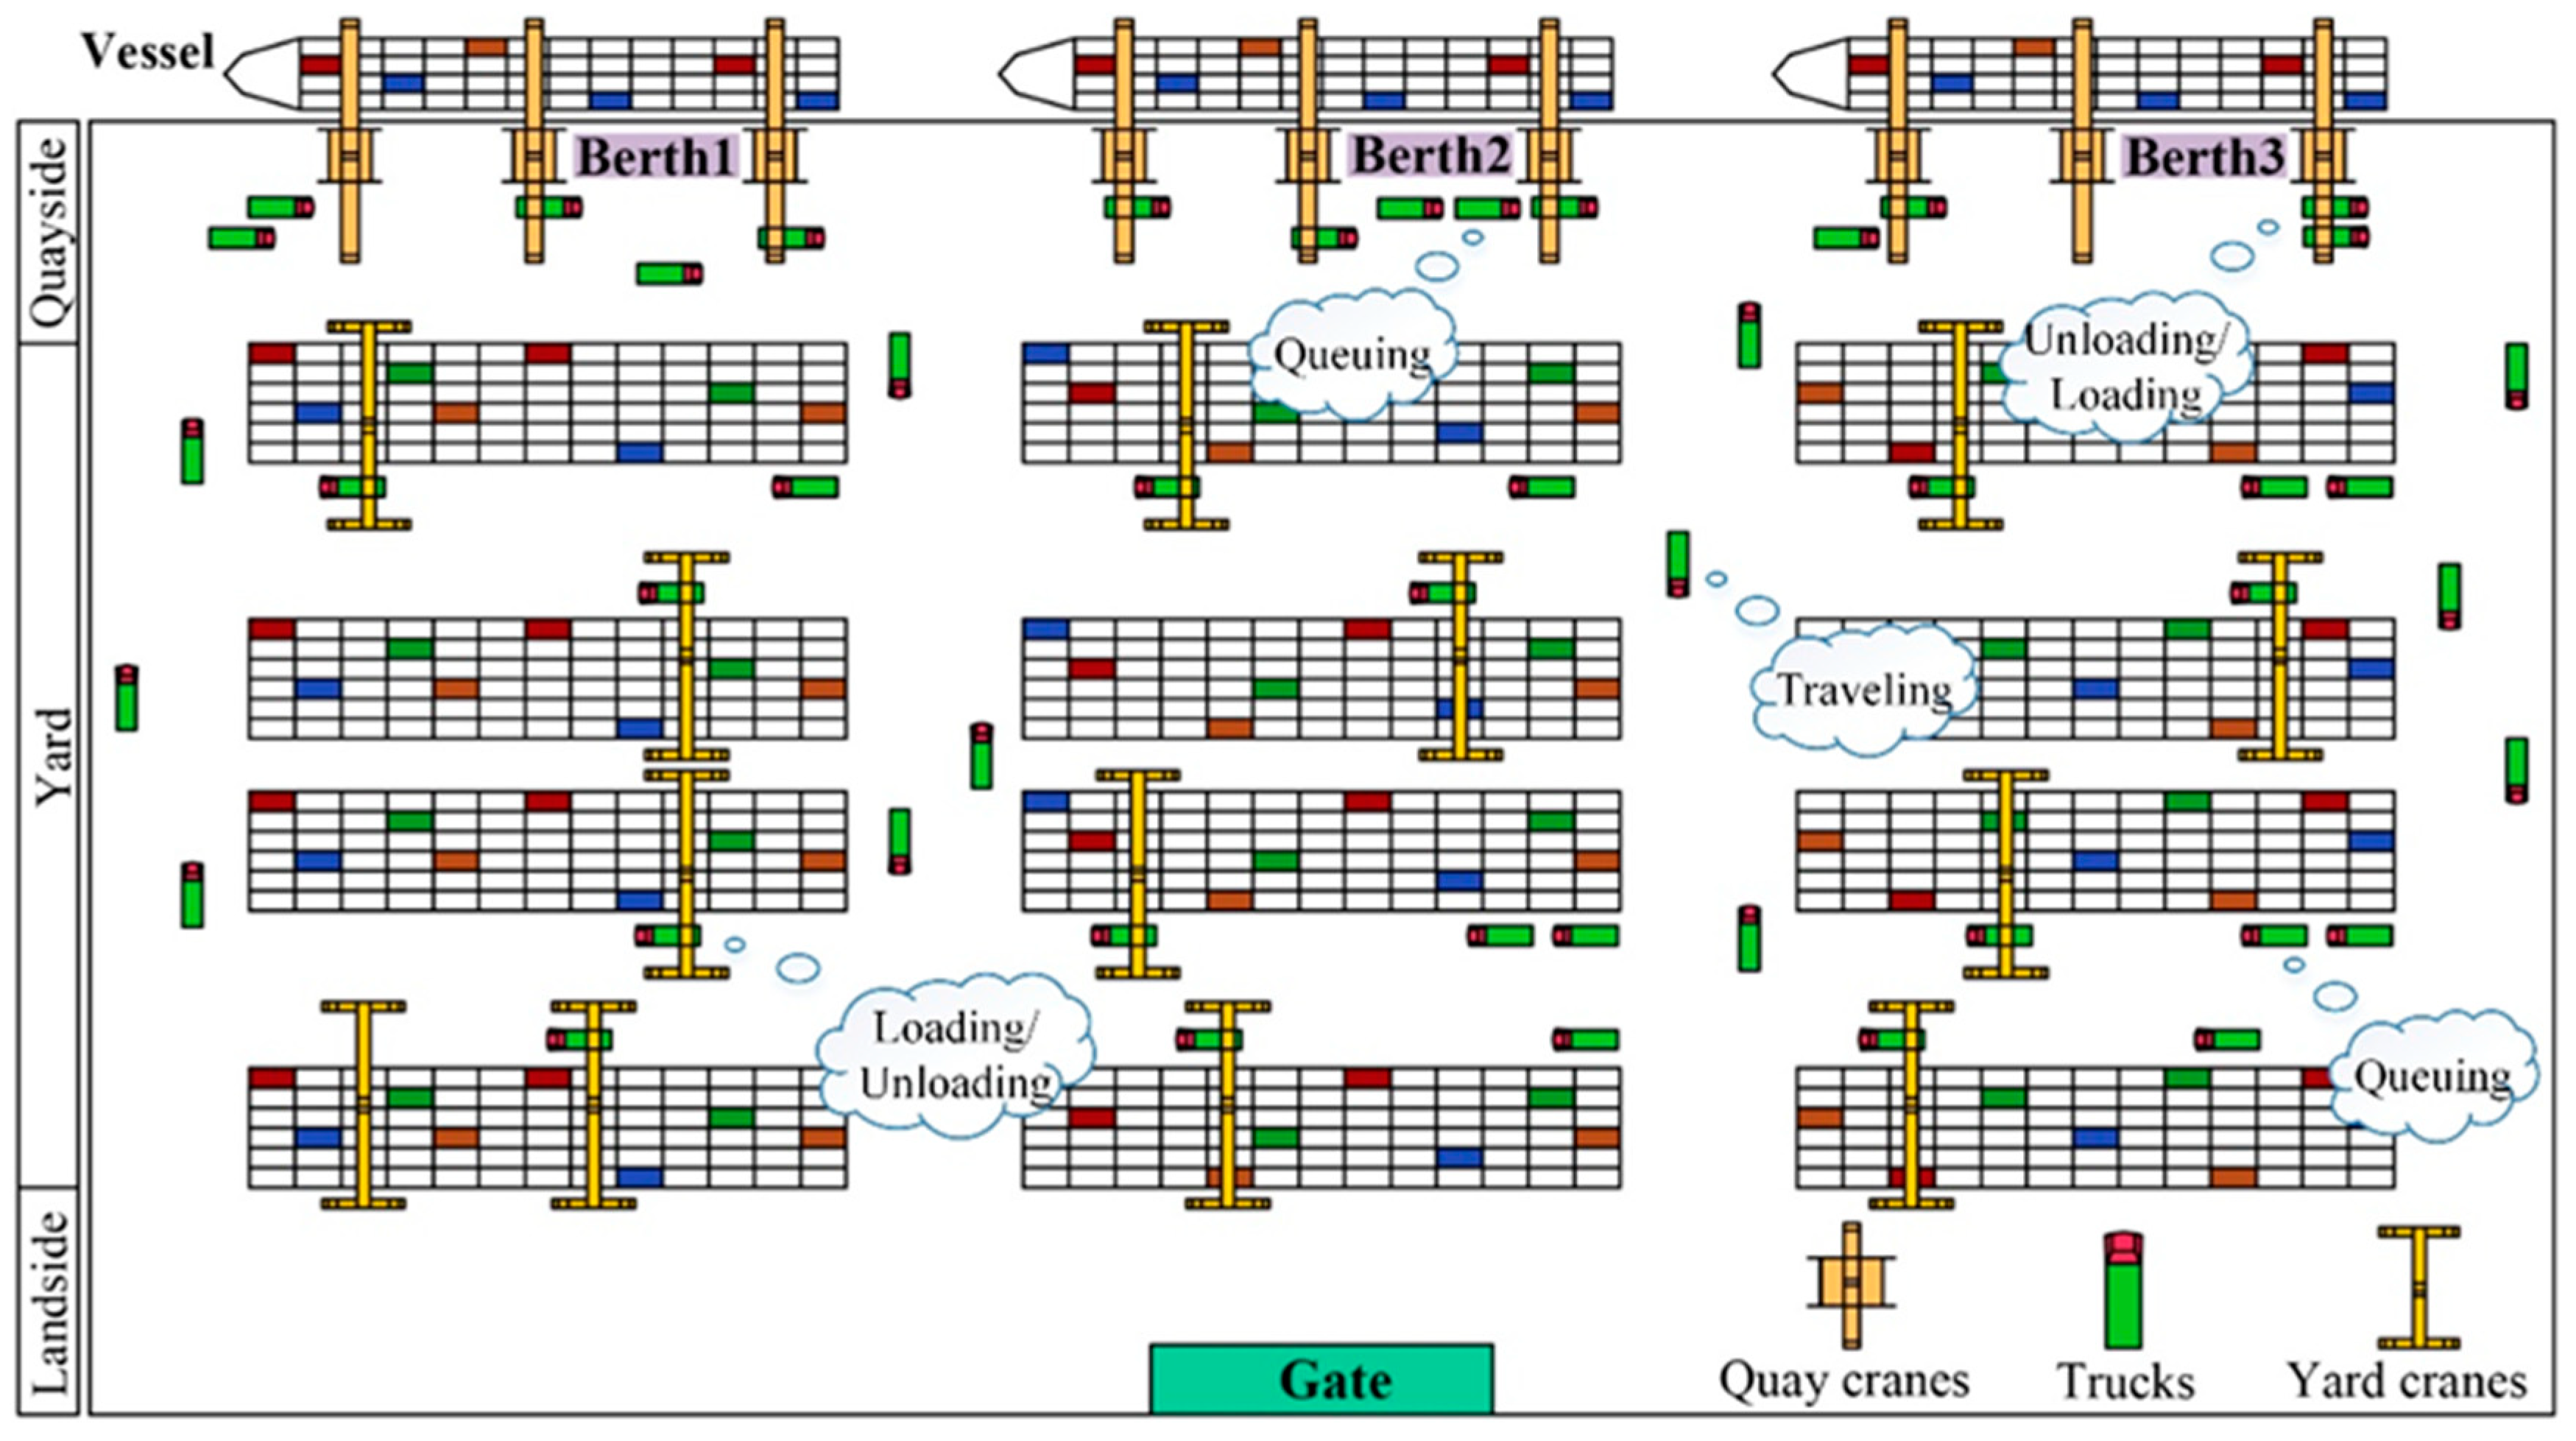
A container terminal generally consists of three components: Quayside, Yard, and Landside (Figure 1). As the main sources of carbon emissions in container terminals, facilities including quay cranes, trucks, and yard cranes are applied to transport and handle containers during the operation process.
A container terminal operation process consists of at least four sub-processes: the ships entering and leaving ports sub-process, ships berthing and being handled sub-process, containers being transported by trucks sub-process, and containers being handled by yard cranes sub-process. The operation process includes two dynamic processes, which are opposed to each other: loading and unloading. The following is introduced by only focusing on the unloading process.
2.1.1. Ships Entering and Leaving Ports Sub-Process
The operation process begins with ships’ arrival, and ships have to wait at anchorage in a queue if the berth or waterway is occupied. Natural conditions (winds, waves, and water levels) and traffic situations are other judgment states affecting ships going through the waterway. Until all these conditions are satisfied, ships can leave anchorage, go through the waterway, arrive at the allocated berth, and wait for quay cranes. After finishing the handling operation, ships will leave the berth and enter through the waterway to depart.
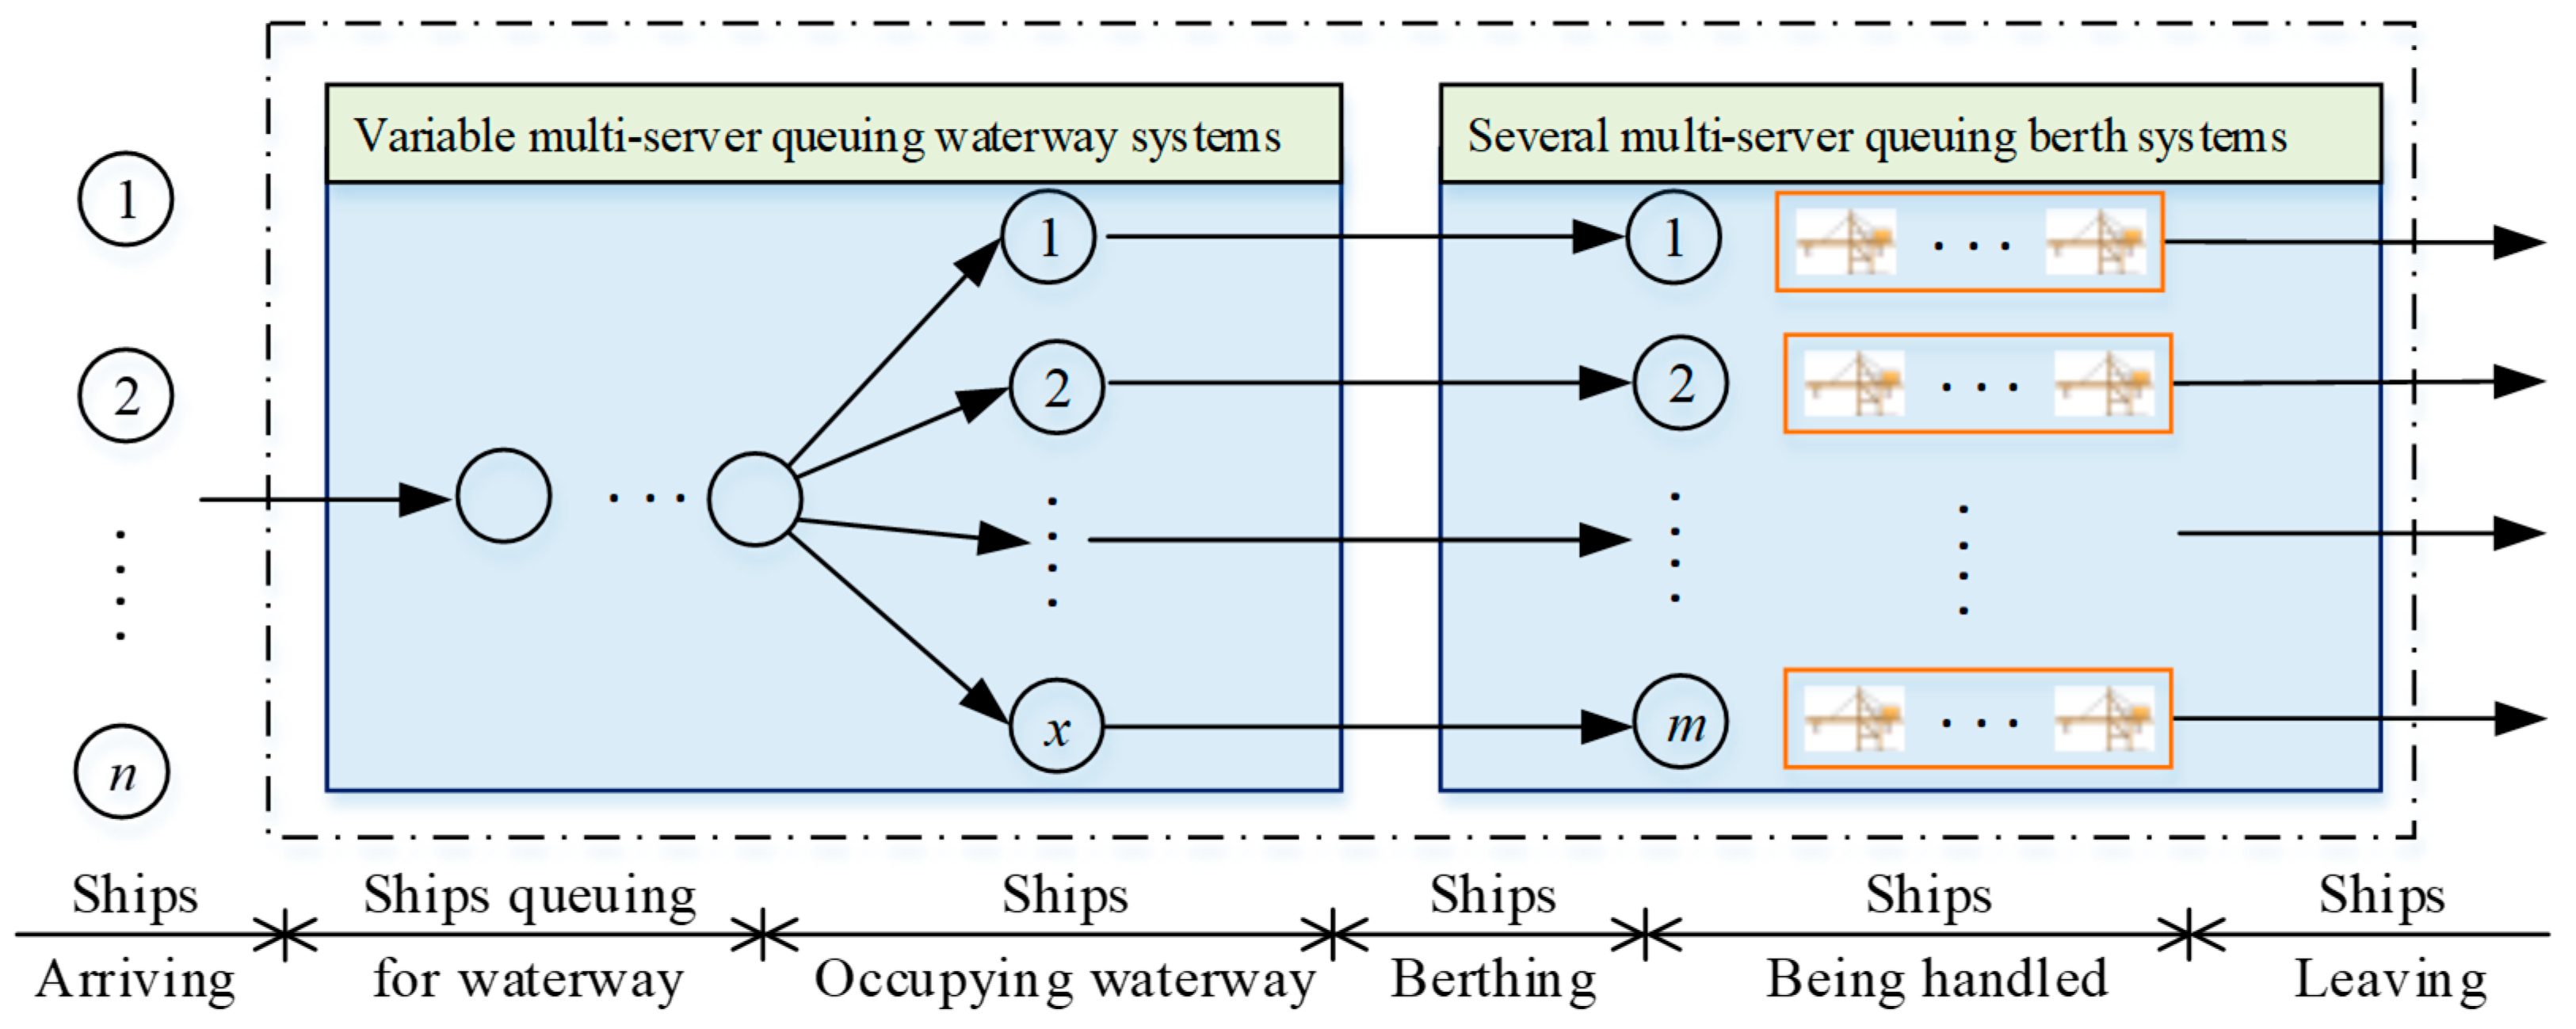
The queuing process of ships at anchorage and berth can be modeled as a queuing network in Figure 2. There are m berths in the berth system, which can be modeled as several multi-server queuing systems. The ship can only berth at the berth whose tonnage is equal to or larger than the ship’s tonnage. For actual container terminals, the assignment rule of ships and berths can be determined by operators. For the waterway system, it can be modeled as variable multi-server queuing systems. The number of servers is dynamically changed due to the different length, safety distance, and priority of each ship. It is very hard to describe the complex queuing network using a mathematical model because of the random arrival of ships, uncertain natural conditions, variable servers of the waterway, and user-defined assignment rules of ships and berths.
2.1.2. Ships Berthing and Being Handled Sub-Process
The ships berthing and being handled sub-process begins with ships berthing and ends with handling work finished by quay cranes. From the perspective of ships, the handling time of ships at the berth, which determines carbon emissions from ships at the berth, is influenced by the number and operation efficiency of assigned quay cranes. At the quayside, the trucks, quay cranes, and handling containers’ work are taken as customers, servers, and service, respectively. This sub-process can be modeled as a multi-server queuing system with ships deployed at the allocated berth. It is different to modelling the sub-process by a queuing network model due to the dense connection to other sub-processes. The quantity of allocated quay cranes and trucks, and the truck arrival pattern at the berth, which is even influenced by yard cranes, affect the queuing time of trucks and operation time of quay cranes, and will further influence carbon emissions. Therefore, it is necessary to study the impact of the number of facilities on carbon emissions.
2.1.3. Containers Being Transported by Trucks Sub-Process
An empty truck will go to the assigned quay crane to pick up containers discharged from a ship, and then transport the containers to the assigned yard block to wait for dispatched yard cranes to unload the containers. After the storage period, external trucks will transfer containers to gates. This paper only focuses on the allocation of internal trucks (traditional trucks and AGVs) due to the different quantities and arrival patterns of different external truck companies.
The internal truck works as a tie linking the yard and quayside. When the number of internal trucks is too small, the quay crane and yard crane will have to wait for empty trucks to pick up containers. At this time, it takes longer to service a ship, and the carbon emissions from ships at the berth will be larger. However, if the number is too large, trucks will wait in a queue at the yard or quayside for cranes, which can lead to congestion and lead to the release of additional carbon emissions from trucks. Therefore, there is a trade-off between the number of internal trucks and carbon emissions. Due to the high connection with other facilities in the container transportation network, it is almost impossible to consider the truck as an independent unit. The links between trucks and other facilities are very difficult to describe using a mathematical model.
2.1.4. Containers Being Handled by Yard Cranes Sub-Process
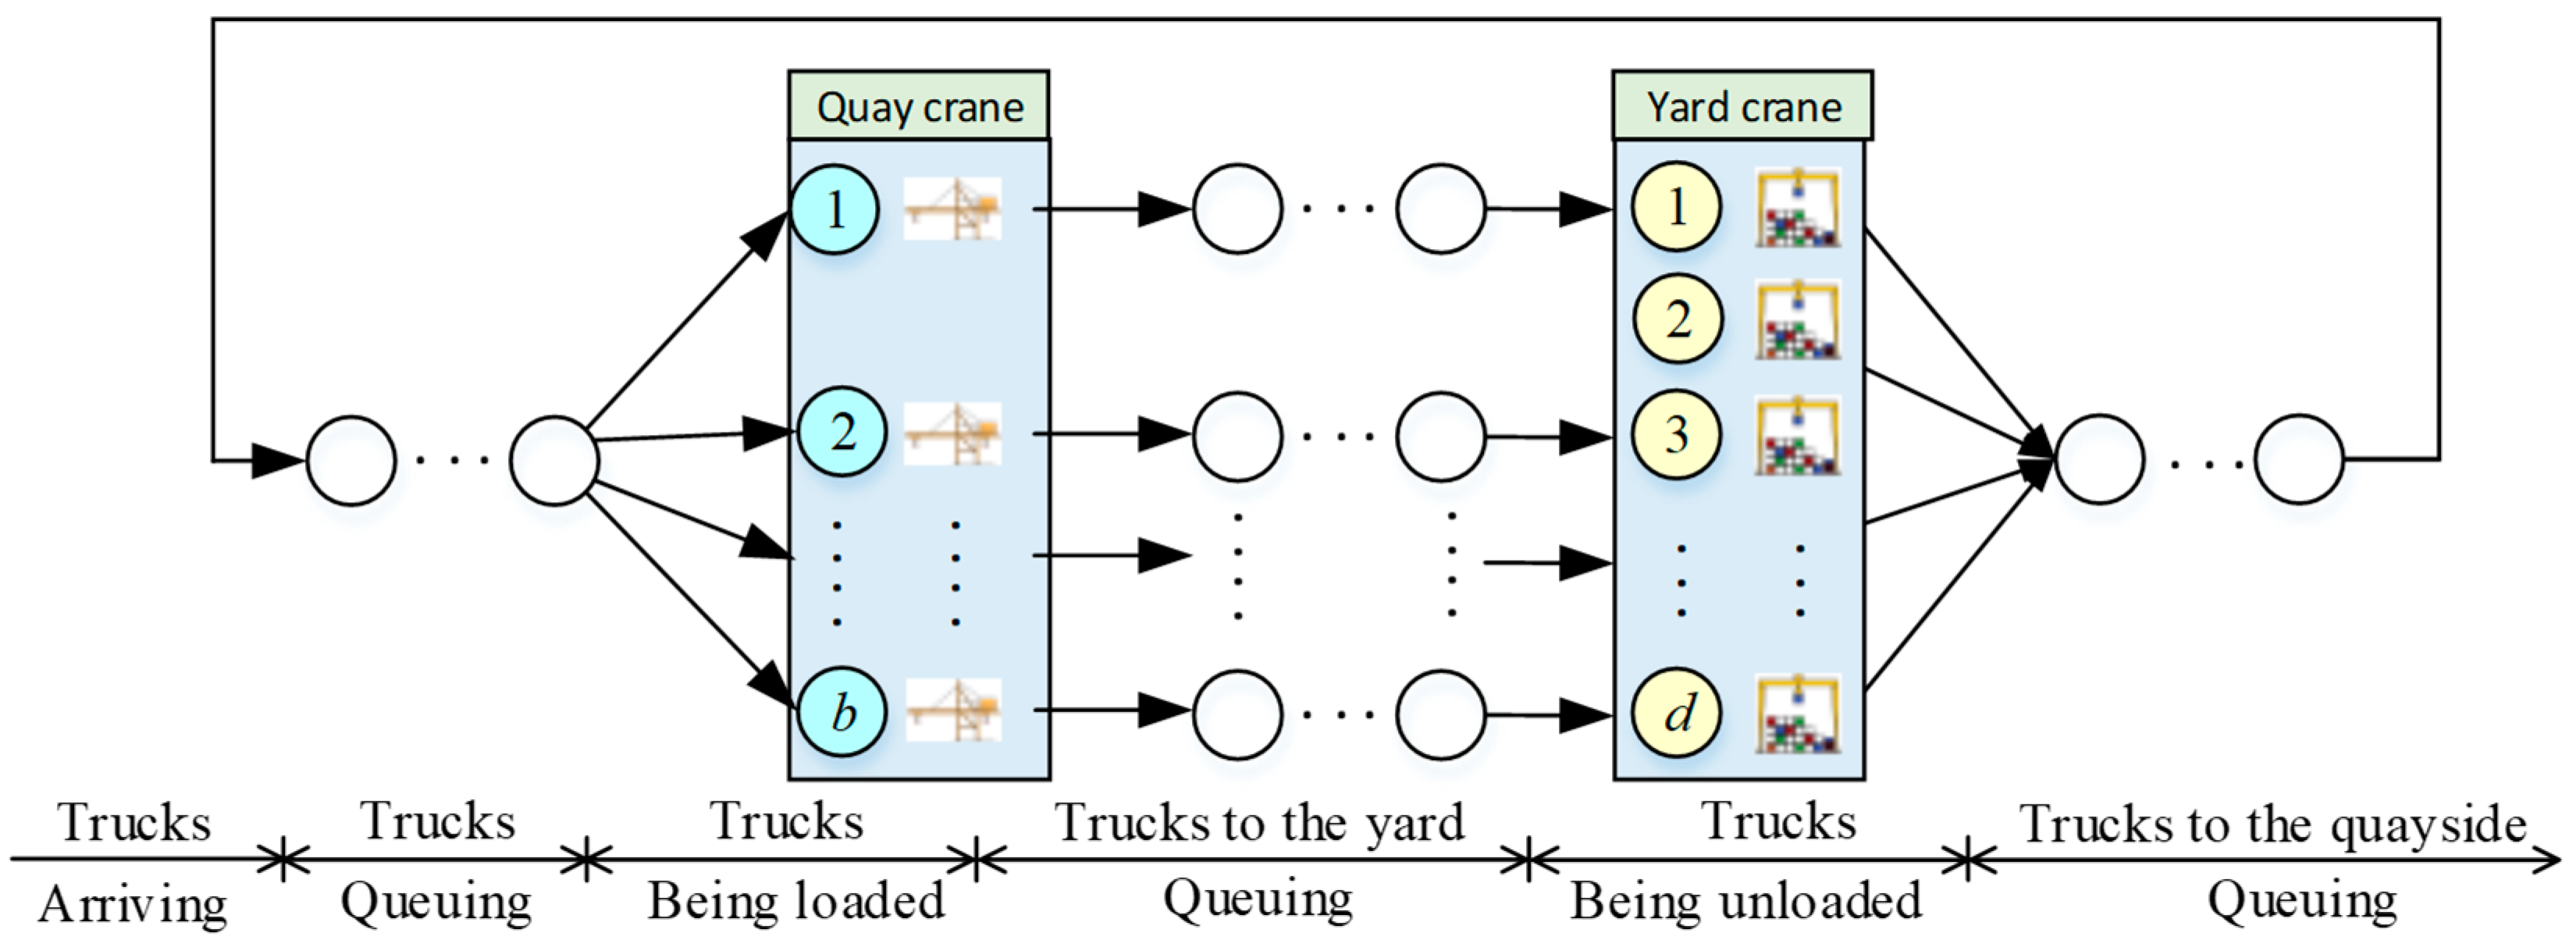
After being transported to the assigned block by trucks, containers will be stacked and shuffled by yard cranes, which will stand over a storage block space. Considering trucks as customers, yard cranes as servers, and handling operation as service, the handling process at the yard can be treated as a multi-server queuing system, as shown in Figure 3.
However, the queuing system is very difficult to model due to the different behaviors of arrival trucks, which are also influenced by the operation efficiency of quay cranes and traffic conditions in the yard. The coordinated operation of quay cranes, trucks, and yard cranes must be considered as a whole queuing network in container terminals.
As discussed previously, the operation process in container terminals is an interconnected complicated queuing system considering uncertainties in the operation system and the complex coupling between sub-processes. It is hard to model how each sub-process interacts with one another by optimization methods and queuing theories, not to mention the relationship between carbon emissions from facilities and the allocation of resources in container terminals. Therefore, a simulation model of the whole container terminal will be introduced to solve the proposed problem.
2.2. Carbon Emission Formulation of Ships and Facilities
The direct or indirect carbon emissions from ships and facilities in container terminals can be calculated according to ISO 14064-1 (2006) [34] and IPCC (2006) [35], as follows.
where W represents the total carbon emissions from container terminals; j represents the type of ships or facilities, and we can define that j is 1 if it is a ship, j is 2 if the facility is a quay crane, j is 3 if the facility is a yard crane, and j is 4 if the facility is a vehicle or a truck; is the number of facilities or ships; s represents the type of energy source of j, which can be diesel or electric energy in this paper; C is the carbon emission coefficient of the energy source; and E represents the energy consumption of j.
The energy consumptions from ships include three parts: ships sailing in the waterway, ships waiting at anchorage, and ships berthing at the berth. For ships sailing in the waterway, of main engines follows the “cubic law of the design speed and operational speed” [36], as shown in Equation (2).
where is the main engine power, and is the load coefficient of the main engine; R represents the consumption rate; and represent the operational speed and the design speed, respectively; and d is the length of the waterway.
For ships waiting at anchorage and berthing at the berth, the energy consumption E of ships can be formulated as shown in Equation (3).
where is the auxiliary engine power, is the load coefficient of the auxiliary engine, and t is waiting time of ships at anchorage or the berthing time of ships at the berth.
For yard cranes, quay cranes, and trucks, the energy consumption E of facilities can be formulated as shown in Equation (4).
where is the handling capacity of cranes or the velocity of trucks and is the working time.
2.3. Logic Model
According to the operation sub-processes in container terminals described in Section 2, a logic model, which is the combination of ships arriving and berthing, the handling operation, and ships’ departing operation, is firstly developed.
2.3.1. Ships’ Arriving and Berthing
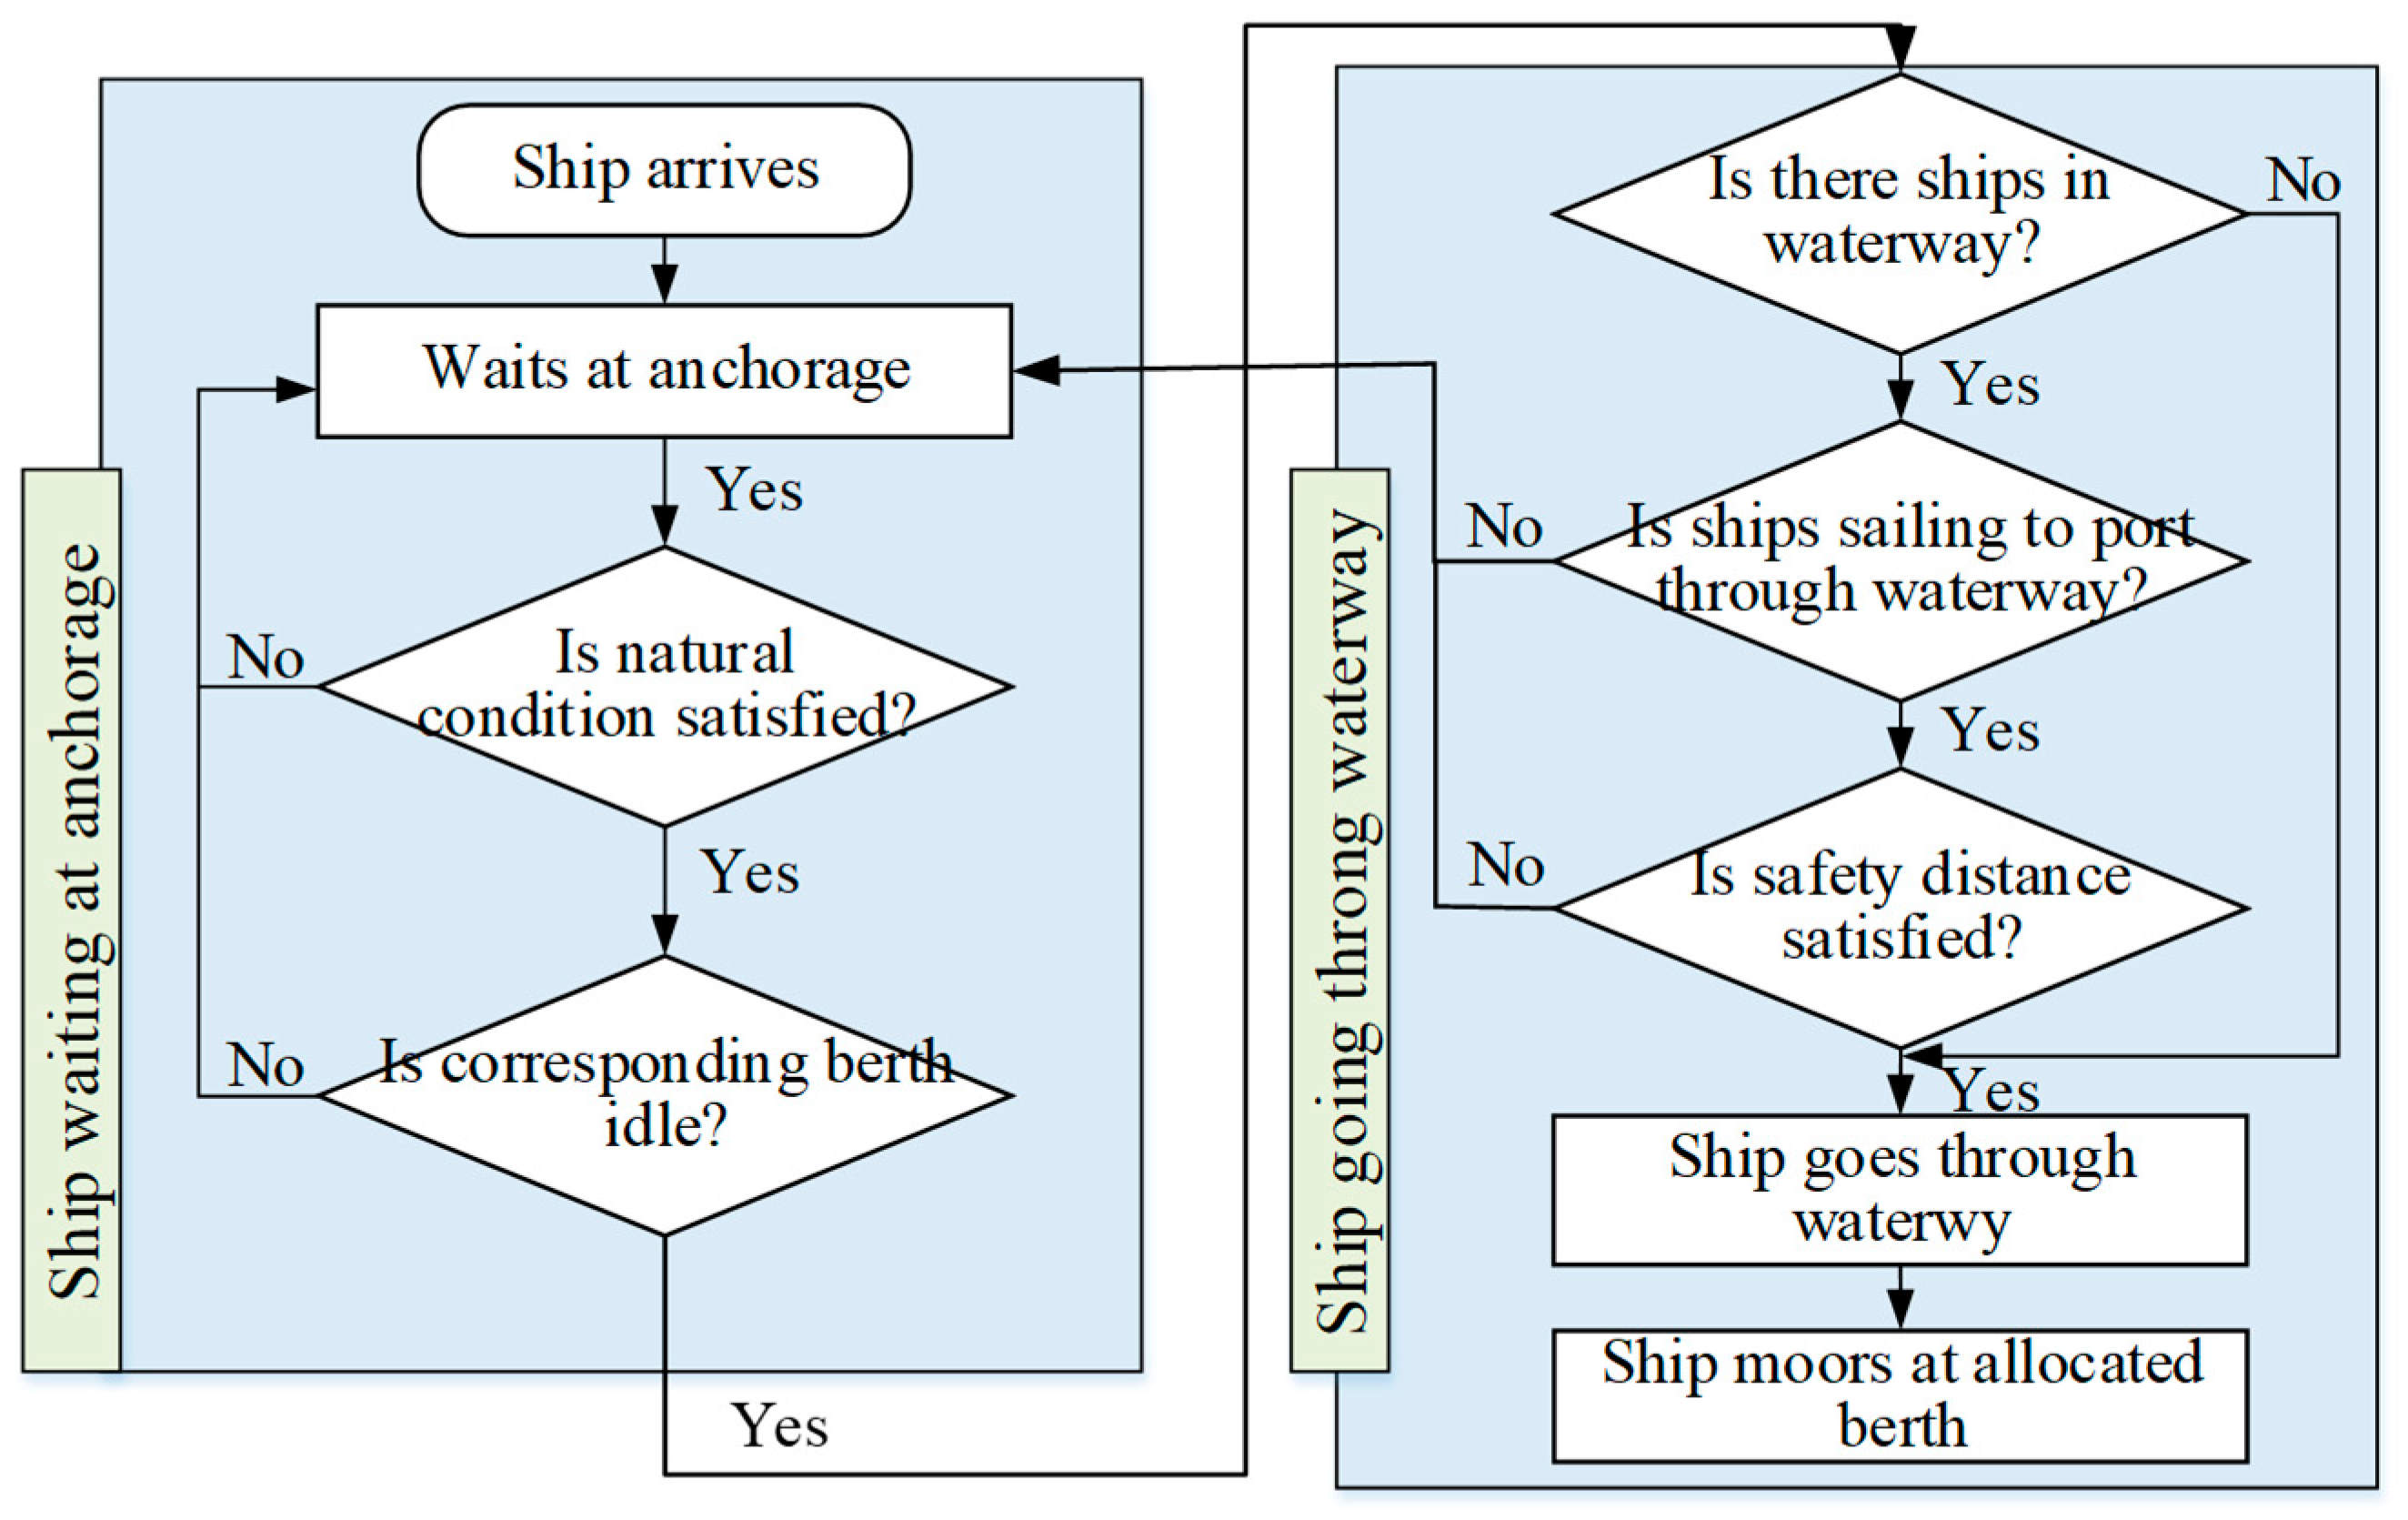
The logic model begins with ships entering and terminates at berthing at an allocated berth, including two events: ships waiting at anchorage and ships going through the waterway.
In Figure 4, arriving ships of various tonnages, drafts, and different lengths will wait at anchorage when the waterway and berth are busy. Then, a berth will be assigned to a ship with a comprehensive consideration of different types of berth and ships and assignment rules users can define. When natural and traffic (e.g., ships in opposite direction, and safety distance) conditions in the waterway are satisfied, the ship will go through the waterway and berth at an allocated berth.
In the process of ships entering ports, the waiting time at anchorage and sailing time in the waterway of ships are influenced by stochastic environments, such as natural conditions and traffic situations, which can increase carbon emissions from ships.
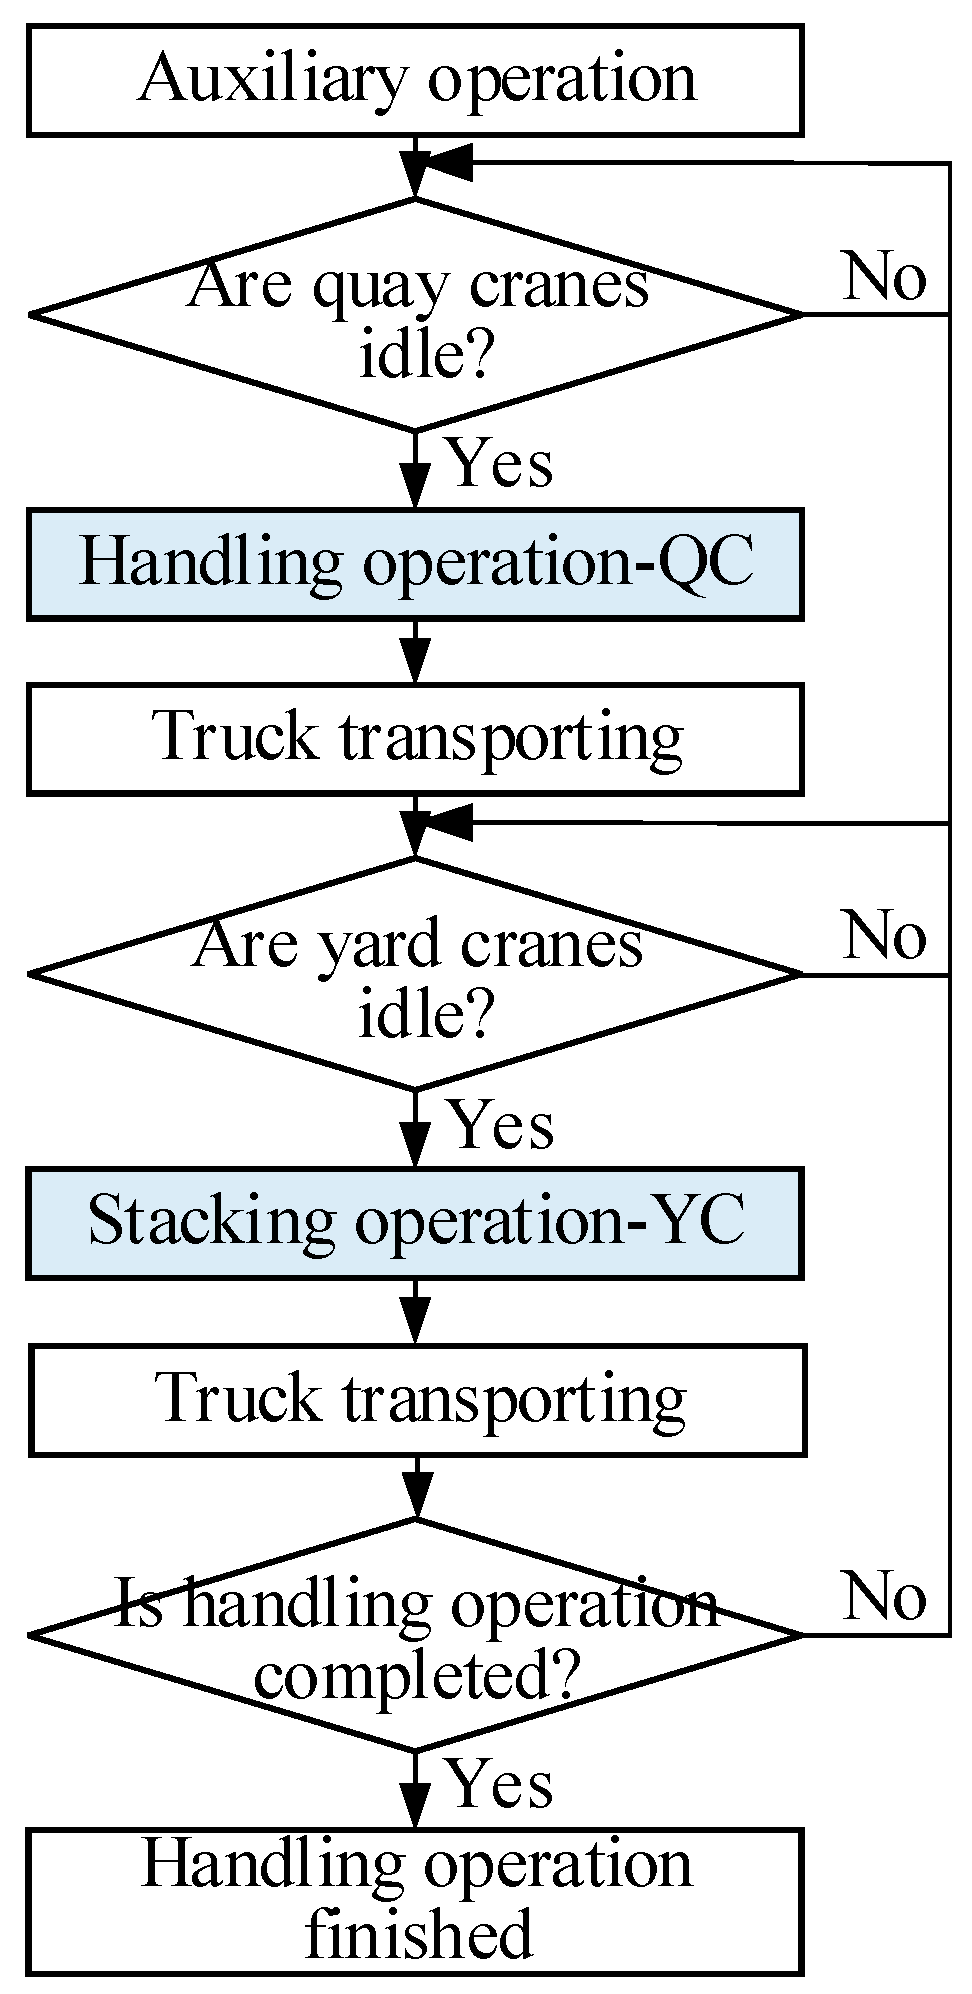
2.3.2. Handling Operation
After a ship arrives at the assigned berth, a certain number of quay cranes are allocated to the ship according to its tonnage and assignment rules after the auxiliary operation.
Take the unloading process as an example. Quay cranes horizontally transfer containers and place them onto allocated trucks. After that, based on travelling rules, the trucks leave the quay cranes, and transport the containers to an assigned container storage location in the yard under corresponding speeds along a specific route. In the stacking process, a yard crane will lift the containers from the trucks and horizontally place the containers at the assigned location.
Until the handling operation has finished, the facilities will stop working. The handling operation is shown in Figure 5.
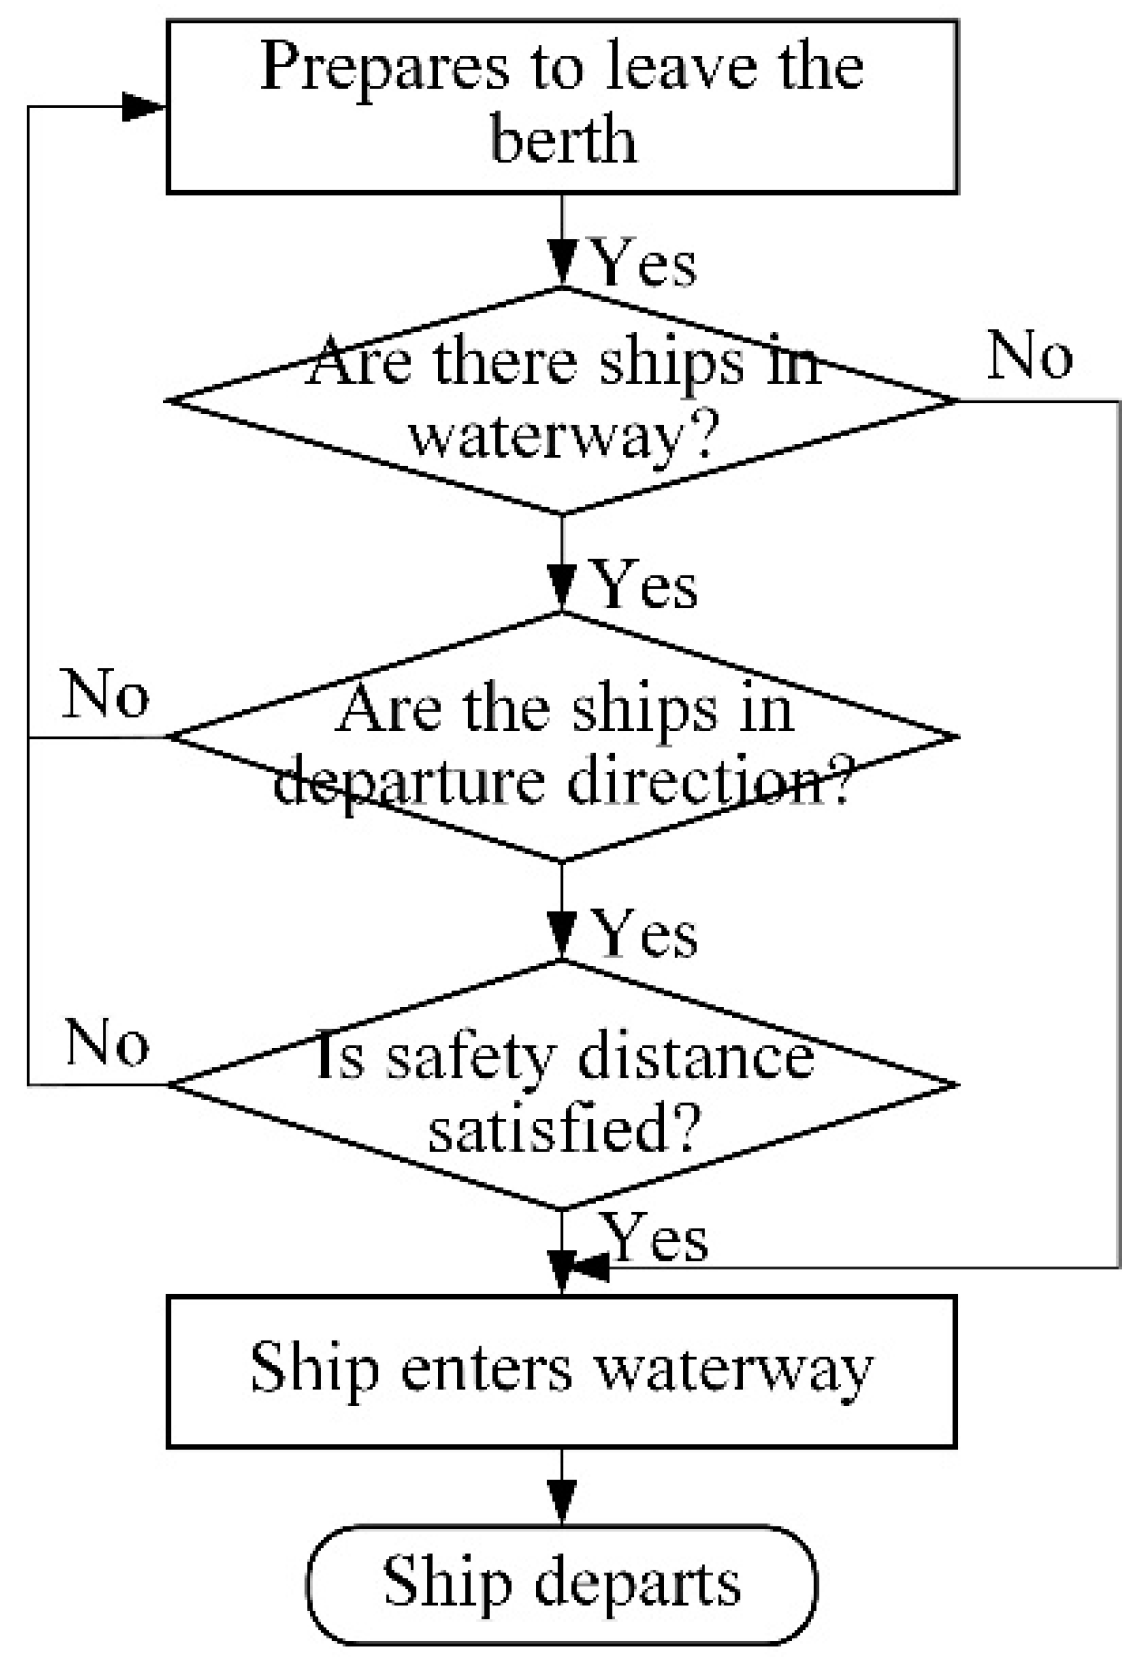
2.3.3. Ships’ Departing Operation
After the auxiliary operation, the ship prepares to leave the berth. The logic model of ships’ departing operation is almost the opposite, as shown in Figure 6.
2.4. Simulation Model
A complex object-oriented simulation model is conducted by using ARENA 10.0 software to simulate the stochastic process of the operation with high uncertainties in container terminals. The whole simulation model concludes three parts: The Berth allocation and quay cranes assignment sub-system simulation model, Truck allocation sub-system simulation model, and Yard cranes allocation sub-system simulation model.
2.4.1. Model Assumptions
- (a)
- No accidents and interference happen during a simulation run.
- (b)
- The facilities are taken full use of, and incomplete combustion of fuel is not considered.
- (c)
- All facilities work well under good conditions, and the number of facilities and the fuel adopted by facilities are not changed during a simulation run.
- (d)
- The working condition of facilities will not change seasonally.
- (e)
- Only care carbon emissions of ships and port facilities such as handling equipment and trucks, not considering the carbon emissions of tugs, and the number of tugs, are enough for the ship operation.
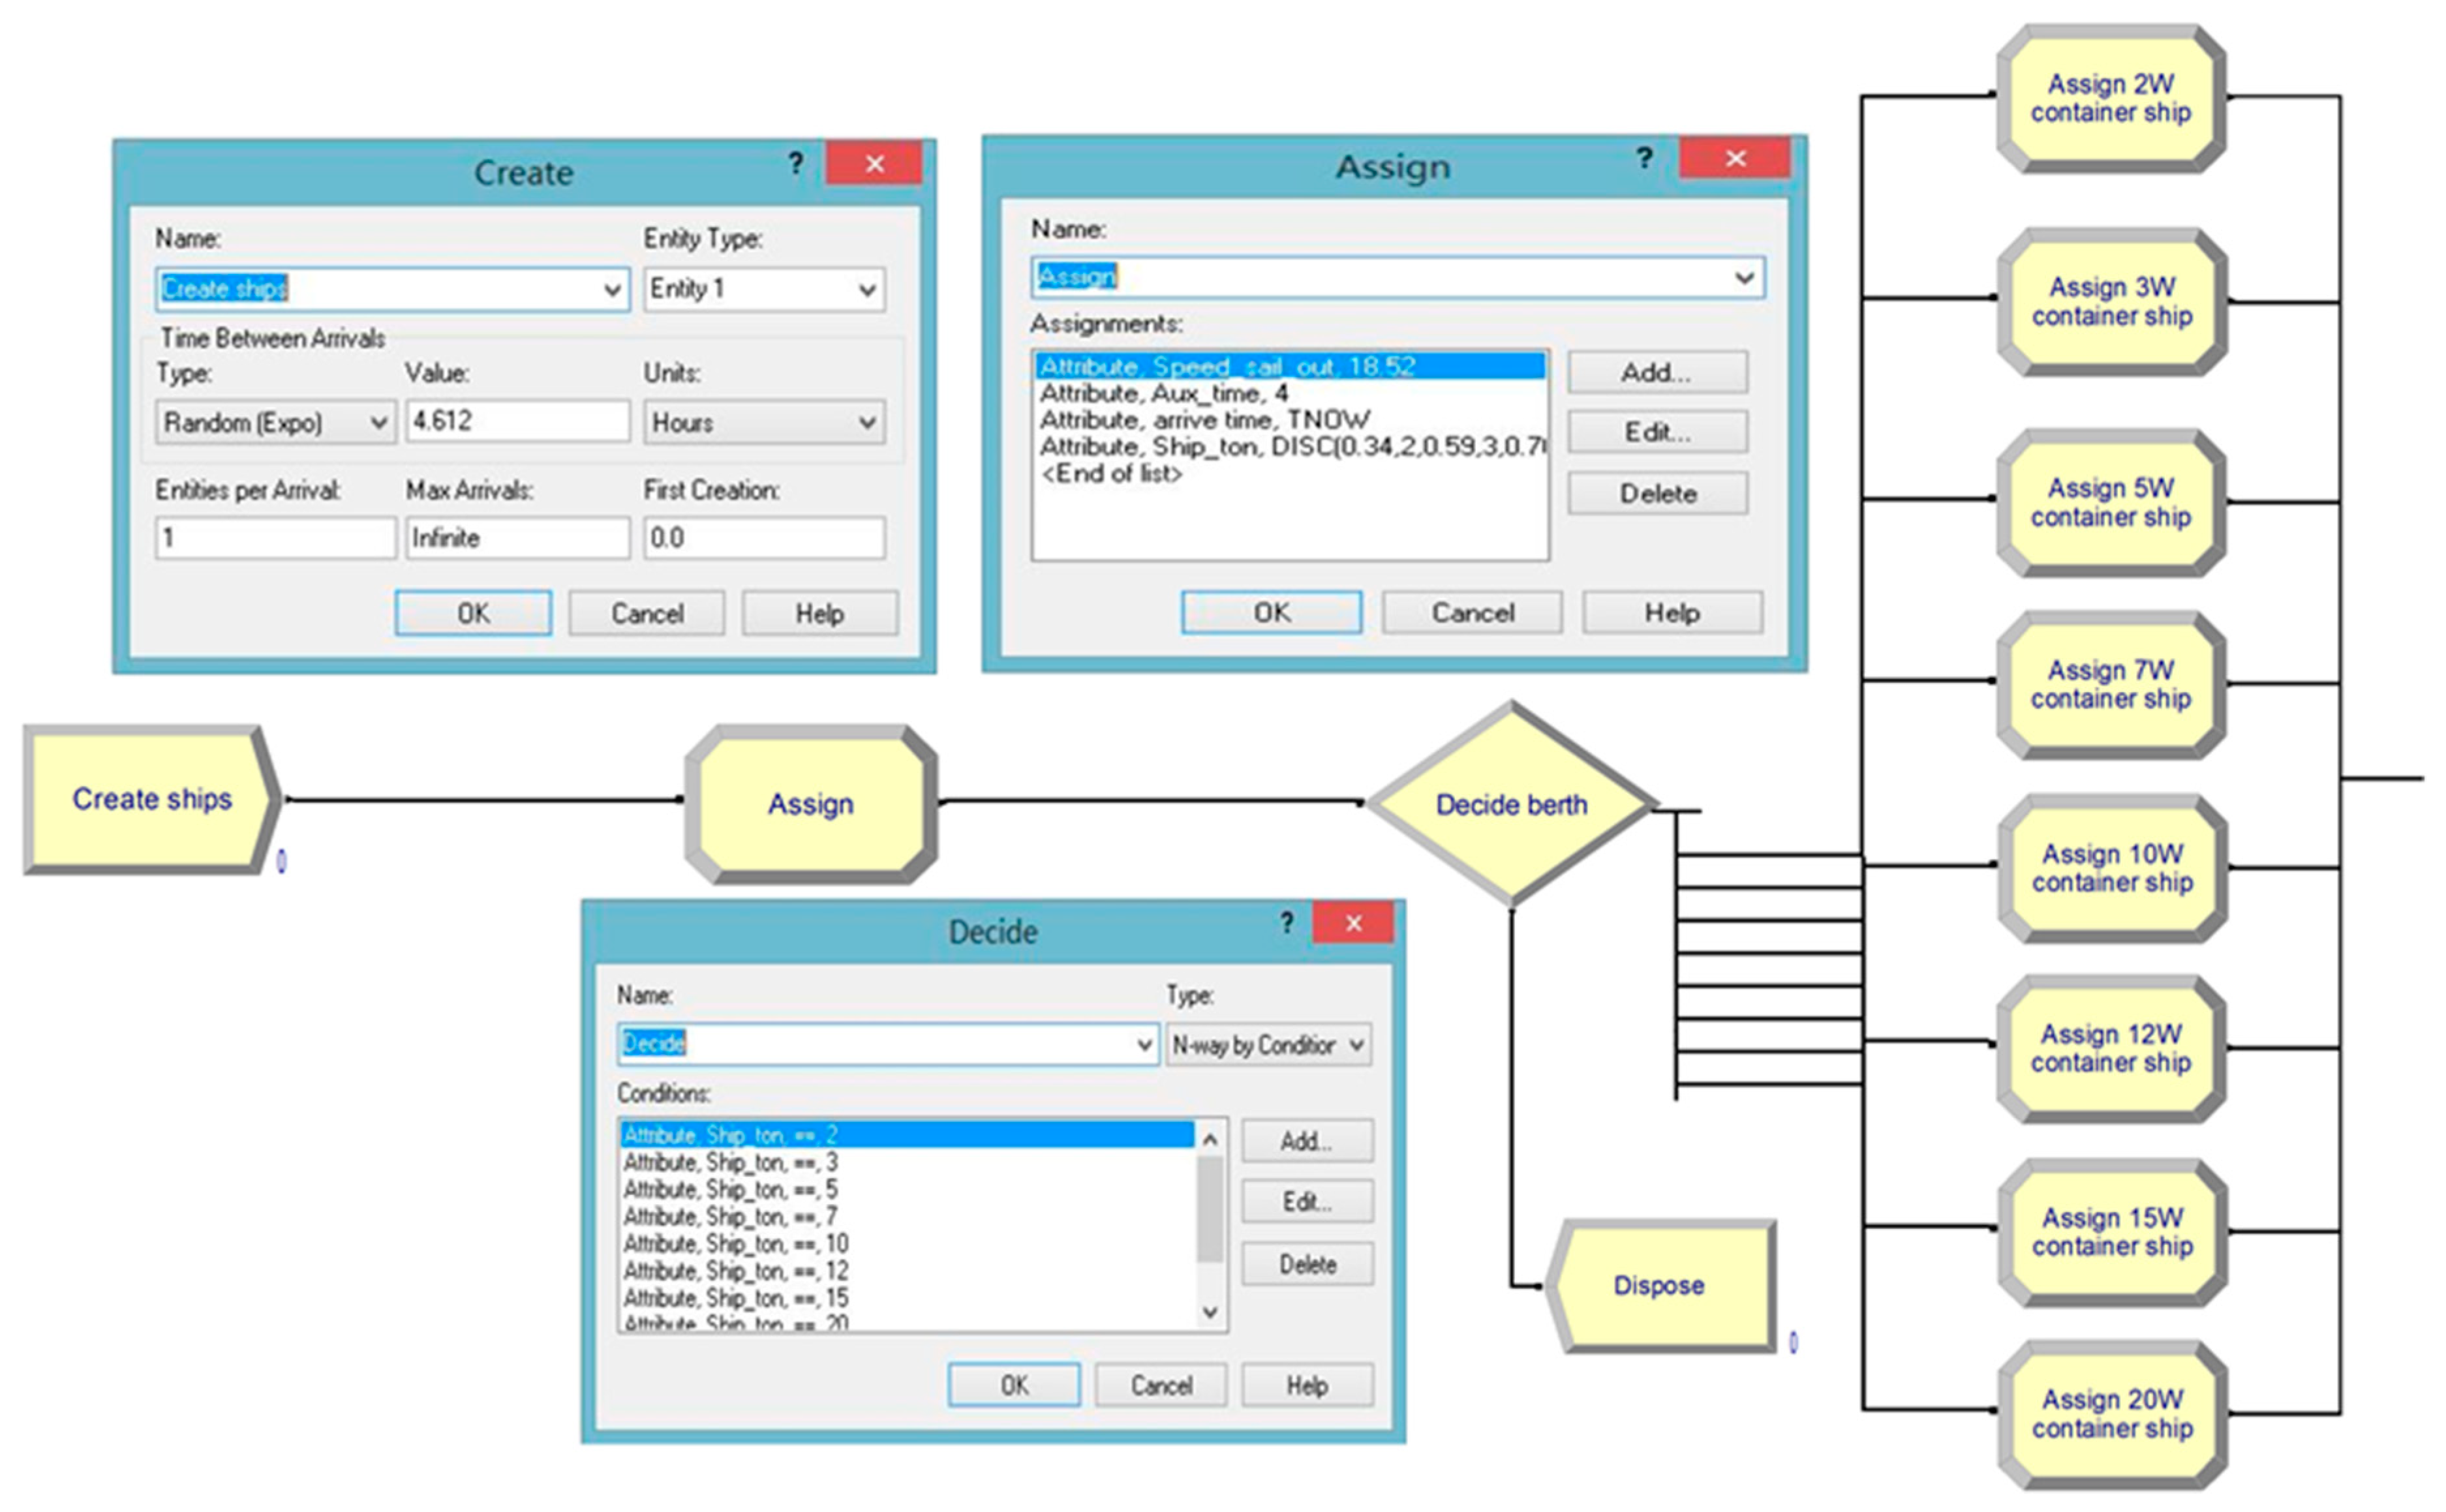
2.4.2. Ship Arriving Simulation model
In the Ship arriving sub-model, the ships are firstly created by Create modules with a certain distribution recorded or a time table scheduled by operators. Then, the attributes of ships such as tonnages, auxiliary operation time, the speed in the waterway, and the arrival time at the port are recorded as inputs in the Assign module. Finally, it is implemented in the Decide module that ships with different tonnages are allocated to the corresponding berth, as shown in Figure 7.
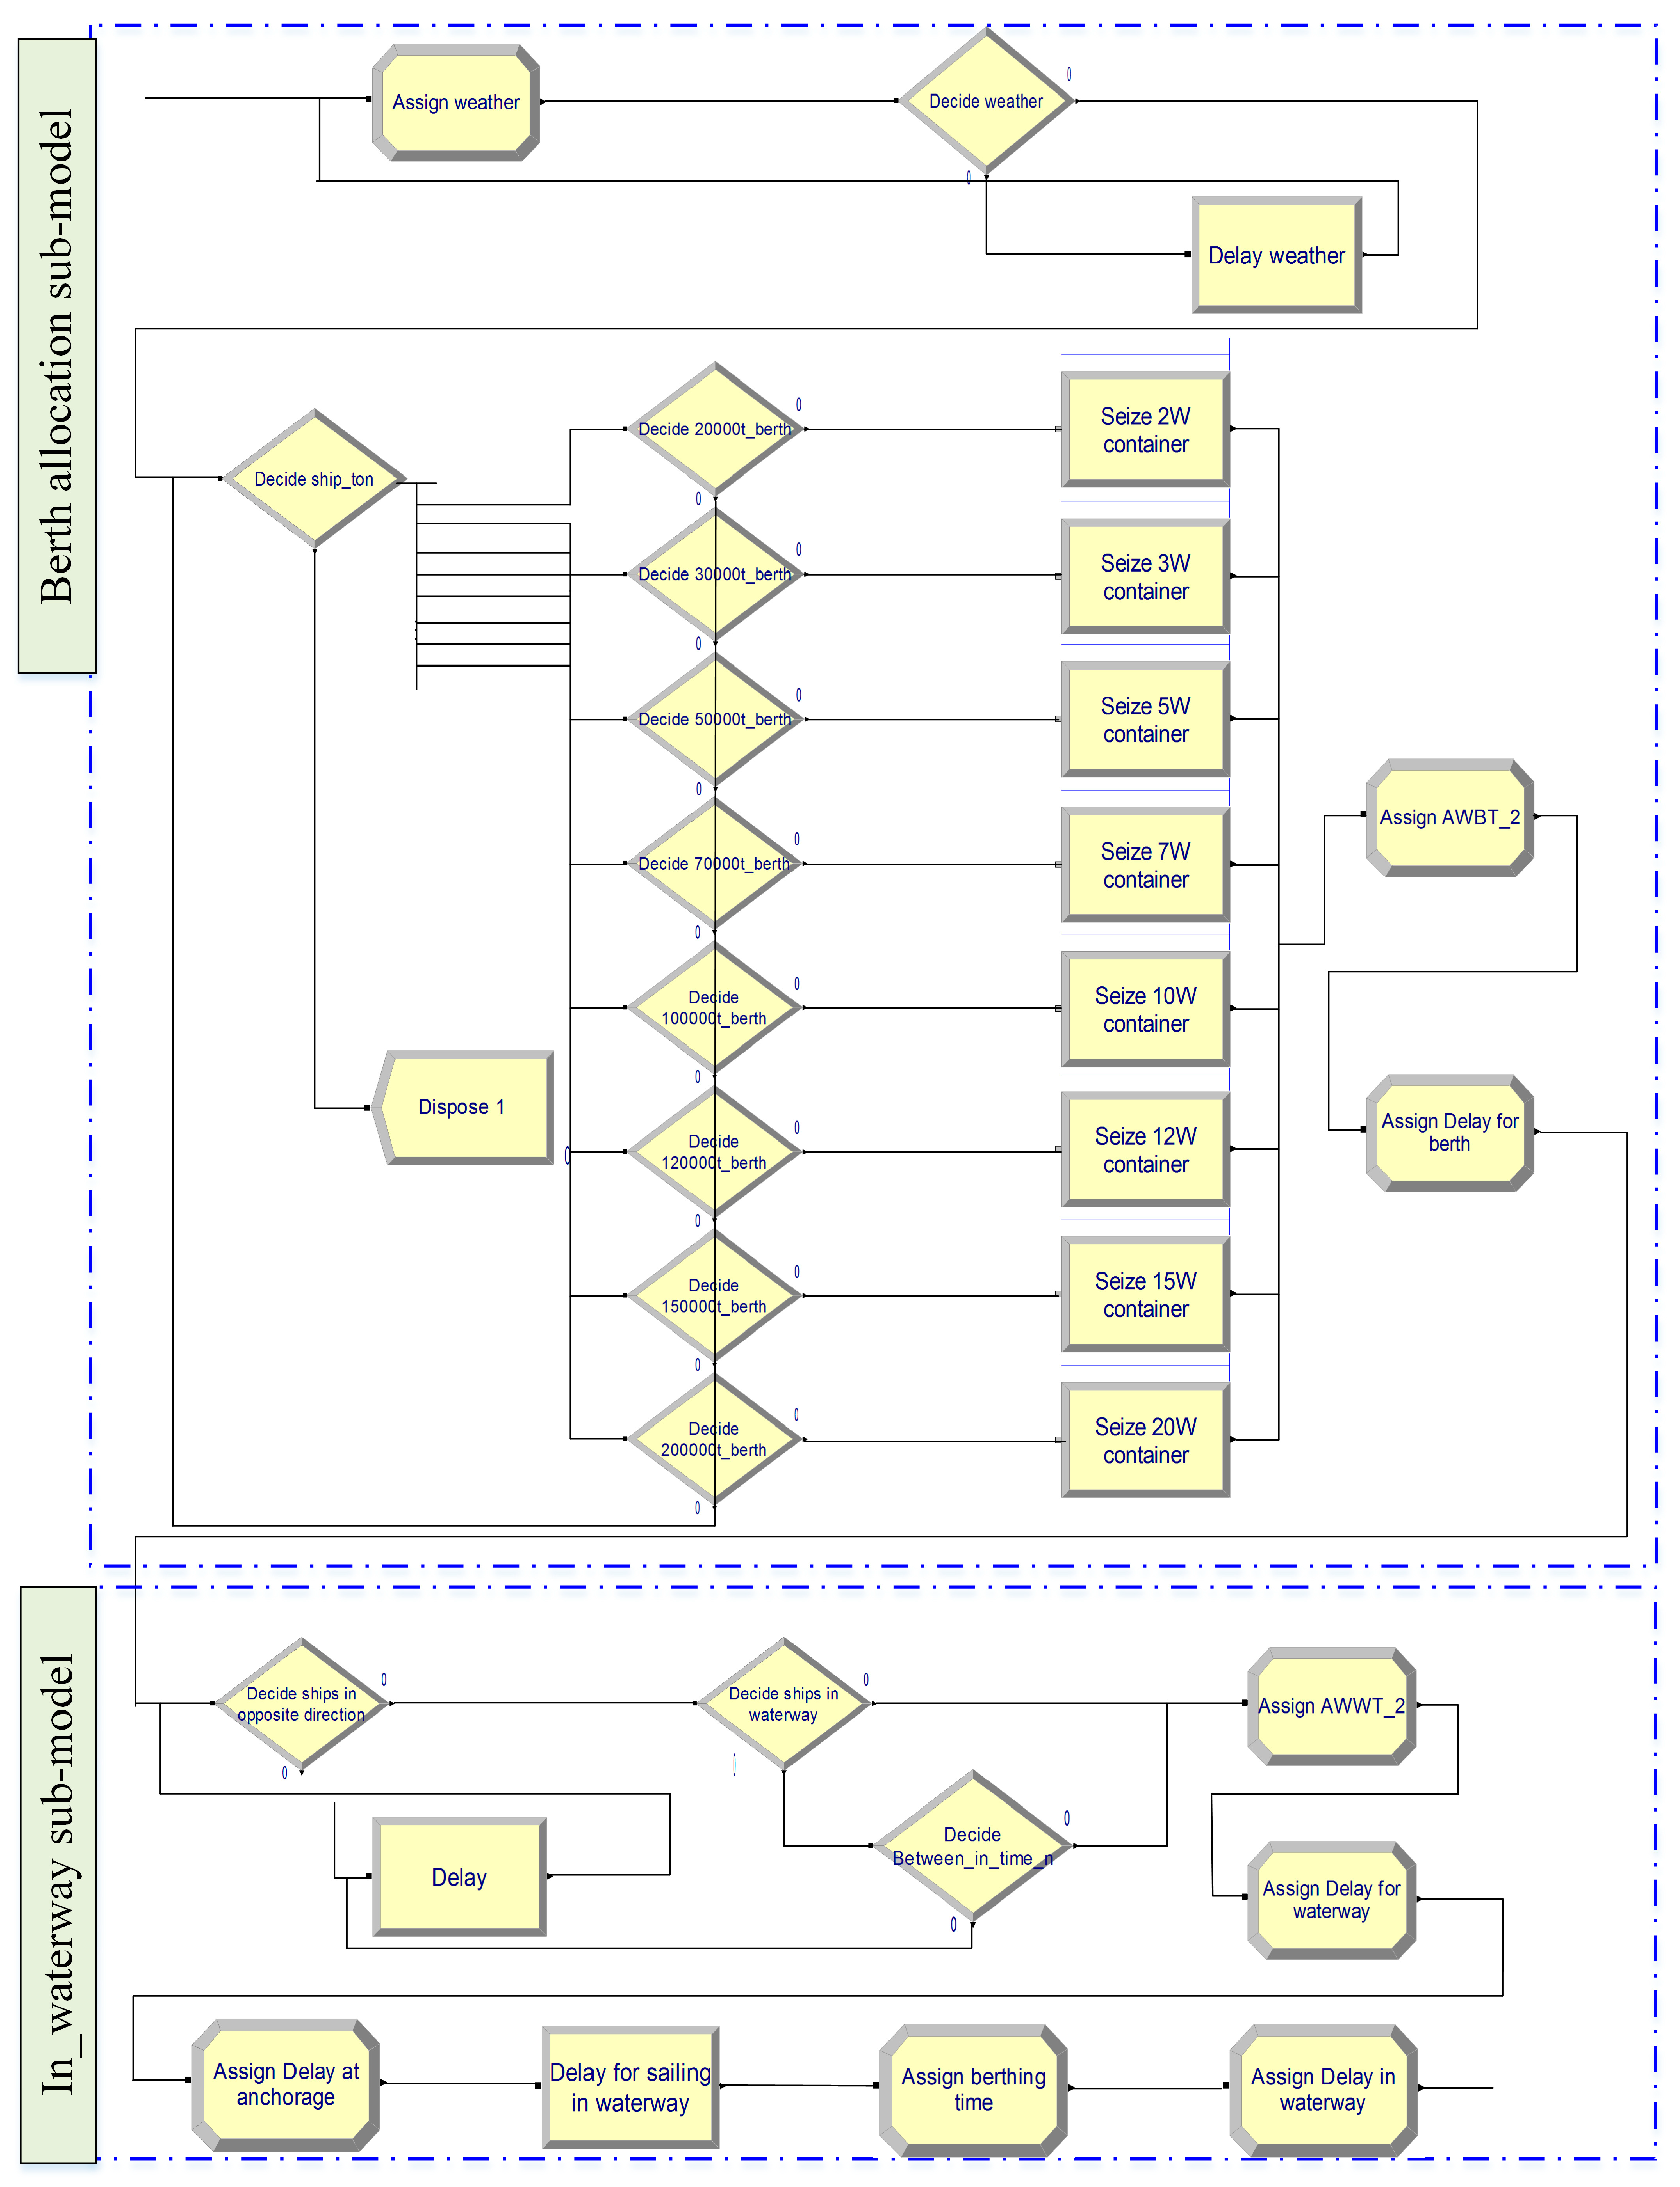
2.4.3. Ship Berthing and Departing Simulation Model
The Ship berthing process can be achieved by using two sub-models: Berth allocation and In_waterway, as shown in Figure 8.
In the Berth allocation sub-model, firstly, the distribution of non-operating days, which is influenced by unfavorable natural conditions (winds, waves, et al.), and the delay time due to natural conditions at anchorage, are recorded in the Assign module and Delay module, respectively. Next, the status variable describing the occupied and idle status of berths is judged in the Decide module. If the berth is idle, the ship will seize the berth resource, otherwise the waiting time for the berth at anchorage will be recorded as outputs in the Assign module. Finally, the traffic conditions (safe distance, ships in opposite directions, et al.) are judged to decide whether the ships can sail through the waterway. In the In_waterway sub-model, once the conditions (Weather, berth, and waterway) are satisfied, the ships can enter the waterway, and the entering time will be recorded in the Assign module, which can be used to calculate the carbon emissions of ships at anchorage along with the arrival time in the Ship arriving model. Besides, the berthing time is recorded in the same module, which can be applied to evaluate the carbon emissions of ships in the waterway along with the entering time. Since the process of ships departing is almost identical to that of ships entering, the Ship departing model will not be described here.
2.4.4. Ship Handling Operation Simulation Model
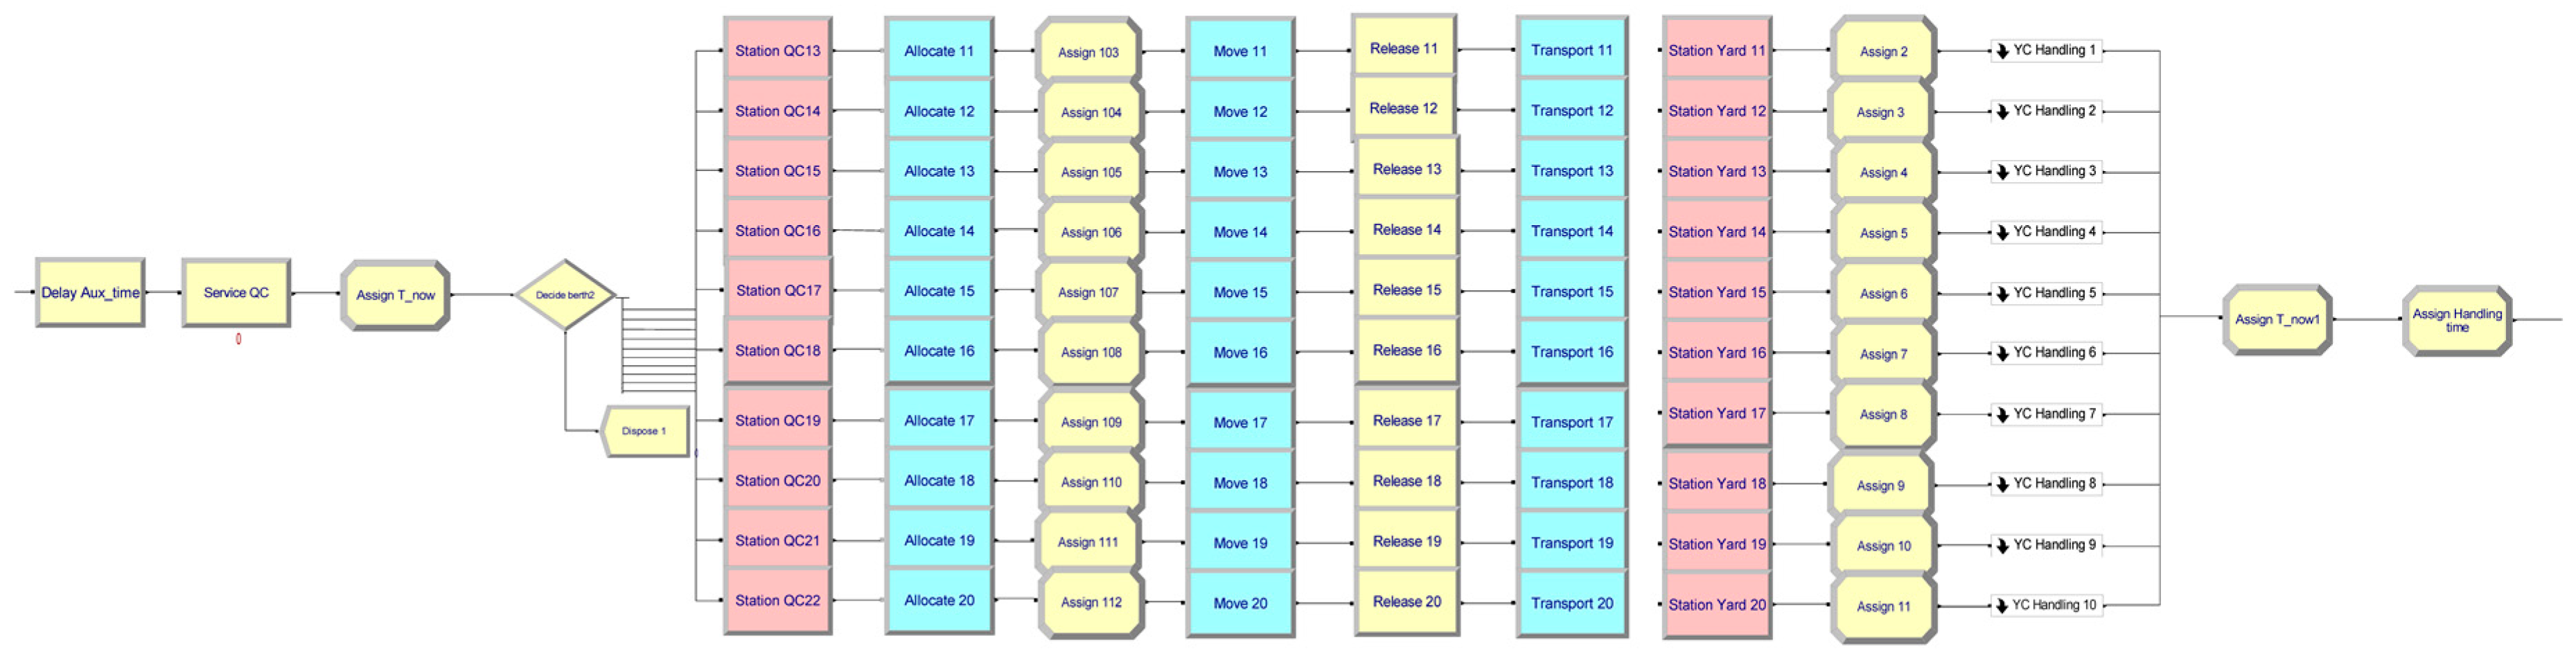
After the auxiliary operation and quay crane assignment, the process of the handling operation begins. At this time, the starting time of quay cranes will be recorded in the Assign module to calculate the emissions from ships waiting at the berth. Meanwhile, the duplicate entity is transferred from a ship to containers by using the Separate module. When containers are handled by quay cranes, seizing quay crane resources can be realized by using a Service-QC module, and the number of handled containers by each quay crane and the working time for each container can be recorded. Then, until the handling work of quay cranes for a container is finished, the Release module is used for releasing quay crane resources. Trucks allocated to quay cranes by using the Allocate truck module will transport the containers to assigned yard blocks by the Transport to yard module. Meanwhile, the starting and ending time of each truck for transporting the containers every trip can be recorded in the Assign module. The attributes for each truck, such as the travelling speed and the fuel used, can be defined by the Assign module of the Handling operation sub-model (Figure 9). Once trucks arrive at the yard blocks, the container will call for an idle yard crane to handle it. Then, the working time of yard cranes and the number of containers for each yard crane can be recorded in the YC_Handling sub_model.
Carbon emissions from each truck can be calculated based on traveling time. The number of handled containers is recorded, which can be applied to estimate the carbon emissions of quay cranes and yard cranes. The allocated number of facilities and the energy type of facilities can be changed in the Resource module and Assign module, separately. When all the handling work is finished, the finishing time of the handling operation can be recorded in the Assign module, which will be used to evaluate the carbon emissions of ships at the berth.
3. Results
3.1. Data Collection
Taking a container terminal in Algeria as the simulation case, numerical experiments are implemented to evaluate the influences of allocation and energy replacement of facilities on carbon emissions.
The terminal is 6310 m long, with ten container berths of different tonnages along the quayside and eight blocks assigned to each berth. Besides, the waterway is 20 nm long with two lanes, and the navigation speed of ships in the waterway is 18.52 km per hour simultaneously. Initial parameters of the inputs, such as tidal observation records and natural conditions, are provided respectively by the port company in 2015. According to the preliminary analysis of natural conditions (e.g., winds statistical data (36.625° N, 2.125° E) from 2002 to 2011, and wave calculation), the navigable days in a year is 340 days, and the number of operation days in a year is 330 days. The following focuses on the parameters of ships, berths, and facilities.
3.1.1. Ships
Ships arrive at the container terminal with an inter-arrival time following a negative exponential distribution. According to the frequency curve fitting and the chi-square test of real operation data, the average value of the ship’s inter-arrival is set as 4.612 h.
From Equations (2) and (3), it is concluded that the energy consumption of a ship depends linearly on load coefficients under the same allocation of facilities in ports. Additionally, the load coefficients only influence carbon emissions from ships, having nothing to do with carbon emissions from facilities. When the allocation of facilities varies, the coefficient will only affect the amount of carbon emissions from ships, and will not influence the variation trend of carbon emissions. So, it is not necessary to study the sensitivity of load coefficients on carbon emissions. Therefore, according to the Calculation of Ship Power Load [37], the load coefficients of the main engines and auxiliary engines are set as 0.8 and 0.5 to calculate the carbon emissions, respectively. Besides, one object of this paper is to study the impact of the allocation of facilities on carbon emissions from arriving ships, not considering the tug operations and emissions from tugs. Thus, the numbers of tugs are assumed to be sufficient for different types of ships. Besides, to quantify the carbon emissions of ships, the diesel consumption rate for the main engines is set as 0.206 kg/kWh, and 0.211 kg/kWh for the auxiliary engines.
The type combinations of ships, such as the tonnage, proportion, and average handling quantity per ship, are listed in Table 1.
3.1.2. Berths
Directly affecting the waiting time for berths and handling time at the berth of ships, reasonable utilization of berth resources is extremely important for the reduction of carbon emissions in container terminals. The parameters for berths such as berth number and tonnages, along with the allocated number of quay cranes, are as shown in Table 2.
3.1.3. Facilities
The object of this paper is to calculate how much the carbon emission is influenced by the allocation of facilities. Therefore, it is assumed that the working efficiency of quay cranes and yard cranes and the travelling speed of trucks are constants, which are 30 TEU/h, 35 TEU/h, and 22.5 km/h, respectively.
According to the Design Code of Container Terminal for Sea Port [30], generally, the ratio of the number of quay cranes to that of yard cranes and trucks is 1:(2~4):(3~7) based on the investigation of major container terminals. Here, we enlarge the range a little to see how the ratio affects carbon emissions, which is 1:(2~5):(3~7) in this paper.
3.1.4. Energy
In order to analyze the energy types of facilities on carbon emissions, this paper considers diesel and electricity as two alternate types of energy sources. According to related research results about low-carbon ports [38], the carbon emission coefficient of diesel and electricity is respectively set as 3.2 and 0.8, and the fuel consumption of trucks is set as 0.9 kg per kilometer.
3.2. Analysis of Simulation Results
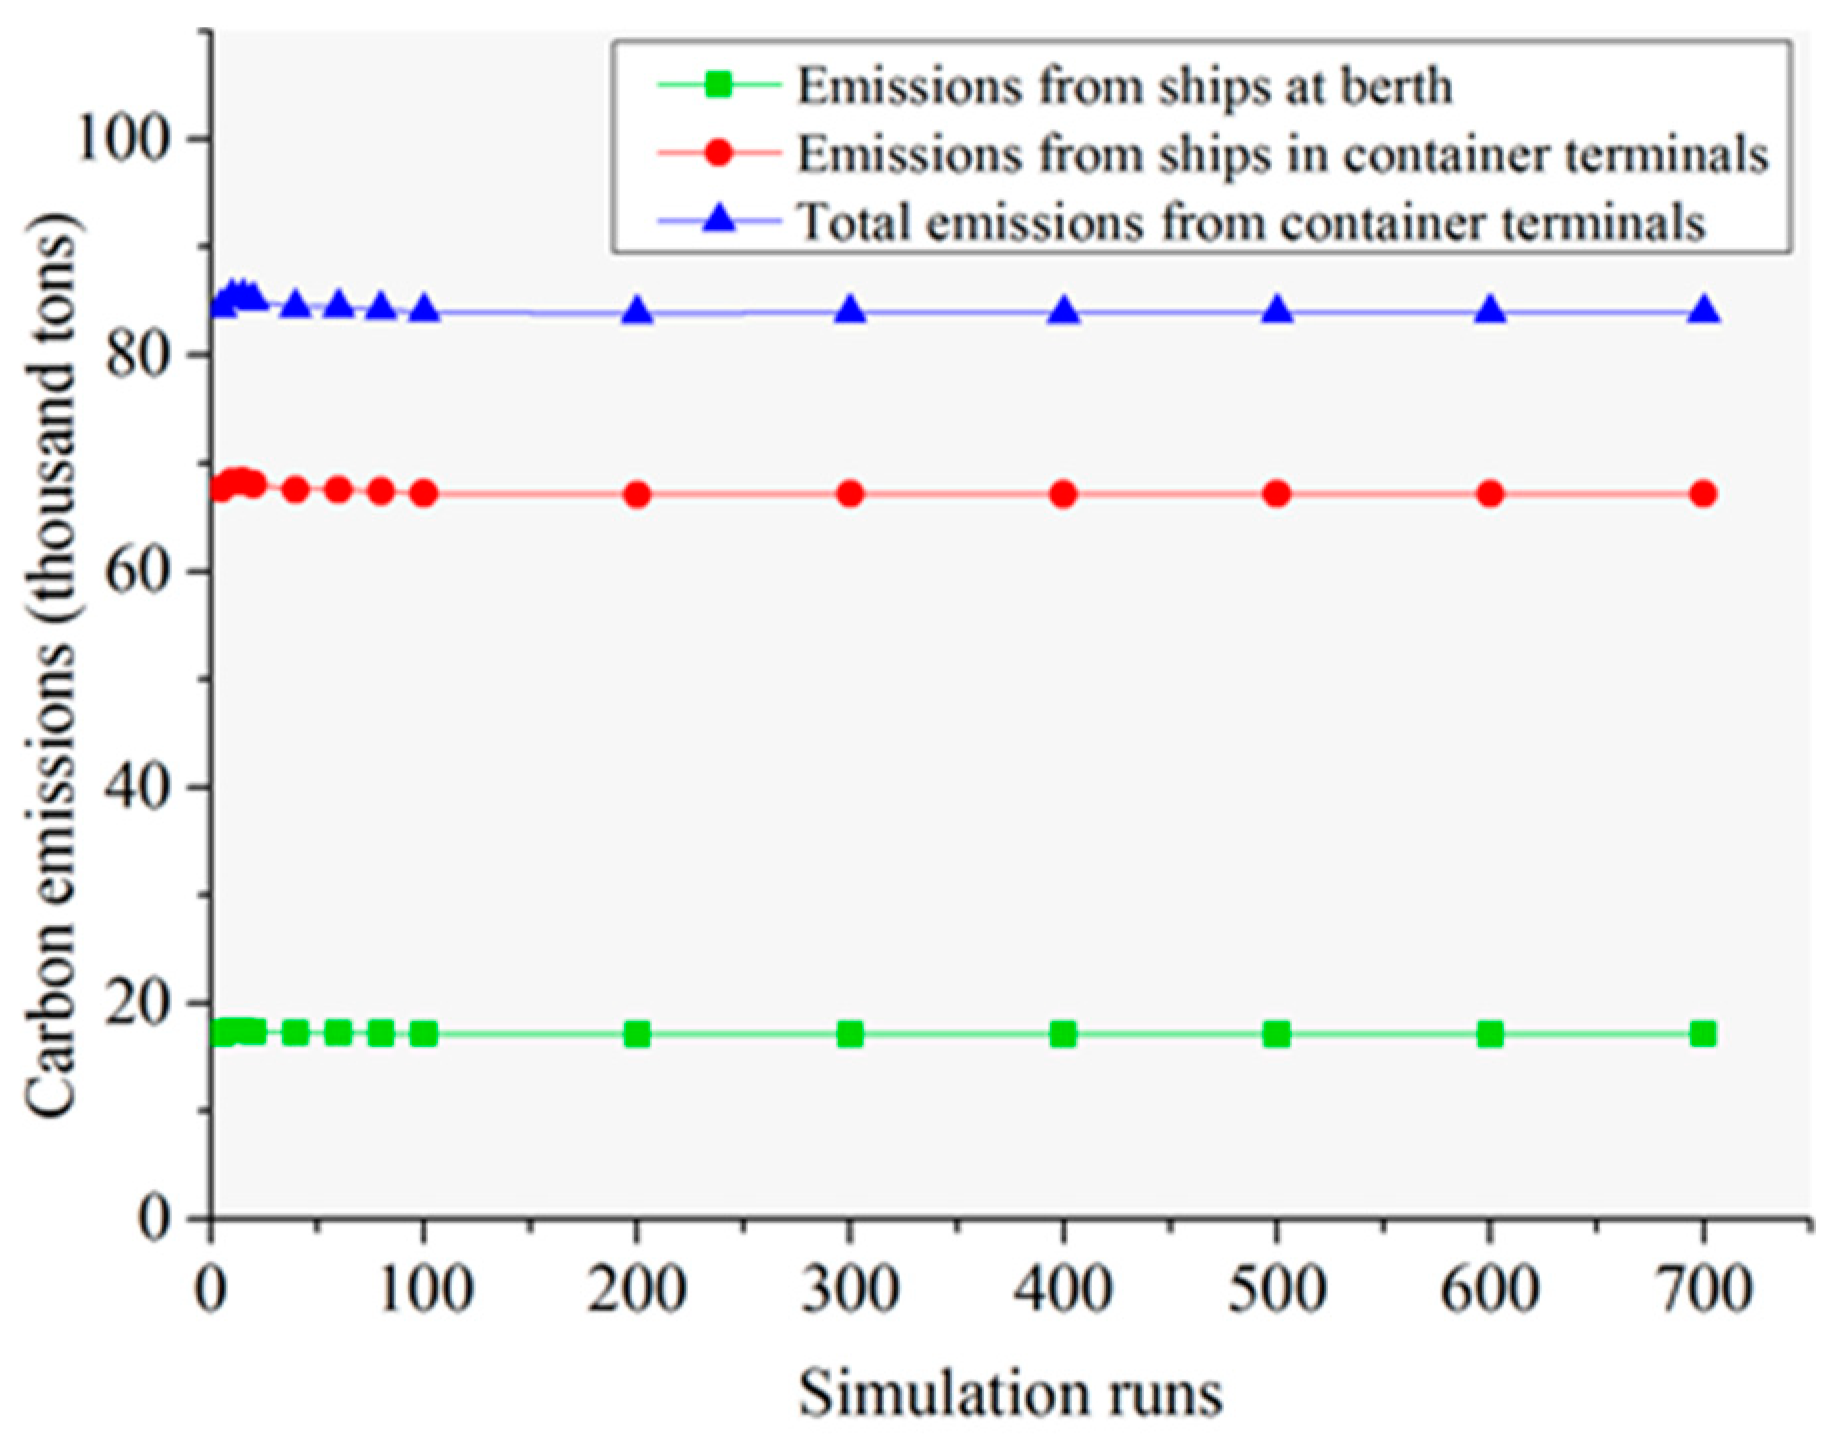
Regarding the fluctuations of each simulation result, a series of simulation experiments from five runs to 700 runs are conducted, and carbon emissions are as shown in Figure 10. As Figure 10 shows, the result is stable after 100 runs. Therefore, this paper adopted the average value after running the simulation model for 100 runs to analyze the trend of carbon emissions.
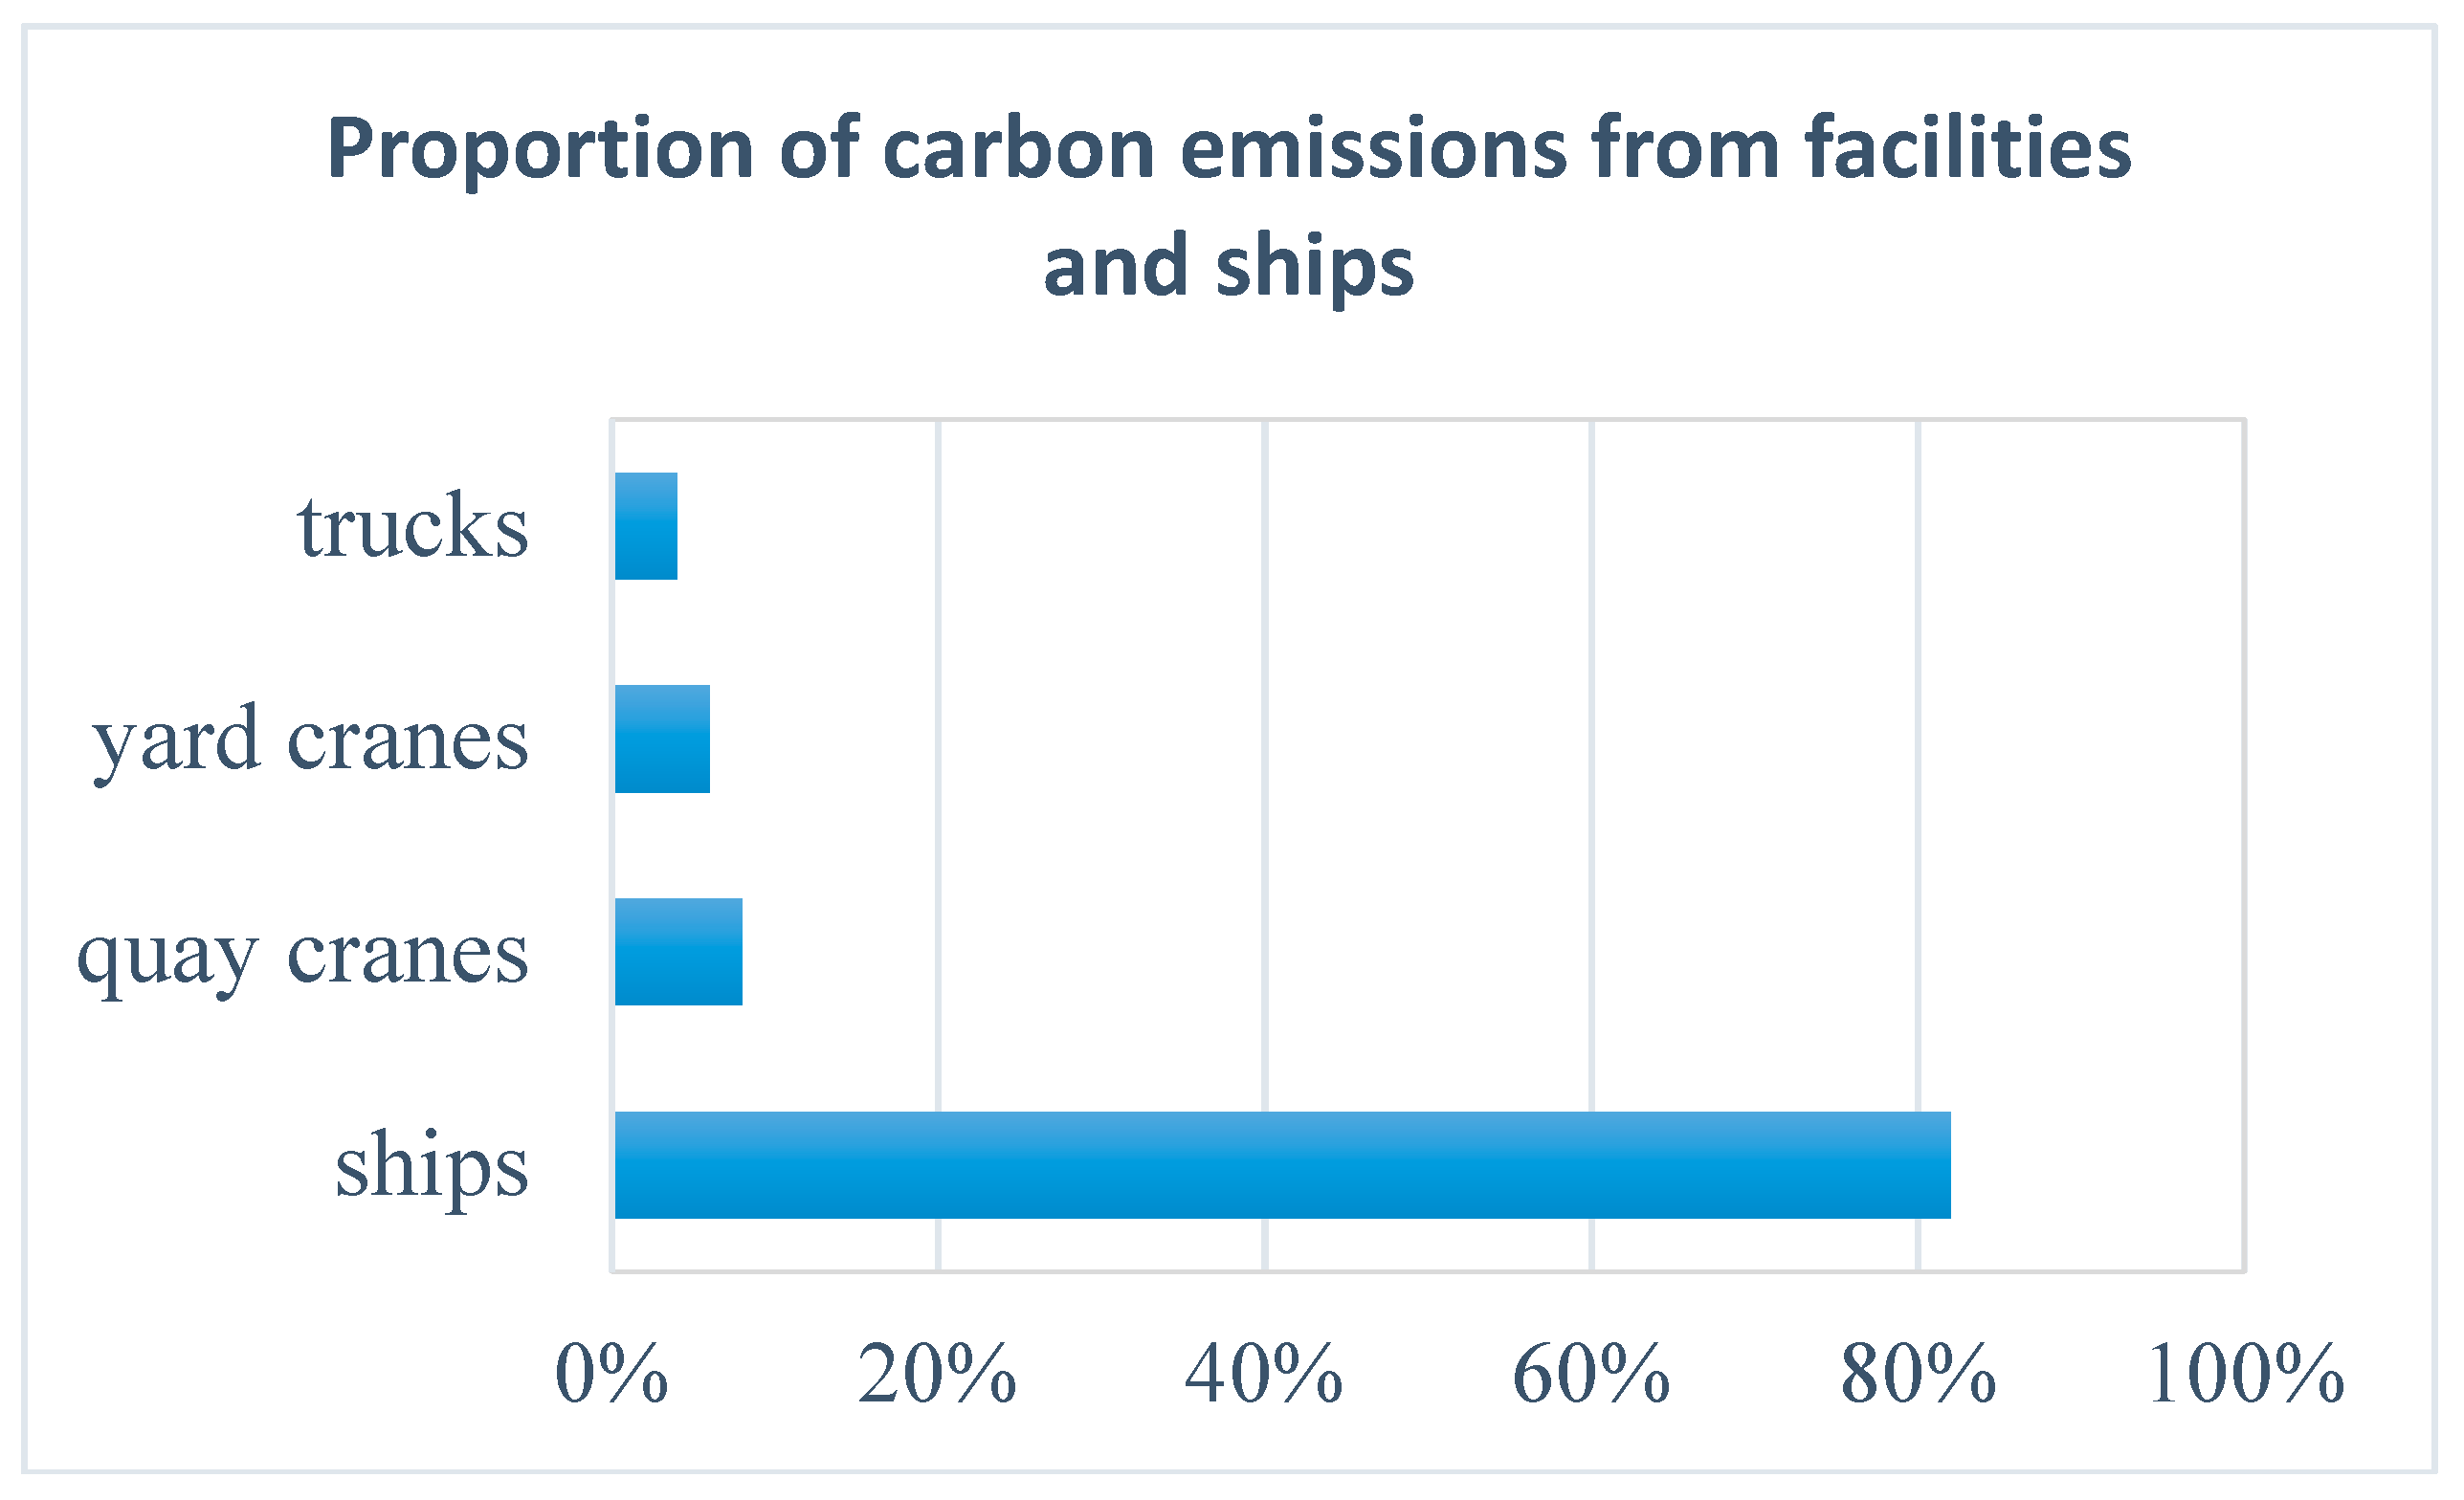
As shown in Figure 11, the emissions from ships account for the most, followed by quay cranes. The emissions from quay cranes, yard cranes, or trucks are only a small fraction of total emissions of container terminals, which are no more than 10%. However, the reasonable allocation of facilities can help reduce carbon emissions from ships, thereby reducing the total emissions. Then, this paper focuses on how the emissions from ships at the berth or in container terminals and total emissions from container terminals are influenced. The number of facilities is changed to see how the ratio of facilities affect carbon emissions, whose results are shown in Section 3.2.1 and Section 3.2.2. For the emission from the facility, the impact of energy replacement is shown is Section 3.2.3.
3.2.1. Impact of Allocation of Trucks
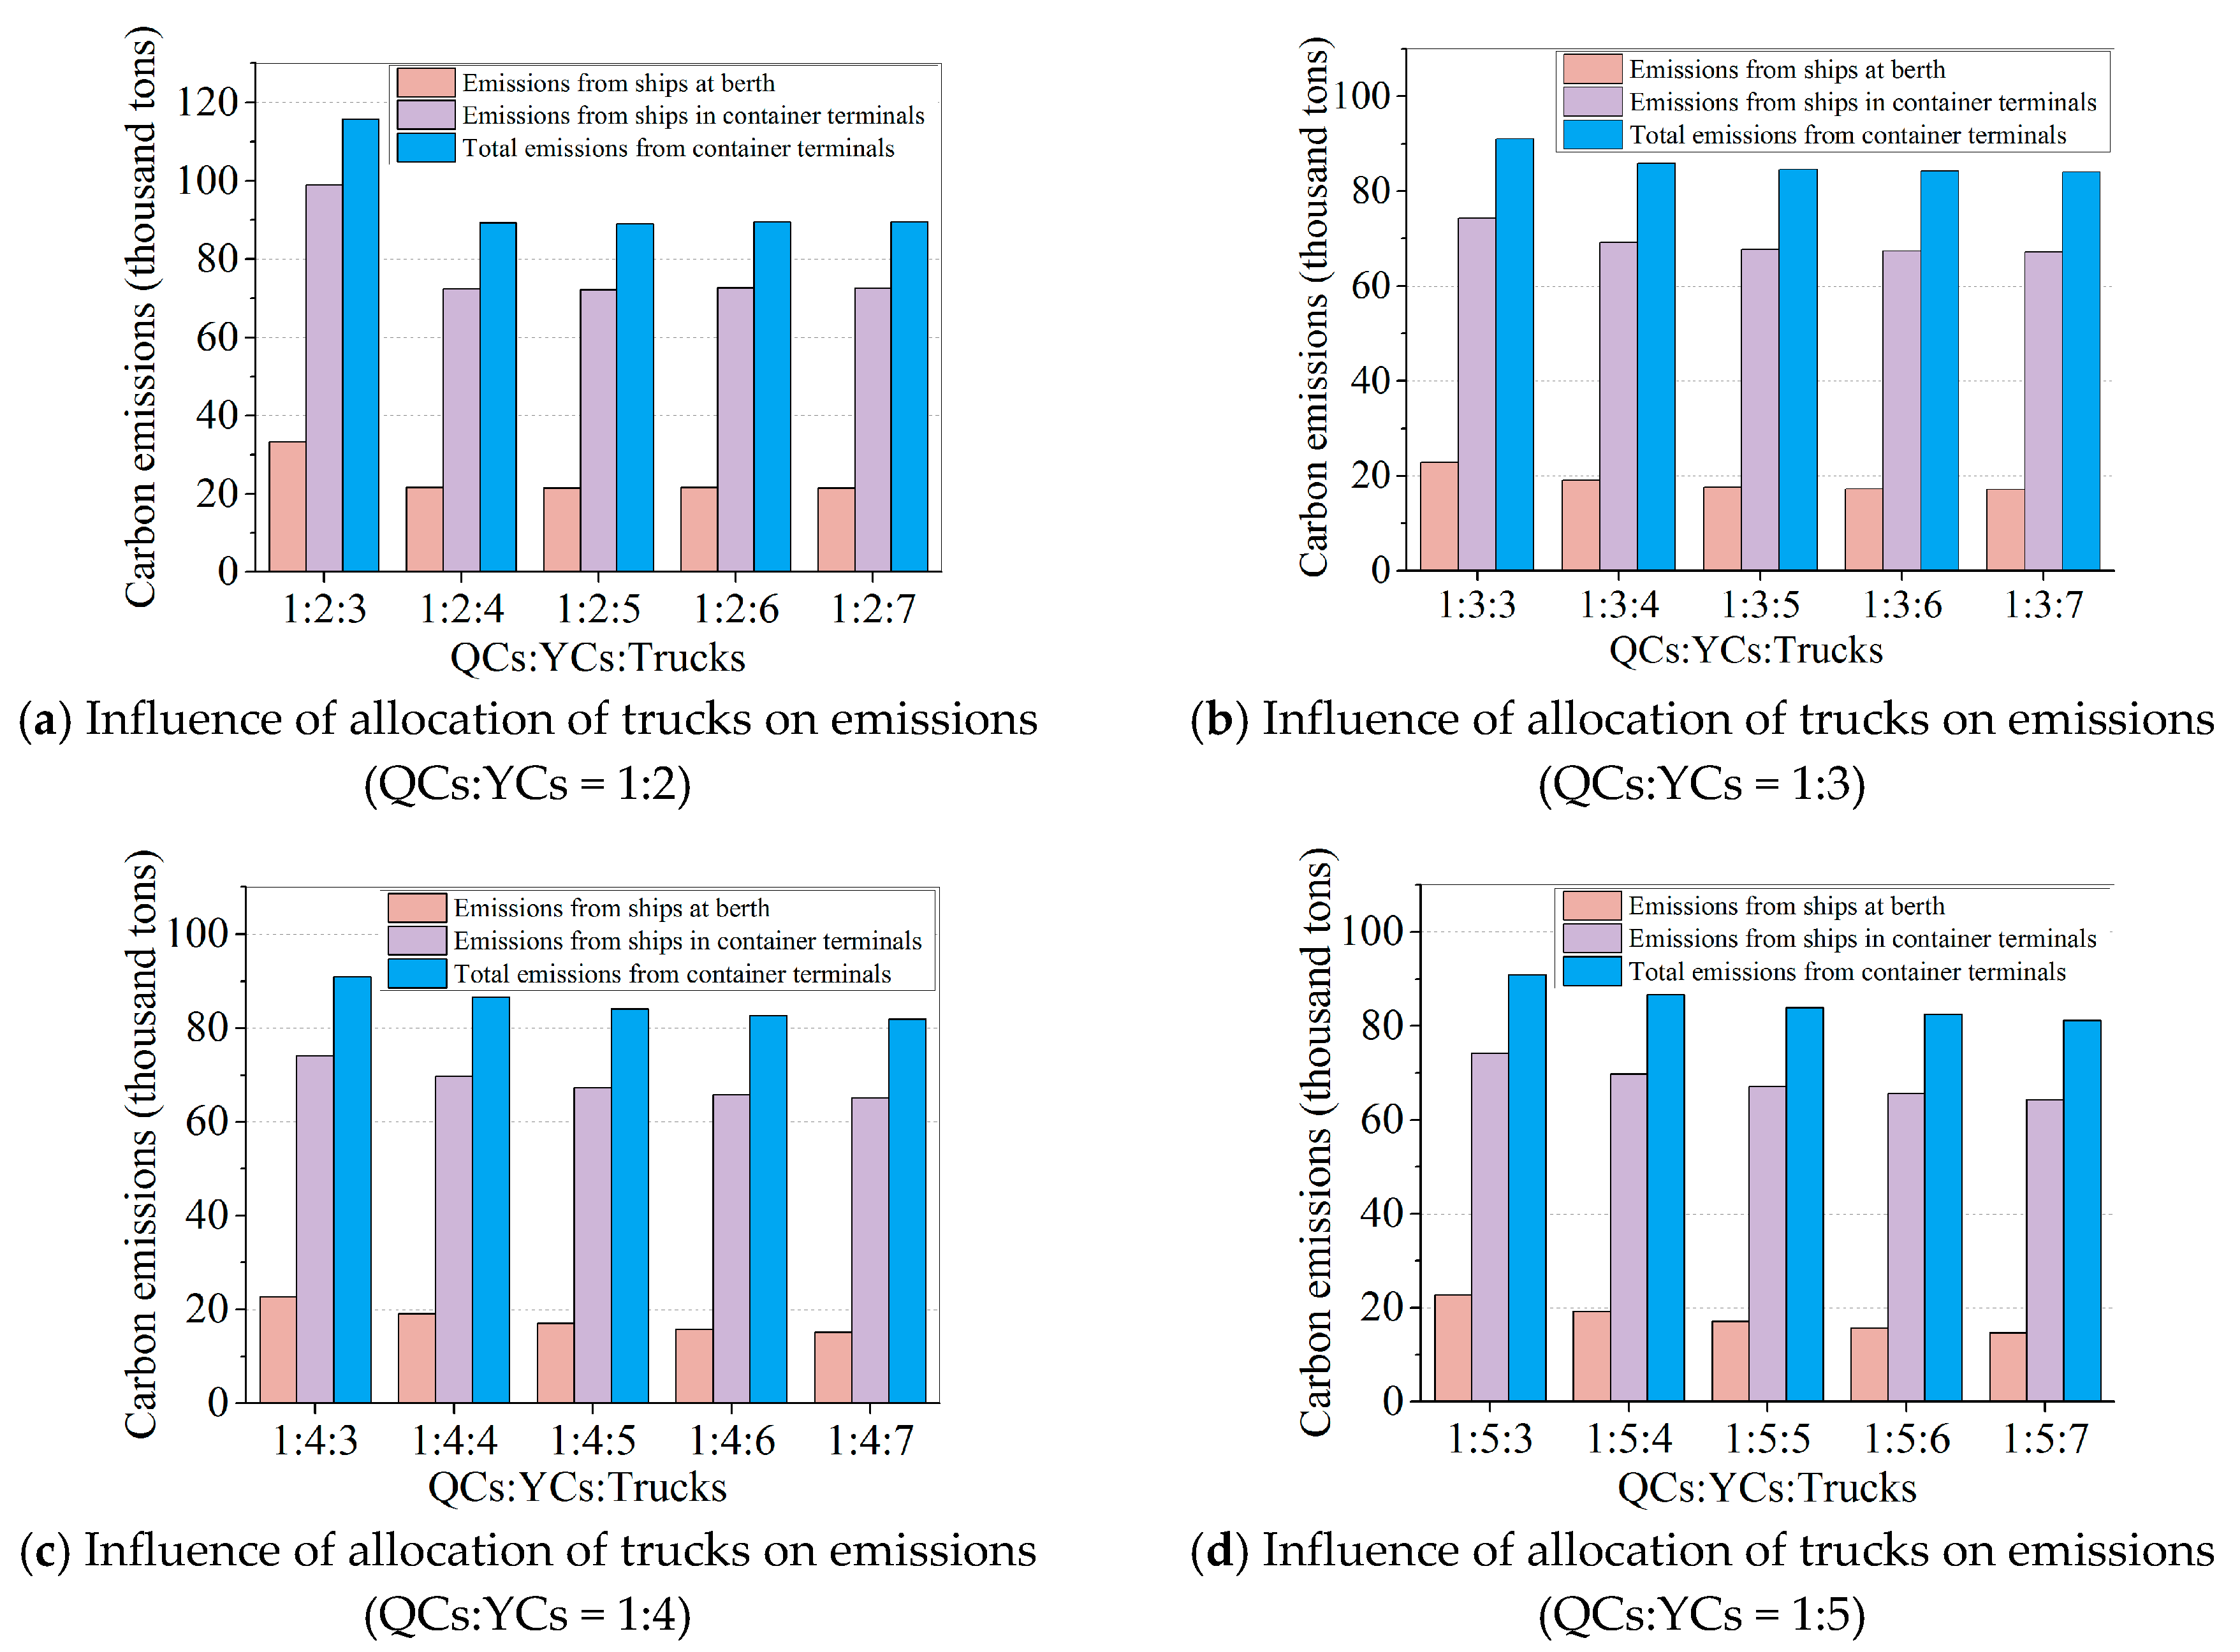
In order to analyze the influence of the allocation of trucks on carbon emissions in container terminals, several simulation experiments are designed, and the results are shown in Figure 12. The horizontal ordinate in Figure 8 is the ratio of the number of quay cranes (QCs) to that of yard cranes (YCs) and trucks (QCs:YCs:Trucks).
Figure 12 shows how the emissions from ships at the berth or in container terminals and total emissions from container terminals change with the ratio.
It can be seen from Figure 12a that when the ratio of the number of quay cranes to that of yard cranes (QCs:YCs) is 1:2, improving the ratio QCs:YCs:Trucks from 1:2:3 to 1:2:4 can reduce emissions of ships at the berth by 35.3%, emissions of ships in container terminals by 26.7%, and total emissions in container terminals by 22.8%. At this time, it reveals that an increased number of trucks is an effective way to reduce carbon emissions. However, when the number of trucks continues increasing, it has absolutely no impact on carbon emissions. For Figure 12b–d, there is the same varying trend with the changing of the ratio QCs:YCs:Trucks. The emissions firstly decrease greatly, and after a certain degree, the emissions decrease slightly.
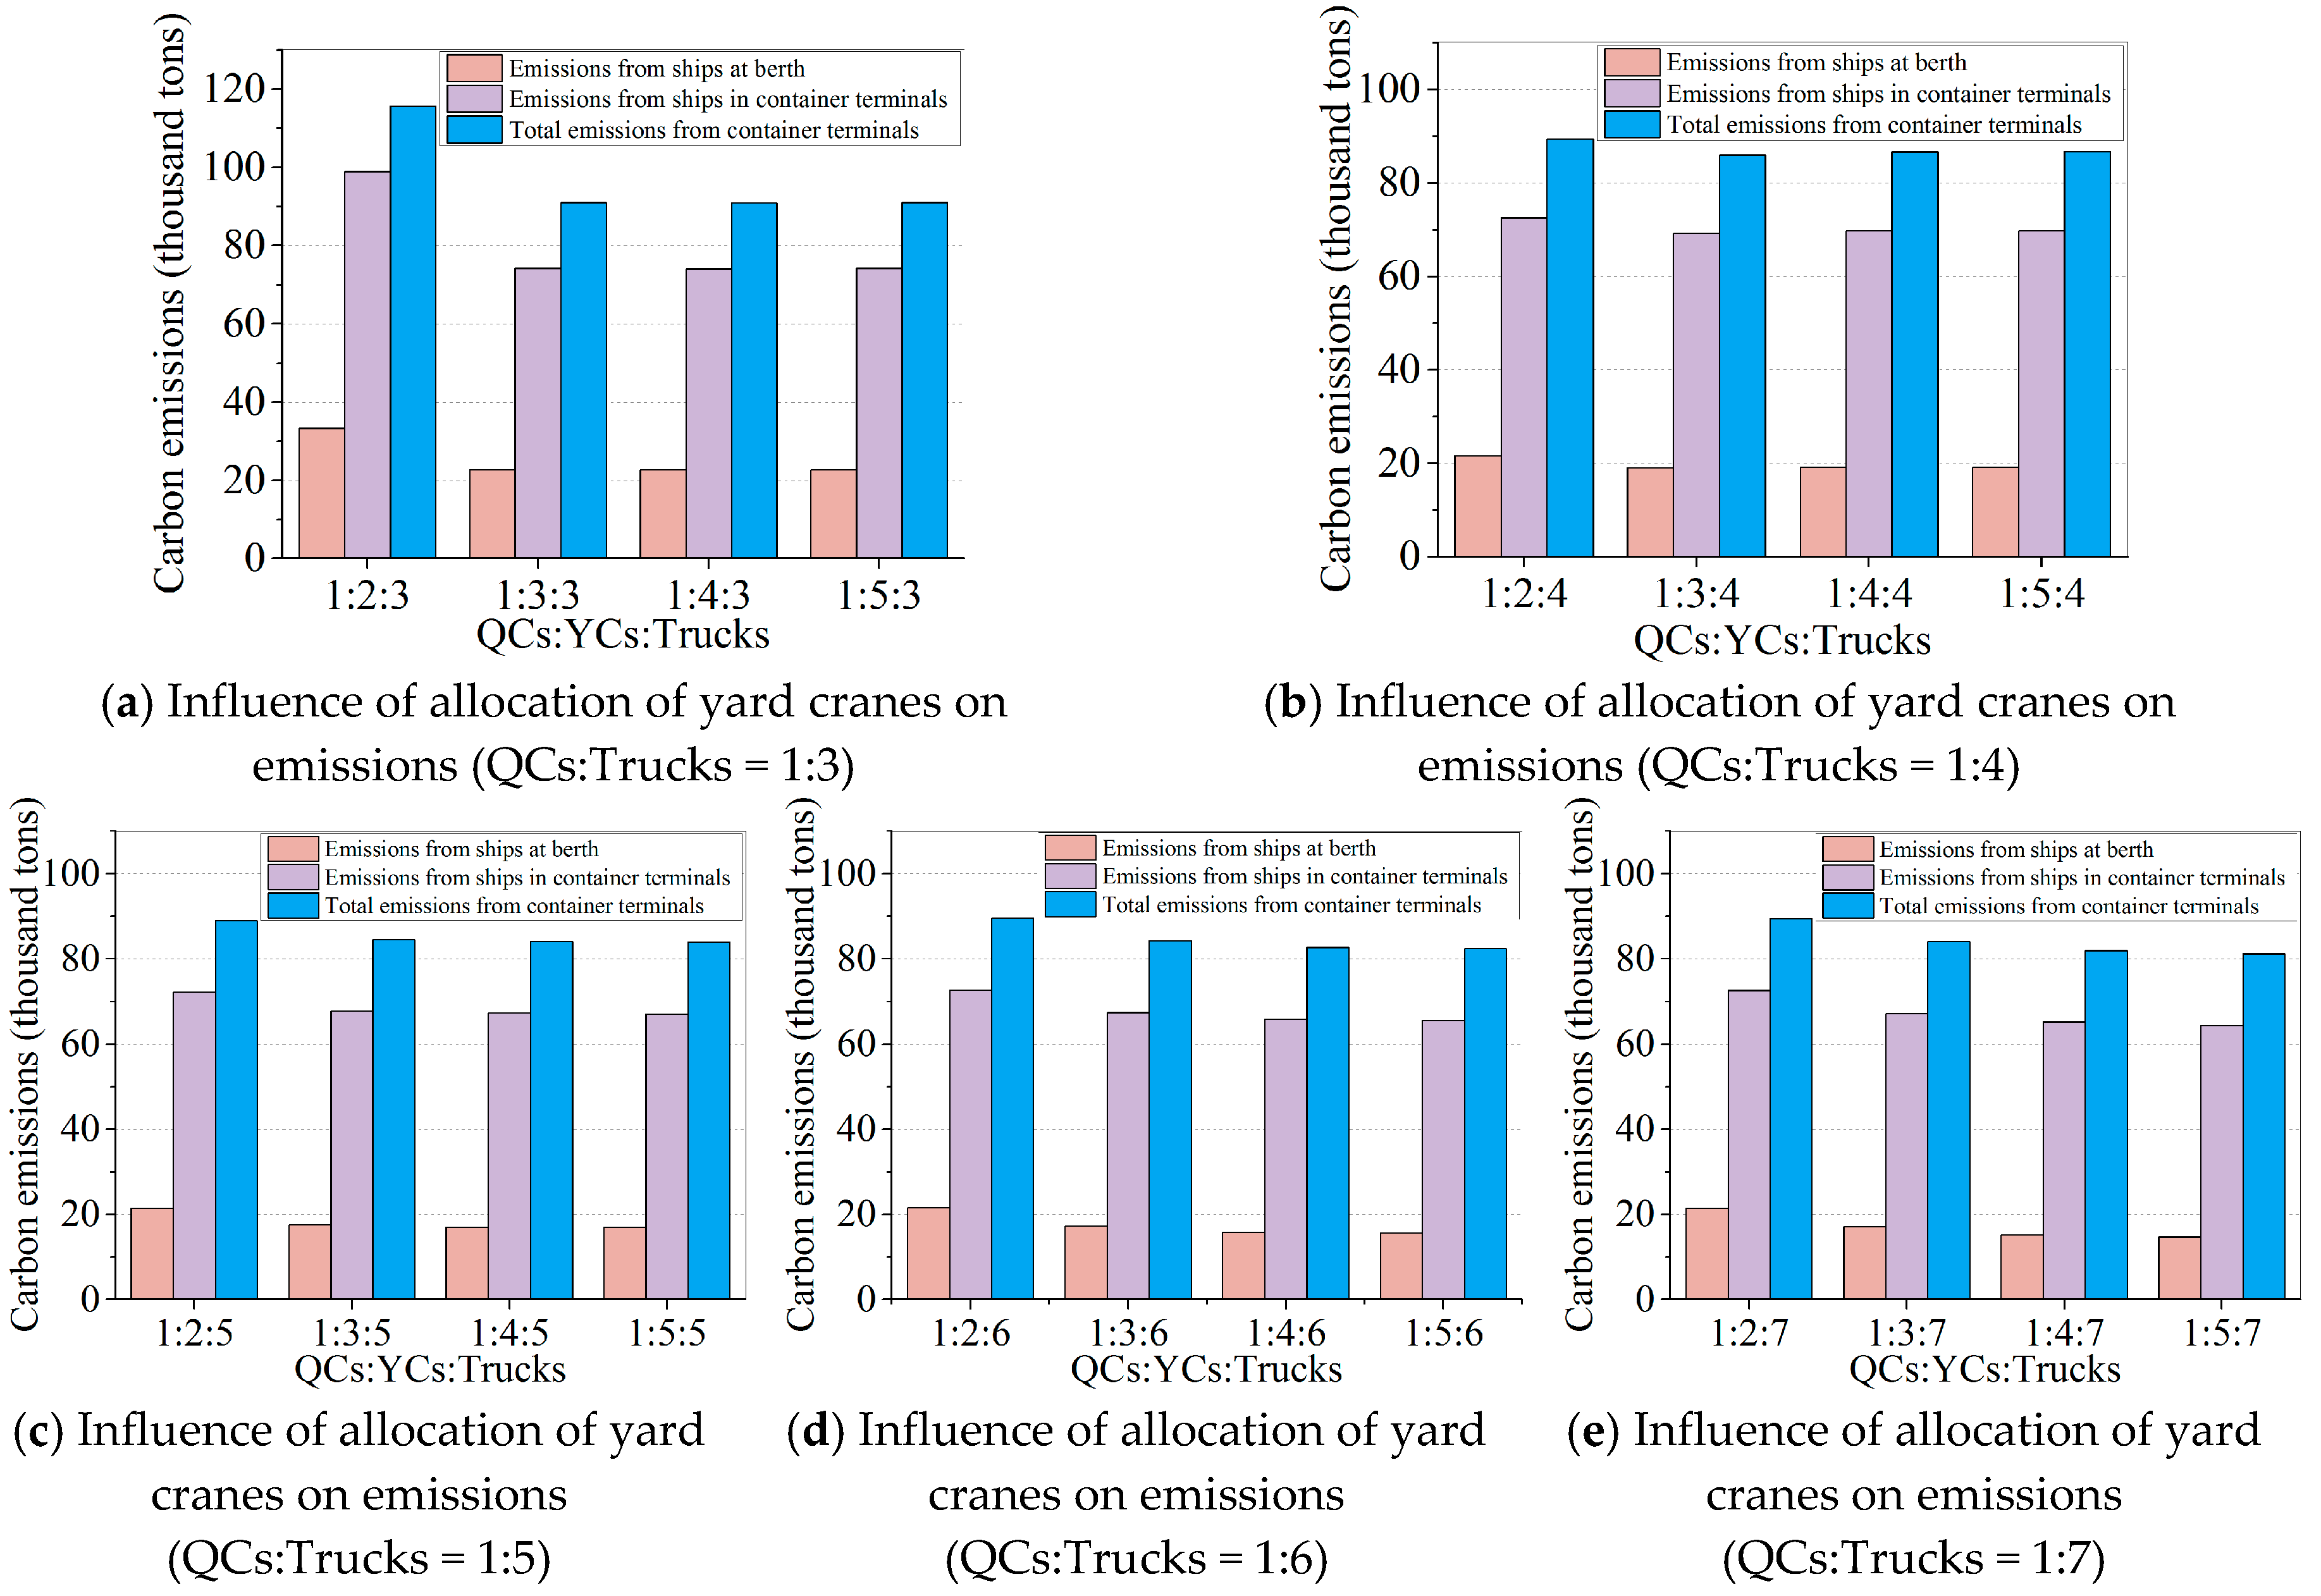
3.2.2. Impact of Allocation of Yard Cranes
In order to analyze the influence of the allocation of yard cranes on carbon emissions in container terminals, several simulation experiments are designed and the results are shown in Figure 13.
It can be seen from Figure 13a that when the ratio QCs:Trucks is 1:3, improving the ratio QCs:YCs:Trucks from 1:2:3 to 1:3:3 can obtain a 31.7% reduction in emissions of ships at the berth, 25.0% reduction in total emissions from ships, and 21.3% reduction in total emissions in container terminals. Increasing the number of yard cranes can obviously reduce carbon emissions, but when the number continues to rise, the emissions are decreased slightly.
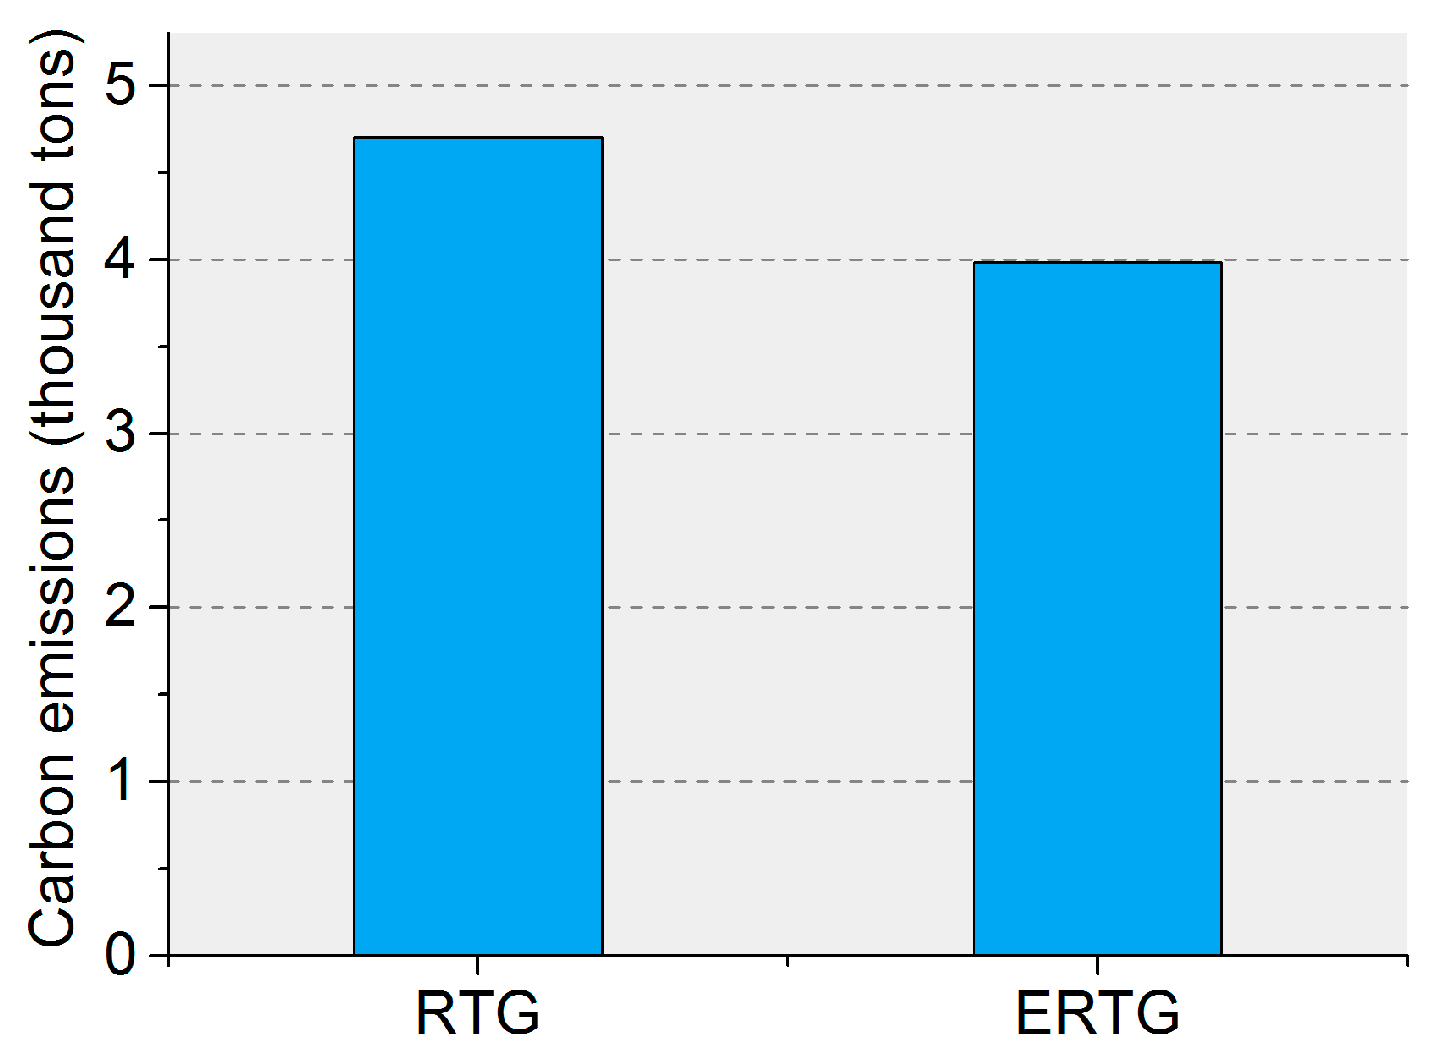
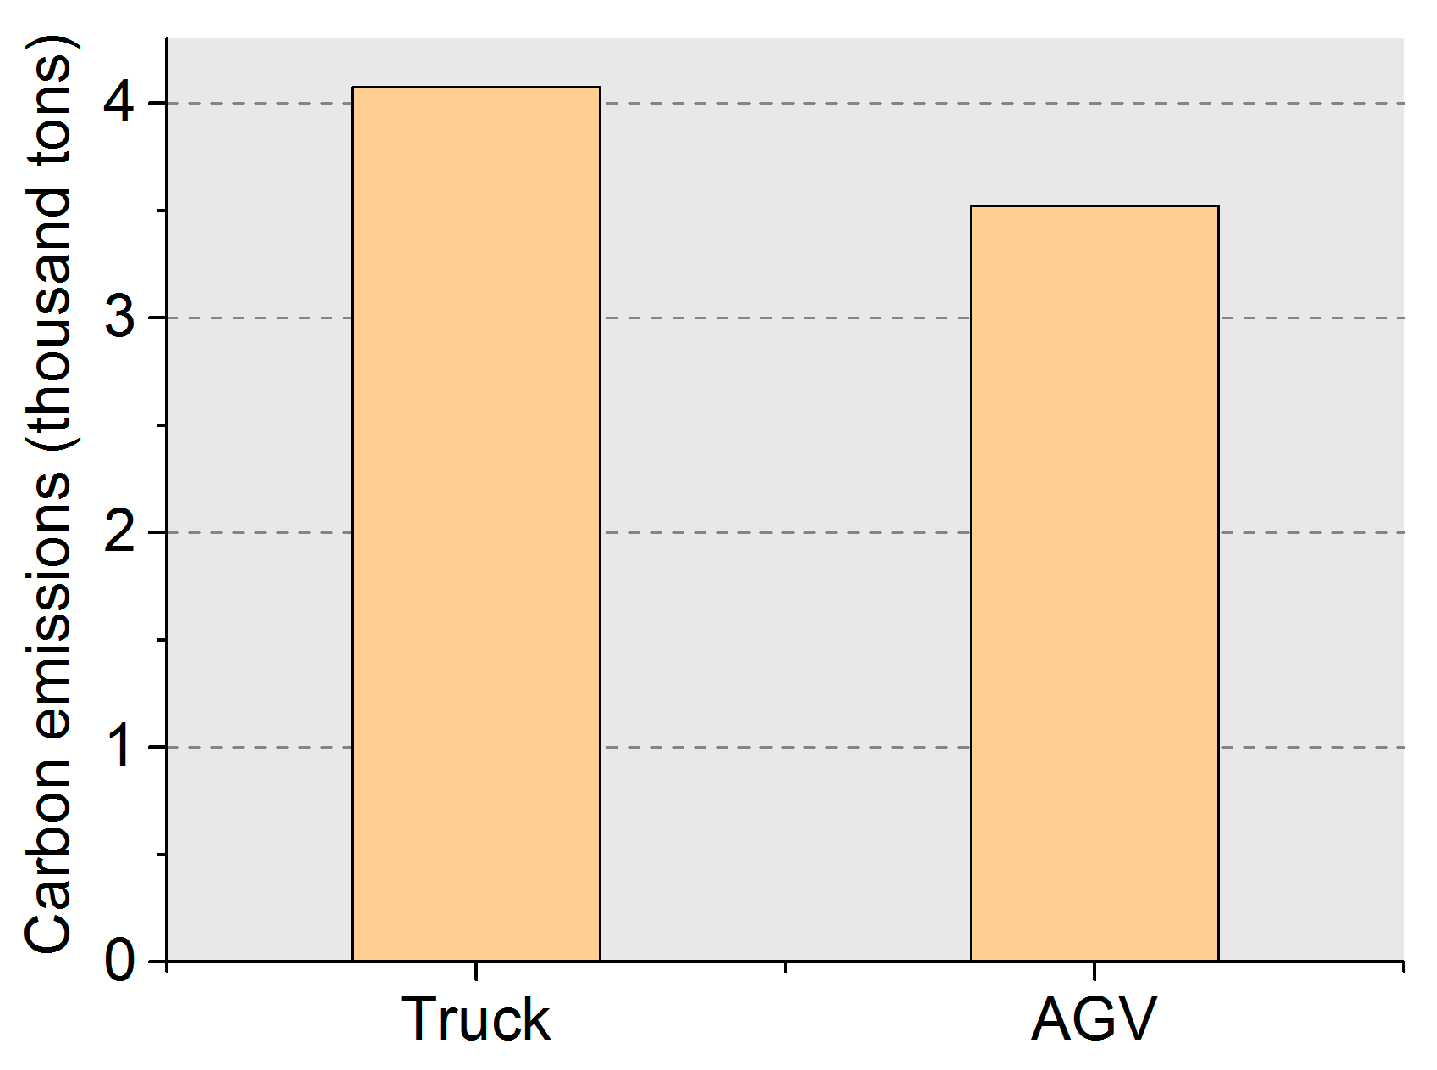
3.2.3. Impact of Energy Replacement for Yard Cranes and Trucks
A series of simulation experiments are designed to analyze the impact of energy replacement for yard cranes and trucks on carbon emissions, and the results are shown in Figure 14 and Figure 15.
Compared with RTGs using diesel, the use of ERTGs can help reduce carbon emissions by 15.3%. Figure 15 shows that, without considering external trucks, the use of AGVs can reduce carbon emissions by 13.6% inside container terminals compared with trucks using diesel.
Although port facilities with electric driven trucks changed from fuel driven trucks significantly reduce the carbon emissions, they do not contribute much to the reduction of total carbon emissions, owing to the small proportion of emissions from port facilities in the total emissions of container terminals.
4. Conclusions and Discussion
The main contribution of this paper is to quantify the impact of the allocation of facilities, including the number of facilities and the fuels adopted by facilities, on carbon emissions. In order to deal with the complex queuing network of container terminals, a simulation model is established with the changing of the number of and the fuel adopted by facilities as inputs. Various simulation experiments based on a container terminal in Algeria are designed and carried out. Finally, the carbon emissions from facilities and ships at the berth and inside container terminals, and the total carbon emissions inside container terminals, are obtained and analyzed after running the simulation model 100 times.
- (1)
- The emissions from quay cranes, yard cranes, or trucks are only a small fraction of the total emissions of container terminals, which are no more than 10%. However, the reasonable allocation of facilities can help reduce carbon emissions from ships, thereby the total emissions can be reduced.
- (2)
- Improving the ratio QCs:YCs:Trucks from 1:2:3 to 1:2:4 can reduce the emissions of ships at the berth by 35.3%, emissions of ships in container terminals by 26.7%, and total emissions in container terminals by 22.8%. However, when the number of trucks continues increasing, it has absolutely no impact on carbon emissions.
- (3)
- Improving the ratio QCs:YCs:Trucks from 1:2:3 to 1:3:3 can obtain a 31.7% reduction in emissions of ships at the berth, 25.0% reduction in total emissions from ships, and 21.3% reduction in total emissions in container terminals. Increasing the number of yard cranes can obviously reduce carbon emissions, but when the number continues rising, the emissions are decreased very slightly.
- (4)
- The use of ERTGs and AGVs can reduce carbon emissions by about 14%. However, it does not contribute much to the reduction of total carbon emissions owing to the small proportion of emissions from port facilities in the total emissions of container terminals.
The results obtained and proposed method can be applied to build a green container terminal, which can also be used for similar problems. However, this paper only focuses on the impact on carbon emissions without considering the cost. In real projects, the cost of facilities cannot be ignored. Besides, for trucks travelling inside container terminals, a microscopic simulation model needs to be established to simulate the travelling behavior and congestion status, which should be solved in future studies. Furthermore, future study should focus on the optimal allocation of facilities in ports using the simulation optimization method.
Author Contributions
Methodology: K.L. and Q.T.; Writing-Original Draft Preparation: Y.P. and X.L.; Writing-Review and Editing: W.W.
Funding
This research was funded by the National Natural Science Foundation of China grant number (No. 51709037 and 51779037)
Acknowledgments
We acknowledge the Research Centre for Port Development at Dalian University of Technology for devices.
Conflicts of Interest
The authors declare no conflict of interest.
References
- Inventory of Air Emissions for Calendar Year. 2016. Available online: https://www.portoflosangeles.org/pdf/2016_Air_Emissions_Inventory.pdf (accessed on 31 July 2017).
- Peng, Y.; Wang, W.Y.; Song, X.Q.; Zhang, Q. Optimal allocation of resources for yard crane network management to minimize carbon dioxide emissions. J. Clean. Prod. 2016, 131, 649–658. [Google Scholar] [CrossRef]
- Villalba, G.; Gemechu, E.D. Estimating GHG emissions of marine ports-the case of Barcelona. Energy Policy 2011, 39, 1363–1368. [Google Scholar] [CrossRef]
- Styhre, L.; Winnes, H.; Black, J.; Lee, J.; Le-Griffin, H. Greenhouse gas emissions from ships in ports—Case studies in four continents. Trans. Res. Part D 2017, 54, 212–224. [Google Scholar] [CrossRef]
- Schinas, O.; Butler, M. Feasibility and commercial considerations of LNG-fueled ships. Ocean Eng. 2016, 122, 84–96. [Google Scholar] [CrossRef]
- Chang, C.C.; Jhang, C.W. Reducing speed and fuel transfer of the Green Flag Incentive Program in Kaohsiung Port Taiwan. Trans. Res. Part D 2016, 46, 1–10. [Google Scholar] [CrossRef]
- He, J.L.; Mi, W.J.; Chang, D.F.; Yan, W. An investigation into berth allocation and quay crane assignment based on hybrid parallel genetic algorithm. In Proceedings of the 2009 International Conference on Artificial Intelligence and Computational Intelligence, Shanghai, China, 7–8 November 2009; IEEE: Piscataway, NJ, USA, 2009; pp. 48–53. [Google Scholar]
- Yu, S.; Wang, S.; Zhen, L. Quay crane scheduling problem with considering tidal impact and fuel consumption. Flex. Serv. Manuf. J. 2017, 29, 345–368. [Google Scholar] [CrossRef]
- Wang, W.Y.; Peng, Y.; Tang, G.L.; Song, X.Q. Influence of Carbon Emission Constraint on Container Quay Crane Allocation. Adv. Mater. Res. 2013, 807–809, 936–940. [Google Scholar] [CrossRef]
- Chen, G.; Govindanc, K.; Golias, M.M. Reducing truck emissions at container terminals in a low carbon economy: Proposal of a queueing-based bi-objective model for optimizing truck arrival pattern. Trans. Res. Part E 2013, 55, 3–22. [Google Scholar] [CrossRef]
- Sha, M.; Zhang, T.; Lan, Y.; Zhou, X.; Qin, T.B.; Yu, D.Y.; Chen, K. Scheduling optimization of yard cranes with minimal energy consumption at container terminals. Comput. Ind. Eng. 2017, 113, 704–713. [Google Scholar] [CrossRef]
- Yang, L.; Cai, Y.J.; Zhong, X.Z.; Shi, Y.Q.; Zhang, Z.Y. A Carbon Emission Evaluation for an Integrated Logistics System—A Case Study of the Port of Shenzhen. Sustainability 2017, 9, 462. [Google Scholar] [CrossRef]
- He, J.; Huang, Y.; Yan, W. Integrated internal truck, yard crane and quay crane scheduling in a container terminal considering energy consumption. Exp. Syst. Appl. 2015, 42, 2464–2487. [Google Scholar] [CrossRef]
- Von Westarp, A.G.; Schinas, O. A fuzzy approach for container positioning considering sustainable profit optimization. Trans. Res. Part E 2016, 92, 56–66. [Google Scholar] [CrossRef]
- Tavakkoli-Moghaddam, R.; Makui, A.; Salahi, S.; Bazzazi, M.; Taheri, F. An efficient algorithm for solving a new mathematical model for a quay crane scheduling problem in container ports. Comput. Ind. Eng. 2009, 56, 241–248. [Google Scholar] [CrossRef]
- Diabat, A.; Theodorou, E. An integrated quay crane assignment and scheduling problem. Comput. Ind. Eng. 2014, 73, 115–123. [Google Scholar] [CrossRef]
- Fu, Y.; Diabat, A.; Tsai, I.T. A multi-vessel quay crane assignment and scheduling problem: Formulation and heuristic solution approach. Expert Syst. Appl. 2014, 41, 6959–6965. [Google Scholar] [CrossRef]
- Kaysi, I.A.; Maddah, B.; Nehme, N.; Mneimneh, F.M. An integrated model for resource allocation and scheduling in a transshipment container terminal. Transp. Lett. Int. J. Trans. Res. 2012, 4, 143–152. [Google Scholar] [CrossRef]
- Boysen, N.; Fliedner, M. Determining crane areas in intermodal transshipment yards: The yard partition problem. Eur. J. Oper. Res. 2010, 204, 336–342. [Google Scholar] [CrossRef]
- Jiang, X.; Jin, J. A branch-and-price method for integrated yard crane deployment and container allocation in transshipment yards. Trans. Res. Part B 2017, 98, 62–75. [Google Scholar] [CrossRef]
- He, J.L.; Zhang, W.M.; Huang, Y.F.; Yan, W. A simulation optimization method for internal trucks sharing assignment among multiple container terminals. Adv. Eng. Inf. 2013, 27, 598–614. [Google Scholar] [CrossRef]
- Chen, L.; Langevin, A.; Lu, Z. Integrated scheduling of crane handling and truck transportation in a maritime container terminal. Eur. J. Oper. Res. 2013, 225, 142–152. [Google Scholar] [CrossRef]
- Tang, L.; Zhao, J.; Liu, J. Modeling and solution of the joint quay crane and truck scheduling problem. Eur. J. Oper. Res. 2014, 236, 978–990. [Google Scholar] [CrossRef]
- Legato, P.; Gulli, D.; Trunfio, R. The quay crane deployment problem at a maritime container terminal. In Proceedings of the 22nd European Conference on Modelling and Simulation (ECMS), University of Cyprus, Nicosia, Cyprus, 3–6 June 2008. [Google Scholar]
- Esmemr, S.; Ceti, I.B.; Tuna, O. A Simulation for Optimum Terminal Truck Number in a Turkish Port Based on Lean and Green Concept. Asian J. Shipp. Logist. 2010, 26, 277–296. [Google Scholar] [CrossRef]
- Ilati, G.; Sheikholeslami, A.; Hassannayebi, E. A Simulation-Based Optimization Approach for Integrated Port Resource Allocation Problem. PROMET Traffic Trans. 2014, 26, 243–255. [Google Scholar] [CrossRef]
- He, J.; Huang, Y.; Yan, W. Yard crane scheduling in a container terminal for the trade-off between efficiency and energy consumption. Adv. Eng. Inf. 2015, 29, 59–75. [Google Scholar] [CrossRef]
- Ma, H.; Hong, Y.; Du, Y. The Scheduling of quay cranes and truck in Container Port-A Simulation-based method. In Proceedings of the 2015 International Conference on Applied Science and Engineering Innovation (ASEI), Jinan, China, 30–31 August 2015; pp. 842–847. [Google Scholar]
- Al-Dhaheri, N.; Jebali, A.; Diabat, A. A simulation-based Genetic Algorithm approach for the quay crane scheduling under uncertainty. Simul. Mod. Pract. Theory 2016, 66, 122–138. [Google Scholar] [CrossRef]
- Ministry of Transport of China. Design Code of Container Terminal for Sea Port, JTS 165-4-2011; China Communication Press: Beijing, China, 2011.
- Izadiniaa, N.; Eshghia, K. A robust mathematical model and ACO solution for multi-floor discrete layout problem with uncertain locations and demands. Comput. Ind. Eng. 2016, 96, 237–248. [Google Scholar] [CrossRef]
- Mohammadi, M.; Tavakkoli-Moghaddam, R.; Siadat, A.; Dantan, J.Y. Design of a reliable logistics network with hub disruption under uncertainty. Appl. Math. Model. 2016, 40, 5621–5642. [Google Scholar] [CrossRef]
- Karamyar, F.; Sadeghi, J.; Yazdi, M.M. A Benders decomposition for the location-allocation and scheduling model in a healthcare system regarding robust optimization. Neural Comput. Appl. 2018, 29, 873–886. [Google Scholar] [CrossRef]
- ISO. Specification with Guidance at the Organization Level for Quantification and Reporting of Greenhouse Gas Emission and Removal; ISO: Geneva, Switzerland, 2006. [Google Scholar]
- IPCC Guidelines for National Greenhouse Gas Inventories. 2006. Available online: http://www.ipcc-nggip.iges.or.jp/public/2006gl/ (accessed on 28 April 2006).
- Corbett, J.J.; Wang, H.; Winebrake, J.J. The effectiveness and costs of speed reductions on emissions from international shipping. Trans. Res. Part D Trans. Environ. 2009, 14, 593–598. [Google Scholar] [CrossRef]
- Calculation of Ship Power Load. Available online: https://wenku.baidu.com/view/e548c101ed630b1c59eeb5d5.html (accessed on 4 November 2013).
- Peng, Y. The Research on the Optimal Allocation of Low-Carbon Seaport Resources under Uncertainties. Ph.D. Thesis, Dalian University of Technology, Dalian, China, 2016. (In Chinese). [Google Scholar]
Figure 1.
General Layout of a Container Terminal.

Figure 2.
Queuing Network of Ships at the Quayside.

Figure 3.
Queuing Network of Internal Trucks at Container Terminals.

Figure 4.
Ship arriving and berthing logic model.

Figure 5.
Ship handling operation sub-model.

Figure 6.
Ship departing sub-model.

Figure 7.
Ship-arriving simulation sub-model.

Figure 8.
Ship berthing and departing simulation model.

Figure 9.
Handling operation sub-model.

Figure 10.
Carbon emissions under different simulation runs.

Figure 11.
Proportion of carbon emissions from facilities.

Figure 12.
Influence of allocation of trucks on carbon emissions.

Figure 13.
Influence of allocation of yard cranes on carbon emissions.

Figure 14.
Impact of energy replacement for RTGs.

Figure 15.
Impact of energy replacement for trucks.


Table 1.
Type combination of ships at the Container Port area.
| Tonnage of Ships DWT (Thousand Tons) | Proportion (%) | Cumulative Frequency (%) | Average Handling Quantity (TEU) | The Power of Main Engines (kw) | The Power of Auxiliary Engines (kw) |
|---|---|---|---|---|---|
| 20 | 34 | 34 | 875 | 11,769 | 700 |
| 30 | 25 | 59 | 1000 | 18,411 | 1260 |
| 50 | 17 | 76 | 1800 | 48,617 | 1960 |
| 70 | 11 | 87 | 3400 | 51,500 | 2320 |
| 100 | 10 | 97 | 4800 | 58,344 | 2760 |
| 120 | 1 | 98 | 6000 | 72,240 | 3320 |
| 150 | 1 | 99 | 7950 | 72,360 | 3850 |
| 200 | 1 | 100 | 10,050 | 72,360 | 4000 |
Table 2.
Parameters of different berths in container terminals.
| Berth Number | Berth Tonnages (Ten Thousand Tons) | Tonnage of Berthed Ships DWT (Ten Thousand Tonnage) | The Number of Quay Cranes per Berth |
|---|---|---|---|
| 1 | 5 | 2,3,5 | 3 |
| 2 | 5 | 2,3,5 | 4 |
| 3 | 7 | 2,3,5,7 | 4 |
| 4 | 7 | 2,3,5,7 | 4 |
| 5 | 7 | 2,3,5,7 | 4 |
| 6 | 10 | 3,5,7,10 | 5 |
| 7 | 16.5 | 5,7,10,15 | 5 |
| 8 | 20 | 7,10,15,20 | 5 |
| 9 | 2 | 2 | 2 |
| 10 | 2 | 2 | 2 |
© 2018 by the authors. Licensee MDPI, Basel, Switzerland. This article is an open access article distributed under the terms and conditions of the Creative Commons Attribution (CC BY) license (http://creativecommons.org/licenses/by/4.0/).
Share and Cite
MDPI and ACS Style
Peng, Y.; Wang, W.; Liu, K.; Li, X.; Tian, Q. The Impact of the Allocation of Facilities on Reducing Carbon Emissions from a Green Container Terminal Perspective. Sustainability 2018, 10, 1813. https://doi.org/10.3390/su10061813
AMA Style
Peng Y, Wang W, Liu K, Li X, Tian Q. The Impact of the Allocation of Facilities on Reducing Carbon Emissions from a Green Container Terminal Perspective. Sustainability. 2018; 10(6):1813. https://doi.org/10.3390/su10061813
Chicago/Turabian StylePeng, Yun, Wenyuan Wang, Ke Liu, Xiangda Li, and Qi Tian. 2018. "The Impact of the Allocation of Facilities on Reducing Carbon Emissions from a Green Container Terminal Perspective" Sustainability 10, no. 6: 1813. https://doi.org/10.3390/su10061813
Note that from the first issue of 2016, this journal uses article numbers instead of page numbers. See further details here.