Article

Impact of Asynchronous Renewable Generation Infeed on Grid Frequency: Analysis Based on Synchrophasor Measurements

1
Institute of Telecommunications, TU Wien, Gusshausstrasse 25, 1040 Vienna, Austria
2
Institute of Energy Systems and Electrical Drives, TU Wien, Gusshausstrasse 25, 1040 Vienna, Austria
*
Author to whom correspondence should be addressed.
Sustainability 2018, 10(5), 1605; https://doi.org/10.3390/su10051605
Submission received: 16 April 2018 / Revised: 11 May 2018 / Accepted: 15 May 2018 / Published: 17 May 2018
(This article belongs to the Collection Power System and Sustainability)

Abstract

:
The increasing power in-feed of Non-Synchronous Renewable Energy Sources (NS-RES) in the grid has raised concerns about the frequency stability. The volatile RES power output and absence of inertia in many types of NS-RES affect the balance between power consumption and production. Therefore, the dynamics of the power grid frequency become more complex. Extreme grid frequency deviations and fast variations can lead to partitioning and load shedding in the case of under-frequency. In the case of over-frequency, it can lead to overloading, voltage collapse and blackouts. The Rate of Change of Frequency (RoCoF) reflects an aspect of the stability status of the grid and therefore its analysis with regard to Non-Synchronous Instant Penetration (NSIP) is of great importance. In this work, two months of high-resolution frequency synchrophasor measurements during 18 January 2018–18 March 2018 recorded in Austria were analyzed to investigate the impact of NS-RES on the frequency. The correlation of RoCoF with the NSIP in Austria and Germany and with the frequency deviation were examined. It was observed that with a maximum NSIP share up to 74 % of the total power generation in these two countries, there was no critical increase of RoCoF or abnormal frequency deviation in the power grid.

1. Introduction

Conventional synchronous generators are usually electromechanically coupled to the power grid. Therefore, they are rotating with synchronous grid frequency. The sum of their rotating masses (e.g., generator and turbine rotor) contribute to the system inertia [1]. Unlike conventional generators, which inherently react to frequency changes in the system due to their inertia, non-synchronous renewable energy generators, such as Photovoltaic generators and many wind converters, provide no inertia. Moreover, their power output can be very volatile. Every imbalance leads to a deviation of the grid frequency from the nominal one, which is 50 Hz in European Continental Synchronous Area (ECSA). With the targets of the European commission for 20 % RES share until 2020 and up to 27 % until 2030 [2], balancing power generation and demand therefore becomes more and more complex and even more time critical. RoCoF is the time derivative of the grid frequency, and it is inversely proportional to system inertia for a given imbalance of generation and demand. Low grid inertia due to high NS-RES penetration can lead to steep RoCoF hence system instability [3]. Given this new complexity of the grid’s dynamics and the increased need for frequency control, RoCoF becomes a very important indicator of the grid stability.
In this paper, we investigate the relationship between NSIP and frequency based on high-resolution measurements and show that no critical state was reached. The rest of this work is organized as follows: Section 2 summarizes related work; Section 3 describes the data collection, preprocessing and first evaluation; Section 4 presents the results and discussion regarding frequency variations correlated to generation and consumption data of Austria and Germany; and the conclusions are drawn in Section 5 as well as the challenges are pointed out.

2. Related Work

The impact of NS-RES penetration on the frequency stability of the grid is tackled in numerous studies. Specifically for continental Europe, Wang et al. [4] conducted frequency stability simulation studies over one year and showed that it is not possible to define a single critical threshold for RES share, since the behavior of the European Interconnected System (EIS) is dynamic and thus changing over time. Moreover, the increasing NS-RES penetration has a lower impact on ECSA than on small isolated power systems. However, during critical periods such as of low demand and high RES share (e.g., windy nights in the summer), the frequency can drop below the value of 49 Hz, triggering automatic load shedding in the system.
A study on the Spanish power grid considered a maximum RoCoF limit of 0.1 Hz s 1 based on the European Network of Transmission System Operators for electricity (ENTSO-E) reference incident, and calculated the maximum wind power generation penetration that can be achieved without violating this limit [5]. Fernandez-Bernal et al. found that a share of wind generation up to 64% for a load valley scenario, and 70.7% for a load peak scenario can be reached without exceeding the RoCoF limitation, while a share up to 82% is possible for obtaining the necessary primary reserve.
An attempt to define the limits of NS-RES penetration with regard to frequency stability of the Australian grid was presented in Ahmadyar et al. [6] by simulating time series in various scenarios. It was concluded that, rather than a single critical NSIP, a critical range of NSIP has to be defined. For the worst case scenarios, it was shown that, at a critical RoCoF of 0.5 Hz s 1 , the NSIP would not exceed 60–67%, with the latter increasing up to 84 % at a critical RoCoF of 1 Hz s 1 .
Time series sampling methodology was employed in an earlier study Doherty et al. [7] to investigate the impact of wind generation on the Irish grid frequency stability, considering the maximum RoCoF and the minimum frequency value, the nadir. Various scenarios over a timespan of multiple years were examined, considering different types of wind turbines. It was concluded that a high level of wind generators, whose stored kinetic energy is not fully available to the system (e.g., Doubly Fed Induction Generators (DFIG)), can result in increased high RoCoF occurrences, including the limit of 0.4 Hz s 1 . Below this limit, conventional RoCoF protection relays would disconnect the generator. It was pointed out that increased penetration of wind turbines, which cannot provide any inertia, in combination with greater levels of High Voltage Direct Current (HVDC) interconnection, will be challenging for the system operators in terms of frequency control. In a more recent publication towards this finding, the Irish transmission system operation EirGrid has set a limit of 60 % to the System Non-Synchronous Penetration (SNSP) from wind generators for the year 2016 [8].
All the referred studies are based only on simulated data and scenarios. In contrast, our study was based on measurement data. It examined the impact of NSIP of photovoltaic and wind power generators in Germany and Austria on the frequency variations and RoCoF based on high-resolution frequency measurements and recorded power generation data. The period of the analysis was two months during 18 January 2018–18 March 2018. This period is of particular interest since it includes an event of generation and demand imbalance in southeast Europe. This led to an extended period of low frequency in the European continental synchronous power grid. The study utilized data mining methods including data preprocessing, outliers and deviation detection and visualization to discover patterns and correlations in large data sets consisting of NSIP and generation data. The derived observations were used to evaluate the current impact of NSIP on the frequency variations, even during periods of increased stress of the power grid, and thus support further studies on hypothetical/simulated scenarios of higher NSIP share in the power grid.

3. Data Acquisition and Preprocessing

In this case study, high resolution frequency measurements, as well as generation and load data of Germany and Austria were analyzed. The data were recorded in the period 18 January 2018–18 March 2018. The specific period is of particular interest, since a generation and load imbalance and therefore abnormal frequency deviation was recorded, caused by insufficient power generation in a southeast European country. The acquisition and preprocessing of the data are described in the next subsections.

3.1. Frequency Data

The frequency measurements for the stability analysis were recorded by a Phasor Measurement Unit (PMU) located at TU Wien, capable of delivering up to 50 measurements per second. The device accuracy for frequency measurements, specified from the manufacturer, is lower than 1 part per million ( 0.0001 % ). The measurement reporting rate of the PMU was set to 10 Hz, while the data export rate was set to 1 measurement per second, resulting in 5,184,001 measurement points for the period 18 January 2018–18 March 2018. Furthermore, according to the manufacturer, “The frequency measurements are averaged over one second prior to being displayed or made available for output” [9]. These comply with the ENTSO-E suggestions for frequency measurement requirements and usage [10].
Figure 1 depicts the distribution of the frequency measurements during the whole measurement period in Figure 1a and the frequency distribution on every individual day in Figure 1b. The average frequency in this time span is 49.997 Hz with a standard deviation of 0.0225 , and minimum and maximum values of 49.8417 Hz and 50.1309 Hz, respectively. On 45 of the 60 days, the average frequency per day was lower than 50 Hz (marked with red color in Figure 1b. This corresponds to 75 % of the days. This confirms the lack of power generation by the southeast European country Kosovo, according to ENTSO-E announcements in [11,12].
To analyze the impact of NSIP on the frequency stability, the RoCoF was calculated, as significant indicator of the grid stability. The RoCoF is the time derivative of the frequency of the power grid, hence it is calculated by the following equation [3]:
R o C o F = d f d t = lim Δ t 0 f t i f t i 1 Δ t f t i f t i 1 t i t i 1 ( Hz s 1 )
The approximation symbol is used in Equation (1) , as it is only correct for Δ t 0 . In this study, a time interval between measurements of 1 s has been applied, which should be short enough to properly reflect the system dynamics under larger imbalances as long as the inertia constant H of the ECSA is in the range of 5 s. Figure 2 depicts the RoCoF distribution for the specific period Figure 2a and for each individual day in Figure 2b. The resulting 60 curves are overlapping hence one cannot distinguish between them. The visual inspection of the distributions lead to the observation that the majority of the RoCoF values are concentrated around 0. Indeed, the average absolute RoCoF is 0.0013 Hz s 1 with standard deviation 0.0016 , and minimum and maximum values of 0.0409 Hz s 1 and 0.0427 Hz s 1 , respectively. Figure 3 depicts the average absolute RoCoF and average frequency per day. We observe that the variation of the averaged absolute RoCoF values is small, which reveals a stable European continental synchronous grid, despite the extended period of frequency deviation. The depicted course of average frequency confirms the extended low frequency situation in the ECSA because of the reduced generation. It also points out the frequency correction that was applied by the rest of European system operators as countermeasure. The increase of the average absolute RoCoF from 2 March 2018 onwards is discussed in the following sections.

3.2. NS-RES Generation Data

The NS-RES generation data, further referred to as NSIP, consist of PV and wind aggregate power in Austria and Germany and were acquired from the ENTSO-E database [13]. The generation of wind turbines on- and off-shore (the latter only in Germany) and Photovoltaic generators in both countries was examined during 18 January 2018–18 March 2018.
The resolution of the generation data is 15 min. The NSIP share is therefore calculated as well in 15-min resolution as follows:
N S I P = P t N S I P P t l o a d × 100 ( % )
where P t l o a d is the aggregate load in Germany and Austria and P t N S I P the instant power output of non-synchronous generators, both in 15 min resolution, also provided from the ENTSO-E database. Figure 4 depicts the top view of a three-dimensional plot of the average NSIP per hour and day, for Germany and Austria. The x- and y-axes represent the time of day and the date, respectively, while the color bar (z-axis) indicates the actual value of NSIP. One can observe the predominant PV power in-feed profile, which results to peak power in-feed (orange/yellow shading) mostly around noon. High NSIP values are also observed in the morning and evening hours, which are attributed to the wind generation power in-feed.
In the next section, the impact of NSIP on frequency deviation and stability is examined.

4. Results and Discussion

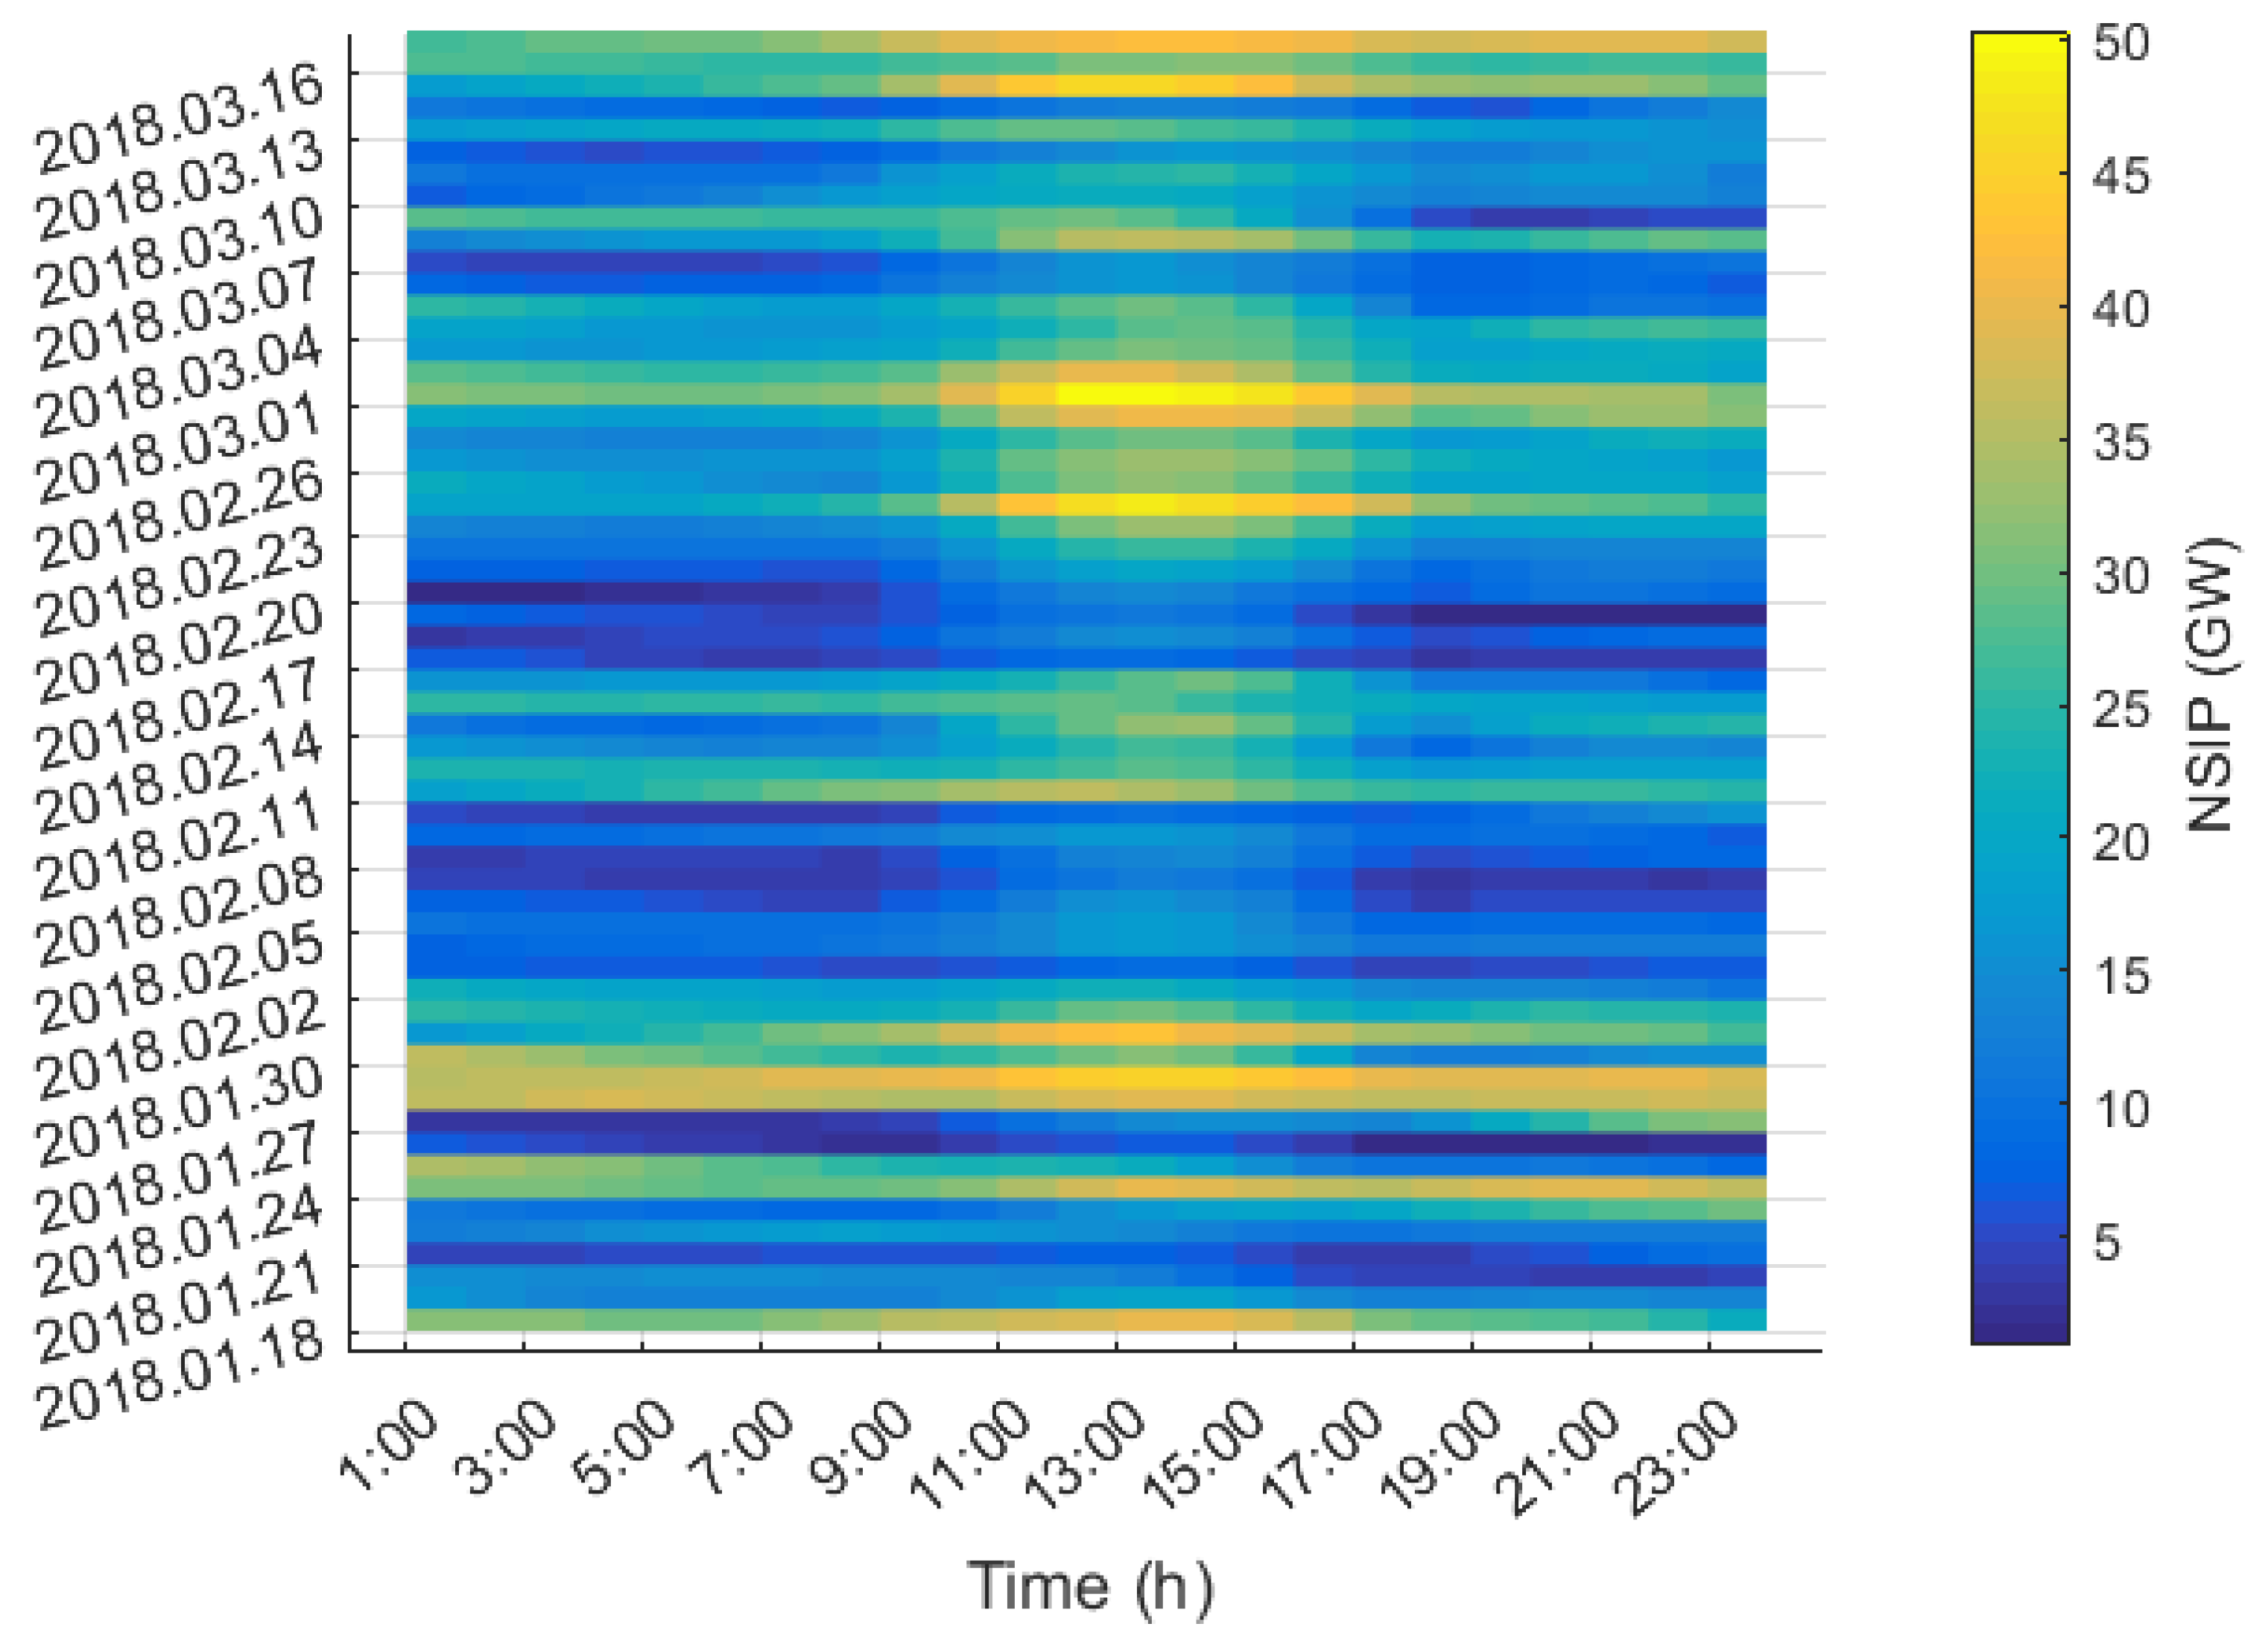
To evaluate the system stability, we visualize various correlations between NSIP generation, and share, minimum and maximum RoCoF and frequency deviation from 50 Hz. The time span of the analysis is two months, which is a rather short time for generic observations. However, a data set of 5,184,000 frequency measurements of 1 s resolution and 5760 NSIP recorded values of 15 min resolution allow us to extract reliable observations for the specific time span and thus during the mentioned period of extended frequency imbalance.
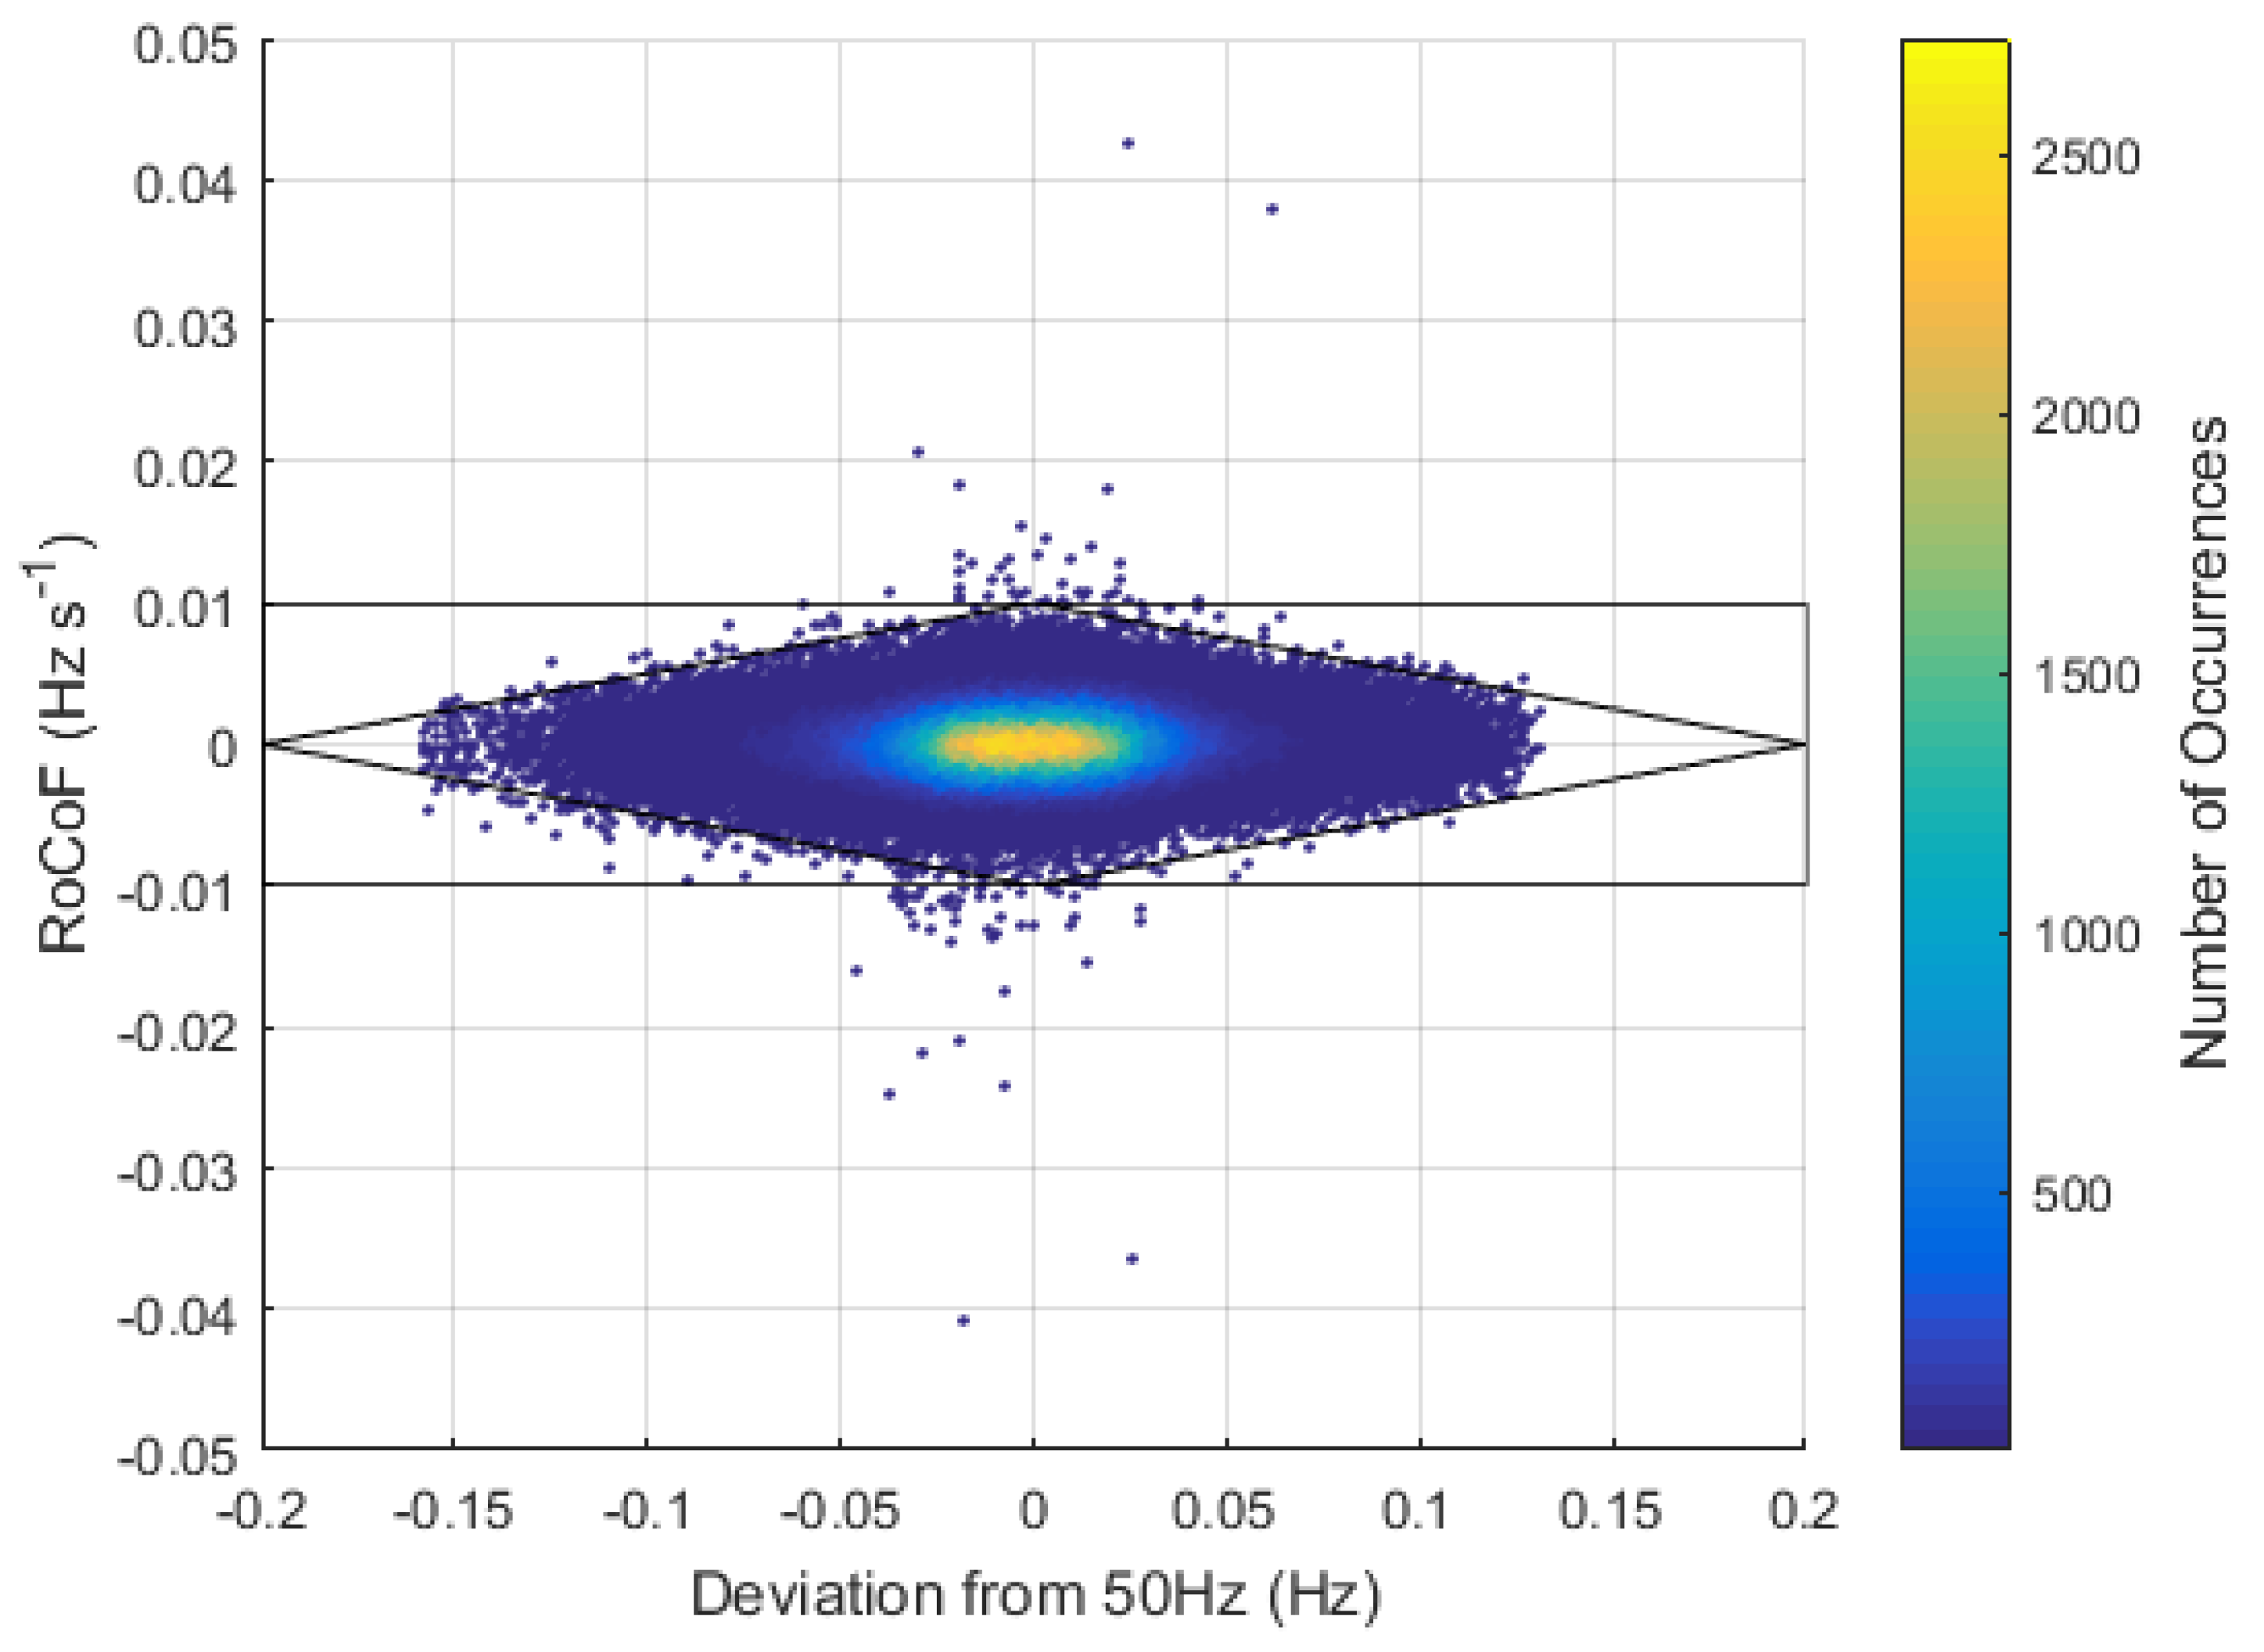
The value of RoCoF in comparison with the deviation of the frequency from 50 Hz is an indicator of the grid stability. Large frequency deviations from 50 Hz and on the same time steep RoCoF reveal an unstable system. Figure 5 depicts the correlation between RoCoF and frequency deviation for the timespan 18 January 2018–18 March 2018 in a 3-D scatter plot. The x-axis represents the deviation of the measured frequency from 50 Hz at time t, the y-axis shows the RoCoF values at the same time and the z-axis shows the number of ( R o C o F t , D e v i a t i o n t ) observations. The calculation of the number of occurrences is done in steps of 0.1 mHz s 1 and 1 mHz respectively, to reduce the computational complexity. The visualization of the data points resembles a rhombus, from which one can observe that the most steep RoCoF values and substantial deviations from 50 Hz do not occur at the same time. Most of the observation points are included within the dashed rhombus and rectangle, which define the maximum frequency deviation and observed frequency gradients after a reference incident in the synchronous grid of continental Europe, namely 200 mHz and 0.01 Hz s 1 , respectively [14,15]. Indeed, only 51 and 37 measurements exceed the limit of 0.01 Hz s 1 and 0.01 Hz s 1 , respectively, which corresponds to 9.29 × 10 4 % and 6.66 × 10 4 % 
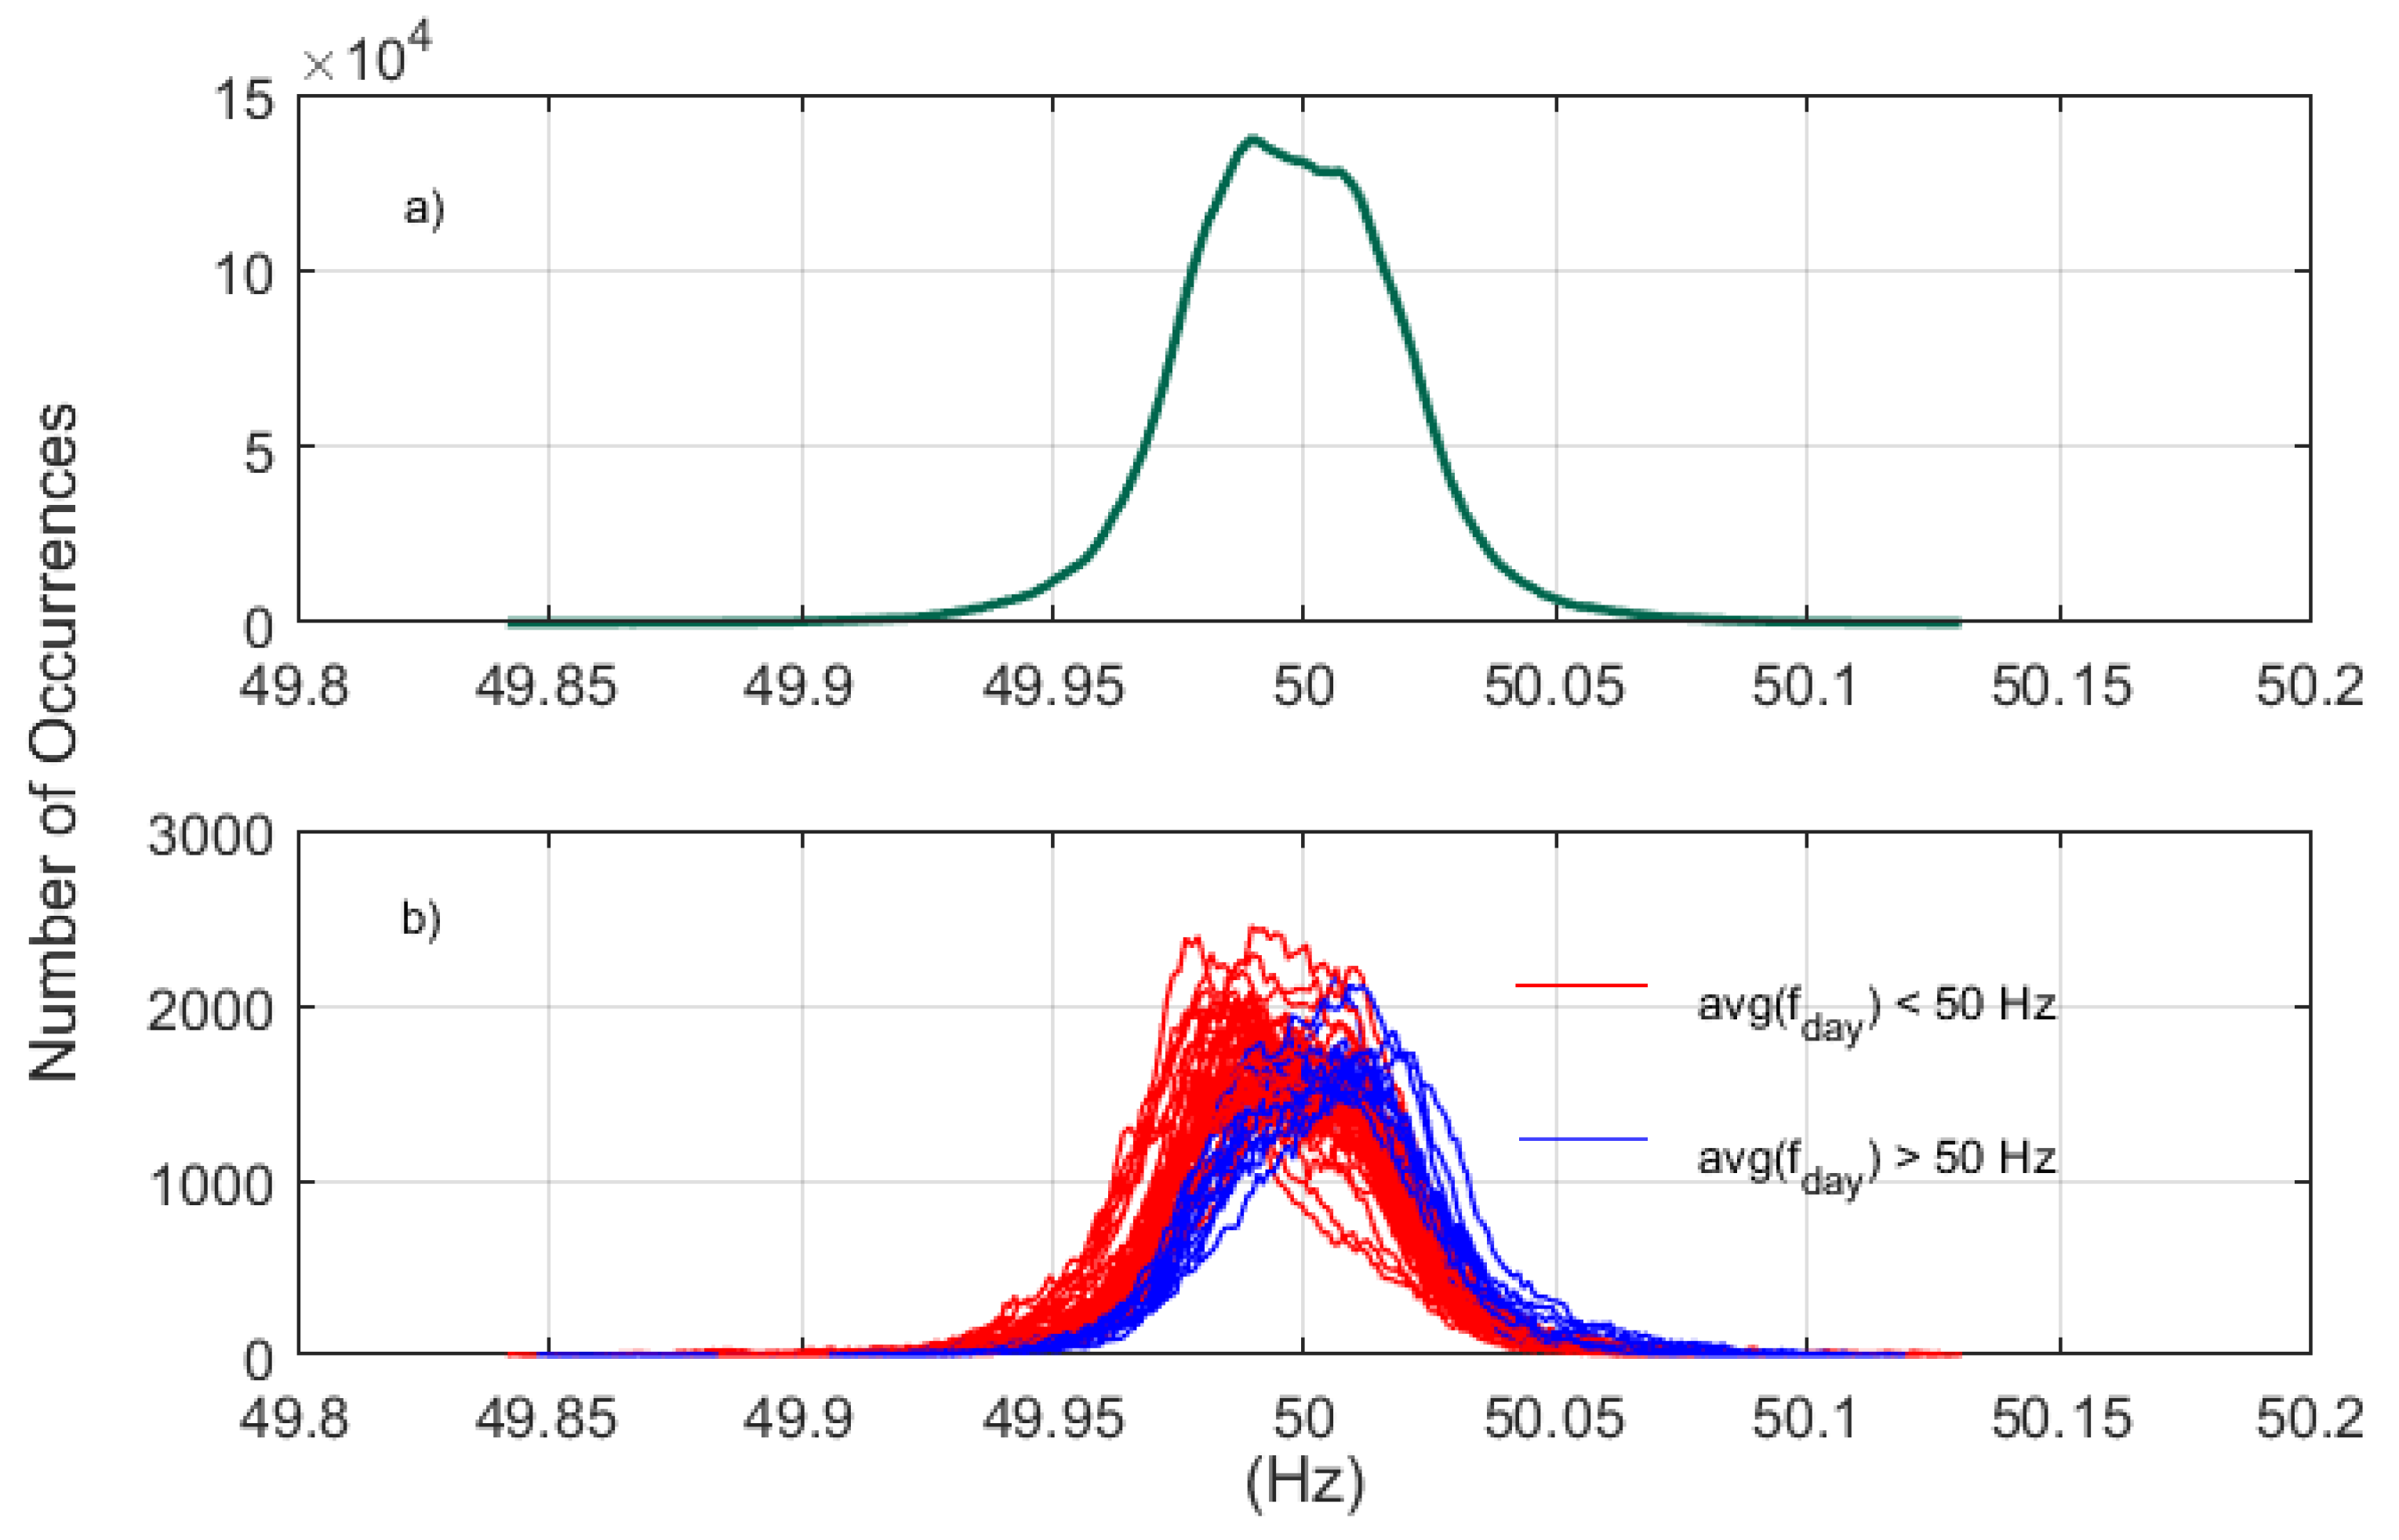
of the total number of measurement points. The resulting diagram is almost symmetrical on the x-axis which is a further stability criterion for the grid. It reveals that the average deviation from 50 Hz is almost 0 and hence the average frequency of the grid is 50 Hz. Indeed, the average absolute deviation from 50 Hz for the overall measurement period is 0.0178 Hz. The average frequency for the whole period is 49.9978 Hz. The symmetry on the y-axis reveals that inertia of the grid is provided similarly for positive and negative imbalances of generation and load during the period of the analysis. Therefore, the response of the grid when undergoing or surpassing 50 Hz is approximately the same. A further study examined the distribution of the frequency deviation based on measurement data during 1 April 2014–30 September 2015 ([16], Figure 11 (case Continental Europe (CE)). The frequency deviation did not exceed 0.15 Hz and the values are concentrated almost symmetrically around 0, which aligns with our study. Furthermore, the current visualization indicates that the maximum positive and negative frequency deviations from 50 Hz are not equal; the system frequency does not exceed 50.13 Hz during this analysis period, while it does drop below 49.85 Hz, with a maximum deviation of approximately 0.16 Hz. This indicates different grid control strategies to positive and negative frequency deviations.
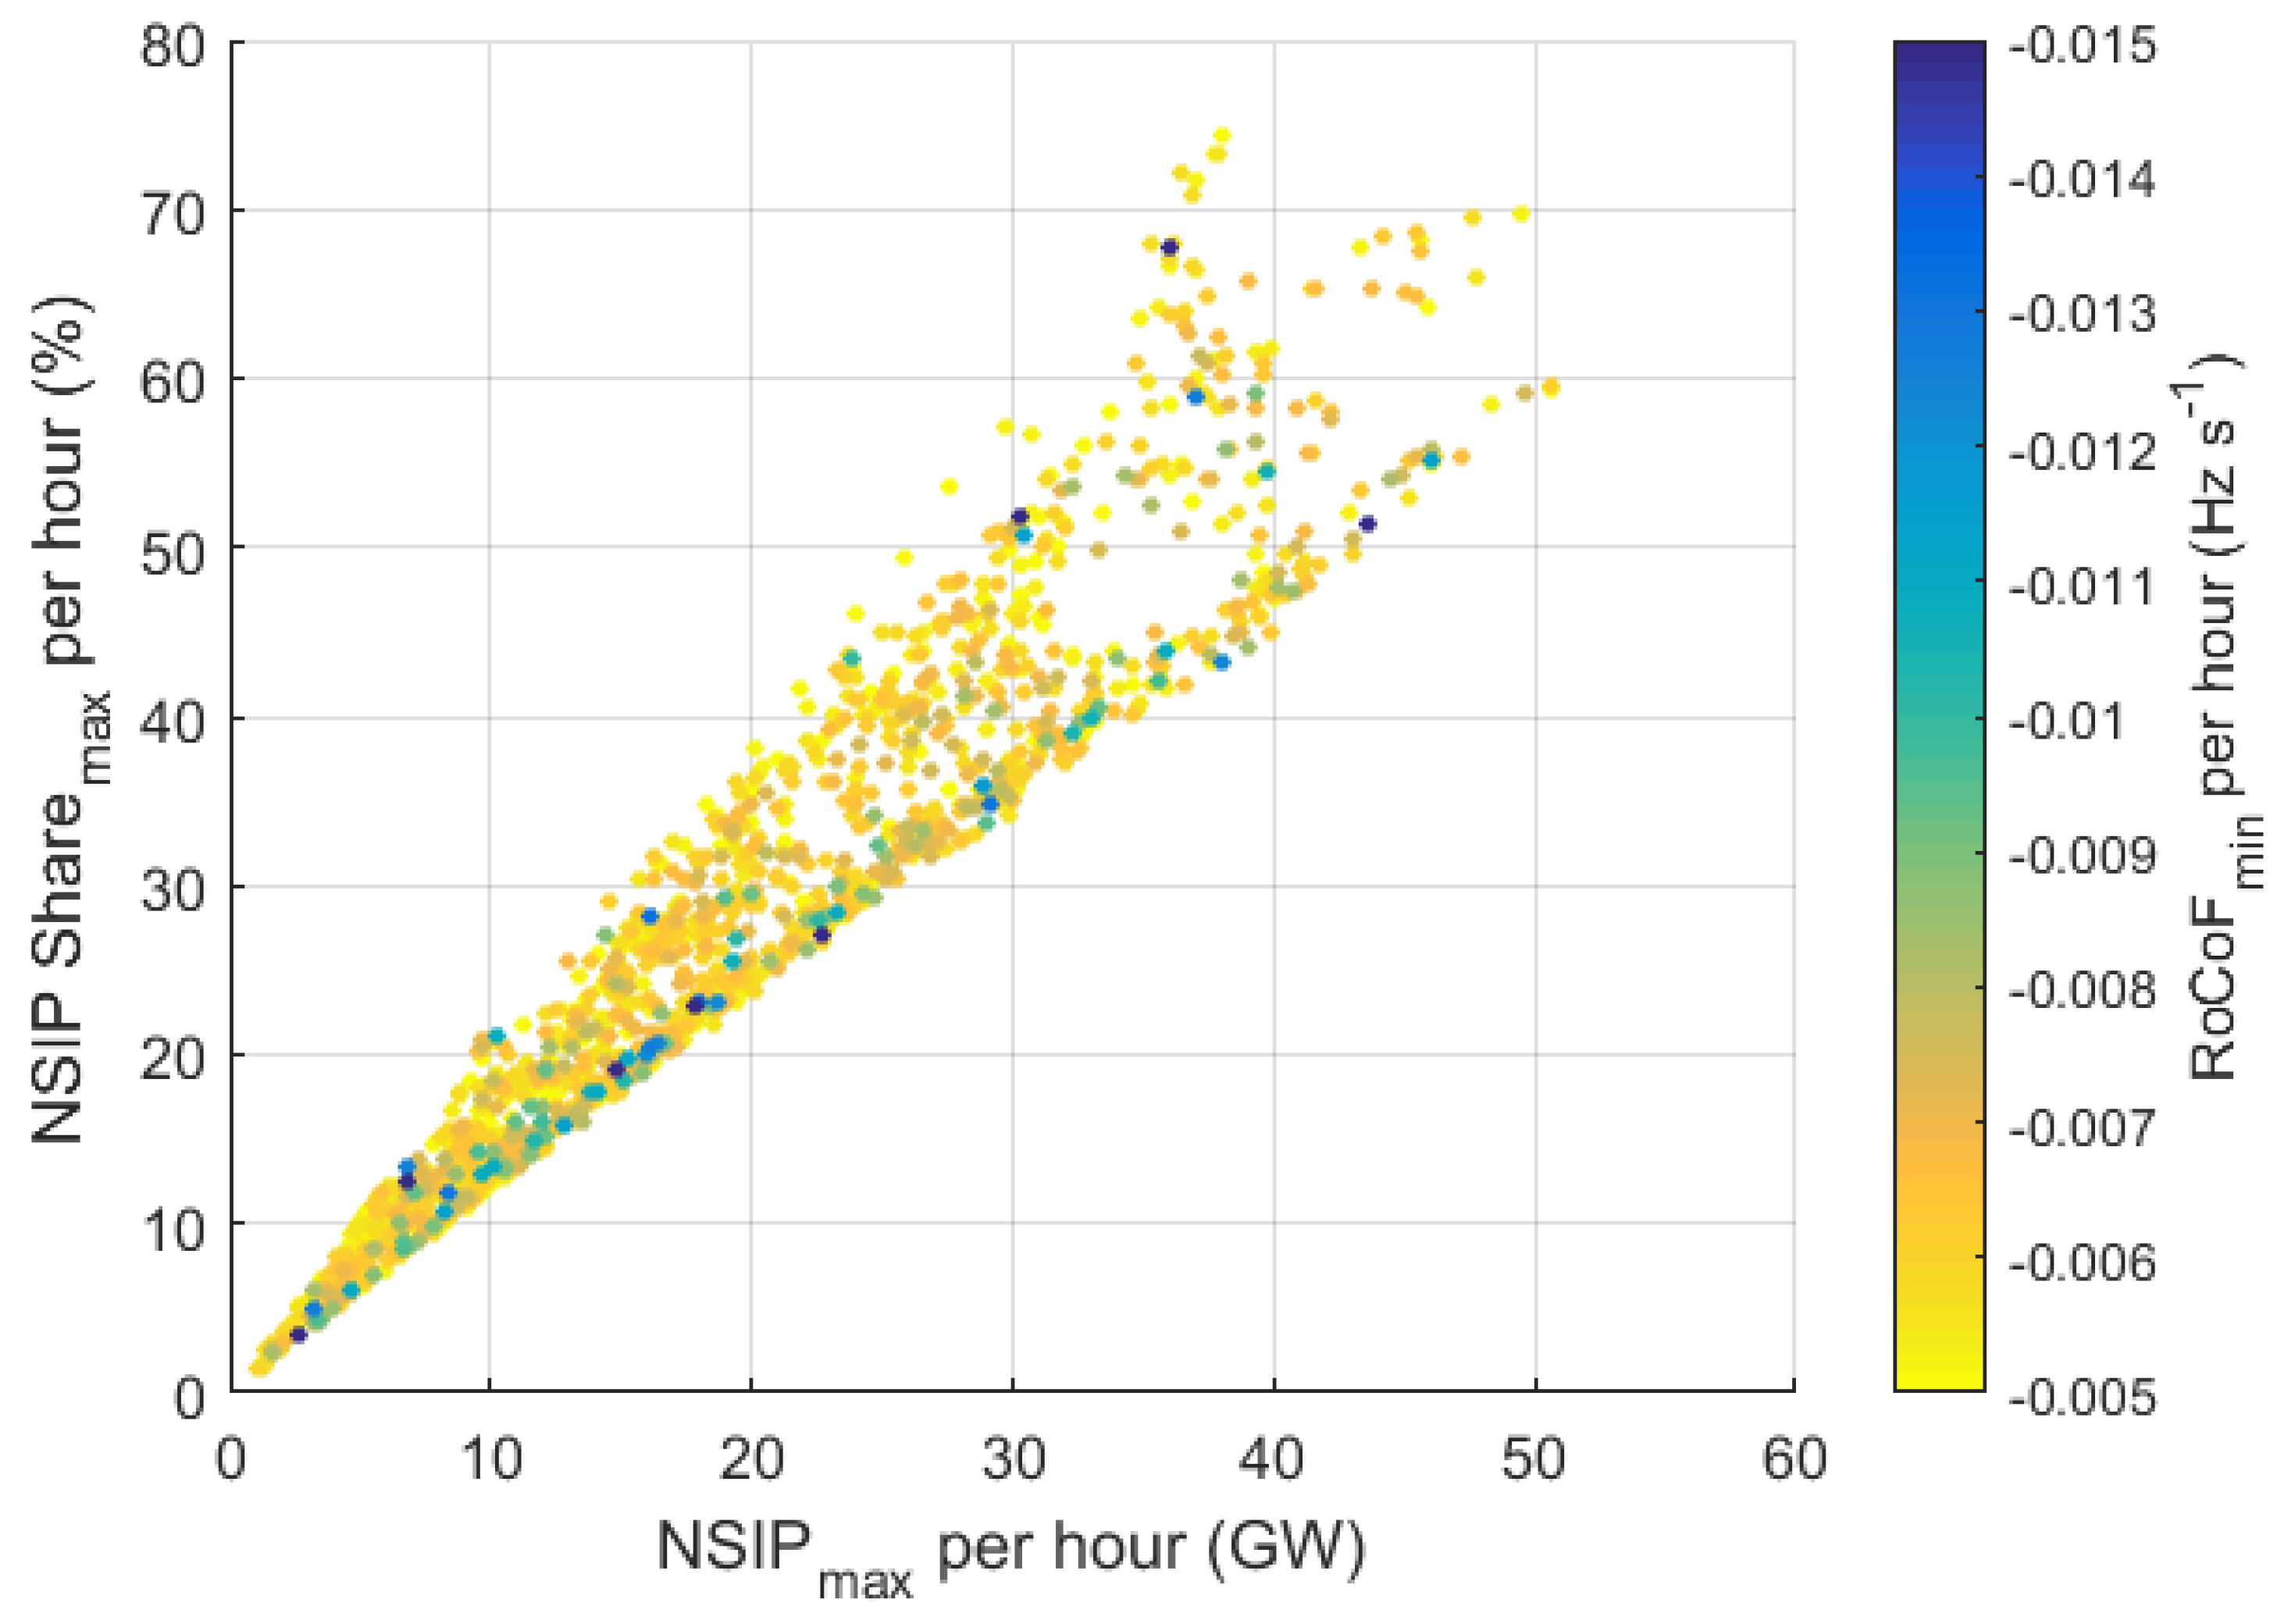
Continuing, the maximum NSIP per hour was compared with the minimum RoCoF per hour for the total period of the analysis, resulting in 1440 calculation points. Figure 6 depicts a scatter plot with the x-axis representing the maximum NSIP per hour, the y-axis the maximum share of NSIP per hour and the z-axis (colorbar) the minimum RoCoF per hour.
Regarding the x and y axes, we observe that the NSIP generation and share are proportional but also that high values of NSIP share are limited; a maximum NSIP share per hour higher than 50 % is observed 138 times of total 1440 observation points, which equals 9.58 % . The specific visualization aims to reveal a pattern regarding NSIP and extreme RoCoF values, namely here minimum RoCoF values. To avoid a biased visualization, we chose to exclude outliers of minimum RoCoF values (see Figure 5), and therefore we set the upper z-axis limit to 0.015 Hz s 1 . Nevertheless, no clear correlation between maximum NSIP share per hour and minimum RoCoF per hour can be observed in this visualization. The minimum RoCoF rather than the maximum was chosen as z-axis here, since negative RoCoF values occur more frequently than positive ones, and hence they serve better the visualization purposes.
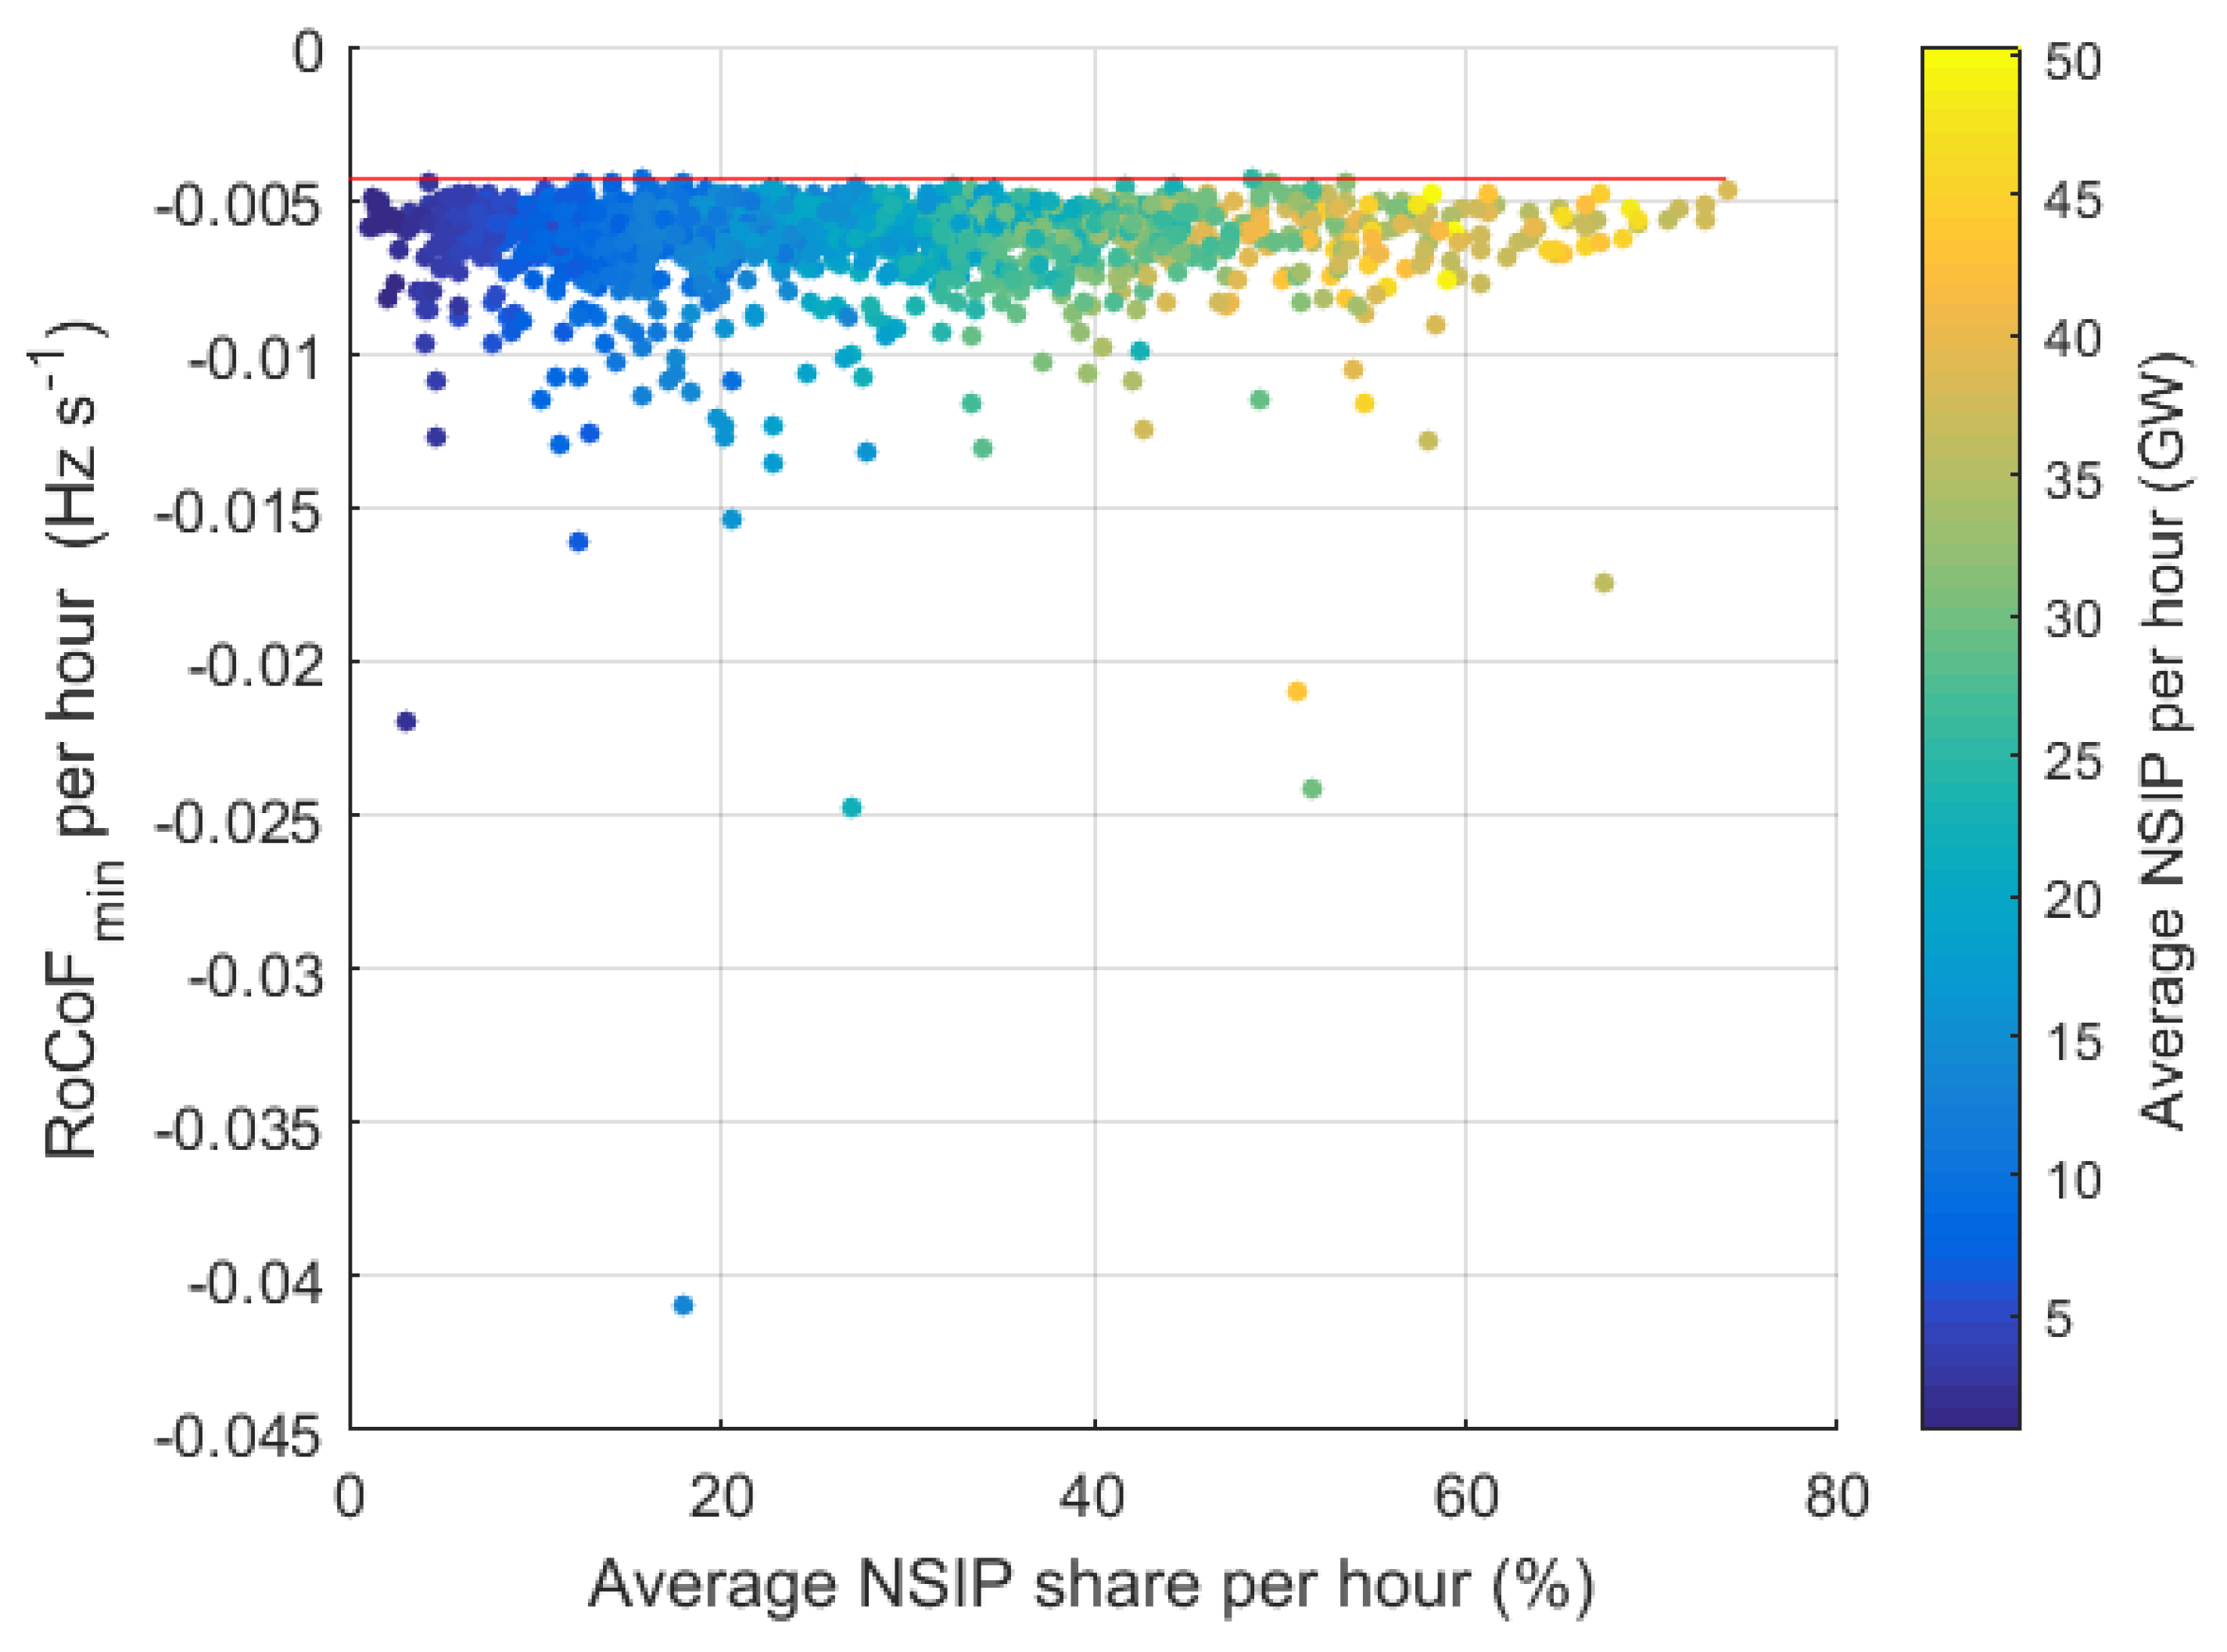
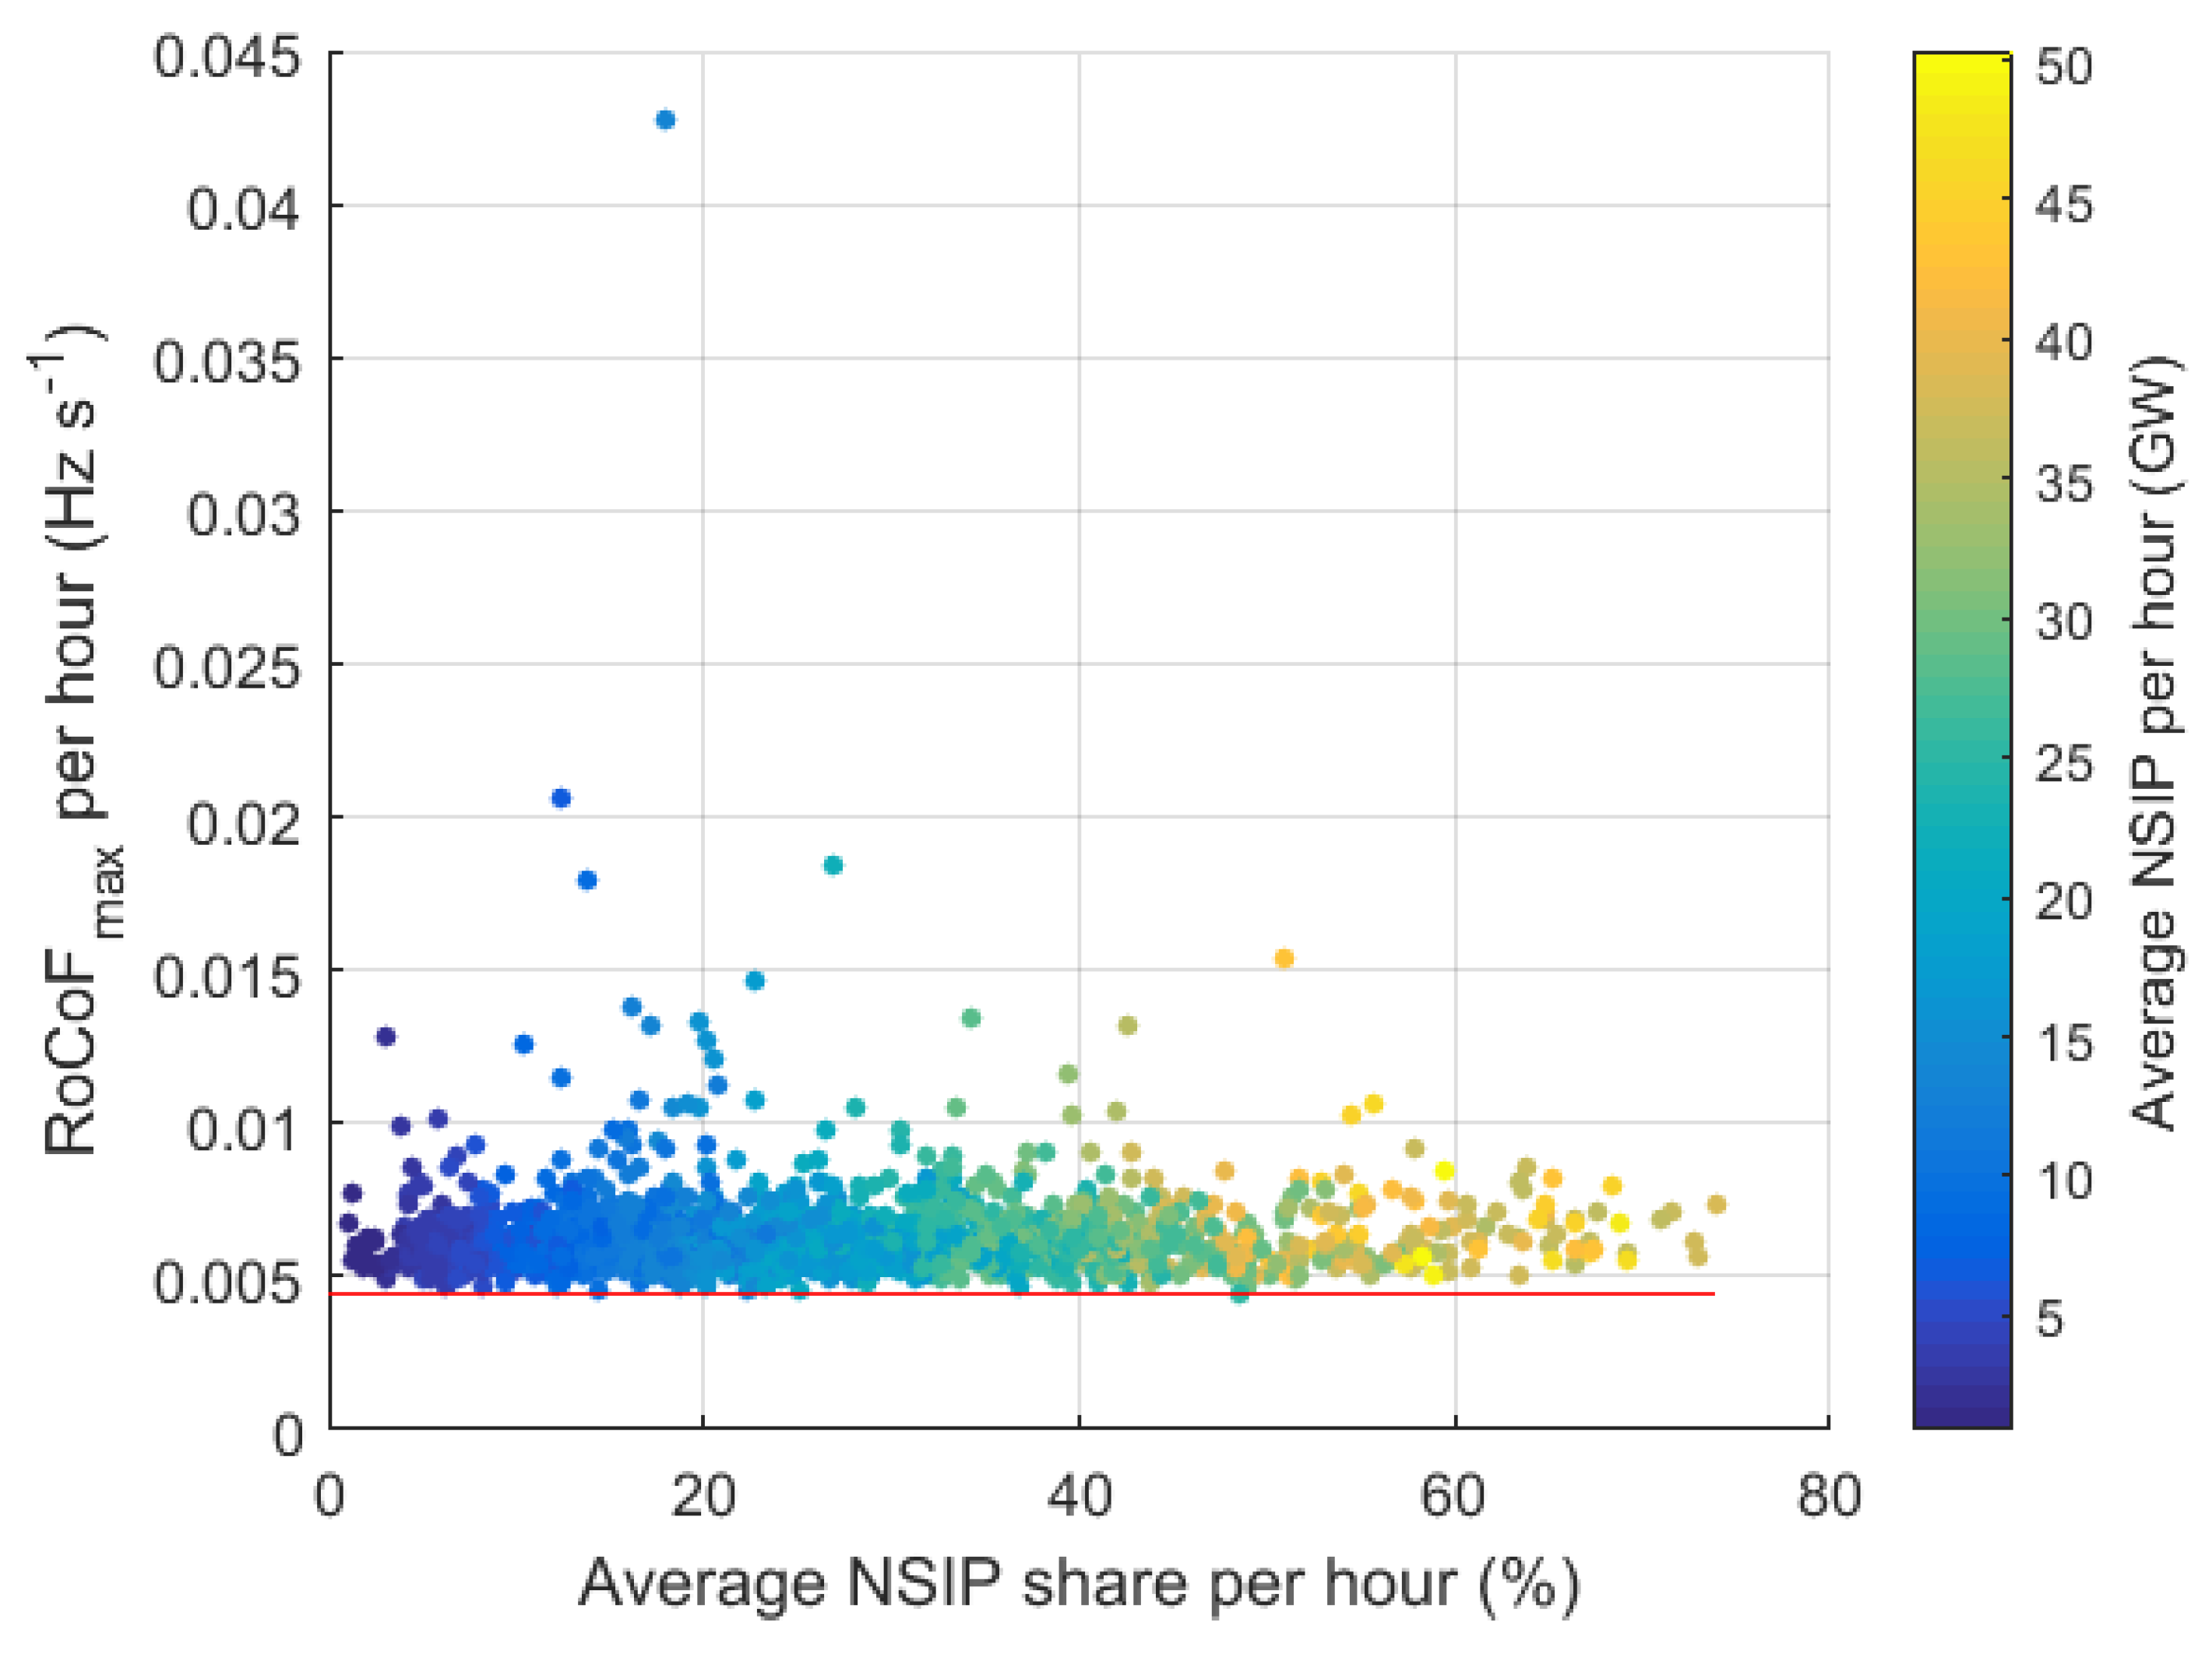
Figure 7 and Figure 8 depict the minimum and maximum RoCoF per hour and its correlation with the average NSIP share per hour. These two visualizations aim to reveal a correlation between steeper RoCoF values at high NSIP share. The resulting scatter plot of 1440 data points (1 h calculation step for 60 days) reveals no significant decrease or increase of minimum and maximum RoCoF when NSIP share takes higher values. The red horizontal lines stand for the minimum and maximum of RoCoF values per hour in Figure 7 and 
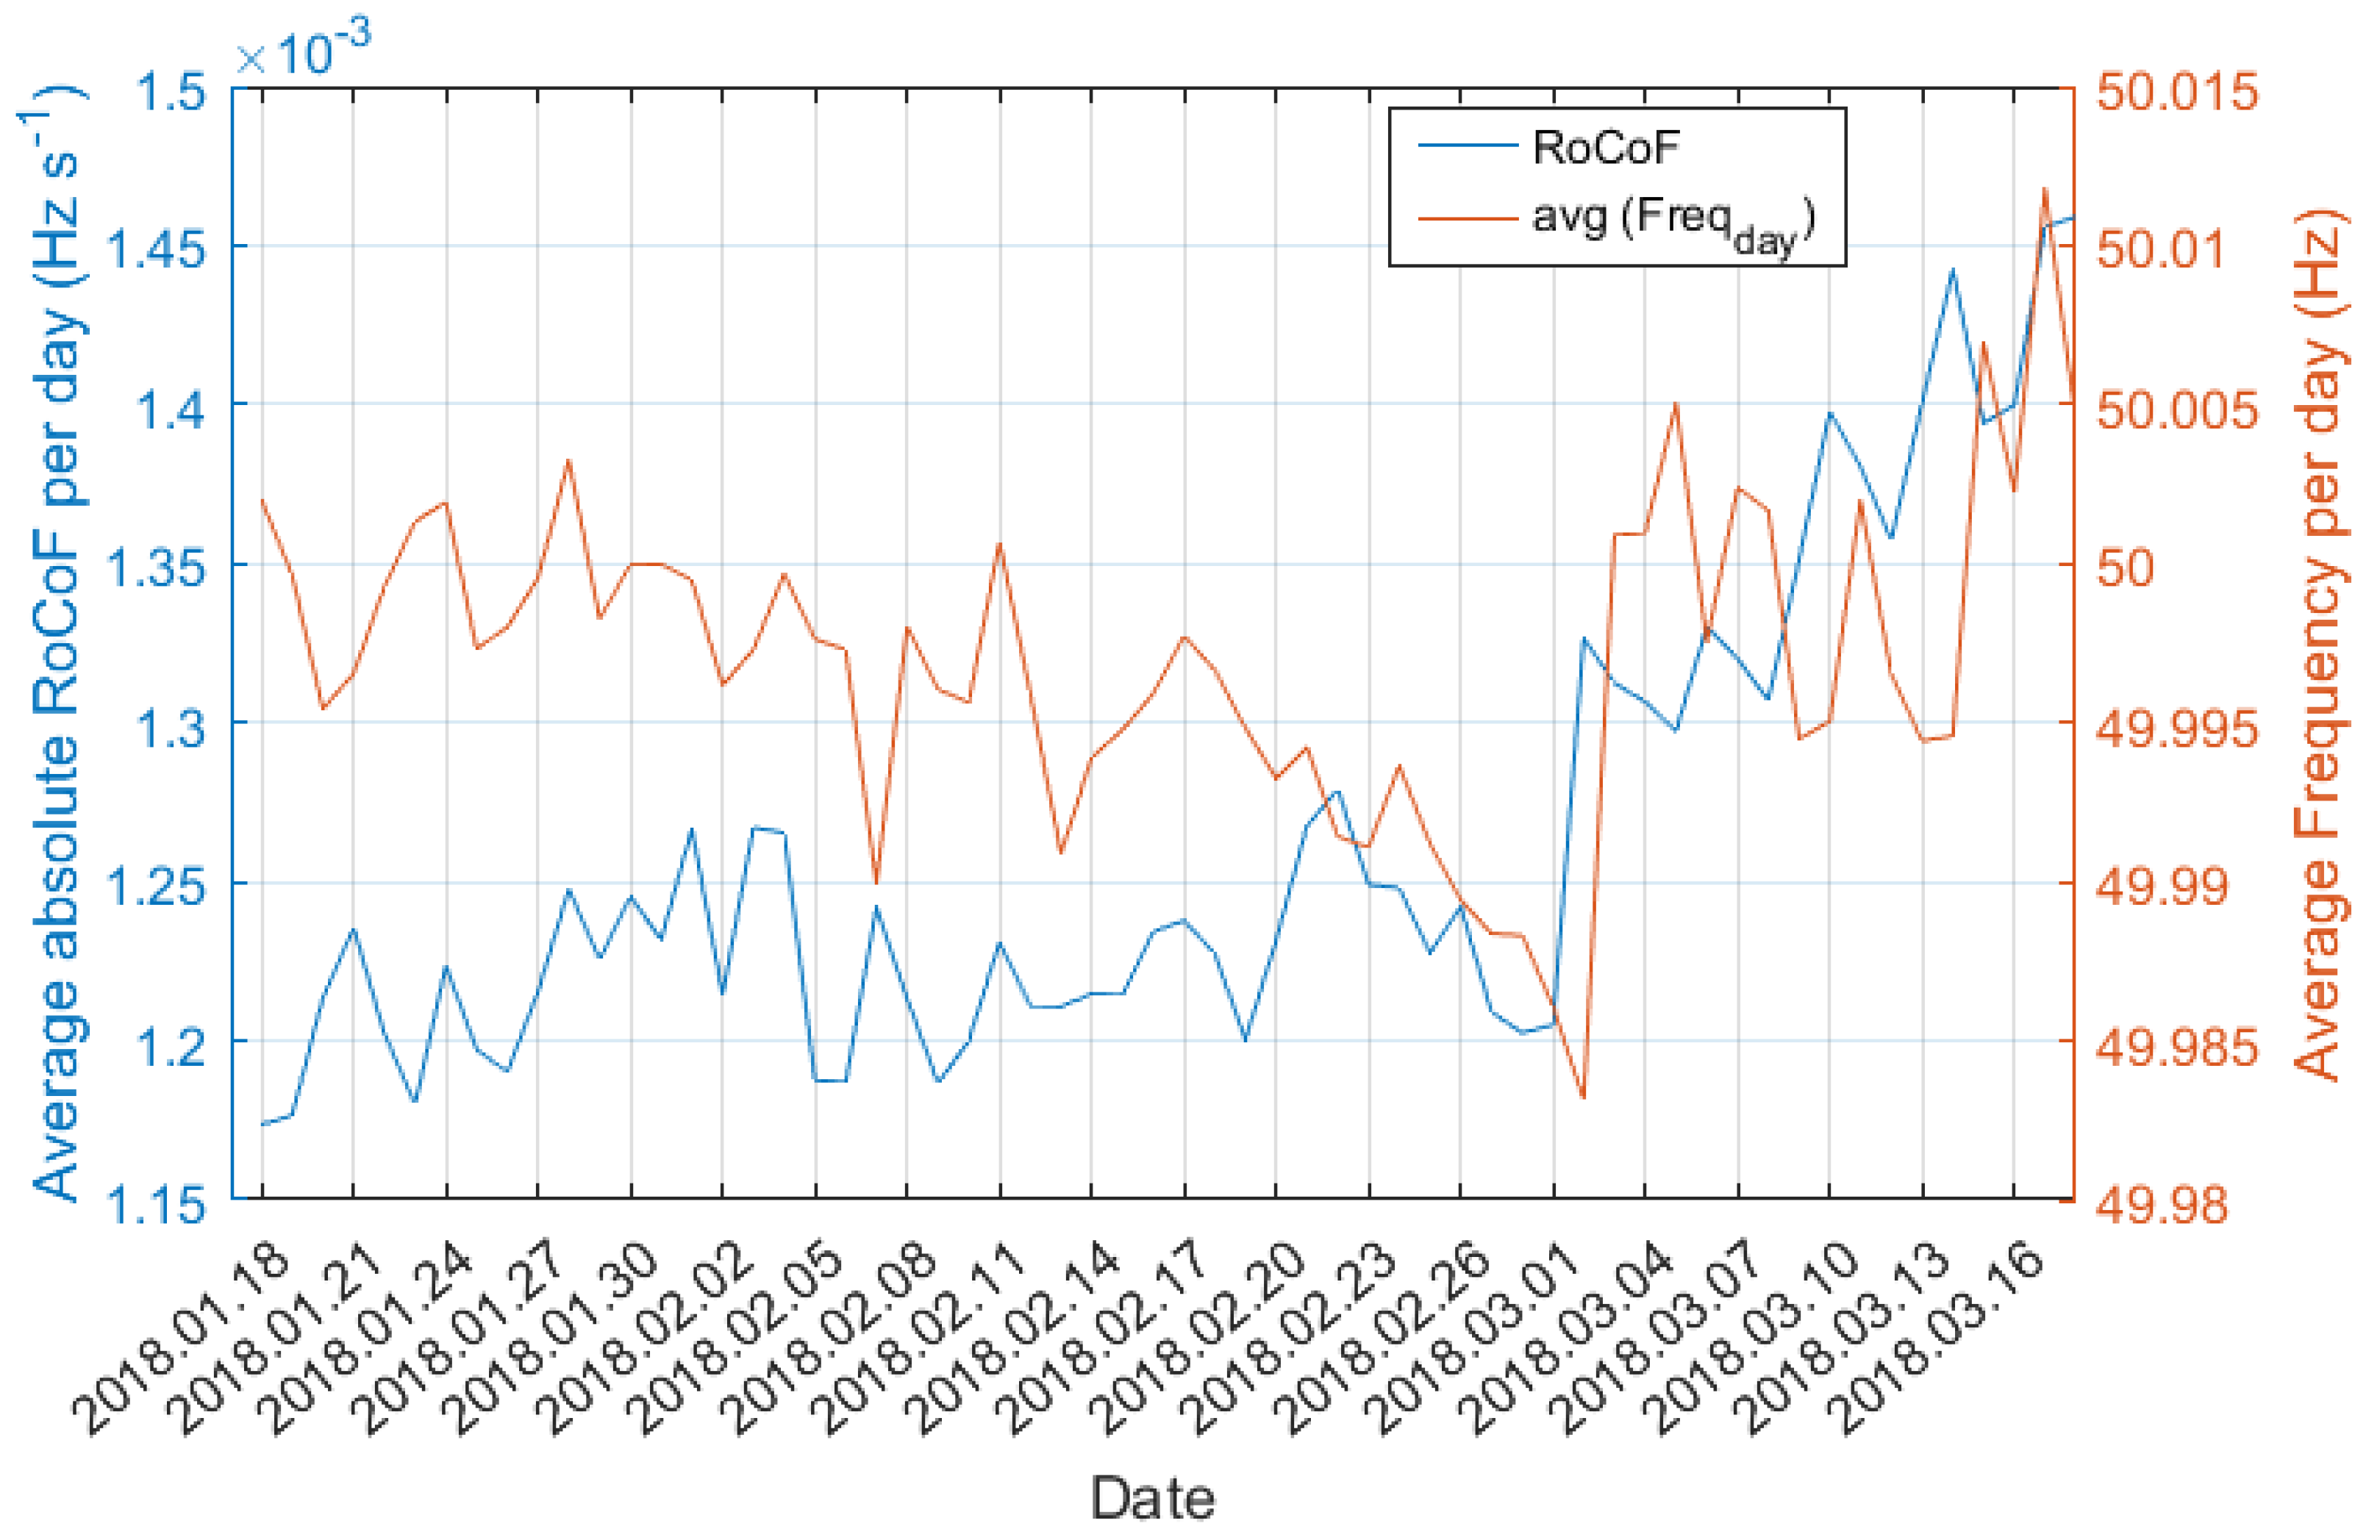
Figure 8 , respectively. The data points are mostly aligned with these two horizontal red lines, which indicates no substantial RoCoF increase or decrease. Therefore, the increase of RoCoF as depicted in Figure 3 from 2 March 2018 and onwards cannot be attributed to the higher NSIP. Comparing Figure 7 of the current study with Figure 11 of the study on the Australian grid, as presented in Ahmadyar et al. [6], we notice that, in the latter, there is also no significant increase of RoCoF for an NSIP share up to approximately 70%, for various use case scenarios. In the present analysis, the NSIP share reaches 74.31 % , without causing a significant increase of RoCoF. Unlike that, in some of the use cases of [6], RoCoF increases rapidly when the NSIP share exceeds 70 % .
The observations of this study, based on actual measurements, support the findings of earlier simulation studies [4], which identified a low impact of NSIP share on the frequency of ECSA, when compared to isolated power systems. Nevertheless, an NSIP share higher than 75 % was not applied in the specific period of the analysis. Therefore, conclusions over the system reaction to a higher NSIP share cannot be drawn. Furthermore, it is important to point out that the NSIP share in this study is calculated based only on the total load and generation of two countries and not of the whole ECSA. The same analysis was carried out also with frequency measurements and NSIP generation data recorded during summer period and specifically from 14 May 2017 to 13 June 2017. During that period, there was an increased PV in-feed in comparison to the period of the parent analysis. Nevertheless, there was essentially no different observation about the impact of NSIP on the grid frequency.

5. Conclusions

In this study, the impact of non-synchronous instant penetration of photovoltaic and wind power generation of two interconnected European countries on the frequency variations and the Rate of Change of Frequency were examined. High-resolution frequency measurements were acquired in Austria in a research facility during 18 January 2018–18 March 2018. This period is of particular interest due to the decreased power in-feed of a southeast European country, which led to frequency deviations. It was observed that great frequency deviations and steep RoCoF did not occur at the same time, which is an indicator of frequency stability of the power grid, even under adverse conditions. Furthermore, there was no directly proportional relationship between RoCoF and NSIP of Germany and Austria observed during the specific period of the analysis. Even at a maximum NSIP share of 74.31 % in these two countries, there was no significant increase of RoCoF observed. The derived observations are based on generation data only of the mentioned countries as part of the European continental synchronous grid, and therefore a generic conclusion cannot be drawn. However, the high-resolution and precision PMU frequency measurements ensure the reliable observation that there was no negative impact of increased NSIP share on the the frequency stability of the power grid observed during the analysis period. This observation strengthens the role of RES in the synchronous European continental grid. Further work on the total NSIP in continental European Grid is expected to provide a clearer insight on the impact of NSIP on the grid frequency.

Author Contributions

E.X. set up the data collection and storage software; gathered and preprocessed all data necessary for the analysis from internal and external sources; carried out the calculations; produced and refined the results and visualizations; and wrote, read and approved the final manuscript. W.G. triggered the investigation of the impact of NSIP on grid frequency; guided and supported the progress of the study; reviewed extensively the results; and read, edited and approved the final manuscript. T.Z. contributed to the discussion about the research topic; provided valuable support and guidance about the data analysis methods and visualizations; and read, reviewed and approved final manuscript. J.F. organized, coordinated and certified the setup of the infrastructure for accurate; synchronized measurements, data collection and storage; provided valuable guidance during the discussion about the research topic and the analysis; and read, reviewed and approved the final manuscript.

Acknowledgments

The present work was carried out in the frames of the research project FUSE: Future Self-organized Energy systems, of the institute of Telecommunications, TU Wien, Austria. The authors acknowledge the TU Wien University Library for financial support through its Open Access Funding Program.

Conflicts of Interest

The authors declare no conflict of interest.

Abbreviations

The following abbreviations are used in this manuscript:
ECSAEuropean Continental Synchronous Area
EISEuropean Interconnected System
ENTSO-EEuropean Network of Transmission System Operators for electricity
NSIPNon-Synchronous Instant Penetration
NS-RESNon-Synchronous Renewable Energy Sources
PMUPhasor Measurement Unit
PVPhotovoltaic
RoCoFRate of Change of Frequency

References

  1. Kroposki, B.; Johnson, B.; Zhang, Y.; Gevorgian, V.; Denholm, P.; Hodge, B.M.; Hannegan, B. Achieving a 100% Renewable Grid: Operating Electric Power Systems with Extremely High Levels of Variable Renewable Energy. IEEE Power Energy Mag. 2017, 15, 61–73. [Google Scholar] [CrossRef]
  2. Renewable Energy-Energy-European Commission. Available online: https://ec.europa.eu/energy/en/topics/renewable-energy (accessed on 12 April 2018).
  3. Rate of Change of Frequency (ROCOF) Withstand Capability. Available online: https://www.entsoe.eu/Documents/Network%20codes%20documents/Implementation/CNC/IGD-RoCoF_withstand_capability.pdf (accessed on 10 April 2018).
  4. Wang, Y.; Silva, V.; Lopez-Botet-Zulueta, M. Impact of high penetration of variable renewable generation on frequency dynamics in the continental Europe interconnected system. IET Renew. Power Gener. 2016, 10, 10–16. [Google Scholar] [CrossRef]
  5. Fernandez-Bernal, F.; Egido, I.; Lobato, E. Maximum wind power generation in a power system imposed by system inertia and primary reserve requirements. Wind Energy 2015, 18, 1501–1514. [Google Scholar] [CrossRef]
  6. Ahmadyar, A.S.; Riaz, S.; Verbic, G.; Chapman, A.; Hill, D.J. A Framework for Assessing Renewable Integration Limits with Respect to Frequency Performance. IEEE Trans. Power Syst. 2017, 1. [Google Scholar] [CrossRef]
  7. Doherty, R.; Mullane, A.; Nolan, G.; Burke, D.J.; Bryson, A.; O’Malley, M. An Assessment of the Impact of Wind Generation on System Frequency Control. IEEE Trans. Power Syst. 2010, 25, 452–460. [Google Scholar] [CrossRef]
  8. Annual Renewable Energy Constraint and Curtailment Report 2016. Available online: http://www.eirgrid.ie/site-files/library/EirGrid/Annual-Renewable-Constraint-and-Curtailment-Report-2016-Non-Technical-Summary-v1.0.pdf (accessed on 12 April 2018).
  9. Model 1133A Power Sentinel—Synchronized Power Measurement Series. Available online: https://www.arbiter.com/catalog/product/model-1133a-power-sentinel.php (accessed on 12 April 2018).
  10. Frequency Measurement Requirements and Usage. Available online: https://www.entsoe.eu/Documents/SOC%20documents/Regional_Groups_Continental_Europe/2018/TF_Freq_Meas_v7.pdf (accessed on 12 April 2018).
  11. Frequency Deviations in Continental Europe Including Impact on Electric Clocks Steered by Frequency. Available online: https://www.entsoe.eu/news/2018/03/03/frequency-deviations-in-continental-europe-including-impact-on-electric-clocks-steered-by-frequency/ (accessed on 12 April 2018).
  12. [Press Release] Continuing Frequency Deviation in the Continental European Power System Originating in Serbia/Kosovo: Political Solution Urgently Needed in Addition to Technical. Available online: https://www.entsoe.eu/news/2018/03/06/press-release-continuing-frequency-deviation-in-the-continental-european-power-system-originating-in-serbia-kosovo-political-solution-urgently-needed-in-addition-to-technical/ (accessed on 12 April 2018).
  13. ENTSO-E Transparency Platform. Available online: https://transparency.entsoe.eu/ (accessed on 12 April 2018).
  14. P1—Policy 1: Load-Frequency Control and Performance [C]. Available online: https://www.entsoe.eu/fileadmin/user_upload/_library/publications/entsoe/Operation_Handbook/Policy_1_final.pdf (accessed on 12 April 2018).
  15. Frequency Stability Evaluation Criteria for the Synchronous Zone of Continental Europe. Available online: https://www.entsoe.eu/Documents/SOC%20documents/RGCE_SPD_frequency_stability_criteria_v10.pdf (accessed on 12 April 2018).
  16. Kovaltchouk, T.; Debusschere, V.; Bacha, S.; Fiacchini, M.; Alamir, M. Assessment of the impact of frequency containment control and synthetic inertia on intermittent energies generators integration. In Proceedings of the Eleventh International Conference on Ecological Vehicles and Renewable Energies (EVER), Monte Carlo, Monaco, 6–8 April 2016; pp. 1–8. [Google Scholar]
Figure 1. Frequency distribution: (a) from 18 January 2018 to 18 March 2018; and (b) on each individual day within the same time span.
Sustainability 10 01605 g001
Figure 2. RoCoF distribution: (a) from 18 January 2018 to 18 March 2018; and (b) on each individual day.
Sustainability 10 01605 g002
Figure 3. Average absolute RoCoF and average frequency per day during 18 January 2018–18 March 2018.
Sustainability 10 01605 g003
Figure 4. Top view of three-dimensional plot of average NSIP per hour during 18 January 2018–18 March 2018.
Sustainability 10 01605 g004
Figure 5. RoCoF versus frequency deviation from 50 Hz.
Sustainability 10 01605 g005
Figure 6. NSIP maximum generation and share per hour versus minimum RoCoF per hour, during 18 January 2018–18 March 2018.
Sustainability 10 01605 g006
Figure 7. Minimum RoCoF per hour versus average NSIP share per hour.
Sustainability 10 01605 g007
Figure 8. Maximum RoCoF per hour versus average NSIP share per hour.
Sustainability 10 01605 g008

