Cross-Subsidies and Government Transfers: Impacts on Electricity Service Quality in Colombia


1
China Center for Special Economic Zone Research, Shenzhen University, Shenzhen 518060, China
2
School of Kinesiology, University of Michigan, Ann Arbor, MI 48109, USA
3
Department of Transportation Economics and Logistics Management, College of Economics, Shenzhen University, Shenzhen 518060, China
*
Author to whom correspondence should be addressed.
Sustainability 2018, 10(5), 1599; https://doi.org/10.3390/su10051599
Submission received: 17 April 2018
/
Revised: 10 May 2018
/
Accepted: 11 May 2018
/
Published: 16 May 2018
(This article belongs to the Collection Power System and Sustainability)
Abstract
:An affordable and reliable supply of electricity service is essential to encourage sustainable social development in developing countries. Colombia uses cross-subsidies to prompt electricity usage for poor households. This raises the issue of whether charging lower prices to poor households, while boosting their consumption, induces utilities to lower the quality of service received by them. This paper uses unique databases and examines how underfunded cross-subsidies affect perceived electricity service quality across consumer groups. Results indicate that when facing financial deficits, utilities provide lower perceived service quality to subsidized consumers than to residents paying surcharges. The difference in perceived quality across consumer groups is reduced by an increase in the amount of (external) government transfers. To prompt electricity consumption by the poor, the Colombian government should fund subsidies, strengthen quality regulation, and increase the transparency and reliability of government transfers.
1. Introduction
In developing countries, universal service obligations (USO) are widely viewed by policy makers as an important component of equitable and sustainable development strategies: a redistribution of energy or natural resources toward the poor [1,2,3]. Unaffordability in poor neighborhoods is one of the main barriers limiting the achievement of this objective, so cross-subsidies are widely used to solve this issue. An example of a situation involving cross-subsidies is the Colombian electricity sector, where utilities charge higher prices to high-income residents to subsidize lower prices for low-income residents. If the utility fails to reach a financial balance on its own, the scheme in place calls for the government to cover the resulting deficit via external transfers.
Ideally, these cross-subsidies raise consumption (by lowering the price) and provide an adequate quality service in poor neighborhoods. In the electricity sector, however, many subsidized households receive low-quality service, reflected in long-term outages, frequent service interruptions, and variable voltage [4]. The cause of this phenomenon appears to be standard supply and/or demand factors (the poor are low-income customers and quality is a superior good). However, McRae [5] shows that it is the existing cross-subsidy system in Colombia that deters investment in modernizing infrastructure in subsidized areas. Li and Li [6] shows that (in theory) a low-quality electricity service in poor neighborhoods is due to the unreliable funding mechanism of cross-subsidies.
Intuitively, if the government transfers are insufficient to cover a utility’s deficit from subsidizing the poor, the utility will find ways to reduce its deficit through a quality adjustment that effectively provides fewer subsidies and collects more surcharges. On the one hand, the utility will reduce poor households’ consumption by providing them with lower-quality service; on the other hand, the utility will increase high-income households’ consumption through improvements in their service quality [7].
In this paper, we study the utility’s rational response to an underfunded cross-subsidy policy in the Colombian electricity sector, which applies a geographic targeting scheme. This cross-subsidy system has played an important role in electricity usage promotion in poor neighborhoods since 1994; however, since more than 90 percent of households receive some subsidy, the government transfers only partially cover utilities’ deficits from the cross-subsidy system.
This paper matches a large survey dataset about household living conditions with three municipal level datasets, which involves about 20,000 families in 106 Colombian municipalities. The service quality data reflects the family head’s perception about electricity service quality (ranging from “very bad” to “very good”). This can be seen as a reasonable proxy for actual service quality experienced because the most common quality measures for electricity are voltage sags and outages, which are directly noticed by consumers. A similar proxy for actual service quality can be found in Hartman and Naqvi [8] and Destandau and Garcia [9]. We use the data in two specific ways to address the impact of cross-subsidies on perceived quality of electricity service. First, we compare the service quality across consumer types by estimating the effect of consumer stratification on perceived quality. Second, we take into account the differential effects of the government transfer on service quality within consumer type.
The probability of the most-subsidized consumers reporting “bad” quality electricity is 10.57 percentage points higher than the response of the standard consumers (the middle-income consumers who neither receive a subsidy for electricity consumption nor pay a surcharge for electricity). Controlling for all exogenous variables, the study finds that 2.53 percentage points are due to the way the utility responds to the underfunded cross-subsidy scheme. The study also finds that with an increase in government transfers, perceived quality is improved for subsidized consumers but reduced for surcharged consumers, so the quality differentials across consumer types are reduced by an increase in transfers. The study suggests that to provide affordable and sustainable electricity service to the poor, the government should establish a reliable funding mechanism of the cross-subsidy system and strengthen quality regulation.
2. Literature Review
A reliable and equitable supply of energy and natural resources is the cornerstone for sustainable social development and economic growth [10]. Hope and Singh [11] study the impacts of fuel subsidy reform in six countries (Columbia, Ghana, Indonesia, Malaysia, Turkey and Zimbabwe) and find that in three of them (Columbia, Indonesia and Ghana) in the years during fuel subsidy reform, GDP grew faster than before. Breisinger et al. [12], however, found that fuel subsidy reform in Yemen could increase or decrease property depending on reform design.
Cross-subsidies are widely used by governments to promote the consumption of energy and natural resources by the poor. Most past empirical evaluations of cross-subsidies in electricity sectors similar to the Colombian utility sector have addressed affordability and the accuracy of targeting the poor, given the subsidy. For example, Mirnezami [13] used data from Canadian families to compare the consumption level with and without a subsidy. Gόmez-Lobo and Contreras [14] used relative concentration curves to show that the Colombian geographical target scheme is less able to identify poor people than the means-tested scheme. Sawkins and Reid [15] summarized the measurement of cross-subsidies.
Nevertheless, even if well-targeted cross-subsidies increase the affordability of electricity, utilities could reduce local maintenance outlays and increase outages and frequency of service interruption—reducing service quality for those receiving subsidies (primarily the poor). Thus, it is important to examine the effect of subsidy schemes on service quality; for example, Jamasb and Pollitt [16] discussed the relationship between cross-subsidies and service quality during electricity market reform in the European Union. Service quality is an important factor to evaluate the sustainability and reliability of electricity supply. Laffont and N’Gbo [1] discussed the financing of infrastructure network expansion in developing countries and showed that (in theory) utilities reduce service quality to the poor under cross-subsidies. To avoid the risk that utilities’ financial deficit will affect service quality, the Chilean water subsidy programs allow a utility to stop offering subsidies to customers if the government does not deliver enough transfer to cover utilities’ deficits [17].
Due to data limitations, however, the impact on service quality across customer groups has been given minimal attention by empirical researchers. As one example, McRae [5] estimated household demand for electricity and then used it to calculate the change in the utilities’ profits from quality upgrades. He found that cross-subsidies deter utilities’ investments improving service quality, but he did not distinguish their differential effect across consumer income groups. Thus, the current research fills a gap in the literature by examining the impact of underfunded cross-subsidies on the service quality reported by consumers with different incomes. Although this analysis is limited to the Colombian electricity sector, Colombian leadership in utility subsidy reform efforts makes it an excellent sample for other developing countries that may apply cross-subsidies.
3. The Colombian Utility Cross-Subsidies System
Created to provide affordable utility services to poor segments of society, the Colombian cross-subsidy system redistributes resources toward to the poor by charging consumers different prices, dependent on their housing situation. The Public Residential Services Law 142 and 143 of 1994 explicitly laid out the national cross-subsidy system and its geographic targeting scheme [14,18]. The scheme is applied in electricity, natural gas, telephone, and water services.
Unlike other countries with targeted subsidies that evaluate the eligibility of subsidy recipients based on the current socioeconomic circumstance of households, the Colombian system employs the residential dwelling, a geographical targeting scheme, as the only factor in identifying the poor. All residential dwellings in the country are divided into six strata from poor to rich, based on physical quality and the surroundings of the dwellings following the methodology provided by the National Planning Department. Households are eligible for subsidies of up to 50 percent of the average service cost if they live in dwellings classified as Strata 1, up to 40 percent if they live in dwellings classified as Strata 2, and up to 15 percent if they live in dwellings classified as Strata 3. Households in Strata 4 pay the standard price, which is equal to the average cost of providing service. In principle, the system is designed to fund subsidies internally through surcharges. Households in Strata 5 and 6 pay surcharges that are no more than 20 percent of the cost recovery price. Industrial customers also pay a maximum of 20 percent above the cost recovery price.
Under this geographic targeting system, utilities only need consumers’ residential addresses to identify the subsidy recipients. In most cases, dwellings in the same strata are spatially connected and located in the same geographic areas, meaning two neighbors are usually identified as the same strata. This enables utilities to provide different service qualities to different strata, depending on the network design and associated local maintenance outlays. In contrast to this geographic targeting system, a targeting system that tags subsidized households based on their current socioeconomic circumstance would make it impossible for utilities to create quality variation across the strata. First, utilities may not be able to identify the subsidy recipients. Second, if one dwelling is identified as high strata while a nearby dwelling is identified as low strata, quality variation between these two dwellings is costly to implement and technically difficult to achieve. Therefore, the unique geographic targeting system used in Colombia creates the possibility for quality variation across strata.
In Colombia, 34 utilities provide service to residential and commercial users and each is a monopoly in its geographical service area. At present, these utilities are owned or partially owned by domestic or foreigner investors. Applying decentralized administration in utility services, municipal governments are required to create a balance account called the Solidarity Fund in which the value of subsidies granted and the number of surcharges are both registered. If utilities fail to balance subsidies through surcharges on their own customers, the difference can be (partly) financed through the transfer of public funds. From the Decentralization Law No. 715 (2001), the regular earmarked transfer from the nation to municipalities is the most important source of public funds, providing 86 percent of municipality funds. In addition, municipal governments are allowed to use an earmarked transfer to invest in utility assets.
In practice, most utilities fail to break even on revenues from system sales alone and are highly dependent on the transfer; however, it is difficult for the national government to deliver such a large reimbursement to utilities as promised. The result is that the utilities have a deficit from subsidizing the poor. The problem may be due to the socioeconomic composition of the customer base: a large number of dwellings located in lower strata [14].
4. Data
Data on perceived quality of electricity service was obtained from the Living Standard Measurement Survey (ECV: Encuesta de Calidad de Vida) in 2003, which includes about 20,000 families in most municipalities in Colombia. This survey also provides data about dwelling stratification, household demographic characteristics, and general living conditions. An increasing number of recent studies in energy sector apply household-level evidence [19]. We combine this household-level data with three municipal-level datasets: the fiscal performance index in 2003, from which we obtained the overall government transfer from the nation to each municipality divided by municipal government total income; the development index in 2003, which measures municipal socioeconomic conditions and public facilities; and the 1993 population census, which is used to calculate the population density for each municipality.
The dependent variable, perceived electricity quality, is constructed based on the answers to the ECV survey question “How was the quality of electricity service last month?” The answer to this question captures the family head’s evaluation of electricity quality, which can be “very bad”, “bad”, “regular”, “good”, or “very good” in the survey. These rankings are coded as “1 = very bad”, “2 = bad”, “3 = regular”, “4 = good”, and “5 = very good”. There can be multiple families living in one residential dwelling unit and each dwelling has at least one family. The model is estimated using family-level observations rather than dwelling-level observations, since each family in the same dwelling unit varies in demographic factors and family characteristics, which may affect the family head’s evaluation of electricity quality.
The main explanatory variables are dwelling stratification dummies from Strata 1 to Strata 6 and the government’s overall transfer from the nation to each municipality. The dwelling stratification is reported by family heads. The study drops 1172 observations that either report the strata beyond the stratification range or do not report the strata and about 20,000 observations remain. The stratification for each family living in the same dwelling is identical, so two dwellings from the sample are dropped where the family heads in the same dwelling report different strata. Dwelling stratification is used to capture consumer types. In theory, when facing a deficit from cross-subsidies, the utility provides better quality service to surcharged consumers (households living in Strata 5 and 6), while providing lower quality service to subsidized consumers (households living in Strata 1, 2, and 3).
Ideally, the study would use the government transfer to each electric utility to capture the effect of the transfer on service quality. In the absence of such data, the study uses the overall government transfer from the nation to each municipality as a proxy. Colombia utilizes a decentralized system: the municipal government is responsible for allocating the transfer to public facilities. Moreover, each utility is a monopoly in its geographical service area (municipal area). Thus, it is reasonable to use the municipal-level overall transfer as a proxy of the transfer that is available to the electric utility. This empirical analysis addresses both the general effect overall and the differential effect of the transfer across strata. On the one hand, as the government provides a higher transfer to a utility, service quality should be improved, regardless of dwelling strata, because a utility is able to maintain the system, improve technology, and hire employees that are more qualified. This general impact should neither vary across strata nor be directly related to the cross-subsidies. On the other hand, an increase in the government transfer can reduce the differentials in perceived quality across strata, which is related to the cross-subsidies. To standardize the government transfer, variable Transfer/capita (T/N) is applied in the study, which is defined as the ratio of national government transfer to municipal population.
The study uses family-level characteristics to control for the effect of demographic factors on reported quality. These variables, derived from the ECV survey questions, include family size, family income, dwelling ownership, family-head sex, education, and age. In addition, the study controls for two municipality-specific attributes: population density and socioeconomic level. Population density may reflect the effect of scale economies, which is crucial in the production and diffusion of electricity. Population density is calculated using the 1993 population census. The socioeconomic index is used to control for municipal heterogeneity in terms of overall public utility service and infrastructure development. The municipalities with the higher index value usually have a higher quality and a broader coverage of public facilities.
Moreover, one of the possible arguments that could emerge is that a utility with a larger deficit has generally worse quality and requires a larger transfer to cover its imbalance. This argument implies that the transfer may be correlated negatively with perceived quality, which is the opposite of the previous hypothesis about the positive general effect of the government transfer. Additionally, this relation may lead to an endogeneity problem for the independent variable, the government transfer, because it may be related to a utility’s financial deficit, which is omitted in regression (due to data limitation). To address this omitted variable, the socioeconomic index is used as a proxy for a utility’s financial situation. Thus, controlling for municipal socioeconomic situations, the paper focuses on how the transfer affects the perceived quality of electricity given the deficit level.
5. Methods and Results
5.1. Baseline Regression
Due to the discrete nature of the dependent variable, the study uses an ordered probit model in the regression analysis. The model is given by:
where the dependent variable ( is quality of electricity reported by the family head living in municipality ; the independent variables are dwelling stratification dummies and the transfer from nation to municipality (); the control variables are municipal characteristics, including socioeconomic index and population density ) and a vector of family characteristics; finally, captures the unobservable characteristics of the dwellings. Dwellings in Strata 4 are considered standard dwellings because these households pay the cost-recovered price. Their perceived quality is treated as the standard quality to which quality reported by households in other strata is compared. To facilitate interpretation of results, we omit Strata 4 in the regression model. The coefficients of the other strata are relative values compared to Strata 4. uses a standardized measurement, transfer per capita (T/N), which is defined as the sum of the transfer from nation to municipality divided by the municipal population . This is used as a proxy for a standardized transfer to the electricity sector.
The estimation results in Table 3 show that the coefficients of Strata 1, 2 and 3 are significantly negative, while the coefficients of Strata 5 and 6 are significantly positive. This implies a strong pattern between the dwelling stratification and service quality: that compared with the standard households in Strata 4, the subsidized households in Strata 1, 2, and 3 are more likely to report significantly lower quality electricity service; the surcharged households in Strata 5 and 6 are more likely to report significantly higher quality electricity service. Thus, although Colombia cross-subsidy system increase the affordability of electricity, utilities reduce service quality for those receiving subsidies. This raises the concern of whether the cross-subsidy system can improve the sustainability of the electricity service in Colombia.
To find whether the magnitudes of quality reduction are identical across subsidized strata, we compare the coefficients among lower strata dummies using the t test. We also compare the coefficients between high strata dummies to find whether the magnitudes of quality improvement are identical across surcharged strata. The results are presented in Table 4. For the subsidized households, those in Strata 1 are more likely to report significantly lower quality service than those in Strata 2 and 3, while there is no significant difference of perceived quality between those in Strata 2 and 3. For surcharged households, there is no significant difference of perceived quality between Strata 5 and 6. The results suggest that when facing a deficit, utilities suffer the greatest loss by providing service to households in Strata 1 who pay the lowest price, so utilities have an incentive to reduce the quality by the greatest extent in Strata 1.
The coefficients of indicate that the frequencies of perceived better quality are higher for households in municipalities that receive greater transfers. The estimation of is significantly positive, suggesting that the transfers improve the perceived electricity quality generally when the utilities face financial deficits, although quality variation still exists.
In addition to the main result, Table 3 presents other important findings. First, the municipal socioeconomic level is significantly positive, suggesting that the households are more likely to report better quality if they are in municipalities with higher social-economic levels, because those municipalities have a higher public utility standard and a stricter regulation administration. Second, the regression results indicate reduced quality in the presence of high population density, showing trade-offs between electricity generation and quality. Rassenfosse [20] finds the existence of a trade-off between the quantity and quality of firms’ inventions. Destandau and Garcia [9] find economies of scope between drinking water quantity and service quality. Third, households with large families are more likely to report low-level electricity quality, which may represent the negative effects of crowded family environments on quality evaluation.
5.2. Differential Effect of the Government Transfer
As indicated in theoretical studies [5,6], when the utility faces a deficit from cross-subsidies, its deficit is reduced as the utility receives more transfers from the government. The impacts are twofold. First, the utility has less incentive to reduce quality to subsidized consumers in order to reduce its deficit. Second, the utility will use the transfer to fund subsidies instead of using surcharges collected from high-income consumers, so the utility has less incentive to increase cash flows by improving their service quality. Based on these reinforcing effects, an increase in the transfer reduces quality differentials across consumer types. To test this, interactions are added between strata dummies and the standardized transfer. Aiken and West [21] recommend the use of centered regressors to reduce collinearity between the interaction terms and the variables that separately compose the interaction terms. Thus, to avoid collinearity among the regressors and to facilitate interpretation of the results, the study centers the standardized transfer , expressing this variable as deviations from its mean value, and interacts the centered standardized transfer variable ( with strata dummies:
where the coefficients measure the utility’s choice of service quality across consumer groups relative to Strata 4 when the standardized transfer is at its mean value. The interaction coefficients show the impact of variation from the mean transfer on perceived quality within the strata.
Table 5 presents the estimation results. First, the coefficients of the strata dummies show a pattern similar to previous results. Second, note that the transfer changes service quality differently across strata based on the interaction coefficients. For the subsidized households, an increase in the transfer improves perceived quality for households in Strata 2 and 3 significantly while it does not improve the service quality reported by households in Strata 1 significantly. For the surcharged households, an increase in the transfer does not change perceived quality for households in Strata 5 and 6 significantly. Moreover, for the standard households in Strata 4, an increase in the transfer improves their perceived quality significantly. The results here reflect a utility’s response to an increase in government transfers when facing a financial deficit; that response is explained below in the discussion of the marginal effects table (Table 6).
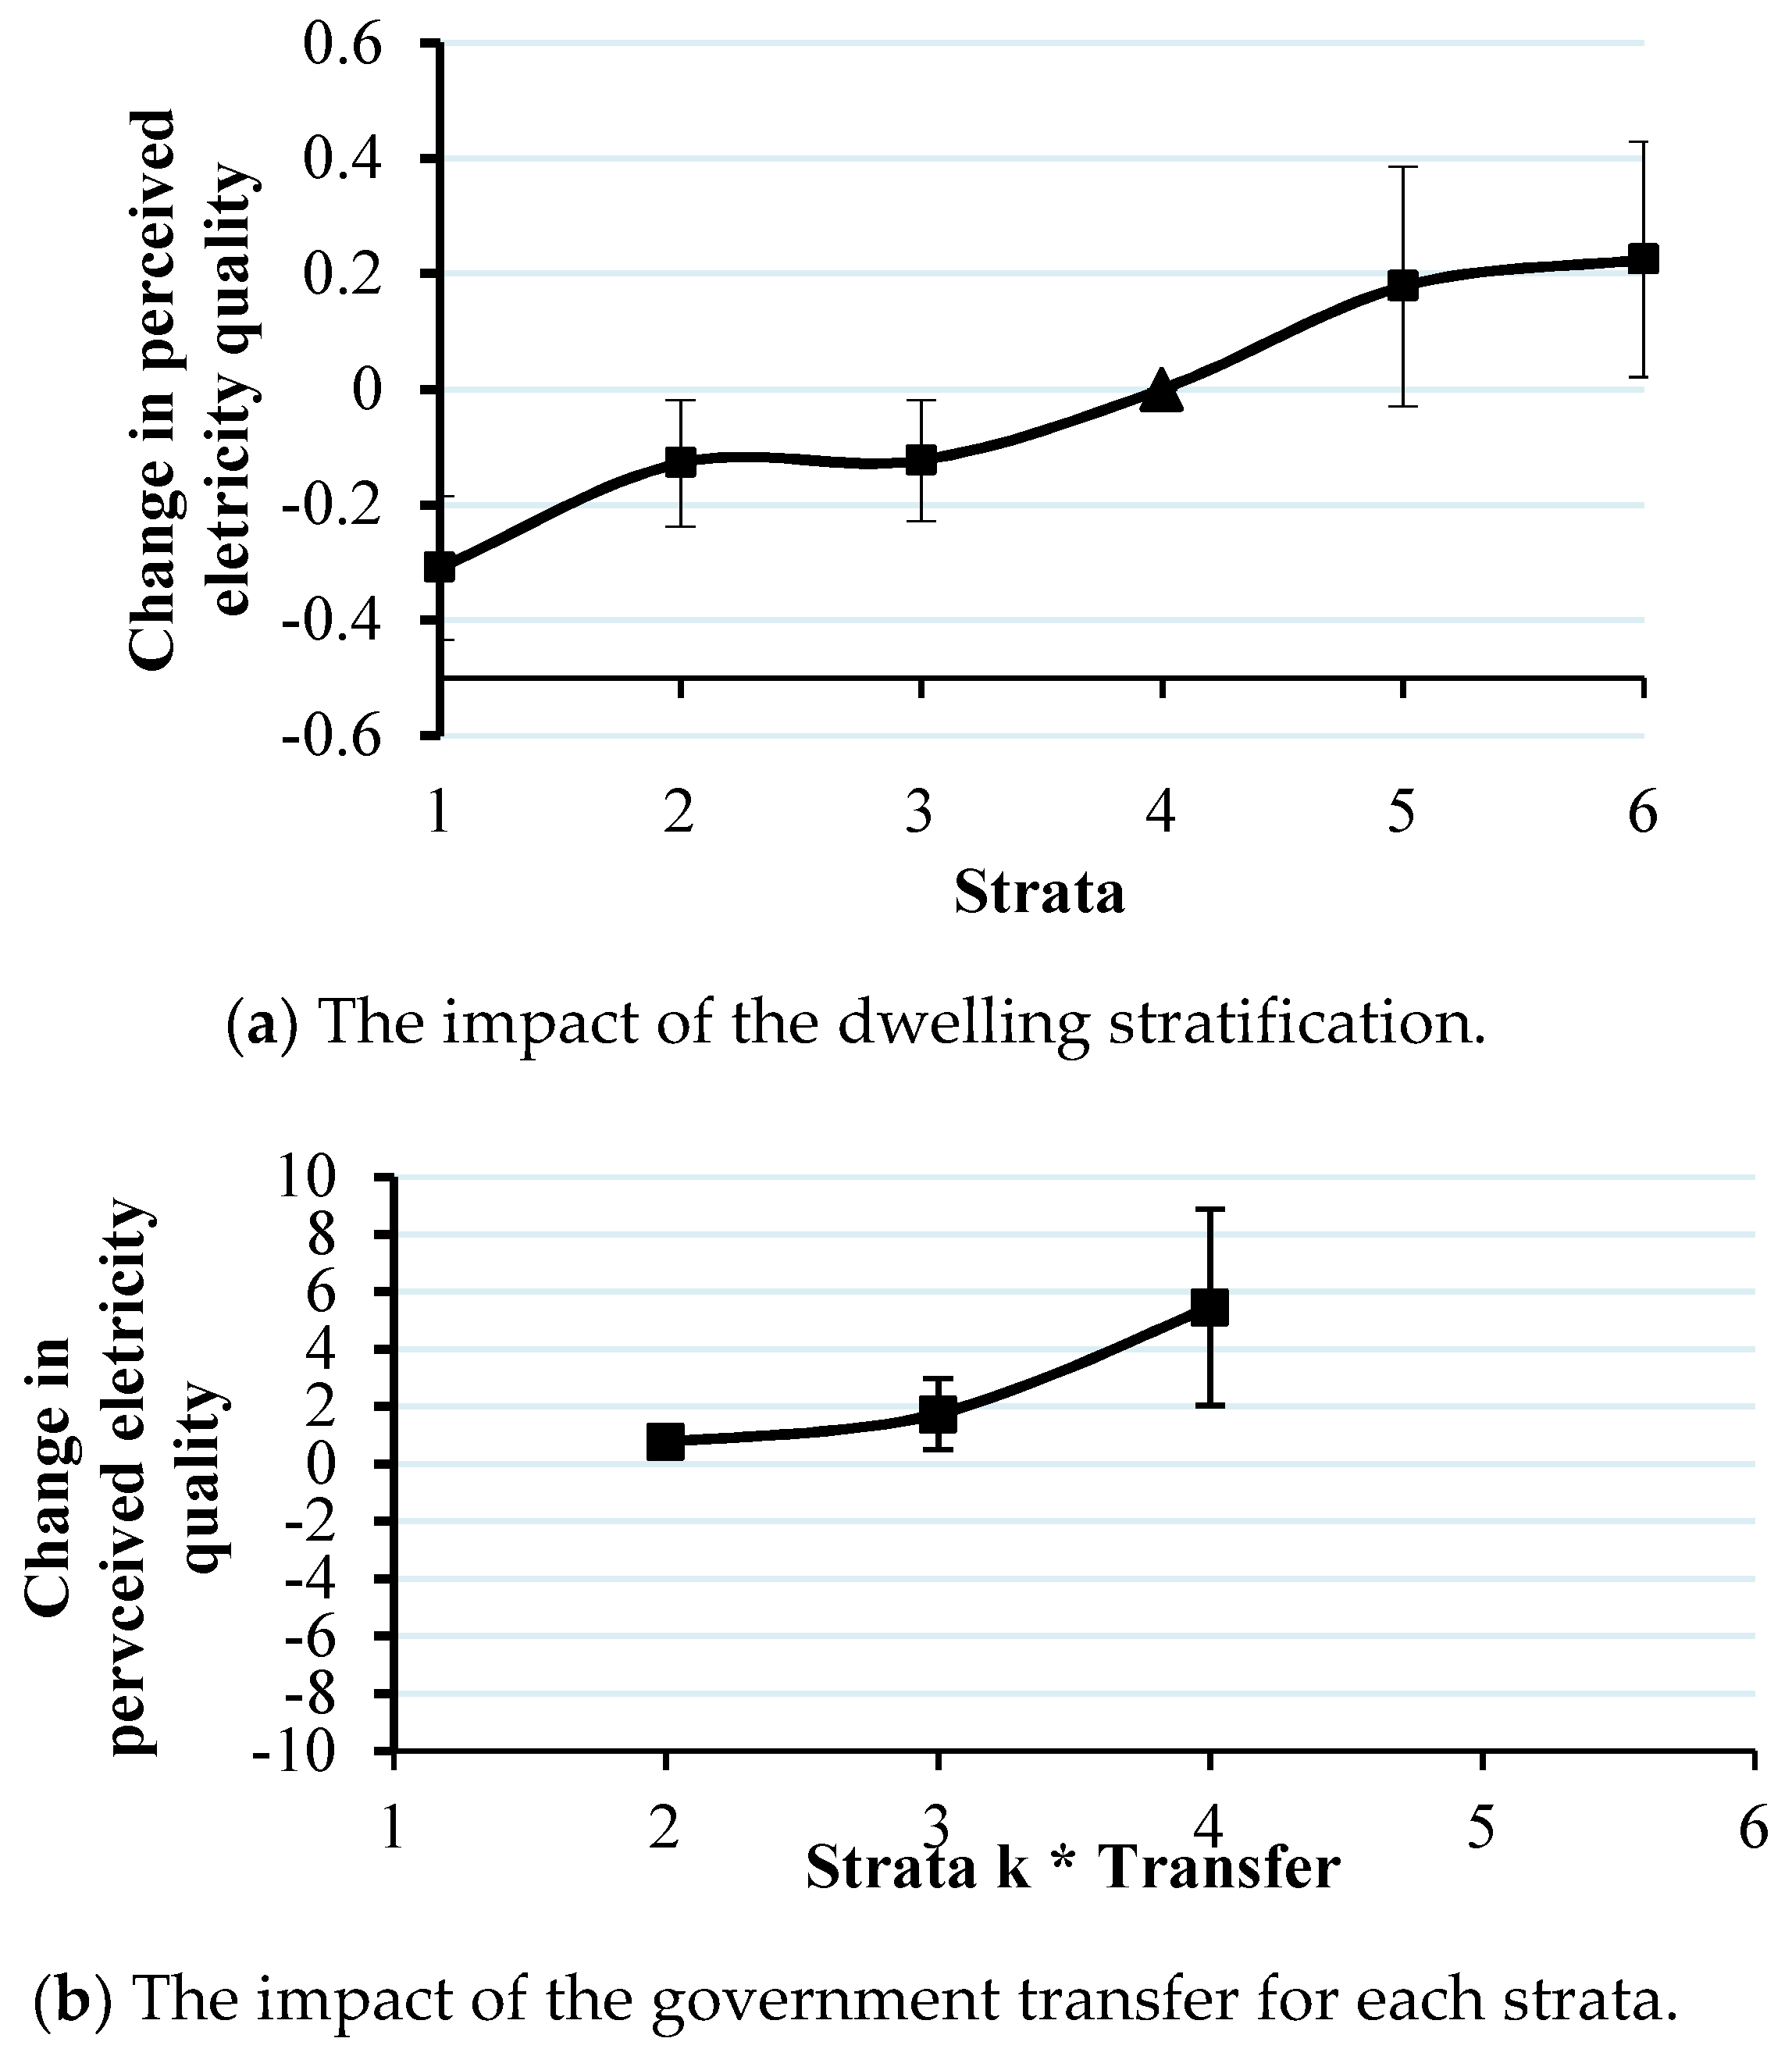
Figure 2 presents the result on the changes in perceived electricity quality from Table 5 visually. The figure plots regression estimates of and from Equation (2). Panel (a) shows the changes in perceived quality from living in the other strata compared with living in Strata 4. The Figure shows a negative effect of living in lower strata on perceived quality and a positive effect of living in higher strata on perceived quality. Panel (b) shows the impact of the change in the government transfer on perceived quality within strata. The figure clearly shows that an increase in the transfer improves service quality in lower strata (except Strata 1) but does not change service quality in higher strata.
In order to demonstrate the magnitude of the effect of dwelling stratification on perceived service quality, further computations are taken on the marginal effects of dwelling stratification and the transfer on the probability that households report one of five quality levels of electricity service (from “very bad” to “very good”).
Table 6 presents the marginal effects for an average family. To make these effects comparable, we compare them according to one standard deviation change instead of according to level changes. We also report these effects according to the variable changing from the minimum value to the maximum value. We explain two aspects of the results: the effect of dwelling stratification and the differential effect of the government transfer within strata.
First, the marginal effect of changing the strata dummy from 0 to 1 is interpreted as the change in perceived quality from living in Strata 4 (the standard strata) to living in any other strata (non-standard strata). For example, the results on the Strata 1 dummy suggest that due to quality variation created by the utility, living in Strata 1 will lead to a 2.53 percentage point increase in the probability that a household reports that it receives “bad” service quality as compared to living in Strata 4. At the same time, due to quality variation created by the utility, living in Strata 1 will lead to a 7.63 percentage point decrease in the probability that a household reports that it receives “good” service quality as compared to living in Strata 4. The impacts on the lower strata are striking, since the probability of the households in Strata 1 reporting “bad” quality is 10.57 percentage points higher than that of households in Strata 4, and the probability of the households in Strata 1 reporting “good” quality is 27.06 percentage points lower than that of households in Strata 4. Thus, quality variation created by the utility can explain a considerable amount of the difference in perceived quality across strata.
Second, the magnitudes of the economic impacts of the interaction terms show utilities’ differential responses to an increase in the transfer in terms of adjusting quality within strata. The results will be discussed for subsidized households, standard households, and surcharged households, respectively. Intuitively, the transfer has a positive effect on quality improvement regardless of strata, which is not related to the cross-subsidies. This general effect is shown in baseline regression. In addition, since the utility has a differential response to an increase in the transfer, the transfer has differential effects on quality within strata. This differential effect is related to cross-subsidies. The results of the interaction terms here are determined by these two effects.
For subsidized consumers, the results suggest that one standard deviation increase in the transfer leads to a 0.23 percentage point decrease in the probability of perceived “bad” service quality for Strata 2. If the transfer increases from the minimum to the maximum in the sample, the probability of perceived “bad” quality decreases by 3.16 percentage points. Given that 4.12 percent of households in Strata 2 report bad service quality, the impact is both statistically and economically significant. The result of interaction with Strata 3 shows a similar pattern. The result of interaction with Strata 1 shows that the transfer does not change the probability that households in Strata 1 receive a given quality level of electricity service. The results suggest that utilities tend to spend the transfer on quality improvement for the upper end of the lower strata (i.e., Strata 2 and 3) rather than for the lower end of the lower strata (i.e., Strata 1). This result can be explained by the likelihood that when the transfer fails to finance the deficit completely, the utilities prefer to improve the quality of service for dwellings that already have the basic equipment in place and are, therefore, less costly to work on.
For standard consumers, the coefficient of the interaction term with Strata 4 is significantly positive, which is the same as the interaction terms with the lower strata dummies. It is unclear from the theory why utilities spend the transfer on quality improvements within the standard strata. One reason could be that households in the standard strata pay less than the cost-recovery price in practice due to a low tariff in Colombia [14]; thus, utilities incur a deficit when they provide service to households in Strata 4 and the impact on net cash flow is similar to that of the lower strata. Accordingly, utilities reduce service quality to Strata 4 compared to the quality that they would provide if the standard consumers paid the cost-recovery price. When utilities receive a greater transfer from the government, they improve quality for Strata 4.
For surcharged consumers, the results of interaction terms show that an increase in the transfer does not affect the probability that households in Strata 5 and 6 receive a further change in the quality level of electricity service. As was mentioned in the discussion of the baseline regression, an increase in the transfer improves service quality generally; however, under a deficit, as the utility receives a greater transfer, the utility will use the transfer (instead of surcharge revenue) to reduce its deficit. Accordingly, the utility has less incentive to improve the service quality in high strata. For surcharged consumers, the positive general effect is offset by the negative strata-specific effect, so the net effect of transfers on service quality is insignificant.
6. Conclusions
Redistribution of affordable and reliable electricity service to the poor is crucial to sustainable social development. This study examines the Colombian underfunded cross-subsidies program and focuses on its effect on service quality across consumer types. Using an ordered probit model, the study finds clear effects on perceived electricity service quality. When the financial deficit is not fully covered by the external government transfer, utilities respond rationally to the system by creating quality differentials across the strata: the subsidized households in the lower strata report lower service quality than that reported by surcharged households in the higher strata; the greater the price discount subsidized households receive, the lower quality of service they receive. This quality variation can be reduced by an increase in the transfer. This study finds that the effects of an increase in the transfer differ across the strata. The utilities use larger transfers to improve quality for the upper end of the lower strata rather than for the lower end of the lower strata; the utilities do not improve service quality for the higher strata because they have become less dependent on their surcharges to cover their deficit.
It can be argued that to encourage equitable and sustainable development of public utilities in developing countries, a subsidy system should not only help the poor afford public utility services, but also ensure reliable supply. However, many empirical studies omit the consideration of quality when evaluating a subsidy system. This study provides a starting point for examining the effects of cross-subsidies and the government transfer on service quality. It is essential to direct developing countries’ social development onto a sustainable and equitable path by improving the affordability and reliability of public utility service. Due to data limitations, this study uses perceived electricity service quality reported by households as a proxy for actual quality experienced. Households’ evaluation of electricity quality may be affected by individual emotional factors, political environments, and governmental contexts. Future research can enhance this measurement by incorporating direct quality measures along separate dimensions (for example, on frequency and length of service interruption, and voltage stability). It is also interesting to explore the impact of these factors on households’ perception of service quality.
This paper has several policy implications. First, as a tool of redistribution, if cross-subsidies are partially funded the service quality can be affected. Second, it is important to realize that the effects of an increase in the government transfers on service quality can vary across consumer groups. Third, to ensure reliable service, it is necessary to fund subsidies and to strengthen quality regulation. Of course, incentives for cost-minimization must also be built into the regulatory process. Since government transfers generally play a crucial role in developing countries, programs that increase the transparency and reliability of transfers should be adopted by countries implementing utility cross-subsidy systems.
Author Contributions
F.L. conceived the research idea and co-wrote the paper; W.W. analyzed the data; Z.Y. co-wrote and revised the paper.
Acknowledgments
We are deeply indebted for invaluable guidance and comments from Chunrong Ai, Jonathan Hamilton, David Sappington, Sarah Hamersma, and Mark Jamison. We also thank Luis Hernando Gutiérrez and Juan Miguel for providing us with several databases. Financial support from Natural Science Foundation of Guangdong Province, China (No. 2017A030310566) and the Scientific Research Foundation for Returned Overseas Chinese Scholars, State Education Ministry, are also gratefully acknowledged.
Conflicts of Interest
The authors declare no conflict of interest.
Appendix A

Table A1.
Variable Description.
| Variable | Definition |
|---|---|
| Dependent variable | |
| Electricity Quality | Quality of electricity service reported by family heads: 1 = very bad, 2 = bad, 3 = regular, 4 = good, 5 = very good |
| Independent variable | |
| Strata 1 | =1 if the dwelling is classified as 1; =0 if otherwise. |
| Strata 2 | =1 if the dwelling is classified as 2; =0 if otherwise. |
| Strata 3 | =1 if the dwelling is classified as 3; =0 if otherwise |
| Strata 5 | =1 if the dwelling is classified as 5; =0 if otherwise |
| Strata 6 | =1 if the dwelling is classified as 6; =0 if otherwise. |
| The omitted variable is the dummy variable =1 if the dwelling is classified as 4 and 0 otherwise. | |
| Transfer/capita | The ratio of the national government transfer to municipal population. |
| Municipal characteristics | |
| Municipal Socioeconomic Index | Measure of the overall living conditions and public facilities. |
| Population Density | Municipal population density. |
| Households characteristics | |
| Family size | Family size. |
| Suburban | =1 if the dwelling is suburban; =0 if otherwise. |
| Rural | =1 if the dwelling is rural; =0 if otherwise. |
| The omitted variable is the dummy variable =1 if the dwelling is urban; =0 if otherwise. | |
| Female Family Head | =1 if the family head is female; =0 if otherwise. |
| Age | Family head’s age. |
| Cannot Read or Write | =1 if the family head cannot read or write; =0 if otherwise. |
| Rent | =1 if the household rents the dwelling; =0 if otherwise. |
| Own | =1 if the household owns the dwelling; =0 if otherwise. |
| The omitted variable is the dummy variable =1 if the household survives without pay and 0 otherwise. | |
| Edu2 | =1 if the family head’s highest level of education is preschool; =0 if otherwise. |
| Edu3 | =1 if the family head’s highest level of education is elementary school (Grade 1–5); =0 otherwise. |
| Edu4 | =1 if the family head’s highest level of education is middle and high school (Grade 6–13); =0 otherwise. |
| Edu5 | =1 if the family head’s highest level of education is technical school; =0 otherwise. |
| Edu6 | =1 if the family head’s highest level of education is some college but no degree; =0 otherwise. |
| Edu7 | =1 if the family head’s highest level of education is college graduate; =0 otherwise. |
| Edu8 | =1 if the family head’s highest level of education is a graduate degree; =0 otherwise. The omitted variable is the dummy variable =1 if the family head never attended school and =0 otherwise. |
References
- Laffont, J.; Ngbo, A. cross-subsidies and network expansion in developing countries. Eur. Econ. Rev. 2000, 44, 797–805. [Google Scholar] [CrossRef]
- Clarke, G.; Wallsten, S. Universal (ly Bad) Service: Providing Infrastructure Services to Rural and Poor Urban Consumers; World Bank Policy Research Working Paper No. 2868; World Bank: Washington, DC, USA, 2002. [Google Scholar]
- Estache, A.; Laffont, J.; Zhang, X. Universal service obligations in LDCs: The effect of uniform pricing on infrastructure access. J. Public Econ. 2006, 90, 1155–1179. [Google Scholar] [CrossRef]
- Goett, A.A.; Hudson, K.; Train, K. Customers’ choice among retail energy suppliers: The willingness-to-pay for service attributes. Energy J. 2000, 21, 1–28. [Google Scholar] [CrossRef]
- Mcrae, S. Infrastructure quality and the subsidy trap. Am. Econ. Rev. 2015, 105, 35–66. [Google Scholar] [CrossRef]
- Li, F.; Li, S. The impact of cross-subsidies on utility service quality in developing countries. Econ. Model. 2018, 68, 217–228. [Google Scholar] [CrossRef]
- Dubin, J.A.; McFadden, D.L. An econometric analysis of residential electric appliance holding and consumption. Econometrica 1984, 52, 345–362. [Google Scholar] [CrossRef]
- Hartman, R.S.; Naqvi, Z.F. Estimation of household preferences for long distance telecommunications carrier. J. Regul. Econ. 1994, 6, 197–220. [Google Scholar] [CrossRef]
- Destandau, F.; Garcia, S. Service quality, scale economics and ownership: An econometric analysis of water supply costs. J. Regul. Econ. 2004, 46, 152–182. [Google Scholar] [CrossRef]
- Lu, W.C. Electricity consumption and economic growth: Evidence from 17 Taiwanese industries. Sustainability 2016, 9, 50. [Google Scholar] [CrossRef]
- Hope, E.; Singh, B. Energy Price Increases in Developing Countries: Case Studies of Colombia, Ghana, Indonesia, Malaysia, Turkey, and Zimbabwe; World Bank Policy Research Working Paper No. 1442; World Bank: Washington, DC, USA, 1995. [Google Scholar]
- Breisinger, C.; Engelke, W.; Ecker, O. Leveraging fuel subsidy reform for transition in Yemen. Sustainability 2012, 4, 2862–2887. [Google Scholar] [CrossRef]
- Mirnezami, S.R. Electricity inequality in Canada: Should pricing reforms eliminate subsidies to encourage efficient usage? Util. Policy 2014, 31, 36–43. [Google Scholar] [CrossRef]
- Gόmez-Lobo, A.; Contreras, D. Water subsidy policies: A comparison of the Chilean and Colombian schemes. World Bank Econ. Rev. 2003, 17, 391–407. [Google Scholar] [CrossRef]
- Sawkins, J.W.; Reid, S. The measurement and regulation of cross subsidy. The case of the Scottish water industry. Util. Policy 2007, 15, 36–48. [Google Scholar] [CrossRef]
- Jamasb, T.; Pollitt, M.G. Electricity market reform in the European Union: Review of progress toward liberalization & integration. Energy J. 2005, 26, 11–41. [Google Scholar]
- Komives, K. Water, Electricity, and the Poor: Who Benefits from Utility Subsidies? The World Bank: Washington, DC, USA, 2005; ISBN 0-8213-6342-5. [Google Scholar]
- Medina, C.; Morales, L.F. Stratification and public utility services in Colombia: Subsidies to households or distortion of housing prices? Economica 2007, 7, 41–99. [Google Scholar] [CrossRef]
- Su, W.; Liu, M.; Zeng, S.; Štreimikienė, D.; Baležentis, T.; Ališauskaitė-Šeškienė, I. Valuating Renewable Microgeneration Technologies in Lithuanian Households: A Study on Willingness to Pay. J. Clean. Prod. 2018, 191, 318–329. [Google Scholar] [CrossRef]
- De Rassenfosse, G. Do Firms face a trade-off between the quantity and the quality of their inventions? Res. Policy 2013, 42, 1072–1079. [Google Scholar] [CrossRef]
- Aiken, L.S.; West, S.G.; Reno, R.R. Multiple Regression: Testing and Interpreting Interactions; Sage: London, UK, 1991; ISBN 0-7619-0712-2. [Google Scholar]
Figure 1.
Changes in perceived electricity quality (baseline regression). Note: The effect of living in Strata 4 (the standard strata) on perceived quality is standardized as 0. As compared with living in Strata 4, the changes in perceived quality from living in the other strata are estimated using the baseline regression of perceived electricity quality on strata dummies (see Equation (1) for details). The vertical axis is the coefficients of strata dummies (see Table 3 for details). Error bars use the confidence intervals based on the significance level of the coefficients. “▲” refers to 0 for Strata 4 by definition. “■” refers to the significant coefficients.
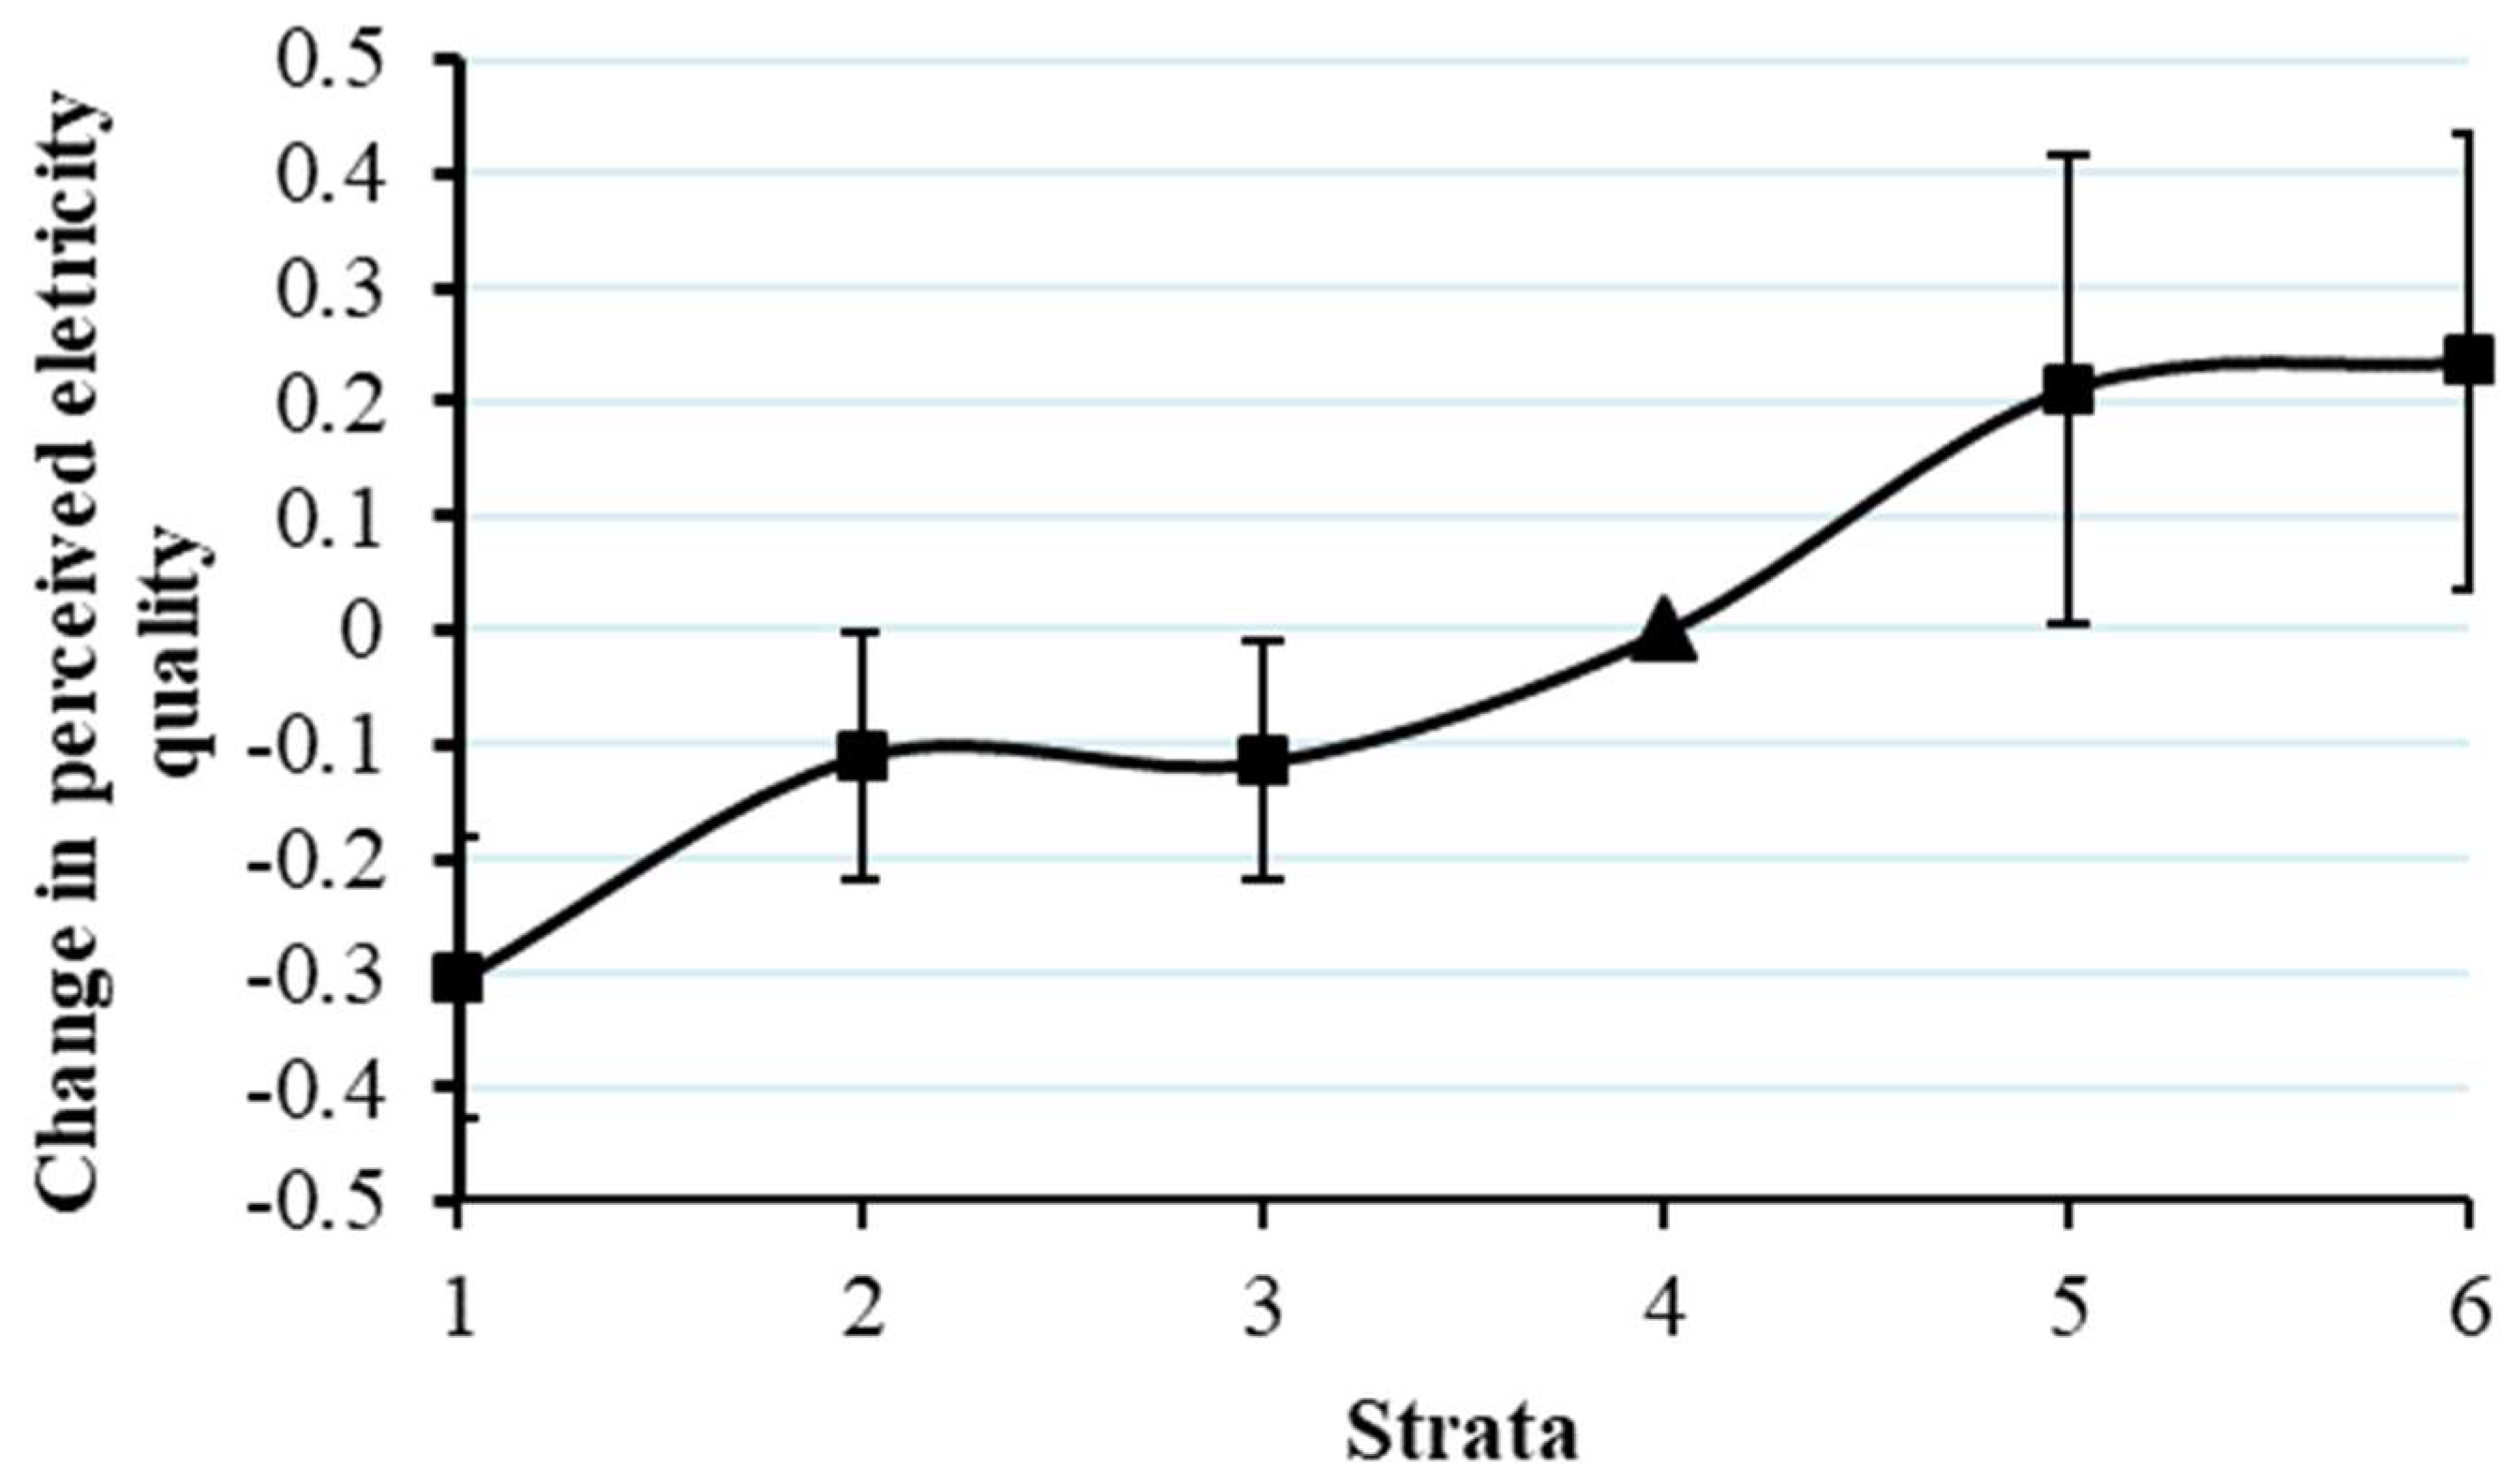
Figure 2.
Changes in perceived electricity quality (regression with interaction terms). Note: The changes in perceived electricity quality are estimated using Equation (2). Panel (a) shows the changes in perceived quality from living in the other strata compared with living in Strata 4 (the effect of living in Strata 4 is standardized as 0). The vertical axis is the coefficients of strata dummies (see Table 5 for details). Panel (b) shows the impact of variation from the mean transfer on perceived quality within strata. The vertical axis is the coefficients of interaction terms strata k* transfer (see Table 5 for details). Error bars use the confidence intervals based on the significance level of the coefficients. “▲” refers to 0 for Strata 4 since it is the standardized strata. “■” refers to the significant coefficients.

Table 1.
Summary statistics.
| Variable | Mean | Std. Dev. | Min | Max |
|---|---|---|---|---|
| Dependent variable | ||||
| Electricity Service Quality | 3.7506 | 0.6512 | 1 | 5 |
| Independent variable | ||||
| Strata 1 | 0.1607 | 0.3673 | 0 | 1 |
| Strata 2 | 0.3768 | 0.4846 | 0 | 1 |
| Strata 3 | 0.3373 | 0.4728 | 0 | 1 |
| Strata 5 | 0.0200 | 0.1399 | 0 | 1 |
| Strata 6 | 0.0215 | 0.1450 | 0 | 1 |
| Transfer/capita (T/N) | 18.7187 | 5.4833 | 5.7827 | 87.4664 |
| Municipal Socioeconomic Index | 54.3596 | 12.6104 | 15.0910 | 72.9597 |
| Population Density | 2387.70 | 1701.4 | 1.6268 | 133371.59 |
| Family size | 3.6869 | 1.8606 | 1 | 18 |
| Suburban | 0.0650 | 0.2466 | 0 | 1 |
| Rural | 0.0937 | 0.2914 | 0 | 1 |
| Female Family Head | 0.3228 | 0.4676 | 0 | 1 |
| Age | 47.0846 | 15.3786 | 12 | 99 |
| Cannot Read or Write | 0.0594 | 0.2364 | 0 | 1 |
| Rent | 0.3532 | 0.4780 | 0 | 1 |
| Own | 0.5252 | 0.4994 | 0 | 1 |
Note: This table shows summary statistics for all the variables except education level used in the main regression. Definitions for all variables are presented in Appendix Table A1.
Table 2.
Mean of perceived service quality by strata.
| Mean of Perceived Quality | Std. Dev. | Observations | |
|---|---|---|---|
| Strata 1 | 3.4133 | 0.8549 | 3269 |
| Strata 2 | 3.7622 | 0.6131 | 7665 |
| Strata 3 | 3.8336 | 0.5662 | 6864 |
| Strata 4 | 3.9007 | 0.5280 | 1702 |
| Strata 5 | 3.9754 | 0.4493 | 406 |
| Strata 6 | 3.9725 | 0.4781 | 437 |
Table 3.
Change in perceived electricity quality: baseline regression.
| Variables | |
|---|---|
| Strata 1 | −0.3047 *** (0.0479) |
| Strata 2 | −0.1098 *** (0.0424) |
| Strata 3 | −0.1149 *** (0.0404) |
| Strata 5 | 0.2116 *** (0.0796) |
| Strata 6 | 0.2353 *** (0.0776) |
| Transfer/capita (T/N) | 0.7861 *** (0.1699) |
| Municipal Socioeconomic Index | 0.0371 *** (0.0013) |
| Population Density | −0.0001 *** (0.0000) |
| Family Size | −0.0252 *** (0.0051) |
| Suburban | −0.0682 * (0.0382) |
| Rural | 0.0389 (0.0361) |
| Age | −0.0033 *** (0.0007) |
| Female Family Head | −0.0236 (0.0205) |
| Cannot Read or Write | −0.0616 (0.0620) |
| Rent | 0.0316 (0.0322) |
| Own | −0.0106 (0.0306) |
| Education Level Dummies | Yes |
| Observations | 19,611 |
| R-squared | 0.0859 |
Note: The regressions are run based on ordered probit model. The dependent variable “Perceived electricity quality” is based on answers to the question—“How was the quality of electricity service last month?” (1 = very bad, 2 = bad, 3 = regular, 4 = good and 5 = very good). The regressions include 8 dummies for education levels. All the variables are defined in Appendix Table A1. * significant at 10 percent level; *** significant at 1percent level.
Table 4.
t Test of strata dummy coefficients in baseline regression.
| Strata 1 = Strata 2 | 47.78 *** |
|---|---|
| Strata 2 = Strata 3 | 0.04 |
| Strata 5 Strata 6 | 0.06 |
Note: The estimates are based on the ordered probit model (1) in Table 3. All the variables are defined in Appendix Table A1. *** significant at 1 percent level.
Table 5.
Changes in perceived electricity quality (regression with interaction terms).
| Variables | |
|---|---|
| Strata 1 | −0.3092 *** (0.0484) |
| Strata 2 | −0.1278 *** (0.0427) |
| Strata 3 | −0.1230 *** (0.0409) |
| Strata 5 | 0.1783 *** (0.0803) |
| Strata 6 | 0.2249 *** (0.0789) |
| Strata1 × | 0.1409 (0.3126) |
| Strata2 × | 0.7785 *** (0.2175) |
| Strata3 × | 1.7391 *** (0.4782) |
| Strata4 × | 5.4628 *** (1.3294) |
| Strata5 × | −2.6687 (2.5220) |
| Strata6 × | 2.0418 (2.1418) |
| Municipality Controls | Yes |
| Family Controls | Yes |
| Observations | 19,611 |
| Pseudo R-sq | 0.0866 |
Note: The regressions are run based on an ordered probit model. The dependent variable “Perceived electricity quality” is based on answers to the question—“How was the quality of electricity service last month?” (1 = very bad, 2 = bad, 3 = regular, 4 = good and 5 = very good). The standardized transfer (transfer/capita) is centered as deviations from its mean value (). The regressions include municipality controls, family controls and 8 dummies for education levels, which are the same as in Table 3. All the variables are defined in Appendix Table A1. *** significant at 1 percent level.
Table 6.
Marginal effects on perceived quality for an “average” family.
| Variables | Change | Very Bad | Bad | Regular | Good | Very Good |
|---|---|---|---|---|---|---|
| Strata 1 | 0 to 1 | 0. 84 *** | 2.53 *** | 5.42 *** | −7.63 *** | −1.17 *** |
| Strata 2 | 0 to 1 | 0.28 *** | 0.92 *** | 2.17 *** | −2.79 *** | −0.58 *** |
| Strata 3 | 0 to 1 | 0.27 *** | 0.89 *** | 2.10 *** | −2.71 *** | −0.55 *** |
| Strata 5 | 0 to 1 | −0.30 *** | −1.09 *** | −2.87 *** | 3.28 *** | 0.99 *** |
| Strata 6 | 0 to 1 | −0.36 *** | −1.34 *** | −3.56 *** | 3.95 *** | 1.31 *** |
| Strata1 × | one standard dev. increase min to max | −0.01 −0.15 | −0.03 −0.50 | −0.07 −1.22 | 0.08 1.51 | 0.02 0.35 |
| Strata2 × | one standard dev. increase min to max | −0.07 *** −0.82 *** | −0.23 *** −3.16*** | −0.56 *** −9.06 *** | 0.70 *** 8.36 *** | 0.15 *** 4.68 *** |
| Strata3 × | one standard dev. increase min to max | −0.07 *** −1.08 *** | −0.23 *** −3.67 *** | −0.56 *** −9.11 *** | 0.71 *** 10.73 *** | 0.15 *** 3.13 *** |
| Strata4 × | one standard dev. increase min to max | −0.08 *** −3.10 *** | −0.28 *** −9.10 *** | −0.68 *** −21.53 *** | 0.86 *** 18.20 *** | 0.19 *** 15.54 *** |
| Strata5 × | one standard dev. increase min to max | 0.02 2.54 | 0.07 7.00 | 0.17 14.21 | −0.21 −20.28 | −0.05 −3.48 |
| Strata6 × | one standard dev. increase min to max | −0.02 −1.20 | −0.06 −4.09 | −0.15 −10.22 | 0.19 11.81 | −0.04 3.70 |
| Municipal Socioeconomic Index | one standard dev. increase min to max | −1.00 *** −15.87 *** | −3.27 *** −22.10 *** | −7.71 *** −26.09 *** | 9.77 *** 55.87 *** | 2.21 *** 8.19 *** |
| Population Density | one standard dev. increase min to max | 0.21 *** 3.14 *** | 0.69 *** 7.66 *** | 1.67 *** 13.47 *** | -2.11 *** -21.96 *** | -0.46 *** -2.31 *** |
| Family Size | one standard dev. increase min to max | 0.10 *** 1.31 *** | 0.33 *** 3.75 *** | 0.80 *** 7.64 *** | −1.01 *** −11.19 *** | −0.22 *** −1.52 *** |
| Suburban | 0 to 1 | 0.15 * | 0.51 * | 1.18 * | −1.54 * | −0.30 * |
| Rural | 0 to 1 | −0.07 | −0.24 | −0.59 | 0.73 | 0.17 |
| Age | one standard dev. increase min to max | 0.10 *** 0.62 *** | 0.35 *** 2.03 *** | 0.84 *** 4.70 *** | −1.06 *** −6.13 *** | −0.23 *** −1.22 *** |
| Female Family Head | 0 to 1 | 0.05 | 0.17 | 0.40 | −0.51 | −0.11 |
| Cannot Read or Write | 0 to 1 | 0.14 | 0.45 | 1.05 | −1.37 | −0.27 |
| Rent | 0 to 1 | −0.07 | −0.24 | −0.59 | 0.74 | 0.16 |
| Own | 0 to 1 | 0.02 | 0.05 | 0.13 | −0.17 | 0.04 |
Note: This table shows the marginal effects on perceived electricity quality for an “average” family. The results are based on the ordered probit model (1) in Table 5. The marginal effect level reported is in percentages. All the variables are defined in Appendix Table A1. * significant at 10 percent level; *** significant at 1 percent level.
© 2018 by the authors. Licensee MDPI, Basel, Switzerland. This article is an open access article distributed under the terms and conditions of the Creative Commons Attribution (CC BY) license (http://creativecommons.org/licenses/by/4.0/).
Share and Cite
MDPI and ACS Style
Li, F.; Wang, W.; Yi, Z. Cross-Subsidies and Government Transfers: Impacts on Electricity Service Quality in Colombia. Sustainability 2018, 10, 1599. https://doi.org/10.3390/su10051599
AMA Style
Li F, Wang W, Yi Z. Cross-Subsidies and Government Transfers: Impacts on Electricity Service Quality in Colombia. Sustainability. 2018; 10(5):1599. https://doi.org/10.3390/su10051599
Chicago/Turabian StyleLi, Fan, Wenche Wang, and Zelong Yi. 2018. "Cross-Subsidies and Government Transfers: Impacts on Electricity Service Quality in Colombia" Sustainability 10, no. 5: 1599. https://doi.org/10.3390/su10051599
Note that from the first issue of 2016, this journal uses article numbers instead of page numbers. See further details here.