The Dynamics of the Phenological Development of Four Woody Species in South-West and Central Slovakia

1
Faculty of Ecology and Environmental Sciences, Technical University in Zvolen, T.G. Masaryka 24, 960 53 Zvolen, Slovakia
2
Faculty of Management, University of Prešov, 17. Novembra 15, 080 01 Prešov, Slovakia
3
Faculty of Regional Development and Industrial Studies, Mendel University, Třída Generála Píky 2005/7, 613 00 Brno, Czech Republic
*
Author to whom correspondence should be addressed.
Sustainability 2018, 10(5), 1497; https://doi.org/10.3390/su10051497
Submission received: 10 April 2018
/
Revised: 2 May 2018
/
Accepted: 3 May 2018
/
Published: 9 May 2018
(This article belongs to the Section Environmental Sustainability and Applications)
Abstract
:Phenological observations record the dynamics of vegetation in relation to meteorological conditions as well as the long-term trends in relation to climate change. We processed 20-year data of the flowering (BBCH scale 60), leaves unfolding (BBCH 11) and ripening of fruits (BBCH 86) of four woody species in south-west and central Slovakia. The phenological year begins with the flowering of the hazel. This phenophase has the largest amplitude of onset (52–65 days) as well as interannual variability (sx = 20.2–33.4%) as it enters an unstable condition in early spring. At all stations, the order of phenophases is the same from the end of April. We found the highest vertical phenology gradient of the BBCH 60 Tilia cordata Mill. (6 days/100 m) and the smallest of BBCH 11 T. cordata (2.4 days/100). The statistically significant trends (p < 0.05) in shifting to the earlier period were in BBCH 60 Crataegus oxyacantha L. (0.4–0.5 days per year), BBCH 86 Corylus avellana L. (0.6 days per year), BBCH 60 Prunus spinosa L. (0.5–0,6 days per year) and BBCH 11 Prunus spinosa L. (0.6–0.7 days per year). These shifts indicate the change in the onset of the phenophases in south-west and central Slovakia.
1. Introduction
Phenology, together with the object of its study, is the basis for understanding ecological relationships in natural and modified systems on which human society is dependent [1,2]. Many studies have shown that climate change with rising temperature causes the prolongation of the vegetation period through the early onset of spring phenophases [3,4,5,6,7] and later onset of autumn phenophases [8,9,10]. The occurrence of drought associated with warming can affect production through a change in plant nutrient resorption in the following year, as well as shortening the vegetation period through earlier senescence [11]. The early wood formation can be influenced by the length of the previous vegetation period due to the assimilates produced [12,13]. As in the whole of Europe, Slovakia has experienced significant warming, the occurrence of long waves of heat and drought, and warmer winter temperatures [14,15,16] since the 1990s. Between 1871 and 2008, annual average air temperature was up by 1.1 °C and annual rainfall declined 5.6%, as well as there being snow cover in the whole area [17]. Decreasing trends in precipitation in the period 1981–2013 were detected in December in the northern part of Slovakia, while the central and southern parts revealed increasing trends. Most of the stations showed increasing summer precipitation trends, especially in July [18]. Forecasts by 2100 refer to the drying of southern regions, the growth of liquid precipitation, and the decrease in the number of days with an average freezing point at higher altitudes (800–1000 m a. s. l. [19]. In the case of such significant climatic changes, it is possible to assume the risk of damage to vegetation by late frosts, but also the shift of the range of species to higher altitudes or higher vegetation stages with more favorable temperature and humidity conditions [20]. Changing the reaction of woody plants to a warmer climate can also be monitored through a vertical phenological gradient that expresses a time shift in phenophases by one height, usually 100 m [21]. With climate change and temperature rise at higher altitudes, the equilibrium of temperature differences and a decrease in vertical phenological gradients can be expected. One of the analyses that can capture the variability of phenophases is a descriptive phenological calendar. It is also possible to express the average onset and sequence of phenophases and to evaluate changes in these characteristics in space and time [22,23]. The authors of phenological calendars capture the dynamics of vegetation on the territory at various scales [24,25,26,27,28]. The use of the phenological calendar also affects human health. As a pollen calendar, it provides information on the flowering and reproductive capacity of allergenic plant species, as well as information on daily and seasonal concentrations of pollen in a given territory, thus preventing human health damage [29,30,31].
The aims of our work was determine the stability of the order of the phenophases, and to determine the vertical phenological gradient and trends in onset (presumably due to warming climate) of the native woody (Corylus avellana L.; Tilia cordata Mill.) and shrubs species (Crataegus oxyacantha L.; Prunus spinosa L.) at three stations in central and at two stations in south-western Slovakia from 1996–2015.
2. Materials and Methods
2.1. Study Site
In order to demonstrate the differences in the occurrence of phenophases and to determine the order of the phenophases at different elevations, we selected five phenological stations: Stupava (180 m), Zvolen (300 m), Dolná Súča (400 m), Černová (475 m) and Kysihýbeľ (565 m) (Figure 1). The stations present different climate and location conditions. The environmental characteristics of the individual stations [21] are given in Table 1.
2.2. Data
We used data from the database of the Climatological and Meteorological Information System of the Slovak Hydrometeorological Institute in Bratislava to study the phenological conditions in Slovakia. In order to capture the variability of vegetation during the year, we processed the phenophases of flowering BBCH scale 60, leaves unfolding-BBCH 11 and ripe of fruit-BBCH 86 [13]. We focused on native species: C. avellana (european hazel-COA), C. oxyacantha (hawthorn-CO), P. spinosa L. (blackthorn-PS) and T. cordata (small-leaved lime-TC). The selection of monitoring areas and individual trees was carried out according to the followingprinciples: a locality corresponding to the character of the given area (slope, exposure), the number of observed samples was 10, the individuals were in good condition, and they were fertile and approximately the same age. Monitoring of phenophases was repeated three times a week. The observations were conducted between 1996 and 2015. From these data, we expressed shifts in the onset of phenophases indicating a change in climatic conditions. In the analysis, we expressed the average onset of phenophases (Ø) at stations in 180–565 m a. s. l. We also expressed the terms of the earliest (Min.) and later onset (Max.) over the period of 20 years. The difference between the least and the later onset of phenophases we have expressed as amplitude of the phenophases. Through the coefficient of variation (sx (%)) we identified the phenophases with the greatest and least interannual variability. The trend of onset of phenophases was calculated from linear regression as the slope of a regression line (day of the onset of phenophase against year). In regard to the altitudinal zonation, we calculated the change in phenophase with altitude as vertical phenology gradient (days/100 m). It was calculated from linear regression as a slope of the regression line (altitude against the day of onset of phenophase).
3. Results and Discussion
One of the results of phenological observations are phenological calendars. In the locality or in its wider area, with similar climatic conditions, they express the order of the phenophases of the autochthonous woody species in the 20-year period. The phenological activity of the observed phenophases in the conditions of Slovakia begins with the flowering of the European hazel (BBCH 60 COA) and ends with the ripening of fruits of the small-leaved lime (BBCH 86 TC). Phenological calendars confirmed the stability of the order of the phenophases at all stations. The small change in the order can be considered insignificant in terms of a small time difference (1 day). We have found differences in the onset of phenophases between stations with altitude growth, when the onset of phenophases was delayed with altitude growth (Figure 2, Figure 3, Figure 4, Figure 5 and Figure 6).
The phenophases BBCH 60 was delayed with altitude for 49 days for the hazel, 16 days for the blackthorn, 10 days for the hawthorn, and 26 days for small-leaved lime. The phenophases BBCH 11 was delayed with altitude for the hazel for 20 days, 16 days for the blackthorn, 15 days for the hawthorn, and 9 days for the lime. The phenophases BBCH 86 were delayed with altitude by 16 days for the hazel, 15 days for the blackthorn, 13 days for hawthorn, and 26 days for lime. In several cases the phenophases onset of BBCH 60 and BBCH 11 was found earlier at the lower altitude (Černová) than at the higher altitude (Kysihýbel). The mean onset of phenophases was the same or only slightly different. We found that time shifts were not only due to an altitude effect, where delays in phenological phases are expected to increase. Phenophases BBCH 60 and BBCH 11 also were dependent on the other abiotic factor- exposures. At a higher altitude station (Kysihýbel-565 m a. s. l.), the earlier average onset (3–4 days) of the phenophase BBCH 60 and the same average onset of BBCH 11 due to south exposure and morphology was found, and the lower Černová station had plain morphology. In the period under review, the most pronounced phenological deviations of early (2014) and late onset (1997) of spring phenophases were observed at almost all phenological stations. These extremes were the response of trees to the development of the spring season.
Changes in the temperature and precipitation conditions of the environment due to the altitude can also be expressed using the vertical phenological gradient (VPG). This expresses the change of climatic elements in relation to the phenophases of the woody species in the boundaries of their vertical occurrence. It determines the difference in phenophase occurrence between the lowest and highest phenological stations, converted to 100 meters altitude [19]. For the height interval of our stations (385 m a. s. l.) the VPG (Table 2) of BBCH 60 reached interval 3 (hawthorn)—6 (small-leaved lime) days/100 m, BBCH 11 2.4 (small-leaved lime)—4.9 (European hazel), BBCH 86 2.7 (blackthorn)—5.1 (small-leaved lime) day/100 m height. The research [31,32,33] that dealt with the change of phenophases with altitude in Slovakia found the VPG of BBCH 60 TC is 4.1–4.7 days/100 m, BBCH 11 TC is 2.9–3 days/100 m, and BBCH 86 TC is 1.7 days/100 m. The research [34] found a delay of BBCH 60 PS 3 days/100 m and BBCH 11 PS 3.6 days/100 m. Similar results were obtained in beech forests [6].
The research [35] showed that spring phenophases have advanced four weeks in Western and Central Europe, and have been delayed up to two weeks in Eastern Europe. The climate change over a longer period of time will also logically bring changes in the phenological characteristics of natural ecosystems. The magnitude of these changes is likely to depend on their stability and adaptation to new environmental conditions. One of the key indicators of change is also the trend analysis of phenophases. Climate change in the territory of Slovakia documents, according to our observations, for 20 years the early trend of the beginning of flowering (BBCH 60) of hazel, hawthorn and blackthorn at all stations by 4–12 days, which represents a shift of 0.2–0.6 days per year (Table 3, Table 4, Table 5, Table 6 and Table 7).
The earlier onset of spring phenophases due to climate change is valid for both Central Europe and Slovakia. From the results, we found that BBCH 60 COA started on average 7 days earlier than in 1964–1983 and 2 days earlier than 1994–2013 [36]. The trend of an earlier flowering of the hazel by 0.7 days per year in Slovakia and the Czech Republic, as well as leaves unfolding by 1.8 days in the Czech Republic and 0.5 days in Slovakia, were found by researchers [37]. Earlier flowering of the hazel by 0.24 days per year were also found in Poland [38] and 3.38 days per year in Germany, with a shift of 33 days from 2051–2080 [39]. At three of the five stations, the trend of earlier BBCH 60 PS and BBCH 60 CO was statistically significant. The research [40] expects earlier onset of this phenophase by 20 days to the year 2100. As in our case, earlier flowering by 0.21 days per year was found in southern Moravia [41]. The earlier development of trees can affect the number and size of early wood vessels due to the early spring temperature [42,43]. The authors [13] observed damage after the sudden frost in May in some individuals of the Pedunculate oak, but they did not validate the hypothesis that the springtime ground frost had a negative effect on either tree-ring width or the number and size of earlywood vessels. The authors [44,45] said that species with late leaf development responded to climate change on average less than species with earlier leaf development. The BBCH 60 TC was started in the summer period, averaging from 6 June to 2 July at stable air temperature. The trend of this phenophase at Zvolen and Kysihýbel stations did not indicate any shift. At other stations, the trend changes were reflected in earlier and later shifts of 2 days without statistical significance. The statistically significant trend of earlier flowering of the small-leaved lime by about 2.8–4.4 days per year was found in Hungary [46]. In the north, in the central part of European Russia, the shift in this phenophase was 0.03–0.13 days per year [47]. We recorded the average earliest onset of leaves unfolding (BBCH 11) of hawthorn and blackthorn on 8April at the lowest altitude station (Stupava 180 m). At the latest, the first leaves were unfolded of the small-leaved lime on the 3 May at the highest altitude station (Kysihýbel 565 m). Trend analyses showed, with the exception of the Stupava station, a shift of 2–14 days in most of the monitored species. The earlier development of small-leaved lime leaves was not statistically significant as in Lithuania, where authors reported the earlier onset of this phenophase 0.18 days per year [48]. In our research were trends of a shift (12–14 days) of BBCH 60 PS to the earlier date that were statistically significant at most of the stations. The phenophase BBCH 86 began depending on the species and altitude of the phenological station. The trend analyses showed earlier onset of BBCH 86 of the hazel, hawthorn and blackthorn at most of the cases by 4–12 days without statistical significance. The exception was small-leaved lime, where we recorded an insignificant trend of later onset of 6–10 days (except at the Černová station).
The phenological response of tree species to the development and course of abiotic conditions, especially air temperature and rainfall, can also be evaluated using the variation coefficient (sx ). The highest variation coefficient was found for BBCH 60 COA (20.2–33.4%) regardless of the altitude, similar to other research [35,49]. This indicates the unstable weather and temperature fluctuations in the early spring period. The equable course of onset of phenophases occurred at the end of April by decreasing the coefficients of variation. The flowering of the small-leaved lime (BBCH 60 TC), as a late flowering species, had the lowest variation coefficient (2.7–3.3%) compared to other early flowering species. Lower variability in the onset of late-flowering species was also found by researchers [50]. Phenophases that occurred between the beginning of May and end of September had the lowest coefficients of variation (1.5–6.0%), likely because temperature conditions are stable and have the lowest variability during that period. For example, the variation coefficient of the BBCH 86 COA was 2.1–3.8%, which is comparable to the results from the Czech Republic (sx = 2%) and Slovakia (sx = 0.9%) [37].
4. Conclusions
We found only a non-significant difference in the order of onset of spring phenophases. For almost all phenophases, we have seen a decreasing trend in the onset of phenophases. With increasing altitude, we found a delay in all of the phenophases. The greatest variability had the first phenophase-flowering of the European hazel. On the other hand, the lowest variability was found at the phenophases that had started since the end of April. The smallest amplitude in the onset was found in the leaves unfolding of the small-leaved lime. The extremes in the onset of the phenophases indicates the earliest onset in 2014 and the latest in 1997. The results present reactions of the phenophases to changed environmental conditions in south-west and central Slovakia.
Author Contributions
The manuscript was approved by all authors for publication. D.B. and J.Š. conceived and J.F. designed the study; D.B. and I.V. analyzed the data; D.B. wrote the paper.
Acknowledgments
The paper was funded by the VEGA project No. 1/0111/18 and APVV-15-0425 project. VEGA 1/0127/16 and KEGA 011PU-4/.
Conflicts of Interest
The authors declare no conflict of interest.
References
- Angelovičová, L.; Boguská, Z.; Fazekašová, D. Diversity and Quality of Selected Components of the Environment in the Middle Spis; University of Prešov: Prešov, Slovakia, 2015; p. 122. [Google Scholar]
- Fazekašová, D.; Boguská, Z.; Fazekaš, J.; Škvareninová, J.; Chovancová, J. Contamination of vegetation growing on soil and substrates in the unhygienic region of central Spiš (Slovakia) polluted by heavy metals. J. Environ. Biol. 2016, 37, 1335–1340. [Google Scholar] [PubMed]
- Piao, S.; Friedlingstein, P.; Ciais, P.; Viovy, N.; Demarty, J. Growing season extension and its impact on terrestrial carbon cycle in the Northern Hemisphere over the past 2 decades. Glob. Biogeochem. Cycles 2007, 21, GB3081. [Google Scholar] [CrossRef]
- Baldocchi, D. Breathing of the terrestrial biosphere: Lessons learned from a global network of carbon dioxide flux measurement systems. Aust. J. Bot. 2008, 56, 1–26. [Google Scholar] [CrossRef]
- Stöckli, R.; Vidale, P.L. European plant phenology and climate as seen in a 20-year AVHRR land-surface parameter dataset. Int. J. Remote Sens. 2004, 25, 3303–3330. [Google Scholar] [CrossRef]
- Lukasova, V.; Lang, M.; Skvarenina, J. Seasonal changes in NDVI in relation to phenological phases, LAI and PAI of beech forests. Balt. For. 2014, 20, 248–262. [Google Scholar]
- Stehnová, E.; Stredová, H. Phenology of Sugar Beet in the Context of the Water Erosion Risk. Listy Cukrovarnické Reparské 2016, 132, 380–386. [Google Scholar]
- Jeong, S.-J.; Ho, C.-H.; Gim, H.-J.; Brown, M.E. Phenology shifts at start vs. end of growing season in temperate vegetation over Northern Hemisphere for the period of 1982–2008. Glob. Change Biol. 2011, 17, 2385–2399. [Google Scholar] [CrossRef]
- Zhu, W.; Tian, H.; Xu, X.; Pan, Y.; Chen, G.; Lin, W. Extension of the growing season due to delayed autumn over mid and high latitudes in North America during 1982–2006. Glob. Ecol. Biogeogr 2011, 21, 260–271. [Google Scholar] [CrossRef]
- Gill, A.L.; Gallinat, A.S.; Sanders-DeMott, R.; Rigden, A.R.; Gianotti, D.J.S.; Mantooth, J.A.; Templer, P.H. Changes in autumn senescence in northern hemisphere deciduous trees: A meta-analysis of autumn phenology studies. Ann. Bot. 2015, 116, 875–888. [Google Scholar] [CrossRef] [PubMed]
- Estiarte, M.; Peñuelas, J. Alteration of the phenology of leaf senescence and fall in winter deciduous species by climate change: Effects on nutrient proficiency. Glob. Change Biol. 2015, 21, 1005–1017. [Google Scholar] [CrossRef] [PubMed]
- Pukacka, S. Wzrost i rozwój. In Dęby Quercus robur L.; Quercus petraea Liebl. Nasze drzewa leśne; Bugała, W., Ed.; Polska Akademia Nauk, Instytut Dendrologii: Poznań-Kórnik; Kórnik, Poland; Volume 11, pp. 165–303.
- Puchałka, R.; Koprowski, M.; Gričar, J.; Przybylak, R. Does tree-ring formation follow leaf phenology in Pedunculate oak (Quercus robur L.)? Eur. J. For Res. 2017, 136, 259–268. [Google Scholar] [CrossRef]
- Střelcová, K.; Kurjak, D.; Leštianska, A.; Kovalčíková, D.; Ditmarová, Ľ.; Škvarenina, J.; Ahmed, Y.A.R. Differences in transpiration of Norway spruce drought stressed trees and trees well supplied with water. Biologia 2013, 68, 1118–1122. [Google Scholar] [CrossRef]
- Kušmíreková, J. Analysis of the occurence of extreme meteorological events in slovakia during the period 1951–2013. Met. J. 2014, 17, 67–74. [Google Scholar]
- Vaníčková, M.; Stehnová, E.; Středová, H. Long-term development and prediction of climate externity and prediction of climate extremity and heat waves occurrence: Case study for agricultural land. CGG 2017, 47, 247–260. [Google Scholar]
- Ďurský, J.; Škvarenina, J.; Minďáš, J.; Miková, A. Regional analysis of climate change impact on Norway spruce (Picea abies L. Karst.) growth in Slovak mountain forests. J. For Sci. 2006, 52, 306–315. [Google Scholar] [CrossRef]
- Zeleňáková, M.; Vido, J.; Portela, M.M.; Purcz, P.; Blištán, P.; Hlavatá, H.; Hluštík, P. Precipitation Trends over Slovakia in the Period 1981–2013. Water 2017, 9, 922. [Google Scholar] [CrossRef]
- Lapin, M.; Gera, M.; Hrvoľ, J.; Melo, M.; Tomlain, J. Possible Inpacts of Climate Change on Hydrologic Cycle ina Slovakia and Results of Observations in 1951–2007. Biologia 2009, 64, 454–459. [Google Scholar] [CrossRef]
- Škvarenina, J.; Križová, E.; Tomlain, J.N. Impact of the climate change on the water balance of altitudinal vegetation stages in Slovakia. Ekologia-Bratislava 2004, 23, 13–29. [Google Scholar]
- Krečmer, V. Bioclimatological Dictionary Terminological and Explanatory, 1st ed.; Akadémia: Praha, Czech Republic, 1980; p. 242. [Google Scholar]
- Ahas, R.; Aasa, A. Developing Comparative Phenological Calendars. In Phenology: An Integrative Environmental Science, 1st ed.; Schwartz, M.D., Ed.; Kluwer Academic Publishers: Dordrecht, The Netherlands; Boston, MA, USA; London, UK, 2003; pp. 301–318. ISBN 1-4020-1580-1. [Google Scholar]
- Jeanneret, F.; Rutishauser, M. Seasonality as a core business of phenology. In Phenological Research, 1st ed.; Hudson, I.L., Keatley, M.R., Eds.; Springer: Dordrecht, The Netherlands; Heidelberg, Germany; London, UK; New York, NY, USA, 2010; pp. 63–74. ISBN 978-90-481-3334-5. [Google Scholar]
- Defila, C. Pflanzenphänologische Kalender ausgewählter Stationen in der Schweiz/Calendriers phytophänologiques en Suisse 1951–1990. Beih. Ann. Schweiz. Meteorol. Anst. 1992, 30, 233. [Google Scholar]
- Schnelle, F. Pflanzen-Phänologie; Akademishe Verlagsgesellschaft, Geest und Portig: Leipzig, Germany, 1955; pp. 166–210. [Google Scholar]
- Penuelas, J.; Filella, I. Responses to a Warming World. Science 2001, 294, 793–794. [Google Scholar] [CrossRef] [PubMed]
- Brablec, J. Two Studies about Phenology. MZ 1952, 5, 74–75. [Google Scholar]
- Hájková, L.; Kohut, M.; Nekovář, J.; Novák, M.; Richterová, D. Časová a prostorová proměnlivost vybraných indikátorů fenologického předjaří za období 1991–2009. In Atlas Fenologických Poměrů Česka, 1st ed.; Hájková, L., Voženílek, V., Tolasz, R., Kohut, M., Možný, M., Nekovář, J., Novák, M., Reitschläger, J.D., Richterová, D., Stříž, M., et al., Eds.; ČHMÚ: Praha, Czech Republic; Olomouc, Czech Republic, 2012; p. 311. ISBN 978-80-86690-98-8. [Google Scholar]
- Kruczek, A.; Puc, M.; Wolski, T. Poaceae, Secale spp. and Artemisia spp. pollen in the air at two sites of different degrees of urbanisation. Ann. Agric. Environ. Med. 2017, 24, 70–74. [Google Scholar] [CrossRef] [PubMed]
- Guedes, A.; Ribeiro, N.; Ribeiro, H.; Oliveira, M.; Noronha, F.; Abreu, I. Comparison between urban and rural pollen of Chenopodium alba and characterization of adhered pollutant aerosol particles. J. Aerosol. Sci. 2009, 40, 81–86. [Google Scholar] [CrossRef]
- Melo, M. Influence of geographic position on the onset of phenological phases of small-leaved lime in Slovakia. In Phenological Response of Climatic Variability, 1st ed.; Rožnovský, J., Litschmann, T., Vyskot, I., Eds.; Mendel University in Brno: Brno, Czech Republic, 2006; ISBN 80-86690-35-0. [Google Scholar]
- Škvareninová, J. Vplyv Klimatických Podmienok na Fenologickú Odozvu Ekosystémov, 1st ed.; Technická Univerzita vo Zvolene: Zvolen, Slovakia, 2013; p. 132. ISBN 978-80-228-2598-6. [Google Scholar]
- Škvareninová, J.; Škvarenina, J. Development of phenological elevation gradients and trends of selected phenological phases of Tilia cordata Mill. in Slovakia. MZ 2013, 16, 87. [Google Scholar]
- Schieber, B. Effect of altitude on phenology of selected forest plant species in Slovakia (Western Carpathians). Folia Oecologica 2014, 41, 75–81. [Google Scholar]
- Ahas, R.; Aasa, A.; Menzel, A.; Fedotova, V.G.; Scheifinger, H. Changes in European spring phenology. Int. J. Climatol. 2002, 22, 1727–1738. [Google Scholar] [CrossRef]
- Škvareninová, J.; Benčaťová, B.; Škvarenina, J.; Šiška, B.; Hríbik, M.; Lafférsová, J. Variation of spring phenological phases and airborne pollen grains of the European hazel (Corylus avellana L.) in the Zvolen basin (Slovakia) as influenced by meteorological factors. Prace Geograficzne 2011, 126, 85–94. [Google Scholar]
- Hájková, L.; Kohut, M.; Nekovář, J.; Novák, M.; Richterová, D. Časová a prostorová proměnlivost vybraných indikátorů fenologického předjaří za období 1991–2009. In Proceedings of the 31st Konference Člověk ve Svém Pozemském a Kosmickém Prostředí, Úpice, Czech Republic, 18–20 May 2010; pp. 94–98, ISBN 978-80-86303-26-0. [Google Scholar]
- Jabłońska, K.; Kwiatkowska-Falińska, A.; Czernecki, B.; Walawender, J.P. Changes in spring and summer phenology in Poland–responses of selected plant species to air temperature variations. Pol. J. Ecol 2015, 63, 311–319. [Google Scholar] [CrossRef]
- Schmidt, G.; Holy, M.; Pesch, R. Changing Plant Phenology in germany Due to the Effects of Global Warming. Int J Climatol 2010, 2, 73–84. [Google Scholar] [CrossRef]
- Sparks, T.H.; Carey, P.D. The response of species to climate over two centuries: An analysis of the Marsham phenological record, 1736−1947. J. Ecol. 1995, 83, 321–329. [Google Scholar] [CrossRef]
- Bartošova, L.; Bauer, Z.; Trnka, M.; Štěpanek, P.; Žalud, Z. Climatic factors and their influence on onset and duration of phenological phases of chosen plants at locations south Moravia during 196–2007. Acta Univ. Agric. Silvic. Mendel. Brun. 2010, LVIII, 35–44. [Google Scholar] [CrossRef]
- González-González, B.D.; Rozas, V.; García-González, I. Earlywood vessels of the sub-Mediterranean oak Quercus pyrenaica have greater plasticity and sensitivity than those of the temperate Q. petraea at the Atlantic–Mediterranean boundary. Trees 2013, 28, 237–252. [Google Scholar] [CrossRef]
- Fonti, P.; García-González, I. Earlywood vessel size of oak as a potential proxy for spring precipitation in mesic sites. J. Bio. Geogr. 2008, 35, 2249–2257. [Google Scholar] [CrossRef]
- Morin, X.; Lechowicz, M.J.; Augspurger, C.; O’Keefe, J.; Viner, D.; Chuine, I. Leaf phenology in 22 North American tree species during the 21st century. Glob Change Biol 2009, 15, 961–975. [Google Scholar] [CrossRef]
- Abu-Asab, M.S.; Peterson, P.M.; Shetler, S.G.; Orli, S.S. Earlier plant flowering in spring as a response to global warming in the Washington, DC, area. Biodivers Conserv 2001, 10, 597–612. [Google Scholar] [CrossRef]
- Szabó, B.; Vincze, E.; Czúcz, B. Flowering phenological changes in relation to climate change in Hungary. Int. J. Biometeorol. 2016, 60, 1347–1356. [Google Scholar] [CrossRef] [PubMed]
- Minin, A.A.; Voskova, A.V. Homeostatic Responses of plants to Modern Climate Change: Spatial and Phenological Aspects. Russ J Dev Biol 2014, 45, 127–133. [Google Scholar] [CrossRef]
- Juknys, R.; Sujetovienė, G.; Žeimavičius, K.; Šveikauskaitė, I. Comparison of Climate Warming Induced Changes in Silver Birch (Betula Pendula Roth) and Lime (Tilia cordata Mill.) Phenology. Balt For. 2012, 18, 25–32. [Google Scholar]
- Snopková, Z.; Hrušková, K.; Turisová, I.; Gápel, P. The Begining of Selected Phenological Phases Hazel (Corylus avellana L.) during the Period 2001 to 2011 in Slovakia Environmental Changes and Adaptation Strategies. Available online: http://cbks.cz/SbornikSkalice2013/pdf/Snopkova.pdf (accessed on 29 March 2014).
- Miller-Rushing, A.; Primack, R.B. Global Warming and Flowering Times in Thoreau’s Concord: A Community Perspective. Ecology 2008, 89, 332–341. [Google Scholar] [CrossRef] [PubMed]
Figure 1.
The location of phenological stations.

Figure 2.
Phenology calendar of the onset and order of the phenophases at Stupava station from 1996–2015 (I–XII—months; BBCH scale 60—flowering; BBCH 11—leaves unfolding; BBCH 86—ripe of fruit; COA—C. avellana; CO—C. oxyacantha; PS—P. spinosa L.; TC—T. cordata Mill.; 1–31—the mean onset of the phenophases).

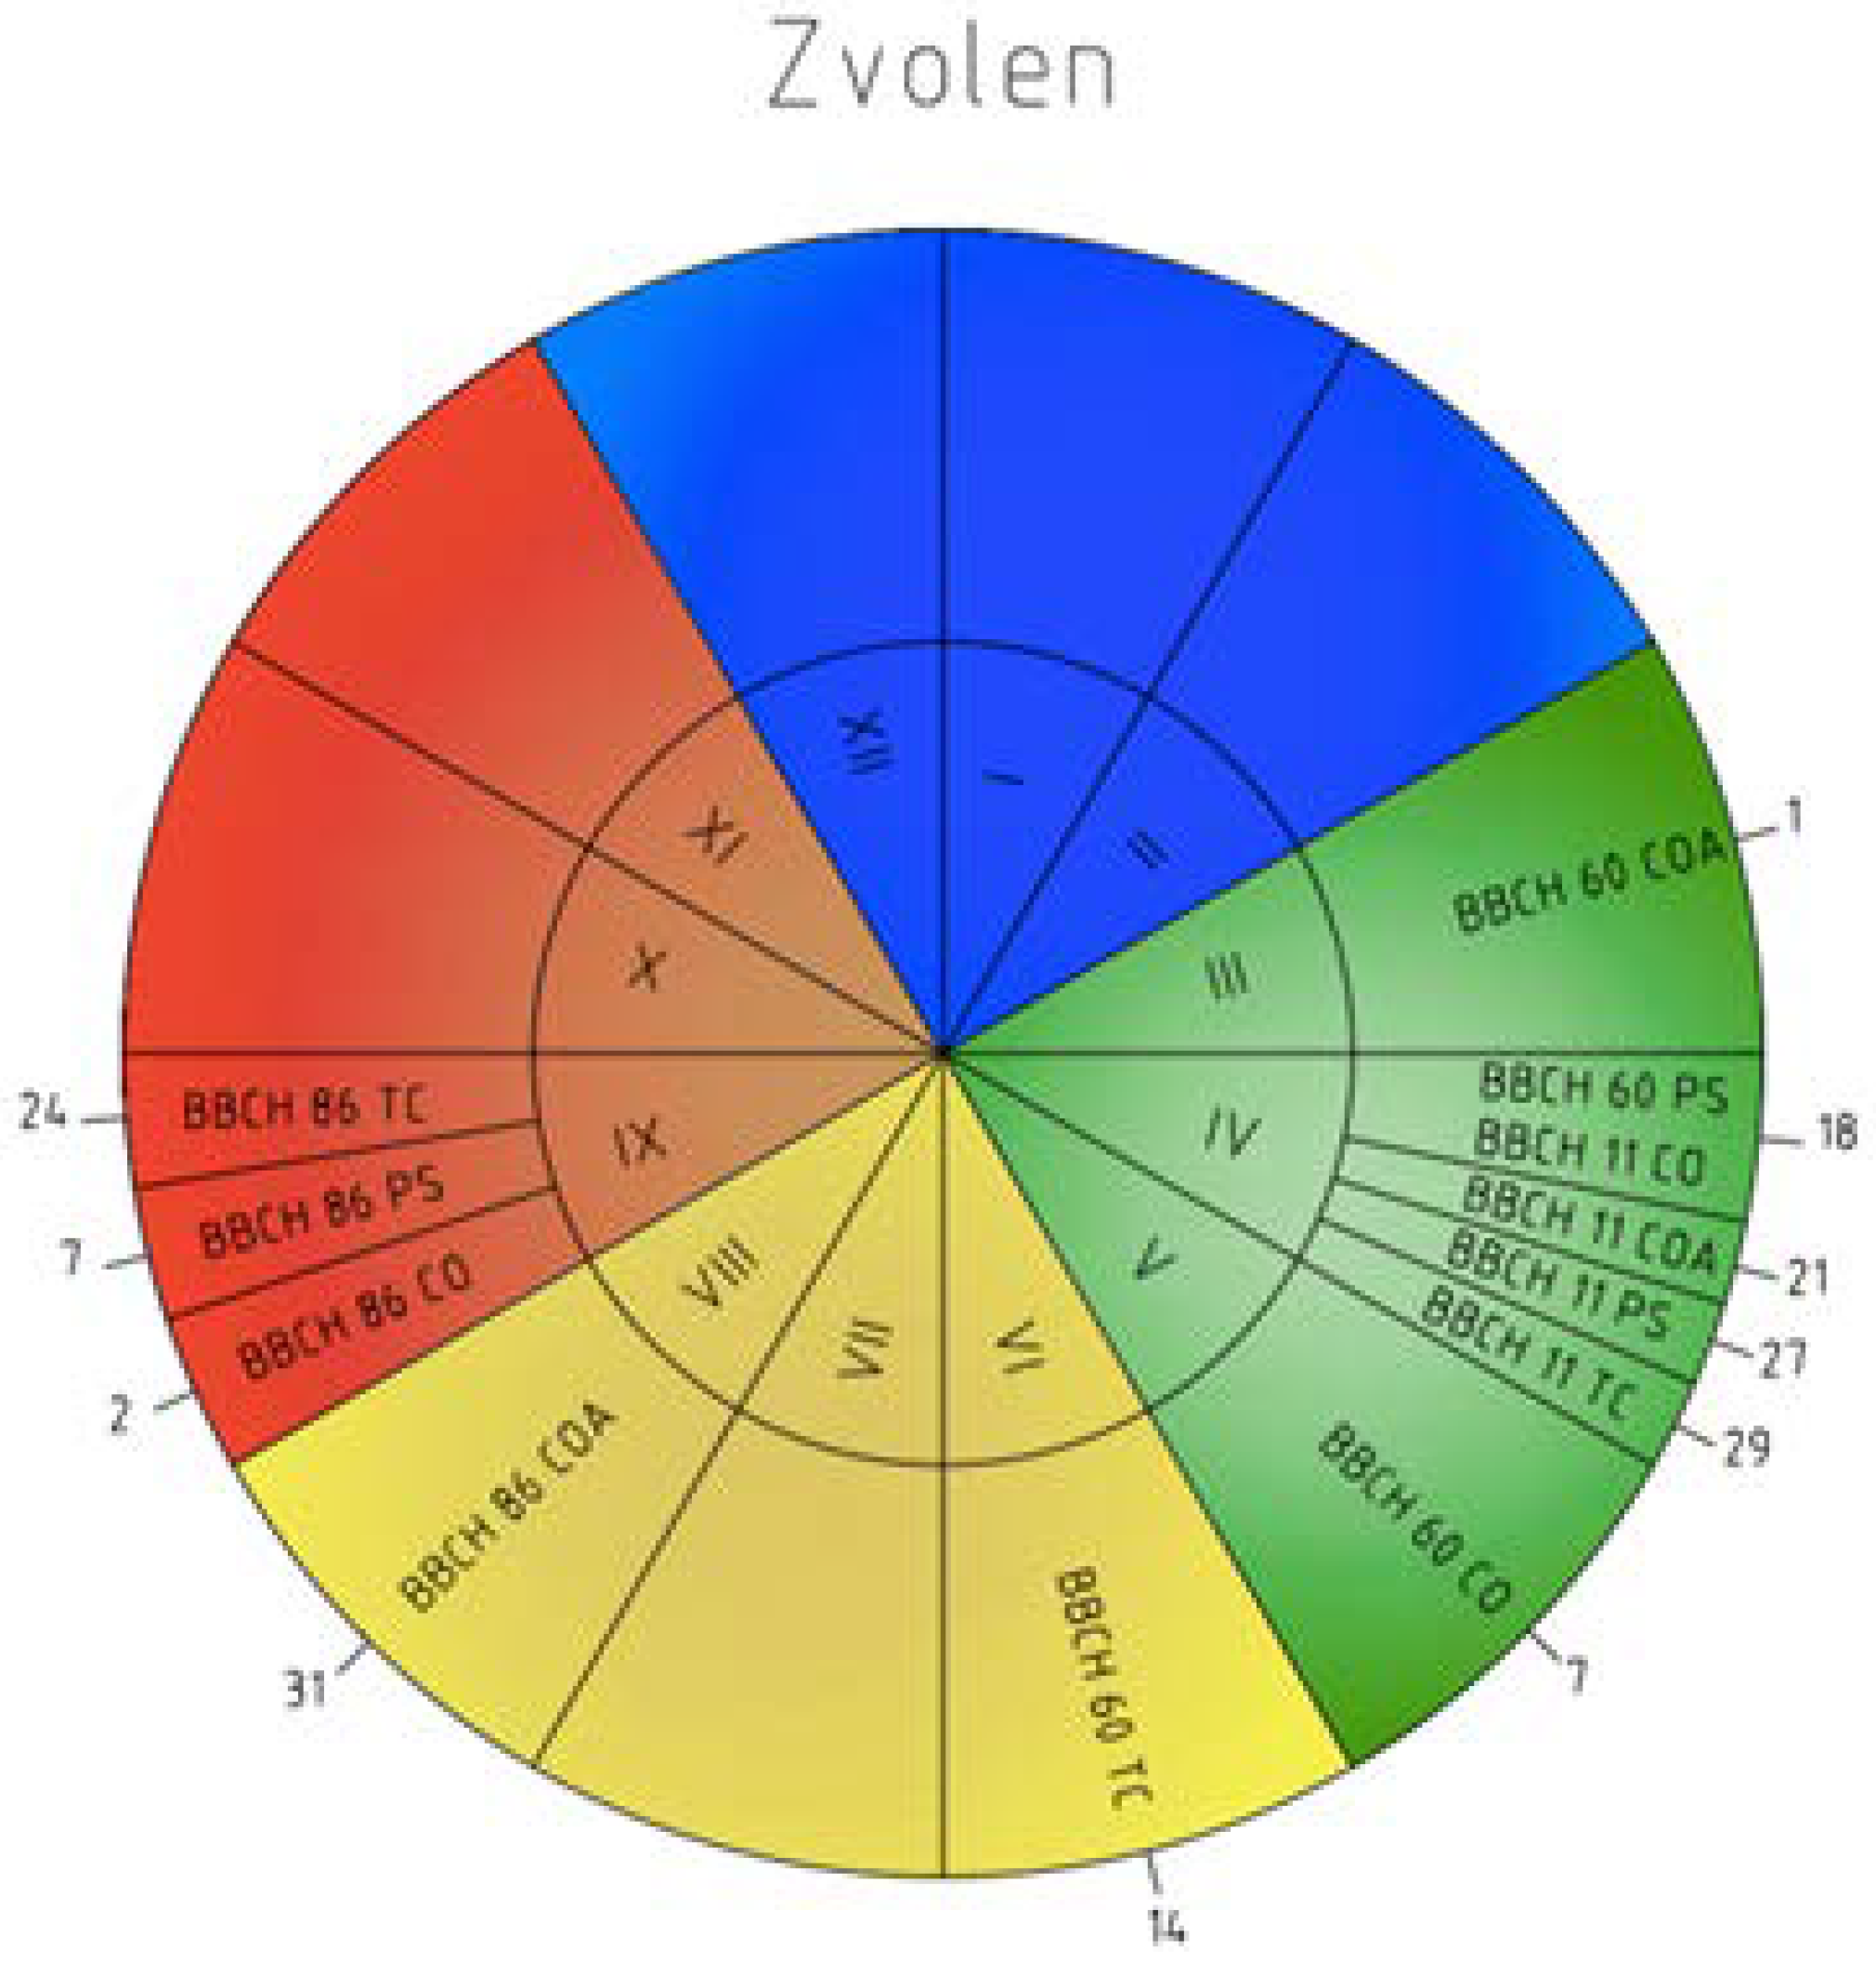
Figure 3.
Phenology calendar of the onset and order of the phenophases at Zvolen station from 1996–2015 (I–XII—months; BBCH 60—flowering; BBCH 11—leaves unfolding; BBCH 86—ripe of fruit; COA—C. avellana; CO—C. oxyacantha; PS—P. spinosa L.; TC—T. cordata Mill.; 1–31—the mean onset of the phenophases).

Figure 4.
Phenology calendar of the onset and order of the phenophases at Dolná Súča station from 1996–2015 (I–XII—months; BBCH 60—flowering; BBCH 11—leaves unfolding; BBCH 86—ripe of fruit; COA—C. avellana; CO—C. oxyacantha; PS—P. spinosa L.; TC—T. cordata Mill.; 1–31—the mean onset of the phenophases.

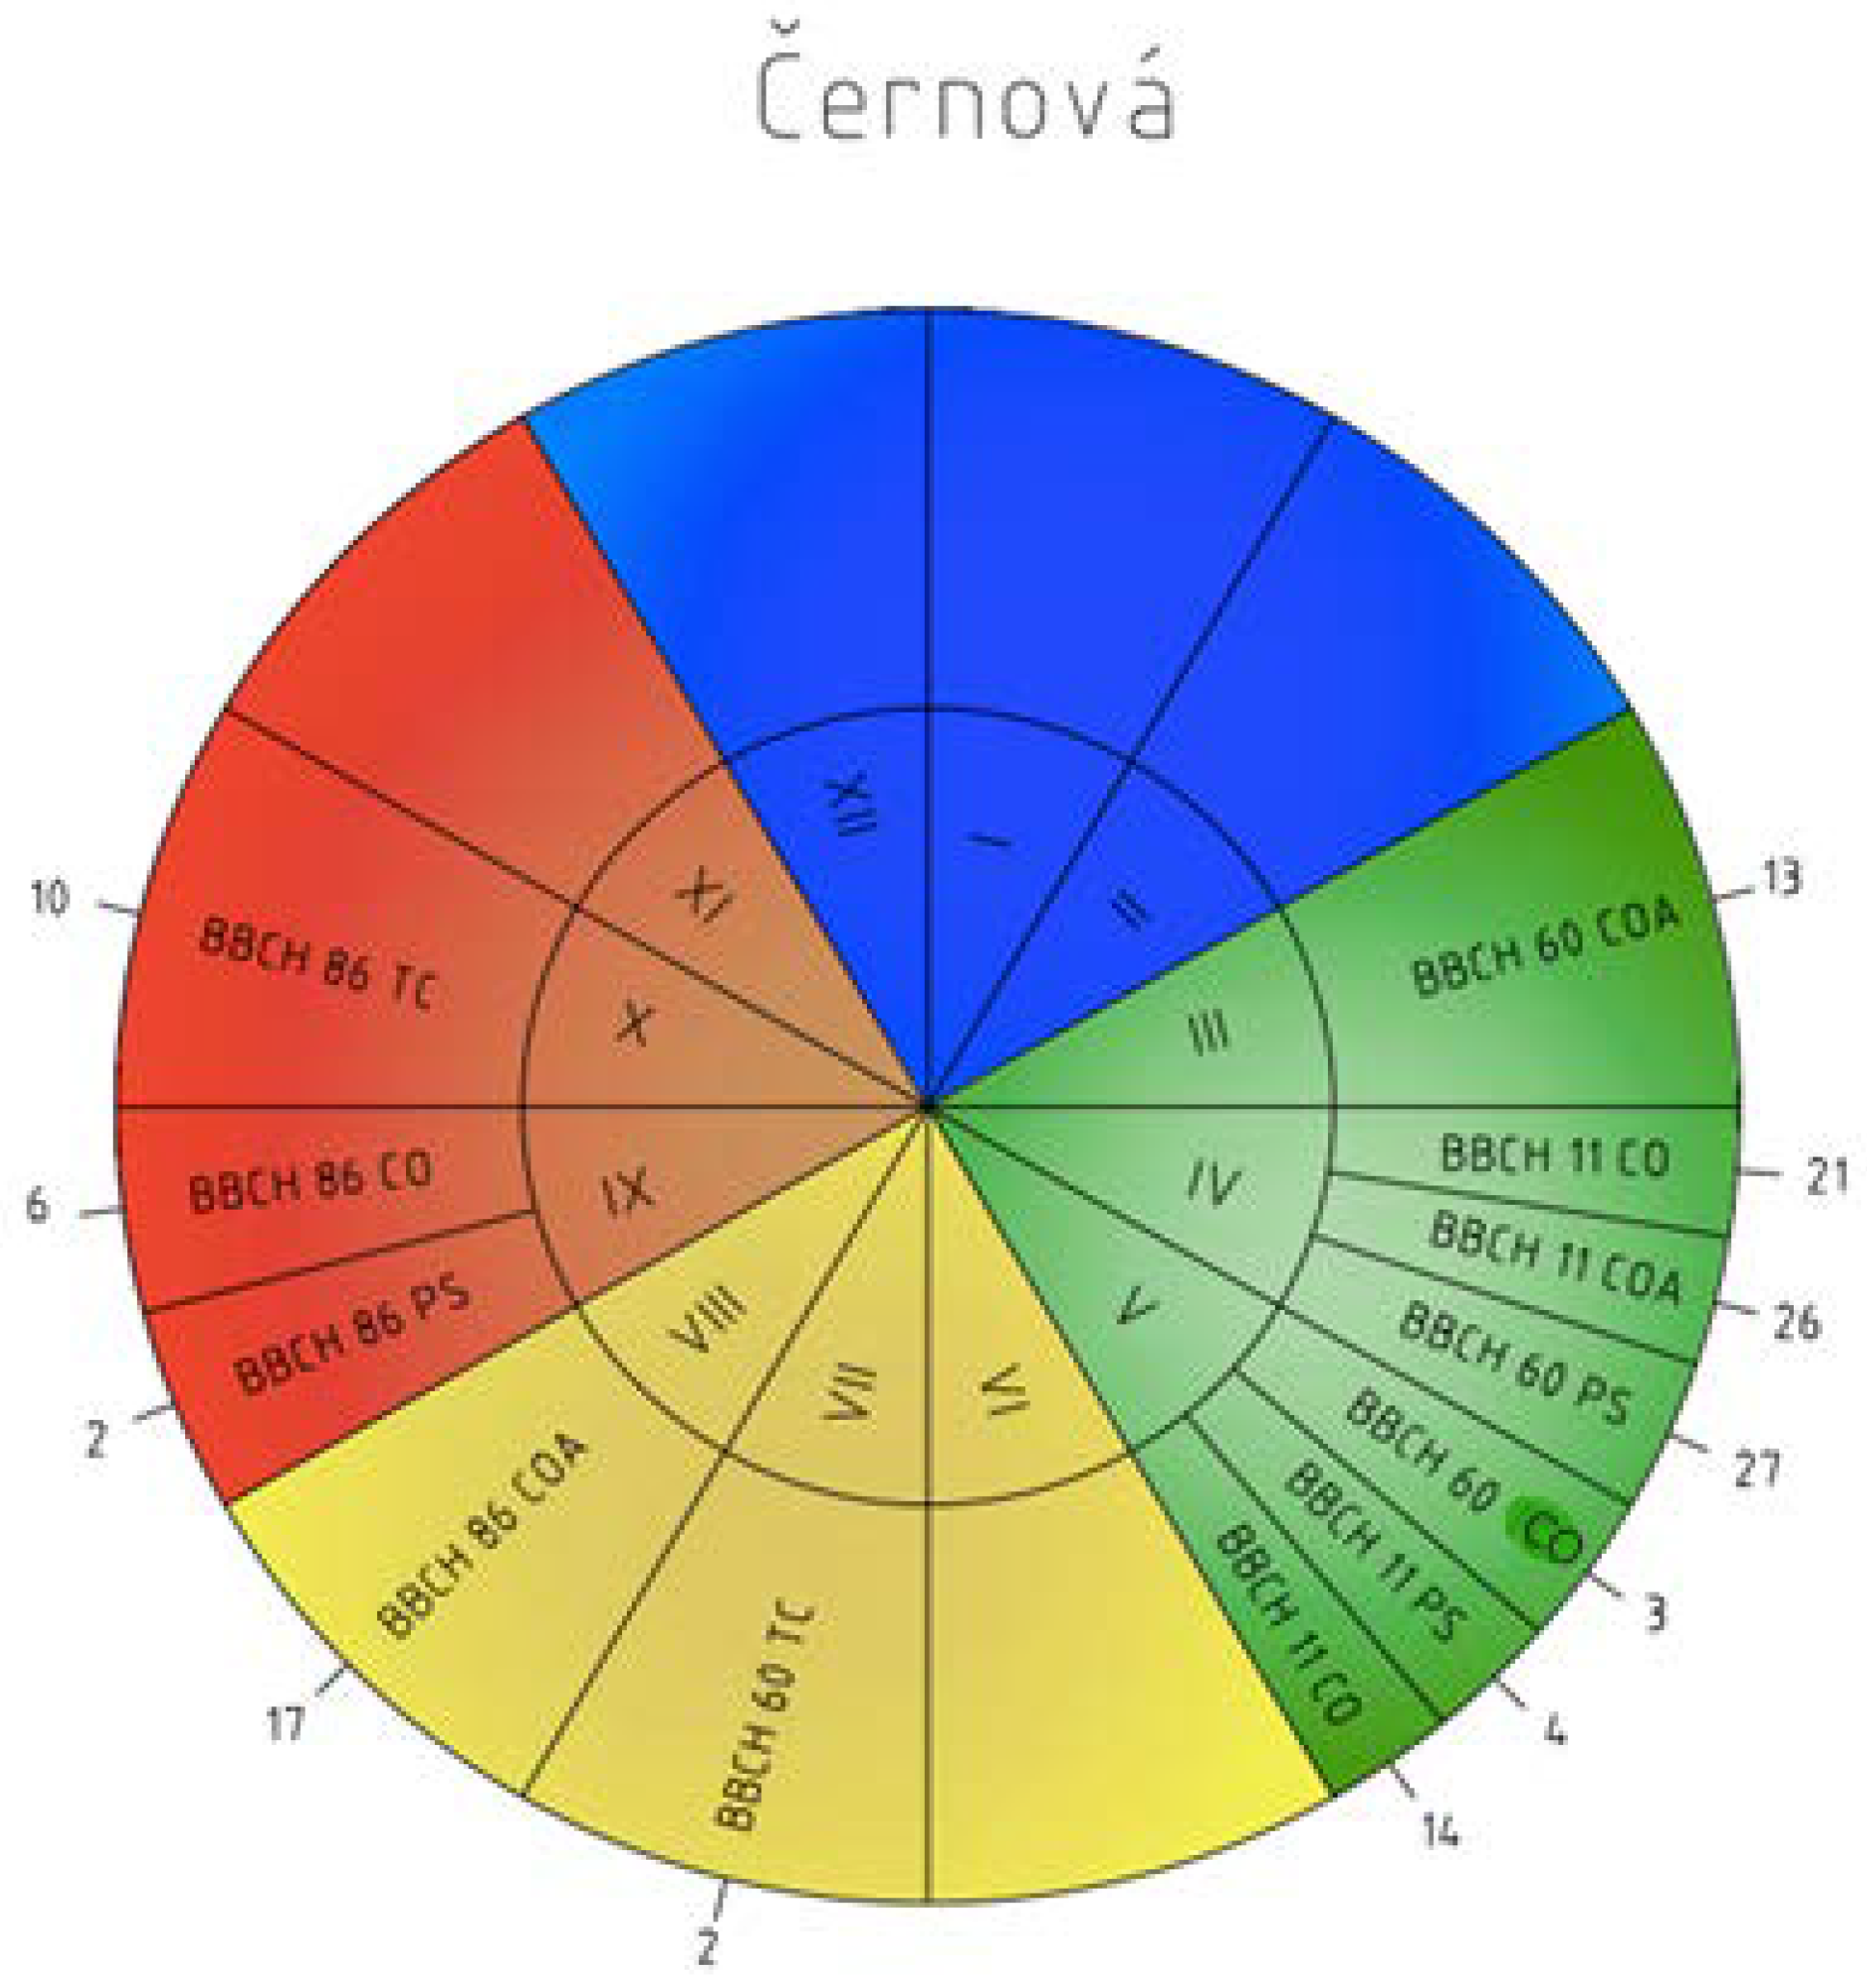
Figure 5.
Phenology calendar of the onset and order of the phenophases at Černová station from 1996–2015 (I–XII—months; BBCH 60—flowering; BBCH 11—leaves unfolding; BBCH 86—ripe of fruit; COA—C. avellana; CO—C. oxyacantha; PS—P. spinosa L.; TC—T. cordata Mill.; 1–31—the mean onset of the phenophases).

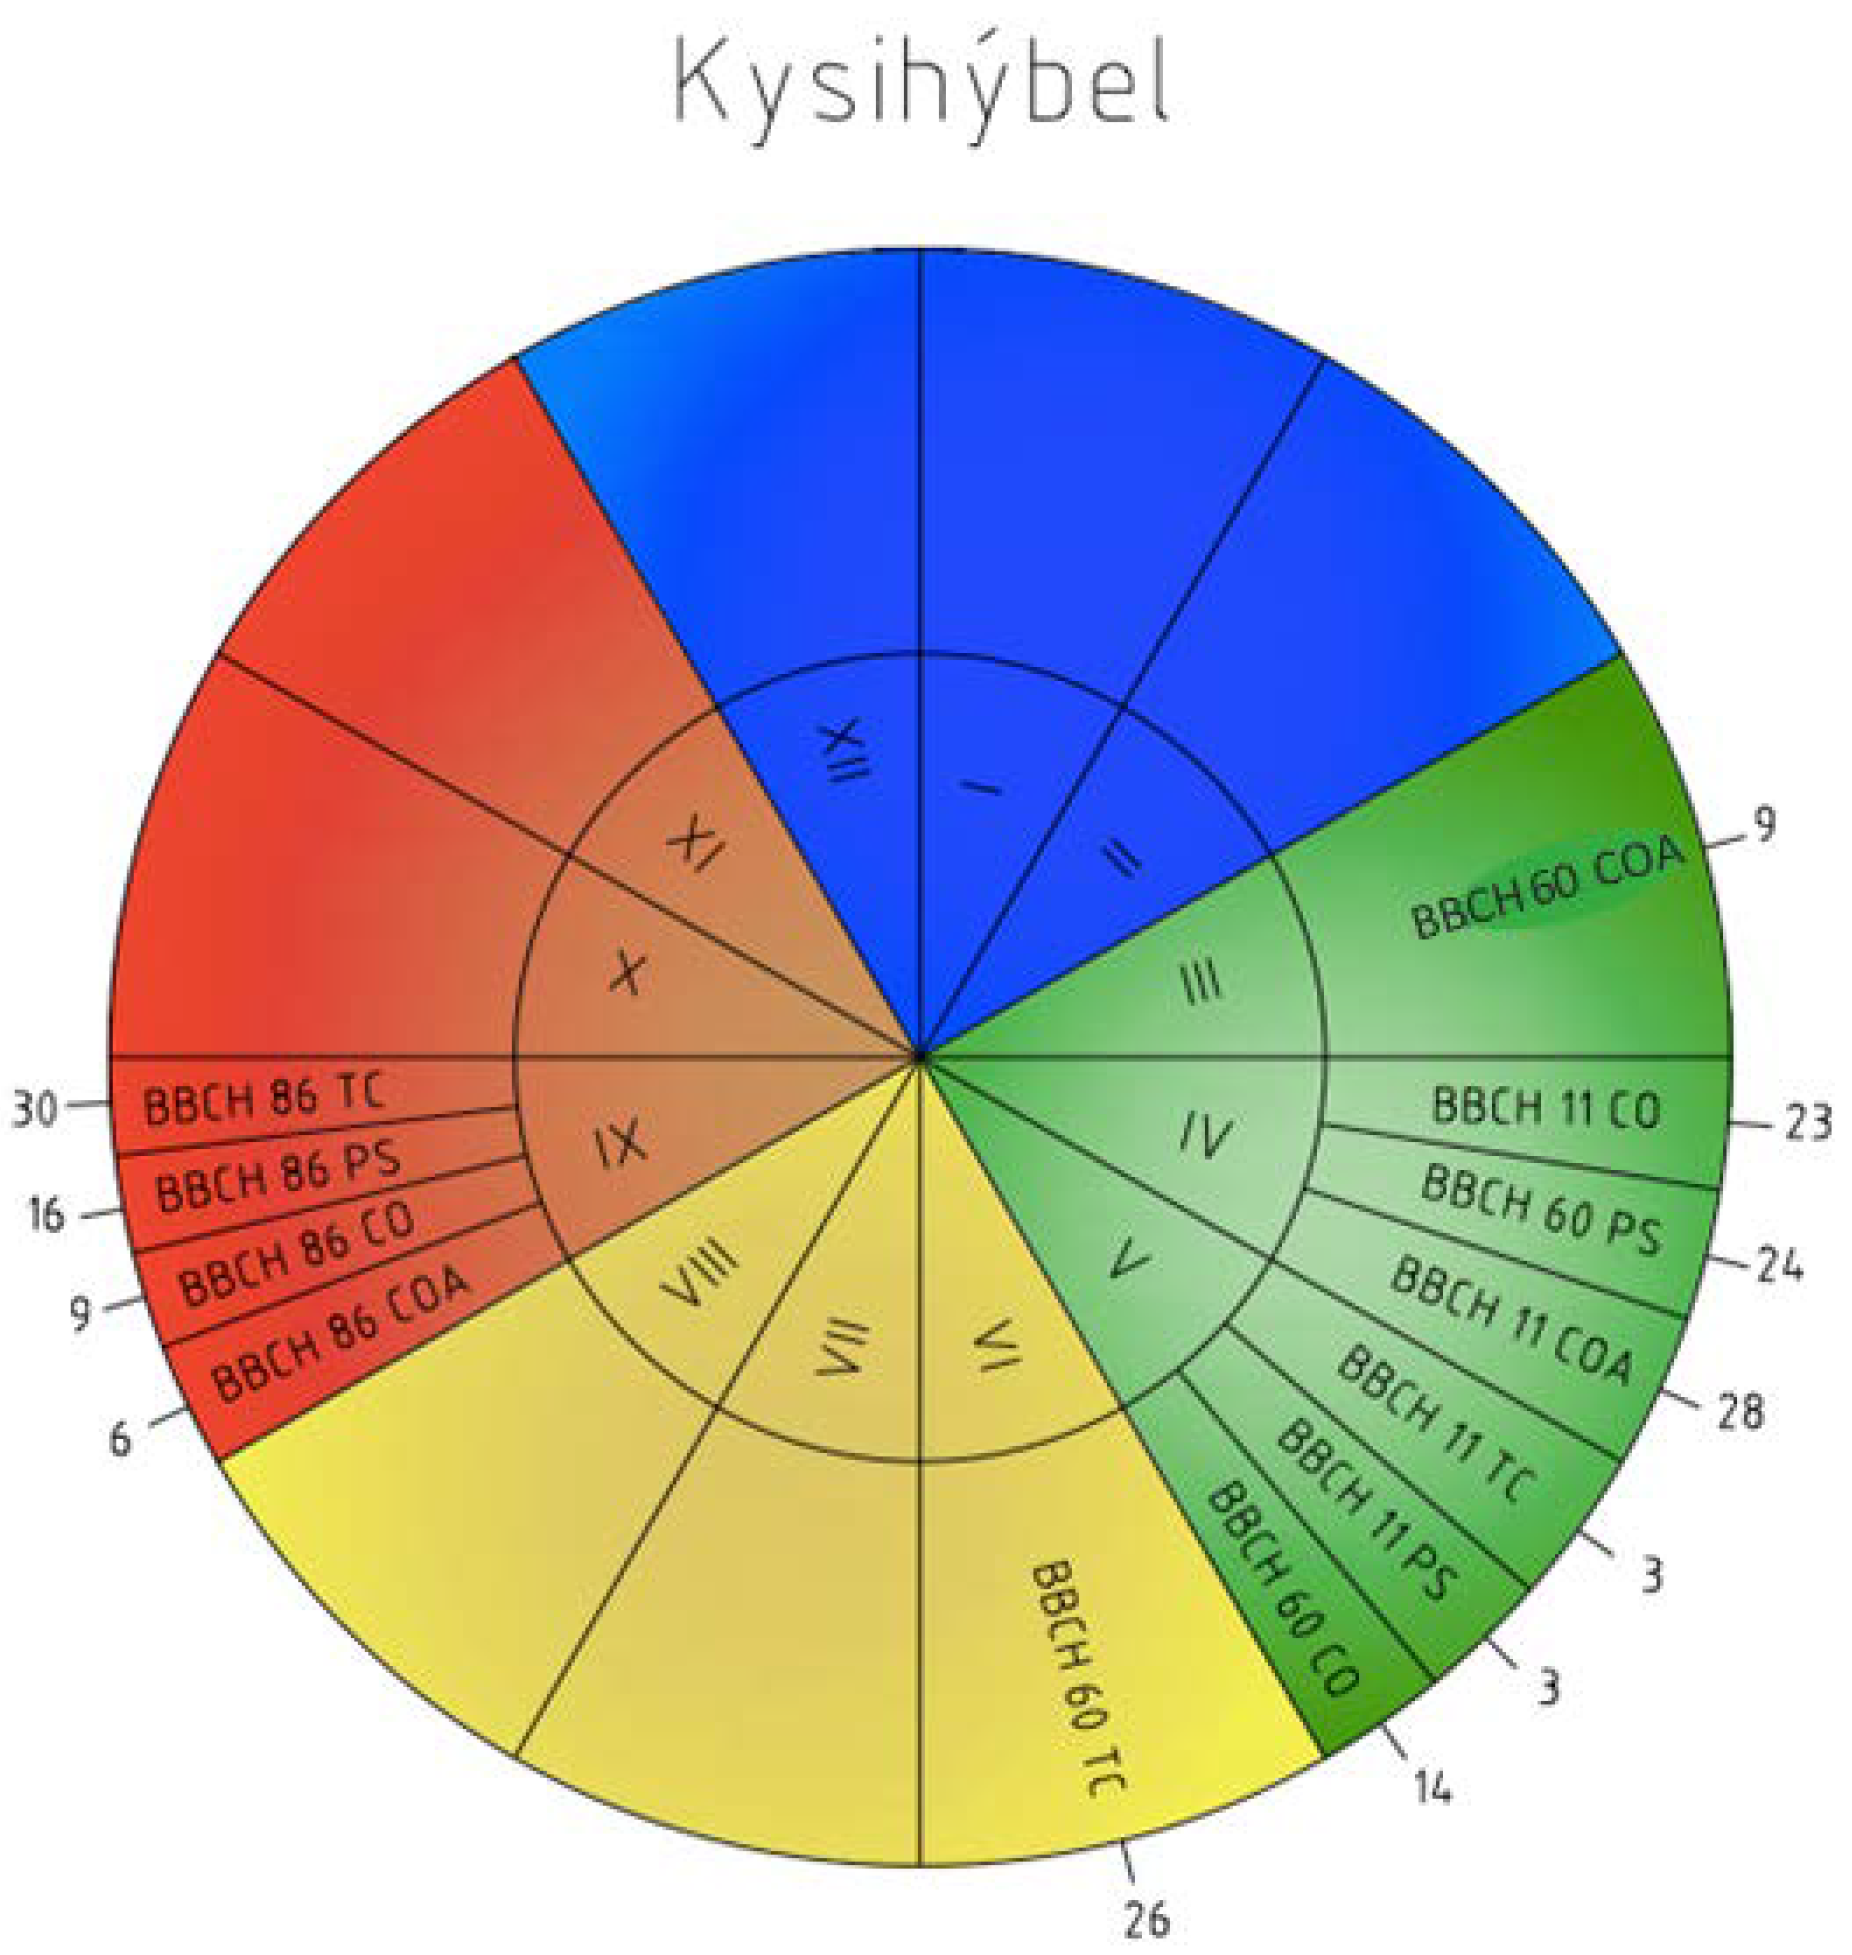
Figure 6.
Phenology calendar of the onset and order of the phenophases at Kysihýbeľ station from 1996–2015 (I–XII—months; BBCH 60—flowering; BBCH 11—leaves unfolding; BBCH 86—ripe of fruit; COA—C. avellana; CO—C. oxyacantha; PS—P. spinosa L.; TC—T. cordata Mill.; 1–31—the mean onset of the phenophases.


Table 1.
The environmental characteristics of the individual stations.
| Stupava (180 m a. s. l.) | |
| Climate characteristics |
|
| Geology and soils |
|
| Potential natural vegetation |
|
| Zvolen (300 m a. s. l.) | |
| Climate characteristics |
|
| Geology and soils |
|
| Potential natural vegetation |
|
| Dolná Súča (400 m a. s. l.) | |
| Climate characteristics |
|
| Geology and soils |
|
| Potential natural vegetation |
|
| Černová (475 m a. s. l.) | |
| Climate characteristics |
|
| Geology and soils |
|
| Potential natural vegetation |
|
| Kysihýbeľ (565 m a. s. l.) | |
| Climate characteristics |
|
| Geology and soils |
|
| Potential natural vegetation |
|
Table 2.
Vertical phenology gradient (days/100 m) of the phenophases.
| Phenophase | Vertical Phenology Gradient (VPG) (days/100 m) |
|---|---|
| BBCH 60 COA | 4.3 |
| BBCH 60 CO | 3 |
| BBCH 60 PS | 3.7 |
| BBCH 60 TC | 6 |
| BBCH 86 COA | 4 |
| BBCH 86 CO | 2.9 |
| BBCH 86 PS | 2.7 |
| BBCH 86 TC | 5.1 |
| BBCH 11 COA | 4.9 |
| BBCH 11 CO | 3.1 |
| BBCH 11 PS | 3.3 |
| BBCH 11 TC | 2.4 |
Table 3.
The characteristics of the phenophases in Stupava (σ—standard deviation, sx—variation coefficient (%), Min.—the earliest onset, Max.—the latest onset, Amplitude = Max. − Min., Trend—the change in onset to earlier (−) or later (+) date (days per year)) and linear regression of the onset of the phenophases (p-value, correlation coefficient, p < 0.05; *—statistically significant correlation year against date) in 1996–2015.
| Phenophase | sx | Min. | Max. | Amplitude | Trend | p-Value | R2 |
|---|---|---|---|---|---|---|---|
| BBCH 60 COA | 33.4 | 20.1. 2014 | 19.3. 2005 | 58 | −0.2 | 0.82 | −0.06 |
| BBCH 11 COA | 9.3 | 26.3. 2008 | 26.4. 2012 | 31 | 0.2 | 0.5 | 0.16 |
| BBCH 11 CO | 9.3 | 25.3.1998 | 25.4. 1997 | 31 | 0.2 | 0.52 | 0.15 |
| BBCH 60 PS | 6.9 | 25.3. 2014 | 21.4. 1997 | 27 | −0.4 | 0.09 | −0.39 |
| BBCH 11 PS | 6.3 | 5.4. 2014 | 30.4. 1996 | 25 | 0.4 | 0.12 | −0.36 |
| BBCH 11 TC | 2.8 | 19.4. 2002, 2011, 2014 | 29.4.1997 | 10 | −0.1 | 0.56 | −0.14 |
| BBCH 60 CO | 3.6 | 22.4. 2014 | 12.5. 1997 | 20 | −0.4 | 0.01 * | −0.59 |
| BBCH 60 TC | 3.3 | 30.5. 2000 | 15.6. 1998, 2000, 2009 | 16 | 0.1 | 0.48 | 0.17 |
| BBCH 86 COA | 3.0 | 1.9. 2005 | 29.9. 2010 | 27 | −0.6 | 0.02 * | −0.52 |
| BBCH 86 CO | 2.9 | 12.8. 2000 | 7.9. 2014 | 26 | 0.2 | 0.43 | −0.19 |
| BBCH 86 PS | 3.1 | 21.8. 2015 | 21.9. 2007 | 31 | −0.2 | 0.45 | −0.18 |
| BBCH 86 TC | 3.4 | 1.9. 2005 | 29.9. 2010 | 28 | 0.5 | 0.11 | 0.37 |
Table 4.
The characteristics of the phenophases in Zvolen (ø—average onset, σ—standard deviation, sx—variation coefficient (%), Min.—the earliest onset, Max.—the latest onset, Amplitude = Max. − Min., Trend—the change in onset to earlier (−) or later (+) date (days per year)) and simple regression of the onset of the phenophases p-value, correlation coefficient, p < 0.05; *—statistically significant correlation year against date) in 1996–2015.
| Phenophase | sx | Min. | Max. | Amplitude | Trend | p-Value | R2 |
|---|---|---|---|---|---|---|---|
| BBCH 60 COA | 29.2 | 24.01. 2014 | 30.03. 2005 | 65 | −0.5 | 0.44 | −0.18 |
| BBCH 11 CO | 5.5 | 02.04. 2014 | 28.04. 1997 | 26 | −0.4 | 0.09 | −0.39 |
| BBCH 60 PS | 6.7 | 29.03. 2014 | 29.04. 1997 | 31 | −0.5 | 0.04 * | −0.47 |
| BBCH 11 COA | 4.1 | 10.04. 2014 | 27.04. 1998 | 17 | −0.1 | 0.45 | −0.18 |
| BBCH 11 PS | 6.3 | 09.04. 2014 | 06.05. 1997 | 27 | −0.7 | 0.01 * | −0.58 |
| BBCH 11 TC | 3.0 | 24.4. 2007, 2011 | 06.05. 1997 | 12 | −0.2 | 0.23 | −0.28 |
| BBCH 60 CO | 4.1 | 26.04. 2014 | 16.05. 1997 | 20 | −0.4 | 0.02 * | −0.5 |
| BBCH 60 TC | 3.1 | 05.06. 2000 | 24.6. 1997, 2005 | 19 | 0.0 | 0.94 | −0.02 |
| BBCH 86 COA | 2.1 | 23.08. 2008 | 07.09. 2004 | 15 | −0.2 | 0.3 | −0.25 |
| BBCH 86 CO | 2.6 | 19.08. 2003 | 12.09. 2014 | 24 | −0.2 | 0.33 | −0.23 |
| BBCH 86 PS | 3.3 | 26.08. 2015 | 30.09. 2007 | 35 | −0.3 | 0.4 | −0.23 |
| BBCH 86 TC | 3.5 | 07.09. 2003 | 15.10. 2010 | 38 | 0.4 | 0.24 | 0.28 |
Table 5.
The characteristics of the phenophases in Dolná Súča (ø—average onset, σ—standard deviation, sx—variation coefficient [%], Min.—the earlier onset, Max.—the later onset, Amplitude = Max. − Min., Trend—the change in onset-days per year) and simple regression of the onset of the phenophases, p-value, correlation coefficient, p < 0.05; *—statistically significant correlation year against date) in 1996–2015.
| Phenophase | sx | Min. | Max. | Amplitude | Trend | p-Value | R2 |
|---|---|---|---|---|---|---|---|
| BBCH 60 COA | 24.2 | 28.01. 2014 | 01.04. 2005 | 63 | −0.6 | 0.32 | −0.23 |
| BBCH 60 PS | 6.7 | 31.03. 2014 | 03.05. 1997 | 33 | −0.6 | 0.02 * | −0.52 |
| BBCH 11 CO | 5.2 | 05.04. 2014 | 02.05. 1997 | 27 | −0.4 | 0.08 | −0.4 |
| BBCH 11 COA | 3.6 | 16.04. 2007 | 30.04. 1998 | 14 | +0.1 | 0.69 | 0.09 |
| BBCH 11 PS | 5.6 | 12.04. 2014 | 08.05. 2006 | 26 | −0.6 | 0.01 * | −0.54 |
| BBCH 11 TC | 3.1 | 25.4. 2011, 2014 | 09.05. 1997 | 14 | −0.2 | 0.12 | −0.35 |
| BBCH 60 CO | 3.8 | 27.04. 2014 | 19.05. 1997 | 22 | −0.4 | 0.01 * | −0.55 |
| BBCH 60 TC | 2.7 | 13.06. 2000 | 28.6. 1997, 2001 | 15 | −0.1 | 0.58 | −0.13 |
| BBCH 86 COA | 2.0 | 26.08. 2011 | 12.09. 1999 | 17 | −0.3 | 0.1 | −0.38 |
| BBCH 86 CO | 2.3 | 27.08. 2003, 2009 | 14.09. 2004 | 18 | −0.2 | 0.51 | −0.16 |
| BBCH 86 PS | 3.2 | 29.8. 2009, 2015 | 01.10. 2007 | 33 | −0.3 | 0.29 | −0.25 |
| BBCH 86 TC | 2.8 | 12.09. 2005 | 16.10. 2010 | 34 | +0.3 | 0.24 | 0.28 |
Table 6.
The characteristics of the phenophases in Černová (ø—average onset, σ-standard deviation, sx-variation coefficient (%), Min.—the earliest onset, Max.—the latest onset , Amplitude= Max. − Min., Trend—the change in onset to earlier (−) or later (+) date (days per year)) and simple regression of the onset of the phenophases, p-value, correlation coefficient, p < 0,05; *—statistically significant correlation year against date) in 1996–2015.
| Phenophase | sx | Min. | Max. | Amplitude | Trend | p-Value | R2 |
|---|---|---|---|---|---|---|---|
| BBCH 60 COA | 20.2 | 15.02. 1998 | 08.04. 1996 | 52 | −0.4 | 0.43 | −0.19 |
| BBCH 11 CO | 7.6 | 28.03. 2014 | 3.05. 1996, 1997 | 36 | −0.6 | 0.05 | −0.46 |
| BBCH 11 COA | 4.7 | 10.04. 2014 | 04.05. 1997 | 24 | −0.4 | 0.06 | −0.42 |
| BBCH 60 PS | 6.2 | 05.04. 2014 | 07.05. 2007 | 32 | −0.5 | 0.03 * | −0.49 |
| BBCH 11 TC | 3.3 | 27.04. 2014 | 11.05. 2005 | 14 | −0.2 | 0.11 | −0.37 |
| BBCH 11 PS | 5.2 | 15.04. 2009 | 14.05. 1997 | 29 | −0.5 | 0.05 | −0.43 |
| BBCH 60 CO | 4.3 | 30.04. 2013 | 22.5. 2005, 2006 | 22 | +0.3 | 0.18 | −0.31 |
| BBCH 60 TC | 2.9 | 23.06. 2000, 2002 | 13.07. 2004 | 20 | +0.1 | 0.7 | 0.09 |
| BBCH 86 COA | 2.7 | 07.08. 2007 | 29.08. 1997 | 22 | −0.6 | 0.00 * | −0.64 |
| BBCH 86 CO | 2.8 | 19.08. 2000 | 13.09. 2004 | 25 | +0.0 | 0.92 | 0.02 |
| BBCH 86 PS | 4.0 | 22.08. 2003 | 29.09. 2011 | 38 | −0.6 | 0.1 | −0.37 |
| BBCH 86 TC | 1.5 | 5.10. 2003, 2008 | 15.10. 1998, 1999, 2005 | 12 | −0.2 | 0.21 | −0.29 |
Table 7.
The characteristics of the phenophases in Kysihýbeľ (ø—average onset, σ—standard deviation, sx—variation coefficient (%), Min.—the earliest onset, Max.—the latest onset , Amplitude = Max. − Min., Trend-the change in onset to earlier (−) or later (+) date (days per year)) and simple regression of the onset of the phenophases, p-value, correlation coefficient, p < 0,05; *—statistically significant correlation year against date) in 1996–2015.
| Phenophase | sx | Min. | Max. | Amplitude | Trend | p-Value | R2 |
|---|---|---|---|---|---|---|---|
| BBCH 60 COA | 24.6 | 31.01. 2014 | 03.04. 2005 | 62 | −0.5 | 0.36 | −0.22 |
| BBCH 11 CO | 5.2 | 06.04. 2014 | 03.05. 1997 | 27 | −0.4 | 0.08 | −0.4 |
| BBCH 60 PS | 6.4 | 04.04. 2014 | 05.05. 1997 | 31 | −0.5 | 0.04 * | −0.47 |
| BBCH 11 COA | 3.1 | 20.04. 2007 | 03.05. 1997 | 13 | +0.0 | 0.81 | −0.06 |
| BBCH 11 PS | 6.0 | 15.04. 2014 | 12.5. 1997, 2006 | 27 | −0.6 | 0.01 * | −0.55 |
| BBCH 11 TC | 2.9 | 28.04. 2011 | 11.05. 1997 | 13 | −0.1 | 0.28 | −0.25 |
| BBCH 60 CO | 4.2 | 02.05. 2012 | 25.05. 1997 | 23 | −0.5 | 0.02 * | −0.52 |
| BBCH 60 TC | 2.8 | 19.6. 1999, 2014 | 07.07. 2005 | 18 | +0.0 | 0.8 | −0.06 |
| BBCH 86 COA | 2.0 | 28.08. 2000 | 13.09. 2004 | 16 | −0.2 | 0.39 | −0.21 |
| BBCH 86 CO | 2.4 | 28.08. 2003 | 17.09. 2005, 2014 | 20 | −0.2 | 0.36 | −0.22 |
| BBCH 86 PS | 3.3 | 02.09. 2009 | 06.10. 2007 | 34 | −0.4 | 0.17 | −0.32 |
| BBCH 86 TC | 2.8 | 16.09. 2006 | 17.10. 2010 | 31 | +0.4 | 0.16 | 0.33 |
© 2018 by the authors. Licensee MDPI, Basel, Switzerland. This article is an open access article distributed under the terms and conditions of the Creative Commons Attribution (CC BY) license (http://creativecommons.org/licenses/by/4.0/).
Share and Cite
MDPI and ACS Style
Babálová, D.; Škvareninová, J.; Fazekaš, J.; Vyskot, I. The Dynamics of the Phenological Development of Four Woody Species in South-West and Central Slovakia. Sustainability 2018, 10, 1497. https://doi.org/10.3390/su10051497
AMA Style
Babálová D, Škvareninová J, Fazekaš J, Vyskot I. The Dynamics of the Phenological Development of Four Woody Species in South-West and Central Slovakia. Sustainability. 2018; 10(5):1497. https://doi.org/10.3390/su10051497
Chicago/Turabian StyleBabálová, Darina, Jana Škvareninová, Juraj Fazekaš, and Ilja Vyskot. 2018. "The Dynamics of the Phenological Development of Four Woody Species in South-West and Central Slovakia" Sustainability 10, no. 5: 1497. https://doi.org/10.3390/su10051497
Note that from the first issue of 2016, this journal uses article numbers instead of page numbers. See further details here.