Development and Evolution of an Intermediate Wheatgrass Domestication Program


1
The Land Institute, 2440 E. Water Well Rd., Salina, KS 67401, USA
2
Department of Plant Pathology, Kansas State University, 4024 Throckmorton PSC, Manhattan, KS 66506, USA
3
Wheat Genetics Resource Center, Department of Plant Pathology, Kansas State University, 4024 Throckmorton PSC, Manhattan, KS 66506, USA
*
Author to whom correspondence should be addressed.
Sustainability 2018, 10(5), 1499; https://doi.org/10.3390/su10051499
Submission received: 16 February 2018
/
Revised: 16 April 2018
/
Accepted: 3 May 2018
/
Published: 9 May 2018
(This article belongs to the Special Issue Strategies, Advances and Challenges of Breeding Perennial Grain Crops)
Abstract
:Ecological intensification of agriculture is a proposed strategy to enhance the production of food while expanding ecosystem services and reducing inputs. Perennial plants that are directly harvested for human food are a novel means of ecological intensification, by potentially providing unprecedented levels of ecological services, such as increased soil carbon and reduced nutrient leaching. However, existing herbaceous perennial plants produce low yields of harvestable seed. Therefore, we initiated a domestication program to improve the grain yield of the perennial intermediate wheatgrass (Thinopyrum intermedium [Host] Barkworth & D.R. Dewey). The breeding program has adapted to changing resources and to results from previous generations, with methods becoming more elaborate as the program has matured over six breeding cycles. Average predicted gains from selection accumulated over five cycles were 143, 181 and 60% respectively, for seed yield per head, percent naked seed and mass per seed. We did not detect negative correlations that would indicate simultaneously achieving increased grain yield and sustained perenniality would be particularly difficult. Heritability estimates based on genetic markers were the same or higher than those calculated from a pedigree, indicating that markers have potential to expedite breeding efforts.
1. Introduction
Intermediate wheatgrass (Thinopyrum intermedium [Host] Barkworth & D.R. Dewey) is a perennial grass that has been used extensively as a cool-season forage throughout the USA and Canada and also across its native range in Eurasia [1]. The species also produces edible seed that can be used in baked products or beverages to augment or replace grains such as wheat, rye, or barley [2]. Intermediate wheatgrass is attractive for use as a perennial grain because the large perennial root system is expected to improve ecosystem services such as increased soil carbon and reduced nutrient leaching [3,4,5]. However, grain yield of intermediate wheatgrass is well below that of existing annual grains such as wheat [3]. Therefore, breeding programs designed to increase harvestable grain yield have been initiated [6].
Intermediate wheatgrass was initially selected as a target for domestication as a perennial grain because it had synchronous seed maturity, edible grain, moderate shattering and reasonable threshability [1,7]. The first step toward domestication was taken by the Rodale Research Center, Kutztown, PA, USA, when germplasm evaluations began in 1987 [1]. Subsequently, promising populations were identified and intermated, and a breeding program was initiated at the USDA Plant Materials Center in Big Flats, NY in 1990 [1,8].
Market development is a critical component to developing a new crop, and efforts in this regard began in parallel with plant breeding in the 1990’s. Naked (hulless) seed produced as a by-product of the forage grass seed industry was available for purchase as an edible grain by 1995 [1]. Commercial development apparently dissipated as breeding efforts associated with the Rodale Institute wound down by the year 2000. However, recently expanded breeding programs have led to renewed commercial interest. Commercial products are being sold under the trade name Kernza (owned by The Land Institute) and companies such as General Mills are now actively supporting development of the grain [2].
Intermediate wheatgrass has substantial genetic similarity to wheat, and Thinopyrum species have been sexually hybridized with wheat to integrate novel genes into modern wheat cultivars [9]. Therefore, properties of intermediate wheatgrass grain are expected to be somewhat akin to wheat, but substantial differences are also expected. Efforts to study the chemical properties of intermediate wheatgrass flour in various applications have been completed, and these results are expected to help direct future product development and selection programs aimed at improving grain quality parameters [10,11,12,13,14,15].
Critics of current efforts to develop perennial grain crops have suggested that developing perennial herbaceous plants producing abundant harvestable grain will be either impossible to achieve or so costly that it would be a poor use of scarce resources [16,17]. Others have suggested that there is no theoretical basis for considering domesticating new perennial grains more difficult than it would be to domesticate new annual grains [18,19,20,21]. Ultimately, this question will only be empirically answered by sustained efforts to develop a wide array of new perennial grain crops, since not all programs that begin are expected to achieve success, due to many unknown factors [22].
Patterns of response to selection in current perennial grain breeding programs will increasingly indicate whether success with the crop is probable or unlikely. Thus far, results with intermediate wheatgrass have been promising. Improved populations of intermediate wheatgrass were evaluated after two generations of selection in our breeding program. Grown in a solid-seeded arrangement, yield per area had increased by 77%, and mass per seed was increased by 23% [6].
Questions remain as to whether gains made in the first few breeding cycles can be sustained over many generations and if refined breeding techniques can accelerate gains. Therefore, here we will retrospectively examine methods used over six cycles of intermediate wheatgrass breeding for grain uses, and we will explore how genetic parameters of the population have changed over time in response to selection and shifting breeding techniques. Domestication of a new species is complex and risky due to many unknowns such as the ability to increase seed size or yield. When selecting on a few key traits, we cannot be certain of what other changes, desirable or undesirable, will be induced in the population. Therefore, here we will explore not only traits that were directly selected but also predict changes in other traits that were not the direct targets of selection. The number of traits that must be considered in new crop domestication is daunting, [22] and here we will explore our approach to that issue.
2. Materials and Methods
2.1. Cycle 1
Germplasm to initiate the breeding program located in central Kansas, USA was obtained from a breeding program run jointly by the Rodale Research Center and the Big Flats Plant Materials Center [8]. This joint breeding program consisted of two cycles of selection, and seed was obtained from both cycles. Plants were established at The Land Institute, (Salina, KS, USA, 38.7684° N, 97.5664° W) by seeding to the field in the fall of 2001 and 2002. Plants were dug in fall 2003, divided by hand to produce three ramets from each genet and allowed to recover in 12.7 × 15.24 cm pots in the greenhouse before transplanting in the field. The field layout consisted of a spaced grid at 91.4 cm intervals, with three randomized complete blocks. A total of 961 genets were established in the field, 866 of which were derived from the first cycle of selection in New York and 95 of which were from the second cycle of selection. One row of border plants was established on the exterior of the plot to reduce edge effects. Weeds were controlled by mechanical cultivation in both directions of the grid and by hand weeding.
Because we expected first-year data to be an unreliable predictor of long-term seed yield and because we desired to prevent seed shattering that would result in seedlings that could contaminate the nursery, plants were allowed to head in summer 2004 but were then mowed to eliminate chance of seed production and subsequent shattering. Data collection on reproductive traits was performed in the summer of 2005 by harvesting heads when they were uniformly brown and dry. Harvest was performed by tying the majority of seed heads produced by each plant in a bundle with twine and attaching a labeled envelope. All heads were cut using a tractor-mounted sickle-bar mower, and the bundled heads were then collected and stored indoors until they could be measured and threshed.
Data were collected throughout the summer of 2005, beginning with counting the number of daughter plants produced by rhizomatous spread in May. When about 50% of plants had reached anthesis, maturity was rated using the BBCH scale adapted for perennial plants [23]. Plant height was measured in July when plants had reached maximum height. Head length was estimated by measuring five representative heads, and peduncle diameter was estimated by measuring the width of five stems, just below the head. Average number of florets was estimated by counting the number of spikelets per head, and this estimate was used in calculating percent seed set (seed fertility). Seed yield per head was determined by threshing 20 randomly chosen heads per plant by using a mini Vogel-style threshing machine. Seed cleaning was performed with a Clipper Model 400 Office Tester (Seedburo Equipment Co., Des Plaines, IL, USA). Percentage of naked seed (free threshing ability) was estimated visually. Mass per seed was determined by counting out 500 seeds from each sample using a Seedburo 801 Seed Counter (Seedburo Equipment Co.) and weighing. Counted seeds were a mixture of in-hull and naked seeds. Yield per head was calculated by dividing the total seed mass obtained (including hulls) by the number of heads threshed. Regrowth was measured several weeks after harvest as height of newly emerging leaves above the soil surface.
Correlations among measured traits were examined, (Table S1) and no correlations of concern (which might result in loss of progress in a trait) were observed between other traits and seed mass or seed yield per head. Therefore, selection was performed on a simple Z-score index [24] of seed mass and yield per head, calculated by summing the Z-scores of each trait for each individual. The 50 selected individuals were dug from the field in fall 2005 and placed in a crossing block with two clonal replications, planted in a randomized complete block design. Additionally, ramets from the top 5 individuals according to the index were also placed in an isolated crossing block with two replications. Seed was harvested from the crossing blocks in July 2006.
2.2. Cycle 2
A total of 2466 plants were established in the second cycle. Of these, 1266 were derived from randomly intermating the top five individuals in Cycle 1, comprising an elite group. The seeds were planted in pots in the greenhouse and transplanted to the field in late October 2006. Plant spacing and management were similar to the methods of Cycle 1. Again, heads produced in the first year (2007) were removed to prevent shattering, and data collection commenced in the summer of 2008. Growth stage was again scored with the BBCH scale when about 50% of plants had reached anthesis (at this point staging can be done quickly and accurately). Foliar disease was also rated at 50% anthesis. There appeared to be a complex of foliar diseases, and we did not attempt to distinguish between them. Rather, we simply rated the percentage of leaf area on each plant that had been discolored due to disease. Height at maturity was also measured as length of stem above soil surface (lodged plants were straightened for measuring).
Prior to harvest, the number of heads per plant was counted. In the case of larger plants, the full number was estimated by counting roughly 50 or 25% of the full number of heads on a given plant. Harvest of heads for this cycle was performed by cutting the plant off to 10 cm height using a power scythe. Cut stems were gathered and passed through a Wintersteiger plot combine (Wintersteiger, Ankeny, IA, USA) for threshing. Threshed seeds were further cleaned using a Clipper Model 400 Office Tester. From each sample, 200 seeds were counted using a Seedburo 801 Seed Counter and weighed. Total seed mass of each plant was also weighed, and the percent naked seed was estimated visually.
Selection began by constructing Z-score indices including the following traits: total yield per plant, yield per head, percent naked seed, 200-seed mass and disease rating. The Z-score of the 200-seed mass was multiplied by 2 to increase the influence of this trait in selection. A total of 50 individuals were selected based on manual ranking of plants using the indices and individual trait data. These 50 individuals were dug and vernalized in a growth chamber at 7 °C to induce flowering. Then, they were split into multiple ramets, planted in 7.6 L pots and brought to the greenhouse for crossing. In addition to random intermating between the 50 selected genotypes, two additional populations were established. The first was obtained by randomly intermating the 4 individuals with the highest percentage of naked seed. The second population was comprised of the 6 genotypes with the highest rating on a Z-score index of plant height multiplied by −1 (to select shorter plants) and yield per head. Random intermating among plants in the greenhouse was promoted by randomizing the plants weekly during anthesis and providing air movement with oscillating fans.
2.3. Cycle 3
Because selected plants in the previous generation were intermated in the greenhouse, crossed seed was available for planting in the spring. Moist seed was placed at 4 °C for 14 days to break dormancy and then seeds were planted in the greenhouse in April. A total of 4800 seedlings were transplanted to the field in May 2009, spaced on a 91.4 cm grid. Progeny derived from intermating plants with the highest percentage of naked seed in Cycle 2 made up 6.7% of the population, while progeny derived from intermating the six high-yielding shorter genotypes made up 10% of the population. The remainder of the plants established were derived from intermating all selected plants in Cycle 2. In the first summer, plants did not produce heads because they had not been vernalized. Weeds were controlled with tillage, and the plants developed vegetatively.
In 2010, plants flowered for the first time and data was collected. Once the flag leaves had fully developed, flag leaf width was measured at the widest point and recorded from two representative leaves from each plant. Data were averaged for analysis. Head angle was recorded by laying a representative head on a large protractor. Fully erect heads had an angle of 0°, while strongly drooping heads had an angle (of the tip relative to the base) approaching 180°. About thirty heads, chosen at random, were harvested from each plant. Actual number of heads was counted prior to threshing. After threshing in a mini-Vogel thresher, percent naked seed was estimated. Then, seed was passed through a No. 64 Laboratory Sample Sheller for Paddy Rice (Hoffman Mfg., Corvallis, OR, USA). Subsequent cleaning was achieved by hand sieving and aspiration using the WM2 Lab Precision Separator (SeedTech Systems, Wilton, CA, USA). From each sample, 20 undamaged naked seeds were counted and weighed to determine seed mass. Mass of seed after dehulling, divided by the number of heads harvested, was used to estimate yield per head. Shattering was rated by estimating the percent of florets that had been shattered by the time of harvest. Other traits were measured in a manner similar to Cycle 2.
Selections were made manually to choose the best plants for an array of traits. Based on a Z-score index of yield per head, seed weight and percent naked seed, 28 genotypes were selected. Additional plants were selected based on yield per head, seed weight, a Z-score index of yield and height, low shattering, percent naked seed and percent fertility (seed set), so that a total of 94 plants were selected. After 49 days of vernalization treatment, plants were split into multiple ramets, planted in 7.6 L pots and brought to the greenhouse for crossing. Crosses were made pairwise between plants with the intent to combine plants with complimentary traits (for instance a plant with large seed but low yield would be mated to a plant with high yield but smaller seed). Crosses were also made between plants that were outstanding for a single trait, and some heads were also allowed to cross-pollinate at random with the other selected plants. Controlled crossing was achieved by initially bagging all heads to prevent accidental cross-pollination. For intermating, heads of each plant were placed together in an unwaxed white baguette bag measuring 11.4 by 61 cm (WebstaurantStore, Lititz, PA, USA). Bags were tapped daily to aid pollen dispersal and were not opened until the heads were beginning to turn brown.
2.4. Cycle 4
Seed was threshed from intermated Cycle 3 heads, planted to plug trays and transplanted to the field in spring of 2011. Although the plants initially established, the following summer produced severe drought conditions that resulted in the death of most plants. Therefore, remnant seed was used to replant in the fall. Seeds were placed in plugs (3.5 cm square, 4 cm deep) containing Preforma growth medium (Jiffy Products of America, Lorain, OH, USA). Plugs were transplanted to the field using a mechanical transplanter Model 500WD (Mechanical Transplanter Co., Holland, MI, USA). Rows were planted 91.4 cm apart and within-row spacing was approximately 66 cm. Plants were not on a grid, so row cultivation was only in one direction for weed control. Tillage between plants was accomplished with a two row Hydra-Weeder (Willsie Equipment Sales, Thedford, ON, Canada). A total of 13,983 plants was established, of which 5800 were from pairwise crosses and the remainder were from outcrosses. The outcrossed seed was used due to failure of the spring planting to establish. Due to limitations of the transplanter, plants of individual families were established in groups, with most families split into two groups and the locations of the groups were distributed randomly.
In previous selection cycles, plants were allowed one summer in the field to establish prior to data collection. Beginning in the fourth cycle, harvest and data collection were performed in the first year. In the first growing season, maturity is uneven and stem diameter is more variable. To reduce variability, workers were instructed to harvest the three heads from each plant that appeared to have the largest diameter stem just below the base of the head (peduncle) and were the most mature (largest percentage brown). Choice of heads to harvest was not a selection criterion, it was simply a way to reduce experimental error. Harvest was performed when the majority of plants had heads with all of the glumes mostly brown. The rachis of some heads remained green at harvest, but all seed was brown and hard.
All harvested heads were threshed in a mini-Vogel thresher, the seed was cleaned by aspiration and sieving as in previous cycles, the percent naked seed was estimated visually and the sample was weighed. Naked seed yield of all plants was estimated by assuming that in-hull seeds consisted of 70% clean seed by mass. Seed from the 1161 plants with the highest estimated naked seed yield was fully dehulled using an LH 5059 laboratory oat huller (Codema, LLC, Maple Grove, MN, USA). Approximately 20 seeds were counted from each sample, and these were weighed to obtain an estimate of mass per seed. Selections were made based on percent naked seed, yield per head and mass per seed. In total, 71 plants were selected.
Selected plants were dug from the field, vernalized to induce heading and placed in the greenhouse for intermating. Pairwise intermating was performed following a protocol similar to that described above in Cycle 3.
2.5. Cycle 5
In the fifth selection cycle, establishment protocol was based on the same procedure used in Cycle 4, including fall transplanting. In this cycle, only seed from pairwise matings in the greenhouse was used to establish 11,042 seedlings. Harvest and data collection were performed in the first flowering season, summer 2014. All plants were harvested with three heads that were mature and had the thickest peduncles by visual estimation being selected from each plant (as in Cycle 4 this sampling was not a part of selection but utilized to reduce sampling error). Heads were cut at the base of the lowest spikelet, and the harvested heads were weighed. Shattering was also rated visually on a score of 0 to 3, based on the number of seed shattered prior to weighing or shattering when the heads were dropped from a height of 25 cm.
Plants with the lowest shattering and highest head mass were selected for threshing. Heads from a total of 2220 plants were threshed, the seed was cleaned according to the protocol in Cycle 4, percent naked seed was estimated, and the seed was weighed. Samples with the highest seed yield were then dehulled with an LH 5059 laboratory oat huller. Dehulled seed was weighed, and 20 naked undamaged seeds were counted and weighed from each sample to determine mass per seed.
Selections were made manually by sorting data based on yield per head, mass per seed, shatter resistance and percentage of naked seed. In total, 66 plants were selected. Selected plants were mated in the greenhouse following the same protocol as previous cycles.
2.6. Cycle 6
The sixth selection cycle was established in fall 2015. It contained two sections that were established adjacent to one another. The first section, referred to as the Randomized Plot, had plants from 674 full-sib families arranged in a completely randomized design. Up to 5 plants were established per family, totaling 3658 plants. The plants were started in the greenhouse in Jiffypots (Jiffy Products of America, Lorain, OH, USA) sized 4.5 cm square and 5.5 cm deep. Rows were planted 91.4 cm apart and within-row spacing was 61 cm. The second section, referred to as the Extended Plot, was established using plugs and a mechanical transplanter, as in the previous two cycles. In the Extended Plot, plants were grouped by family. Families were planted randomly, but all the plants of a given fullsib family were established in a single row adjacent to one another (except in cases where a family carried over in the transplanter from one row to the next). The Extended Plot contained 16,702 plants, bringing the total number of plants established to 20,360.
Data collection and subsequent selection was performed in the first growing season, during 2016. Most data were only collected from the Randomized Plot. Flag leaf length and width were measured on a single representative leaf, with width measured at the widest point of the leaf. Stem strength was measured by placing hooks placed 5 cm apart just below the third node from the top of the plant. A Mark-10 Series 5 force gauge (Copiague, NY, USA) was attached to the center of the stem segment and steadily pulled until stem breakage occurred. Force required to break the stem was recorded. Stem angle was estimated at the initiation of head emergence. Average stem angle was recorded as 90° = vertical and 0° = horizontal. Three mature heads with among the widest peduncles were harvested from each plant. Seeds were threshed and cleaned as in previous cycles. Percent naked seed was visually estimated. About 20 undamaged naked seed from each sample were photographed on a white background. Images of seeds were analyzed using ImageJ 1.50f [25]. The software’s particle analysis functionality was used to count seeds and measure their area, length and width. Plumpness was estimated by dividing mass per seed by seed length in mm to obtain mg seed mass per mm of length. Prior to threshing, shattering was rated numerically from 0 to 4 as follows: (0) spikelets can be bent to a 90° angle with the rachis without breaking, (1) no shattering after dropping three times from 25 cm, (2) 1–5 florets shatter after dropping three times from 25 cm, (3) more than 5 florets per head have shattered after dropping from 25 cm three times and (4) more than 50% of florets shattered. Number of spikelets were counted from one representative head, and average number of florets per spikelet was estimated. Number of spikelets was multiplied by florets per spikelet to obtain an estimate of florets per head. Seed number per head was estimated by dividing seed mass per head by mass per seed. Percent seed set (fertility) was estimated by dividing seed number per head by number of florets. Peduncle diameter was measured on one representative head. Maturity was rated during anthesis using the BBCH scale. Plant height and flag leaf height were both measured after anthesis to ensure maximum height was attained.
After collecting data on the Randomized Plot, predicted family means based on pedigree were calculated for the priority traits of yield per head, seed nakedness, mass per seed, shattering and seed shape measurements. Families were ranked for these traits and the 50 top families for these traits were selected for harvesting from the Extended Plot. A total of 926 additional plants were harvested from the Extended Plot. In addition to seed and head traits, plant height was collected for these additional plants. Other plant traits could not be collected due to the late date.
Selections in Cycle 6 were made based on sorting predicted values based on pedigree and searching manually for individuals with preferred values for a maximum number of trait combinations. Of the 86 selected plants, 16 were chosen because of the diversity represented in their pedigree, even though they might not have been otherwise selected. Traits considered for selection included: yield per head, percent seed set, growth stage, mass per seed, percent naked seed, erect stem angle, seed width, seed area, seed plumpness, short height, peduncle diameter, stem strength and low shattering.
2.7. Statistical Analysis
In the first selection cycle, trait data was analyzed using PROC GLM of SAS (SAS Institute Inc., Cary, NC, USA). Adjusted means for each trait of each genet were generated using the LSMEANS option, to account for missing data in some replicates. All selections were made using the adjusted means.
Trait data from the second selection cycle was analyzed using Genstat (VSN International, Hemel Hempstead, UK). In the analysis, AR1 X AR1 error modeling was used to account for spatial heterogeneity in the field. Selections were based on predicted values that removed the modeled spatial variance.
Beginning with the third selection cycle, pedigrees were constructed from breeding records for all plants that were grown. The pedigrees began with individual genets in the Cycle 1 breeding nursery. In cases where open-pollination was performed, the unknown male parent was assigned membership to a genetic group that represented the pollen cloud in the environment where the seed was produced. Analysis was performed using ASReml Stand Alone, versions 2.0-4.1 (VSN International, Hemel Hempstead, UK). The AR1 X AR1 error modeling approach was used to account for spatial heterogeneity and to reduce the impact of spatial patterns on the data, given that plants were arranged in groups based on full- or half-sib family. Because the AR1 X AR1 model requires a complete rectangular design and the fields were irregularly shaped, dummy entries containing no data were added to the data set to generate a rectangular design. Predicted values using the individual model were generated for each plant, based on the pedigree, [26] and selections were made based on these predicted values. In cases where full-sib families were planted, the interaction between mother and father was included as a random term in the model to remove non-additive variance from the predicted values.
Although analysis techniques and statistical approaches evolved over the six breeding cycles so far, the retrospective analysis of the breeding program presented here was conducted by re-analysis of all breeding cycles using a consistent approach. The ASReml Stand Alone program version 4.1 (VSN International, Hemel Hempstead, UK) was used to partition variance components in each breeding cycle. Additionally, broad- or narrow-sense heritability was calculated for each trait as appropriate, and standard errors were calculated with the Delta method [26]. Phenotypic correlations between traits were calculated using Genstat. Heritability estimates and actual selection differentials in each cycle of selection were used to predict response to selection for some measured traits from each cycle except Cycle 5, because in this cycle only two traits were measured on all plants. In Cycle 1, maximum predicted response to selection was calculated as [27] (pp. 161–163):
where Rmax = maximum unstandardized response to selection, = total genetic variance, = phenotypic variance, = mean of the whole population and = mean of selected plants. This would be the predicted response in selected clones but in a cross-pollinated species would be the upper limit of progress if broad sense heritability were equal to narrow sense heritability (and in practice narrow sense heritability is expected to be less than broad). In other cycles, family structure enabled the estimation of additive genetic variance, so that the predicted response to selection could be calculated as:
where R = unstandardized response to selection, = additive genetic variance [27].
2.8. Genomic Profiling
With the decreasing cost of genetic markers and tractable methods to study complex genomes [28], a subset of plants from the Cycle 6 Randomized Plot were genotyped with genotyping-by-sequencing using methods by Poland et al. [29]. Single nucleotide polymorphic (SNP) markers were identified with the TASSEL GBSv2 pipeline [30] by using the draft intermediate wheatgrass genome version 1 as the reference genome (access provided by The Thinopyrum intermedium Genome Sequencing Consortium). In total, 3037 individuals were genotyped and 131,879 SNPs were identified. Filtering was used to identify SNP loci that: (1) Aligned to only one place in the genome. SNPs that aligned to multiple locations were discarded. (2) Contained a minimum of four tag counts per individual to call a homozygous genotype. Heterozygotes were called with a minimum of two tags with different alleles per individual. If the minimum count was not met, the genotype call for the individual was set to missing. (3) Had less than 70% missing data per locus. (4) Only contained biallelic markers; insertions, deletions and triallelic markers were not considered. (5) Had a minor allele frequency (MAF) greater than 0.01. In addition to filtering loci, individuals with more than 95% missing data were excluded. After filtering, the data set was imputed using Beagle version 4.1 [31]. The final data set contained 3011 individuals and 18,357 markers.
2.9. Genomic Heritability
In addition to reporting heritability estimates using pedigree information, similar to all other cycles, the Cycle 6 data was analyzed for each trait using a mixed model and the genomic realized relationship matrix. The realized relationship (G matrix) accounts for observed differences across the genome, in contrast to the pedigree (A matrix) which is based on the probability that alleles are identical be descent [26]. Using the G matrix has been shown to measure similarity between individuals more precisely than pedigree information [32]. For each trait, the data set analyzed included the number of individuals with data along with the individuals that had been genotyped. If an individual lacked genotypic or phenotypic data, it was set to missing. Individuals that were derived from selfing were removed from the data set. The number of observations for each trait, after filtering, ranged from 1025 to 2765.
The R language [33] and the ASReml package [34] were used to fit the mixed model. For each trait, a model was fitted with random effect terms for mother, father, mother x father interaction and genet. The realized relationship matrix (G matrix) was formed using the rrBLUP package [35] and modeled the variance-covariance relationship between genets. Finally, to account for spatial variation in the field, an AR1 X AR1 row-column design was used in the error structure of the mixed model.
The inclusion of random terms for mother, father and mother x father interaction allowed for the calculation of variance components attributable to additive and nonadditive effects. Narrow sense heritability was calculated as [36]:
where
and = total variance; = breeding value variance [37]; , = nonadditive variances for the maternal variance, paternal variance and specific combining ability variance; and = residual error variance of the model. The dominance ratio, d2, was also calculated for each trait. Assuming no epistasis or higher order gene interactions, the ratio estimates the significance of dominance [38] and was calculated as [36]:
3. Results
The intermediate wheatgrass domestication program described here spans 14 years and six cycles of selection. The selection protocol evolved over time as more resources were available and in response to results of the previous cycles. Despite variation in environment and methodology, heritability estimates were usually in the range of 0.2 to 0.4, indicating substantial genetic control for the measured traits. Furthermore, the selection differentials for target traits were usually large enough to produce predicted gains from selection in key traits that generally exceeded 10% per cycle and sometimes were larger than 40% per cycle.
3.1. Cycle 1
The first selection cycle was conducted using three cloned ramets from each genet. With this structure, we were able to calculate broad sense heritability estimates, which are expected to be larger than the narrow sense estimates used in later selection cycles, because broad sense estimates include all sources of genetic variance in the numerator. Predicted responses calculated in this cycle would be appropriate for selection of clones for vegetative propagation, but they should be regarded as upwardly biased in the breeding program described here.
The trait with the largest predicted response (15.7%) was seed yield per head (Table 1). The highest selection differential (51.5%) was also associated with this trait. Heritability estimates calculated using the AR1 X AR1 spatially adjusted model were either the same or slightly higher than those derived from the standard randomized complete block model that was used in selection.
In the first selection cycle, phenotypic correlations were examined to ensure that selection for desired traits would not be likely to produce strong undesirable correlated responses in other traits. The positive correlation (r = 0.301) found between seed yield per head and plant height (Table S1) is potentially undesirable, since taller plants might have greater risk of lodging. From a biomass perspective, this correlation could be beneficial if we are breeding for dual biomass and grain use. Spread by rhizomes had no correlation with seed yield per head (p = 0.927), indicating that selection for yield was unlikely to reduce rhizome production and possibly perennial survival (Table S1). Seed yield per head was also not negatively correlated with post-harvest regrowth, another indicator that selection for seed yield should not directly reduce perennial survival.
3.2. Cycle 2
In the second selection cycle, heritability estimates ranged from 0.12 to 0.67, depending on the trait (Table 2). Seed yield per head had the lowest heritability but a large selection differential of 142.7%. Therefore, the predicted increase in this trait was 16.9%. The largest response predicted was in percent naked seed, which had a heritability of 0.39 and a selection differentia of 181.4%.
3.3. Cycle 3
The third selection cycle was the first in which pedigrees where used to calculate heritability and generate predicted values for selection. Across all traits measured, heritability was either higher or similar to values obtained from the family model, which had been used in the previous cycle (Table 3). Four yield-related traits, namely, seed number per head, percent seed set, seed yield per head and shatter rating, had the largest selection differentials and also the largest predicted responses to selection. Mass per seed had a heritability from the pedigree model of 0.52, but the selection differential was only 6.1%, and the predicted response to selection was similarly low at 3.2%. Shattering was first rated in Cycle 3, and it was found to have a heritability of 0.52; with the selection scheme used it was predicted to decline by 12.6% in this cycle.
3.4. Cycle 4
Cycle 4 was the first breeding cycle in which a two-step process of data collection was used. Heads from all plants were threshed, but only samples from the highest yielding plants were subsequently dehulled. This cycle also represented a substantial increase in the number of plants established for evaluation. In this generation, the selection differential for seed yield per head increased to 124.6% and the predicted response was a 40.5% increase for this trait (Table 4). Mass per seed had a notably high heritability of 0.68, but it must be mentioned that this trait was only measured on the subset of plants with the highest yield per head.
3.5. Cycle 5
In the fifth breeding cycle, only the traits of head weight and shatter rating were collected on all plants. Head weight heritability was calculated to be 0.14, (se = 0.040) and shatter rating heritability was 0.06 (se = 0.024). Based on head weight, 1198 plants were selected for threshing and subsequent analysis of mass per seed, percent naked seed and yield per head. Because these traits were only determined for a nonrandom subset of plants, predicted response to selection could not be calculated. The correlation between head weight and yield per head for the threshed samples was r = 0.50 (p < 0.001).
3.6. Cycle 6
In the most recently completed breeding cycle, heritability was calculated from the subset of plants that were completely randomized, and therefore estimates should be more accurate than Cycles 4–5 where plants were arranged by family. However, predicted gain estimates are likely to be somewhat biased because the selection differential only includes 32 of 80 selected plants, since many of the selected plants came from the more extensive field of plants that were arranged by family.
Seed yield per head was the trait with the highest predicted gain, at 15% (Table 5). Selection differentials were moderate in this cycle, with the greatest differential being 34.6% for seed yield per head. Traits that were not a part of the selection criteria are expected to remain mostly unchanged, since predicted responses for these traits were less than 2%.
Moderate predicted gains could have been due to either declining genetic variability or changing selection methods which included consideration of a larger number of traits. To determine the impact of selecting for a large number of traits, we calculated predicted gains for traits if selection would have been performed by simply selecting the top 50 plants for each of those traits. In the case of seed yield per head, selection for only this trait would have resulted in a selection differential of 154% and predicted gain of 67%. Selection only based on mass per seed would have resulted in a selection differential of 69% and a predicted gain of 21%.
Cycle 6 was the only breeding cycle in which traits were measured in two consecutive growing seasons and in which genetic marker data was available from some of the plants. Heritability of traits either remained constant or declined from the first to second growing season (Table 6). Averaged across all traits measured in both years, heritability declined from 0.33 in year 1 to 0.25 in year 2 when using the pedigree model. Using the model with the marker matrix, average heritability across traits measured in both years declined from 0.51 in year 1 to 0.31 in year 2. In the second season, selected plants had been removed from the field. Therefore, plants with the most extreme values were not present in the second year’s data set, possibly contributing to the reduced heritability estimates. However, heritability declined sharply from year 1 to year 2 even for traits that did not experience strong selection, such as spikelets per head (Table 6).
For most traits, in both models the dominance ratio was lower than the heritability for each trait (Table 6). However, there were some notable exceptions, such as head length and plant height in the pedigree matrix model. For these traits, the dominance ratio was about equal to heritability in the pedigree model. But when the marker matrix was used in the model, heritability for these traits increased dramatically, while the dominance ratio usually declined.
Averaging across all traits, heritability estimates were 0.51 when the marker matrix was used in the model and 0.33 when the pedigree matrix was used (Table 6). In comparison, the dominance ratio averaged 0.12 and 0.15 using the marker matrix and pedigree matrix models, respectively. Individual dominance ratios from the marker matrix model were statistically similar to dominance ratios from the pedigree matrix model.
Many traits were measured in two years, and the two measurements were in all cases positively correlated (Table S2). The strongest correlations between years were for some of the most agronomically important traits such as percent naked seed (r = 0.580), seed length (r = 0.712), mass per seed (r = 0.453), seed yield per head (r = 0.404) and seed number per head (r = 0.464).
3.7. Predicted Progress
Predicted gain from selection was calculated in a cumulative fashion over five of the six selection cycles for three traits, namely seed yield per head, percent naked seed and mass per seed. Predicted gain from selection was not available from Cycle 5, due to the selection approach used in this generation. Across five selection cycles, seed yield per head, percent naked seed and mass per seed were predicted to have increased by 143, 181 and 60%, respectively.
Percentage increase in mass per seed was less than 50% of the gains predicted in seed yield per head and percent naked seed. The relatively low increases in mass per seed could be due to low heritability or limited selection differentials. Across the five generations used to calculate accumulated progress, heritability estimates averaged 0.29, 0.49 and 0.39 for yield per head, mass per seed and percent naked seed, respectively. Average selection differentials on a percentage basis, were 79, 19 and 87% for yield per head, mass per seed and percent naked seed, respectively, indicating that mass per seed had good heritability but a low selection differential relative to the other two traits.
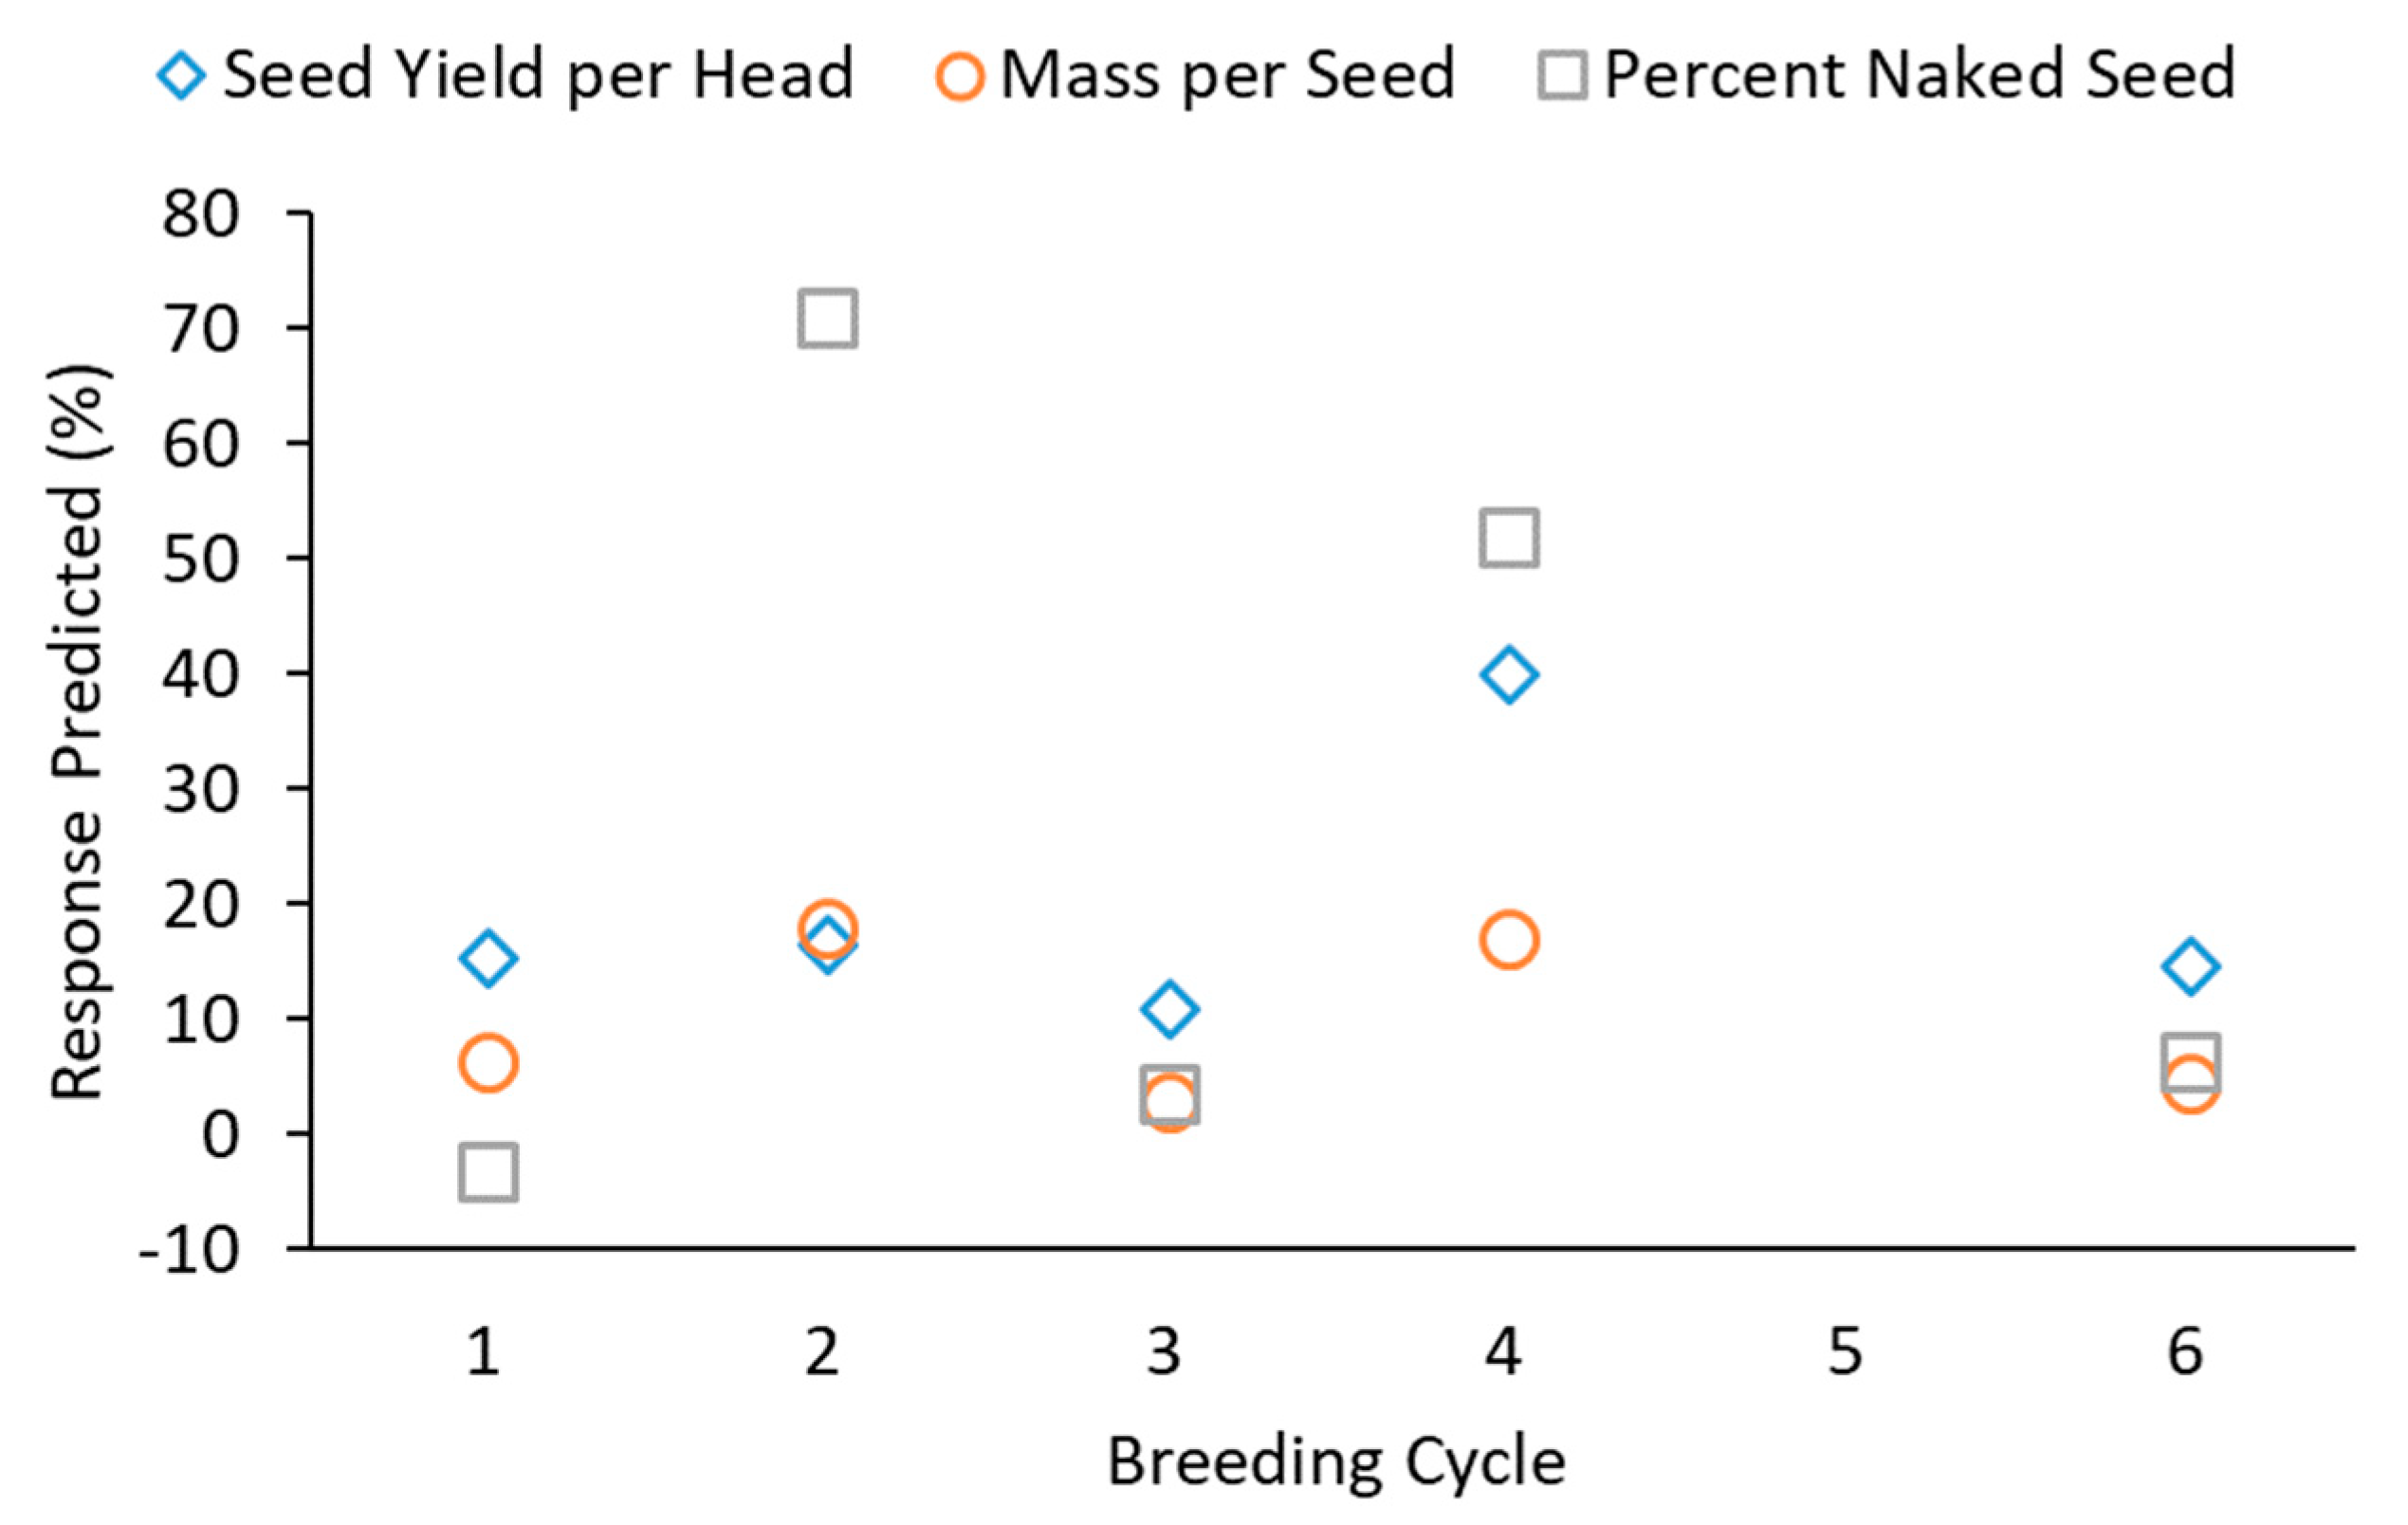
Predicted response to selection was variable from cycle to cycle, with no clear trends (Figure 1). If predicted responses were decreasing, we would be concerned that useful genetic variation in the population was eroding, limiting potential progress. While this was not observed, at some point reduced genetic variation is expected to limit breeding progress and plans must be made to introduce new genetic variation into the program. Predicted response to selection for seed yield per head was particularly high in Cycle 4 (Figure 1). This result is not surprising considering that this cycle had a large number of individuals (13,983) evaluated, paired with selection on only three traits. Although Cycle 1 involved selection for two traits, only 961 genets were evaluated. The benefits of a large population for selection are apparent, as predicted response was nearly double. Although Cycle 6 also benefitted from a large population, many traits were used for selection, limiting progress on any particular trait.
4. Discussion
We evaluated data collected from a breeding program that evolved through six cycles of selection in order to estimate heritability and predict expected gains from selection in each breeding cycle. Breeding methodologies changed over the six cycles, and techniques used for calculating heritability also evolved from the first to last cycle. The first breeding cycle used cloned genotypes, which limited calculations to broad sense heritability. Through the third selection cycle, heritability was calculated using structures that violated the necessary assumptions of random mating, gametic phase equilibrium and balance in the design [39]. Beginning in the fourth cycle, pedigrees were used to estimate heritability. Using a pedigree-based model with REML dealt with the violated assumptions in earlier generations [40]. However, the pedigree used in this and later generations was known to be incomplete and prone to errors. In Cycle 6, a marker-based genomic relationship matrix was used to estimate heritability. This approach was expected to remedy the shortcomings of the pedigree-based approach by obtaining accurate estimates of relatedness among plants in the program [41].
Over generations of a breeding program, heritability can be eroded through the systematic loss of genetic diversity associated with selection; therefore progress can be slowed. Although many factors could influence heritability across the breeding cycles, there was no evidence of a limiting erosion of heritability, since heritability estimates for most traits remained as high in the sixth cycle as they were in previous cycles. However, predicted gains for mass per seed were low throughout the project due to small selection differentials, even though selection methods gave strong attention to this trait. Presumably, additional sources of variation may be necessary to achieve more rapid increases in mass per seed.
For data collected in the third selection cycle, we were able to compare the heritability estimates generated using a half-sib family structure versus a relationship matrix derived from the pedigree of each plant. At this point in the breeding program, the pedigree only contained maternal identities. Fathers could only be identified as shared groups of plants present as potential pollen sources. Nonetheless, pedigree-based heritability estimates were either similar to or higher than estimates derived from the family structure. This trend was observed throughout the breeding program, so pedigree-based predicted values were consistently used for selection.
Beginning in Cycle 6, a second opportunity to improve heritability estimates arose when a subset of the plants was genotyped. Genotypes were used to create a genomic relationship matrix, and heritability estimates made using this relationship matrix were compared to those made using pedigrees (Table 6). Heritability was either higher or similar when using the genomic relationship matrix. From a breeding perspective, this higher heritability should translate into a higher rate of genetic gain through improved selection accuracy. We speculate that improvements arose for two potential reasons. First, the pedigrees were incomplete and likely contained errors due to mislabeling and accidental pollinations. Secondly, pedigrees can provide no information on variation within families, and with selection we can expect pedigree information to not represent relationships as completely as can be achieved with a dense set of markers. These results indicate that with adequate genotyping, marker-based predicted values may be preferred for selection over predicted values derived from a pedigree model. Additionally, if genomic selection were used [42], breeding values based on the marker matrix could produce more reliable models than those based on pedigrees in this population.
Because heritability is not only influenced by the genetics of the individuals studied, but also by the environment and experimental techniques, [39] tracking heritability can be useful to evaluate approaches used in the breeding program. As Dudley and Moll have stated, “Characters with high narrow sense heritability values can be improved more rapidly with less intensive evaluation than those with low heritability” [43]. Throughout the breeding program, we have attempted to find a rapid but accurate way to estimate yield per head. In the second cycle, we counted (with some approximation) the total number of heads per plant and then threshed all heads. This approach was time-consuming and resulted in much lower heritability than approaches used in other breeding cycles. In the fourth breeding cycle, we shifted to a technique of only harvesting three heads per plant. This was done in the first growing season, saving time, and it also resulted in heritability as high as that measured in any previous year. Thus, heritability estimates allowed us to refine our breeding approach.
Genetic correlations between traits can be favorable or unfavorable to breeding progress, depending upon whether the direction of correlation is in agreement with the desired trait configuration in the improved crop [44]. Since genetic and phenotypic correlations in plants are generally of a similar direction [45], here we examined simple phenotypic correlations. In general, the most important traits were positively correlated, which should expedite progress (Tables S1 and S2). Positive correlations between traits measured in the first and second years of growth also indicate that progress made in traits for one year will confer benefits to production in other year.
Seed yield per head was positively correlated with percent seed set in the first and sixth cycles (Tables S1 and S2). This result is consistent with previous research, which found phenotypic correlations between fertility and seed yield to range from 0.33 to 0.67 [46]. A previous breeding program achieved 20.3% increases in seed yield per cycle through selection for percent seed set [47]. In the prior breeding program, selection differentials for percent seed set were greater than 100%, while in the current study they were less than 35%. Perhaps in our breeding program selection for mass per seed and reduced shattering also contributed to yield increases, enabling progress for seed yield despite a lower selection differential for seed set.
Some theorists have predicted that increases in seed yield in a perennial plant must come at the cost of other tissues, such as tall stems, rhizomes, or storage that can be used for regrowth [17,18]. In this experiment, we observed that seed yield per head was positively correlated with other competing allocations such as plant height, rhizome production and regrowth after harvest. This pattern is in line with the model where a population undergoing domestication has access to greater total resources through adaptation to the agricultural environment, and so tradeoffs may be less strict than first imagined [20]. Furthermore, predicted gains from selection remained large even through six cycles of selection, which indicates that progress for increased seed production can be made over many generations of selection in a perennial.
Across the five selection cycles where predicted gains from selection were calculated, predicted seed yield per head and percent naked seed per head both increased by more than 140% in comparison to the starting population. Mass per seed is projected to have increased less dramatically, apparently due to relatively low selection differentials. The striking predicted responses to selection were only possible due to large selection differentials. Progress will depend upon useful genetic variation, and some new domesticates such as intermediate wheatgrass apparently have the variation required to enable rapid progress. Other domestication projects should ensure that adequate genetic variation is present in the early generations to enable similarly rapid progress.
Predicted progress for selected traits appeared to remain steady over 6 generations, despite introducing very little new genetic variation into the breeding program. This result is consistent with long-term selection experiments that have shown continued progress for certain traits over many generations [48]. However, actual gain from selection can be different than what is predicted [48]. Therefore, the next research direction will be to determine the observed response to selection over the six breeding cycles described here when grown in a field environment.
5. Conclusions
Although perennial grain crops could enable unprecedented levels of sustainability in modern food production systems, herbaceous perennial plants that produce abundant edible seeds are unavailable. One approach to developing such crops is to domesticate wild perennial grasses. Success of the approach depends on the ability to make sustained gains in important domestication traits over multiple rounds of selection. Here we have shown that predicted response to selection varied based on population size and selection protocol, but predicted gains in key traits, such as yield per head, remained greater than 10% per cycle through six cycles of selection. Although progress must additionally be confirmed by comparing selected to unselected populations in field conditions, at this point evidence does not suggest that domestication of perennial grasses for grain harvest will be prohibitively difficult. Average predicted gains from selection across five cycles were 143, 181 and 60% respectively, for seed yield per head, percent naked seed and mass per seed. Therefore, development of perennial grain crops remains a viable approach to addressing sustainability concerns in crop production.
Throughout the breeding program, numerous traits were evaluated to predict the impact of selection on unselected traits and prevent unwanted changes in the population. For instance, selection for seed yield per head might have provoked large increases in head length or number of florets per head. We found that predicted increases in head length and number of florets per head remained low, at less than 2% per cycle. Alternatively, the desirable trait of percent naked seed was predicted to change little by selection for seed size and yield in Cycle 1, so this trait was selected directly in later cycles, resulting in predicted increases.
In agreement with theory, selecting for fewer traits allowed more predicted progress. In Cycle 4 when the population was large and the number of traits selected was limited to three, a 40.5% increase in yield per head was predicted. In Cycle 6, selection was based on thirteen traits, and predicted increase in yield per head was limited to 15%. At this point in the breeding program, improving other key traits was an acceptable tradeoff for direct yield gains. But, in a crop that is not yet commercially produced, ranking various traits is certain to be a challenge. Here, we have initially focused on boosting yield through breeding and have later focused on other traits that are necessary in production systems, such as lodging resistance through increased stem strength.
In the most recent breeding cycle we were able to compare heritability calculations based on either a pedigree or molecular-marker-based relationships. We observed that for many traits markers produced an increase in calculated heritability. Therefore, we expect that using marker-based predicted values for selection should increase breeding progress. Increased heritability is likely to be due to avoiding errors present in pedigrees and revealing true relatedness that is masked by the average values calculated from a pedigree. Adapting the breeding program to past results as well as incorporating new techniques should allow for sustained increases in intermediate wheatgrass yield and agronomic traits.
Supplementary Materials
The following are available online at https://www.mdpi.com/2071-1050/10/5/1499/s1, Table S1: Cycle 1 Phenotypic Correlations, Table S2: Cycle 6 Phenotypic Correlations.
Author Contributions
L.D. conceived and designed the experiments; L.D. and M.C. performed the experiments; L.D. and J.C. analyzed the data; J.P. contributed analysis tools; L.D. wrote the paper.
Acknowledgments
This work was sponsored in part by two grants received from NCR-SARE: “Domesticating Intermediate Wheatgrass for Sustainable Grain Production” and “Participatory Plant Breeding and Agroecology to Develop Intermediate Wheatgrass for Sustainable Grain Production.” Postdoctoral fellowship funding was provided by The Perennial Agriculture Project, in conjunction with the Malone Family Land Preservation Foundation and The Land Institute. Pre-publication access to the intermediate wheatgrass genome sequence was provided by The Thinopyrum intermedium Genome Sequencing Consortium. Four anonymous reviewers provided helpful critique and suggestions to improve the manuscript, for which we are grateful.
Conflicts of Interest
The authors declare no conflict of interest. The founding sponsors had no role in the design of the study; in the collection, analyses, or interpretation of data; in the writing of the manuscript and in the decision to publish the results.
References
- Wagoner, P. Intermediate wheatgrass (Thinopyrum intermedium): Development of a perennial grain crop. In Cereals and Pseudocereals; Williams, J.T., Ed.; Chapman and Hall: London, UK, 1995; pp. 247–259. [Google Scholar]
- DeHaan, L.R.; Ismail, B.P. Perennial cereals provide ecosystem benefits. Cereal Foods World 2017, 62, 278–281. [Google Scholar] [CrossRef]
- Culman, S.W.; Snapp, S.S.; Ollenburger, M.; Basso, B.; DeHaan, L.R. Soil and water quality rapidly responds to the perennial grain Kernza wheatgrass. Agron. J. 2013, 105, 735–744. [Google Scholar] [CrossRef]
- Glover, J.D.; Reganold, J.P.; Bell, L.W.; Borevitz, J.; Brummer, E.C.; Buckler, E.S.; Cox, C.M.; Cox, T.S.; Crews, T.E.; Culman, S.W.; et al. Increased food and ecosystem security via perennial grains. Science 2010, 328, 1638–1639. [Google Scholar] [CrossRef] [PubMed]
- Cox, T.S.; Van Tassel, D.L.; Cox, C.M.; Dehaan, L.R. Progress in breeding perennial grains. Crop Pasture Sci. 2010, 61, 513–521. [Google Scholar] [CrossRef]
- DeHaan, L.; Wang, S.; Larson, S.; Cattani, D.; Zhang, X.; Viinanen, T. Current efforts to develop perennial wheat and domesticate Thinopyrum intermedium as a perennial grain. In Perennial Crops for Food Security; Batello, C., Wade, L., Cox, S., Pogna, N., Bozzini, A., Choptiany, J., Eds.; FAO: Rome, Italy, 2014; pp. 72–89. [Google Scholar]
- Wagoner, P. Perennial grain: New use for intermediate wheatgrass. J. Soil Water Conserv. 1990, 45, 81–82. [Google Scholar]
- Cox, T.S.; Bender, M.; Picone, C.; Van Tassel, D.L.; Holland, J.B.; Brummer, E.C.; Zoeller, B.E.; Paterson, A.H.; Jackson, W. Breeding Perennial Grain Crops. CRC. Crit. Rev. Plant Sci. 2002, 21, 59–91. [Google Scholar] [CrossRef]
- Guo, J.; Yu, X.; Yin, H.; Liu, G.; Li, A.; Wang, H.; Kong, L. Phylogenetic relationships of Thinopyrum and Triticum species revealed by SCoT and CDDP markers. Plant Syst. Evol. 2016, 302, 1301–1309. [Google Scholar] [CrossRef]
- Marti, A.; Qiu, X.; Schoenfuss, T.C.; Seetharaman, K. Characteristics of perennial wheatgrass (Thinopyrum intermedium) and refined wheat flour blends: Impact on rheological properties. Cereal Chem. 2015, 92, 434–440. [Google Scholar] [CrossRef]
- Marti, A.; Bock, J.E.; Pagani, M.A.; Ismail, B.; Seetharaman, K. Structural characterization of proteins in wheat flour doughs enriched with intermediate wheatgrass (Thinopyrum intermedium) flour. Food Chem. 2016, 194, 994–1002. [Google Scholar] [CrossRef] [PubMed]
- Zhang, X.; Ohm, J.B.; Haring, S.; DeHaan, L.R.; Anderson, J.A. Towards the understanding of end-use quality in intermediate wheatgrass (Thinopyrum intermedium): High-molecular-weight glutenin subunits, protein polymerization, and mixing characteristics. J. Cereal Sci. 2015, 66, 81–88. [Google Scholar] [CrossRef]
- Zhang, X.; DeHaan, L.R.; Higgins, L.; Markowski, T.W.; Wyse, D.L.; Anderson, J.A. New insights into high-molecular-weight glutenin subunits and sub-genomes of the perennial crop Thinopyrum intermedium (Triticeae). J. Cereal Sci. 2014, 59, 203–210. [Google Scholar] [CrossRef]
- Schendel, R.R.; Becker, A.; Tyl, C.E.; Bunzel, M. Isolation and characterization of feruloylated arabinoxylan oligosaccharides from the perennial cereal grain intermediate wheat grass (Thinopyrum intermedium). Carbohydr. Res. 2015, 407, 16–25. [Google Scholar] [CrossRef] [PubMed]
- Becker, R.; Wagoner, P.; Hanners, G.D.; Saunders, R.M. Compositional, nutritional and functional evaluation of intermediate wheatgrass (Thinopyrum intermedium). J. Food Process. Preserv. 1991, 15, 63–77. [Google Scholar] [CrossRef]
- Denison, R.F. Darwinian Agriculture: How Understanding Evolution Can Improve Agriculture; Princeton University Press: Princeton, NJ, USA, 2012; ISBN 9780691139500. [Google Scholar]
- Smaje, C. The strong perennial vision: A critical review. Agroecol. Sustain. Food Syst. 2015, 39, 471–499. [Google Scholar] [CrossRef]
- Crews, T.E.; DeHaan, L.R. The strong perennial vision: A response. Agroecol. Sustain. Food Syst. 2015, 39, 500–515. [Google Scholar] [CrossRef]
- Van Tassel, D.L.; DeHaan, L.R.; Cox, T.S. Missing domesticated plant forms: Can artificial selection fill the gap? Evol. Appl. 2010, 3, 434–452. [Google Scholar] [CrossRef] [PubMed]
- DeHaan, L.R.; Van Tassel, D.L.; Cox, T.S. Perennial grain crops: A synthesis of ecology and plant breeding. Renew. Agric. Food Syst. 2007, 20, 5–14. [Google Scholar] [CrossRef]
- DeHaan, L.R.; Van Tassel, D.L. Useful insights from evolutionary biology for developing perennial grain crops1. Am. J. Bot. 2014, 101, 1801–1819. [Google Scholar] [CrossRef] [PubMed]
- DeHaan, L.R.; Van Tassel, D.L.; Anderson, J.A.; Asselin, S.R.; Barnes, R.; Baute, G.J.; Cattani, D.J.; Culman, S.W.; Dorn, K.M.; Hulke, B.S.; et al. A pipeline strategy for grain crop domestication. Crop Sci. 2016, 56, 917–930. [Google Scholar] [CrossRef]
- Lancashire, P.D.; Bleiholder, H.; Van Den Boom, T.; Langeluddeke, P.; Stauss, R.; Weber, E.; Witzenberger, A. A uniform decimal code for growth stages of crops and weeds. Ann. Appl. Biol. 1991, 119, 561–601. [Google Scholar] [CrossRef]
- Lima, D.C.; Abreu, Â.d.F.B.; Ferreira, R.A.D.C.; Ramalho, M.A.P. Breeding common bean populations for traits using selection index. Sci. Agric. 2015, 72, 132–137. [Google Scholar] [CrossRef]
- Schneider, C.A.; Rasband, W.S.; Eliceiri, K.W. NIH Image to ImageJ: 25 years of image analysis. Nat. Methods 2012, 9, 671–675. [Google Scholar] [CrossRef] [PubMed]
- Isik, F.; Holland, J.; Maltecca, C. Genetic Data Analysis for Plant and Animal Breeding; Springer International Publishing: Cham, Switzerland, 2017; ISBN 978-3-31-955175-3. [Google Scholar]
- Wricke, G.; Weber, E. Quantitative Genetics and Selection in Plant Breeding; De Gruyter: Berlin, Germany, 1986; ISBN 9783110837520. [Google Scholar]
- Poland, J.A.; Rife, T.W. Genotyping-by-sequencing for plant breeding and genetics. Plant Genome J. 2012, 5, 92–102. [Google Scholar] [CrossRef]
- Poland, J.A.; Brown, P.J.; Sorrells, M.E.; Jannink, J.L. Development of high-density genetic maps for barley and wheat using a novel two-enzyme genotyping-by-sequencing approach. PLoS ONE 2012, 7. [Google Scholar] [CrossRef] [PubMed]
- Glaubitz, J.C.J.; Casstevens, T.M.T.; Lu, F.; Harriman, J.; Elshire, R.R.J.; Sun, Q.; Buckler, E.S. TASSEL-GBS: A high capacity genotyping by sequencing analysis pipeline. PLoS ONE 2014, 9, e90346. [Google Scholar] [CrossRef] [PubMed]
- Browning, B.L.; Browning, S.R. Genotype imputation with millions of reference samples. Am. J. Hum. Genet. 2016, 98, 116–126. [Google Scholar] [CrossRef] [PubMed]
- VanRaden, P.M. Efficient Methods to Compute Genomic Predictions. J. Dairy Sci. 2008, 91, 4414–4423. [Google Scholar] [CrossRef] [PubMed]
- R Core Team. R: A Language and Environment for Statistical Computing; R Foundation for Statistical Computing: Vienna, Austria, 2017. [Google Scholar]
- Gilmour, A.R.; Gogel, B.J.; Cullis, B.R.; Thompson, R. ASReml User Guide Release 3.0; VSN International Ltd.: Hemel Hempstead, UK, 2009; ISBN 1904375235. [Google Scholar]
- Endelman, J.B. Ridge regression and other kernels for genomic selection with R package rrBLUP. Plant Genome J. 2011, 4, 250–255. [Google Scholar] [CrossRef]
- Jordan, G.J.; Potts, B.M.; Wiltshire, R.J.E. Strong, independent, quantitative genetic control of the timing of vegetative phase change and first flowering in Eucalyptus globulus ssp. globulus (Tasmanian Blue Gum). Heredity (Edinb). 1999, 83, 179–187. [Google Scholar] [CrossRef] [PubMed]
- Falconer, D.S.; Mackay, T.F. Introduction to Quantitative Genetics, 4th ed.; Pearson: London, UK, 1996; ISBN 0582243025. [Google Scholar]
- Becker, W.A. Manual of Quantitative Genetics; Academic Enterprises: Pullman, WA, USA, 1985; ISBN 978-0-93-139900-8. [Google Scholar]
- Holland, J.B.; Nyquist, W.E.; Cervantes-Martínez, C.T. Estimating and interpreting heritability for plant breeding: An update. In Plant Breeding Reviews; John Wiley & Sons, Inc.: Oxford, UK, 2010; pp. 9–112. ISBN 978-0-47-121541-7. [Google Scholar]
- Durel, C.E.; Laurens, F.; Fouillet, A.; Lespinasse, Y. Utilization of pedigree information to estimate genetic parameters from large unbalanced data sets in apple. Theor. Appl. Genet. 1998, 96, 1077–1085. [Google Scholar] [CrossRef]
- Frentiu, F.D.; Clegg, S.M.; Chittock, J.; Burke, T.; Blows, M.W.; Owens, I.P. Pedigree-free animal models: The relatedness matrix reloaded. Proc. R. Soc. B Biol. Sci. 2008, 275, 639–647. [Google Scholar] [CrossRef] [PubMed]
- Meuwissen, T.H.E.; Hayes, B.J.; Goddard, M.E. Prediction of total genetic value using genome-wide dense marker maps. Genetics 2001, 157, 1819–1829. [Google Scholar] [PubMed]
- Dudley, J.W.; Moll, R.H. Interpretation and Use of Estimates of Heritability and Genetic Variances in Plant Breeding1. Crop Sci. 1969, 9, 257–262. [Google Scholar] [CrossRef]
- Johnson, H.W.; Robinson, H.F.; Comstock, R.E. Genotypic and phenotypic correlations in soybeans and their implications in selection. Agron. J. 1955, 47, 477–483. [Google Scholar] [CrossRef]
- Waitt, D.E.; Levin, D.A. Genetic and phenotypic correlations in plants: A botanical test of Cheverud’s conjecture. Heredity 1998, 80, 310–319. [Google Scholar] [CrossRef]
- Slinkard, A.E. Fertility in intermediate wheatgrass Agropyron intermedium (Host) Beauv. Crop Sci. 1965, 5, 363. [Google Scholar] [CrossRef]
- Knowles, R.P. Recurrent mass selection for improved seed yields in intermediate wheatgrass. Crop Sci. 1977, 17, 51–54. [Google Scholar] [CrossRef]
- Leng, E.R. Predicted and actual responses during long-term selection for chemical composition in maize. Euphytica 1961, 10, 368–378. [Google Scholar] [CrossRef]
Figure 1.
Predicted response to selection in three traits in each breeding cycle. Response could not be calculated in the fifth cycle. The first cycle predictions are maximal values, based on broad sense heritabilities.
Figure 1.
Predicted response to selection in three traits in each breeding cycle. Response could not be calculated in the fifth cycle. The first cycle predictions are maximal values, based on broad sense heritabilities.

Table 1.
Broad sense (H2) heritability estimates (±standard error), selection differentials and maximum predicted responses to selection for traits measured in Cycle 1.
Table 1.
Broad sense (H2) heritability estimates (±standard error), selection differentials and maximum predicted responses to selection for traits measured in Cycle 1.
| Trait 1 | Heritability from AR1XAR1 Model 2 | Heritability from Randomized Complete Block 3 | Selection Differential (%) 4 | Maximum Predicted Response (%) 5 |
|---|---|---|---|---|
| Seed yield per head | 0.34 ± 0.022 | 0.31 ± 0.022 | 51.5 | 15.7 |
| Growth stage | 0.41 ± 0.021 | 0.41 ± 0.021 | 16.5 | 6.8 |
| Mass per seed | 0.43 ± 0.022 | 0.35 ± 0.022 | 19.0 | 6.6 |
| Percent seed set | 0.22 ± 0.023 | 0.21 ± 0.022 | 20.5 | 4.3 |
| Peduncle diameter | 0.27 ± 0.023 | 0.25 ± 0.022 | 12.8 | 3.2 |
| Head length | 0.33 ± 0.023 | 0.30 ± 0.022 | 6.1 | 1.9 |
| Plant height | 0.38 ± 0.022 | 0.31 ± 0.022 | 3.0 | 0.9 |
| Post-harvest regrowth | 0.17 ± 0.025 | 0.03 ± 0.020 | 11.6 | 0.4 |
| Spread by rhizomes | 0.25 ± 0.023 | 0.19 ± 0.022 | −5.0 | −0.9 |
| Percent naked seed | 0.39 ± 0.026 | 0.36 ± 0.022 | −7.8 | −2.8 |
1 Traits in bold were used in the selection criteria; 2 Model used in later cycles of selection, provided here for comparison; 3 Model used in Cycle 1 selection and used here to calculate predicted response; 4 Percentage difference between selected population and whole population; 5 Maximum percentage change in trait predicted from heritability and selection differential.
Table 2.
Narrow sense (h2) heritability estimates from a half-sib family model (±standard error), selection differentials and predicted responses to selection for traits measured in Cycle 2.
Table 2.
Narrow sense (h2) heritability estimates from a half-sib family model (±standard error), selection differentials and predicted responses to selection for traits measured in Cycle 2.
| Trait 1 | Heritability | Selection Differential (%) 2 | Predicted Response (%) 3 |
|---|---|---|---|
| Percent naked seed | 0.39 ± 0.095 | 181.4 | 71.4 |
| Mass per seed | 0.60 ± 0.137 | 30.5 | 18.3 |
| Seed yield per head | 0.12 ± 0.039 | 142.7 | 16.9 |
| Whole plant yield | 0.28 ± 0.071 | 59.0 | 16.3 |
| Growth stage | 0.67 ± 0.150 | 2.6 | 1.8 |
| Disease rating | 0.16 ± 0.049 | −9.1 | −1.4 |
| Plant height | 0.31 ± 0.078 | −6.3 | −2.0 |
| Number of heads | 0.26 ± 0.068 | −21.2 | −5.6 |
1 Traits in bold were used in the selection criteria; 2 Percentage difference between selected population and whole population; 3 Percentage change in trait predicted from heritability and selection differential.
Table 3.
Narrow sense (h2) heritability estimates (±standard error), selection differentials and predicted responses to selection for traits measured in Cycle 3.
Table 3.
Narrow sense (h2) heritability estimates (±standard error), selection differentials and predicted responses to selection for traits measured in Cycle 3.
| Trait 1 | Heritability from Half-Sib Family Model 2 | Heritability from Pedigree Model 3 | Selection Differential (%) 4 | Predicted Response (%) 5 |
|---|---|---|---|---|
| Seed number per head | 0.29 ± 0.047 | 0.45 ± 0.095 | 34.8 | 15.5 |
| Percent seed set | 0.32 ± 0.049 | 0.43 ± 0.091 | 34.8 | 14.8 |
| Seed yield per head | 0.23 ± 0.042 | 0.27 ± 0.016 | 42.3 | 11.4 |
| Head angle (droop) | 0.27 ± 0.046 | 0.34 ± 0.077 | 20.0 | 6.9 |
| Percent naked seed | 0.32 ± 0.050 | 0.44 ± 0.094 | 8.8 | 3.8 |
| Mass per seed | 0.37 ± 0.052 | 0.52 ± 0.106 | 6.1 | 3.2 |
| Head length | 0.18 ± 0.037 | 0.26 ± 0.064 | 1.4 | 0.4 |
| Florets per spikelet | 0.34 ± 0.052 | 0.44 ± 0.096 | 0.3 | 0.1 |
| Spikelets per head | 0.12 ± 0.031 | 0.15 ± 0.044 | −1.1 | −0.2 |
| Florets per head | 0.22 ± 0.042 | 0.28 ± 0.066 | −0.9 | −0.2 |
| Plant height | 0.20 ± 0.041 | 0.31 ± 0.073 | −1.1 | −0.3 |
| Flag leaf width | 0.38 ± 0.052 | 0.53 ± 0.115 | −0.8 | −0.4 |
| Florets per cm head length | 0.26 ± 0.045 | 0.31 ± 0.071 | −1.7 | −0.5 |
| Shatter rating | 0.34 ± 0.050 | 0.48 ± 0.106 | −26.4 | −12.6 |
1 Traits in bold were used in the selection criteria; 2 Model used in previous selection cycle, provided here for comparison; 3 Model used in Cycle 3 selection and used here to calculate predicted response; 4 Percentage difference between selected population and whole population; 5 Percentage change in trait predicted from heritability and selection differential.
Table 4.
Narrow sense (h2) heritability estimates (±standard error), selection differentials and predicted response to selection for traits measured in Cycle 4. All traits were included in selection criteria.
Table 4.
Narrow sense (h2) heritability estimates (±standard error), selection differentials and predicted response to selection for traits measured in Cycle 4. All traits were included in selection criteria.
| Trait | Heritability | Selection Differential (%) 1 | Predicted Response (%) 2 |
|---|---|---|---|
| Percent naked seed | 0.22 ± 0.029 | 240.9 | 52.2 |
| Seed yield per head | 0.33 ± 0.038 | 124.6 | 40.5 |
| Mass per seed 3 | 0.68 ± 0.172 | 25.7 | 17.4 |
1 Percentage difference between selected population and whole population; 2 Percentage change in trait predicted from heritability and selection differential; 3 Mass per seed was only measured from the 1161 plants with highest yield per head.
Table 5.
Narrow sense (h2) heritability estimates (±standard error), selection differentials and predicted responses to selection for year-one traits measured in the Cycle 6 Randomized Plot.
Table 5.
Narrow sense (h2) heritability estimates (±standard error), selection differentials and predicted responses to selection for year-one traits measured in the Cycle 6 Randomized Plot.
| Trait 1 | Heritability | Selection Differential (%) 2 | Predicted Response (%) 3 |
|---|---|---|---|
| Seed yield per head | 0.43 ± 0.075 | 34.6 | 15.0 |
| Stem angle | 0.48 ± 0.079 | 17.4 | 8.3 |
| Percent naked seed | 0.55 ± 0.073 | 12.1 | 6.7 |
| Mass per seed | 0.30 ± 0.060 | 16.1 | 4.8 |
| Percent seed set | 0.28 ± 0.053 | 14.4 | 4.0 |
| Area per seed | 0.44 ± 0.067 | 8.4 | 3.7 |
| Stem strength | 0.10 ± 0.070 | 26.6 | 2.7 |
| Seed length | 0.53 ± 0.070 | 3.5 | 1.9 |
| Seed width | 0.34 ± 0.064 | 4.8 | 1.7 |
| Seed plumpness | 0.19 ± 0.049 | 7.5 | 1.5 |
| Plant height | 0.28 ± 0.070 | 5.1 | 1.4 |
| Florets per head | 0.28 ± 0.060 | 5.0 | 1.4 |
| Growth stage | 0.29 ± 0.057 | 4.6 | 1.3 |
| Peduncle diameter | 0.15 ± 0.063 | 6.8 | 1.1 |
| Florets per spikelet | 0.28 ± 0.060 | 3.5 | 1.0 |
| Flag leaf height | 0.34 ± 0.072 | 2.6 | 0.9 |
| Spikelets per head | 0.34 ± 0.065 | 1.4 | 0.5 |
| Head length | 0.25 ± 0.063 | 1.0 | 0.3 |
| Spikelets per cm head length | 0.23 ± 0.061 | 0.0 | 0.0 |
| Flag leaf width | 0.31 ± 0.063 | −1.0 | −0.3 |
| Flag leaf length | 0.21 ± 0.054 | −1.5 | −0.3 |
| Shatter rating | 0.28 ± 0.059 | −3.1 | −0.9 |
1 Traits in bold were used in the selection criteria; 2 Percentage difference between selected population and whole population; 3 Percentage change in trait predicted from heritability and selection differential.
Table 6.
Heritability and dominance ratio estimates (±standard error) in the Cycle 6 nursery, calculated from models using a relationship matrix based on either genetic markers or the pedigree associated with each individual.
Table 6.
Heritability and dominance ratio estimates (±standard error) in the Cycle 6 nursery, calculated from models using a relationship matrix based on either genetic markers or the pedigree associated with each individual.
| Trait | Year | Marker Matrix | Pedigree Matrix | ||
|---|---|---|---|---|---|
| Heritability | Dominance Ratio | Heritability | Dominance Ratio | ||
| Area per seed | 1 | 0.61 ± 0.046 | 0.16 ± 0.076 | 0.44 ± 0.067 | 0.16 ± 0.068 |
| 2 | 0.38 ± 0.043 | 0.01 ± 0.068 | 0.39 ± 0.063 | 0.00 ± 0.001 | |
| Flag leaf height | 1 | 0.47 ± 0.062 | 0.22 ± 0.111 | 0.34 ± 0.072 | 0.24 ± 0.098 |
| Flag leaf length | 1 | 0.32 ± 0.043 | 0.08 ± 0.072 | 0.21 ± 0.054 | 0.04 ± 0.065 |
| Flag leaf width | 1 | 0.51 ± 0.045 | 0.00 ± 0.001 | 0.31 ± 0.063 | 0.07 ± 0.058 |
| Florets per head | 1 | 0.40 ± 0.053 | 0.14 ± 0.086 | 0.28 ± 0.060 | 0.06 ± 0.071 |
| 2 | 0.10 ± 0.033 | 0.00 ± 0.001 | 0.08 ± 0.035 | 0.00 ± 0.001 | |
| Florets per spikelet | 1 | 0.32 ± 0.051 | 0.07 ± 0.083 | 0.19 ± 0.051 | 0.06 ± 0.075 |
| 2 | 0.10 ± 0.030 | 0.00 ± 0.001 | 0.05 ± 0.022 | 0.02 ± 0.073 | |
| Growth stage | 1 | 0.63 ± 0.038 | 0.11 ± 0.055 | 0.29 ± 0.057 | 0.21 ± 0.059 |
| Head emergence | 2 | 0.46 ± 0.045 | 0.09 ± 0.064 | 0.32 ± 0.061 | 0.05 ± 0.060 |
| Head length | 1 | 0.65 ± 0.047 | 0.18 ± 0.077 | 0.25 ± 0.063 | 0.26 ± 0.082 |
| 2 | 0.36 ± 0.046 | 0.02 ± 0.068 | 0.19 ± 0.047 | 0.11 ± 0.074 | |
| Mass per seed | 1 | 0.49 ± 0.048 | 0.04 ± 0.074 | 0.30 ± 0.060 | 0.13 ± 0.069 |
| 2 | 0.41 ± 0.042 | 0.11 ± 0.067 | 0.39 ± 0.066 | 0.12 ± 0.065 | |
| Peduncle diameter | 1 | 0.33 ± 0.044 | 0.00 ± 0.001 | 0.29 ± 0.156 | 0.00 ± 0.001 |
| Percent naked seed | 1 | 0.55 ± 0.046 | 0.04 ± 0.073 | 0.55 ± 0.073 | 0.13 ± 0.061 |
| 2 | 0.38 ± 0.042 | 0.21 ± 0.074 | 0.38 ± 0.059 | 0.22 ± 0.070 | |
| Percent seed set | 1 | 0.36 ± 0.052 | 0.02 ± 0.085 | 0.28 ± 0.053 | 0.10 ± 0.072 |
| 2 | 0.19 ± 0.041 | 0.16 ± 0.083 | 0.19 ± 0.050 | 0.14 ± 0.079 | |
| Plant height | 1 | 0.65 ± 0.060 | 0.15 ± 0.097 | 0.28 ± 0.070 | 0.27 ± 0.101 |
| 2 | 0.44 ± 0.045 | 0.17 ± 0.071 | 0.13 ± 0.046 | 0.31 ± 0.086 | |
| Seed length | 1 | 0.74 ± 0.04 | 0.13 ± 0.063 | 0.53 ± 0.070 | 0.14 ± 0.061 |
| 2 | 0.50 ± 0.041 | 0.05 ± 0.061 | 0.47 ± 0.066 | 0.08 ± 0.061 | |
| Seed number per head | 1 | 0.47 ± 0.051 | 0.26 ± 0.088 | 0.43 ± 0.065 | 0.17 ± 0.067 |
| 2 | 0.29 ± 0.044 | 0.26 ± 0.080 | 0.26 ± 0.059 | 0.26 ± 0.079 | |
| Seed plumpness | 1 | 0.42 ± 0.050 | 0.06 ± 0.081 | 0.19 ± 0.049 | 0.15 ± 0.074 |
| 2 | 0.33 ± 0.043 | 0.11 ± 0.073 | 0.25 ± 0.055 | 0.15 ± 0.075 | |
| Seed width | 1 | 0.54 ± 0.048 | 0.21 ± 0.082 | 0.34 ± 0.064 | 0.29 ± 0.080 |
| 2 | 0.28 ± 0.043 | 0.05 ± 0.074 | 0.22 ± 0.051 | 0.05 ± 0.071 | |
| Shatter rating | 1 | 0.36 ± 0.050 | 0.33 ± 0.093 | 0.28 ± 0.059 | 0.40 ± 0.085 |
| 2 | 0.25 ± 0.041 | 0.13 ± 0.073 | 0.21 ± 0.051 | 0.17 ± 0.074 | |
| Spikelets per cm head | 1 | 0.67 ± 0.060 | 0.11 ± 0.073 | 0.23 ± 0.061 | 0.13 ± 0.075 |
| 2 | 0.44 ± 0.047 | 0.08 ± 0.071 | 0.23 ± 0.058 | 0.19 ± 0.082 | |
| Spikelets per head | 1 | 0.43 ± 0.053 | 0.10 ± 0.081 | 0.34 ± 0.065 | 0.06 ± 0.066 |
| 2 | 0.18 ± 0.043 | 0.04 ± 0.077 | 0.18 ± 0.053 | 0.11 ± 0.077 | |
| Stem angle | 1 | 0.62 ± 0.069 | 0.20 ± 0.074 | 0.48 ± 0.079 | 0.24 ± 0.067 |
| Stem strength | 1 | 0.40 ± 0.155 | 0.00 ± 0.001 | 0.10 ± 0.070 | 0.02 ± 0.154 |
| Seed yield per head | 1 | 0.51 ± 0.049 | 0.27 ± 0.085 | 0.43 ± 0.075 | 0.23 ± 0.072 |
| 2 | 0.27 ± 0.044 | 0.24 ± 0.080 | 0.23 ± 0.059 | 0.22 ± 0.079 | |
© 2018 by the authors. Licensee MDPI, Basel, Switzerland. This article is an open access article distributed under the terms and conditions of the Creative Commons Attribution (CC BY) license (http://creativecommons.org/licenses/by/4.0/).
Share and Cite
MDPI and ACS Style
DeHaan, L.; Christians, M.; Crain, J.; Poland, J. Development and Evolution of an Intermediate Wheatgrass Domestication Program. Sustainability 2018, 10, 1499. https://doi.org/10.3390/su10051499
AMA Style
DeHaan L, Christians M, Crain J, Poland J. Development and Evolution of an Intermediate Wheatgrass Domestication Program. Sustainability. 2018; 10(5):1499. https://doi.org/10.3390/su10051499
Chicago/Turabian StyleDeHaan, Lee, Marty Christians, Jared Crain, and Jesse Poland. 2018. "Development and Evolution of an Intermediate Wheatgrass Domestication Program" Sustainability 10, no. 5: 1499. https://doi.org/10.3390/su10051499
Note that from the first issue of 2016, this journal uses article numbers instead of page numbers. See further details here.