Environmental Implications of Eco-Labeling for Rice Farming Systems


Abstract
:1. Introduction
2. Materials and Methods
2.1. Agricultural Product: Rice
2.2. Eco-Labeling System for Agricultural Products
2.3. Life Cycle Assessment for Rice Farming Systems
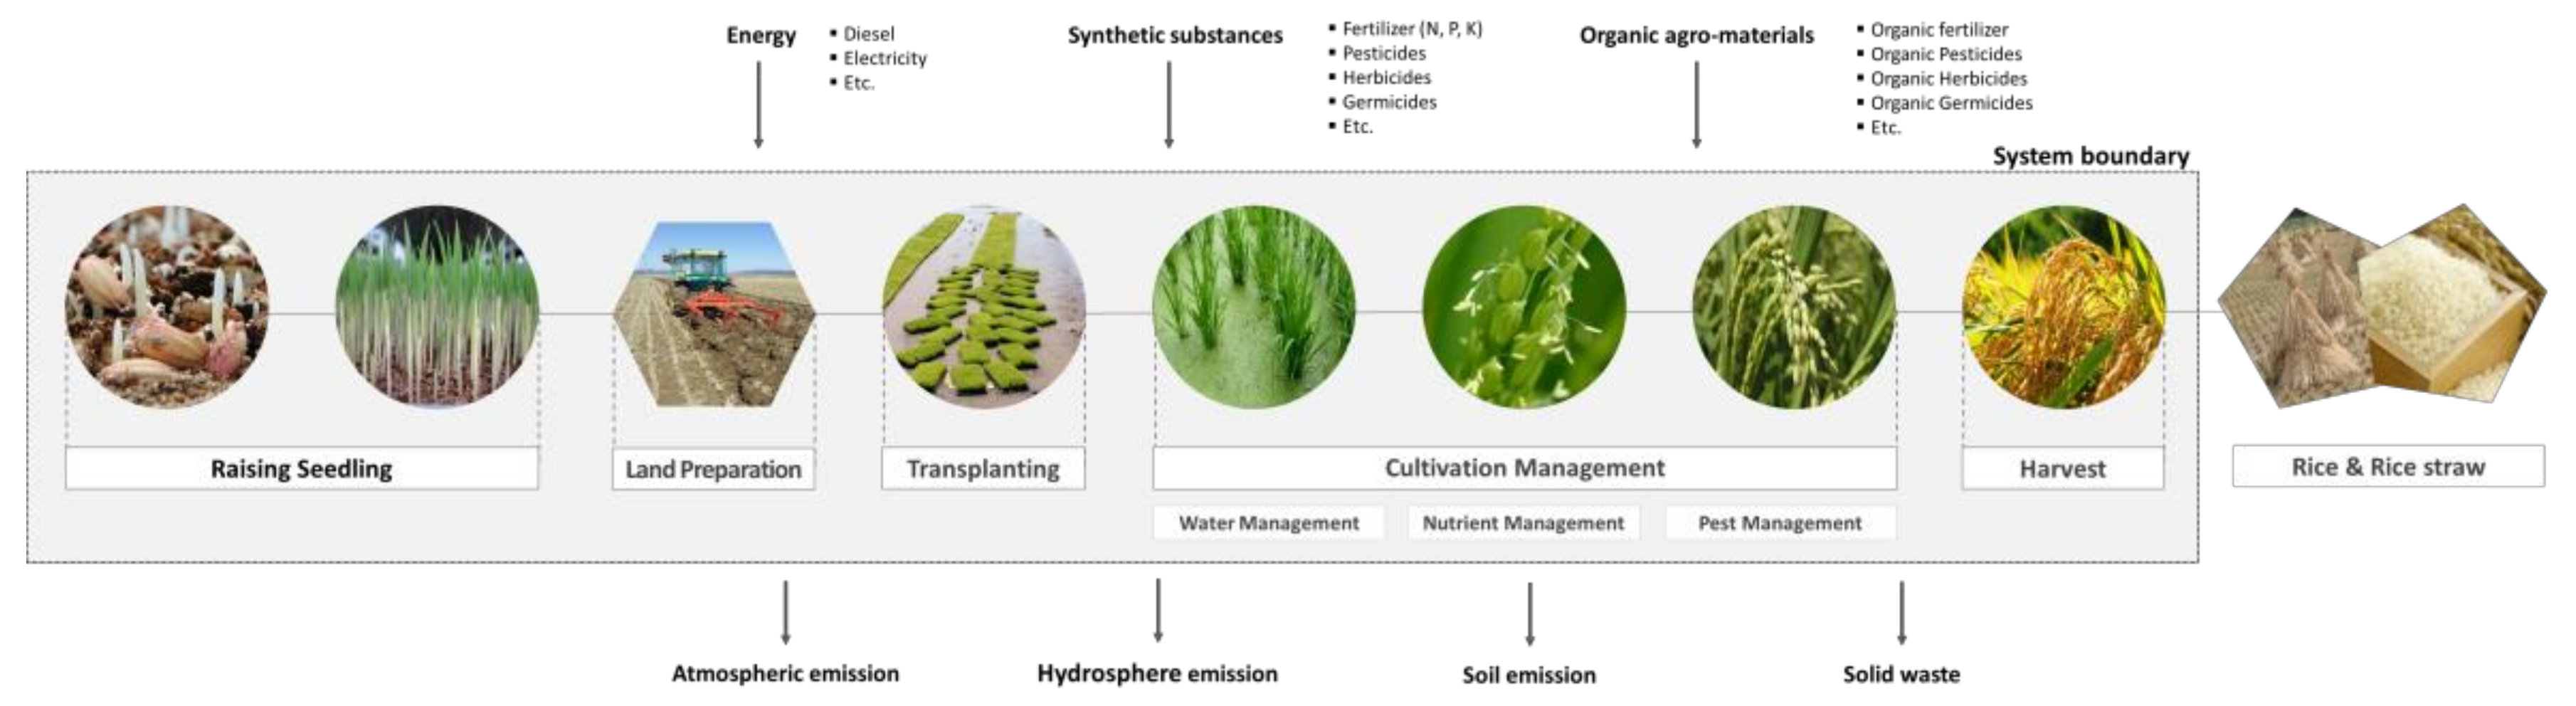
2.3.1. Goal and Scope Definition
2.3.2. Life Cycle Inventory Analysis
2.3.3. Life Cycle Impact Analysis
2.3.4. Interpretation
3. Results and Discussion
3.1. LCA of Rice Farming Systems in South Korea
3.2. Interpretations of Rice Farming Systems
3.2.1. Direct Field GHG Emissions
3.2.2. Feasibility Test of Applicable National LCI
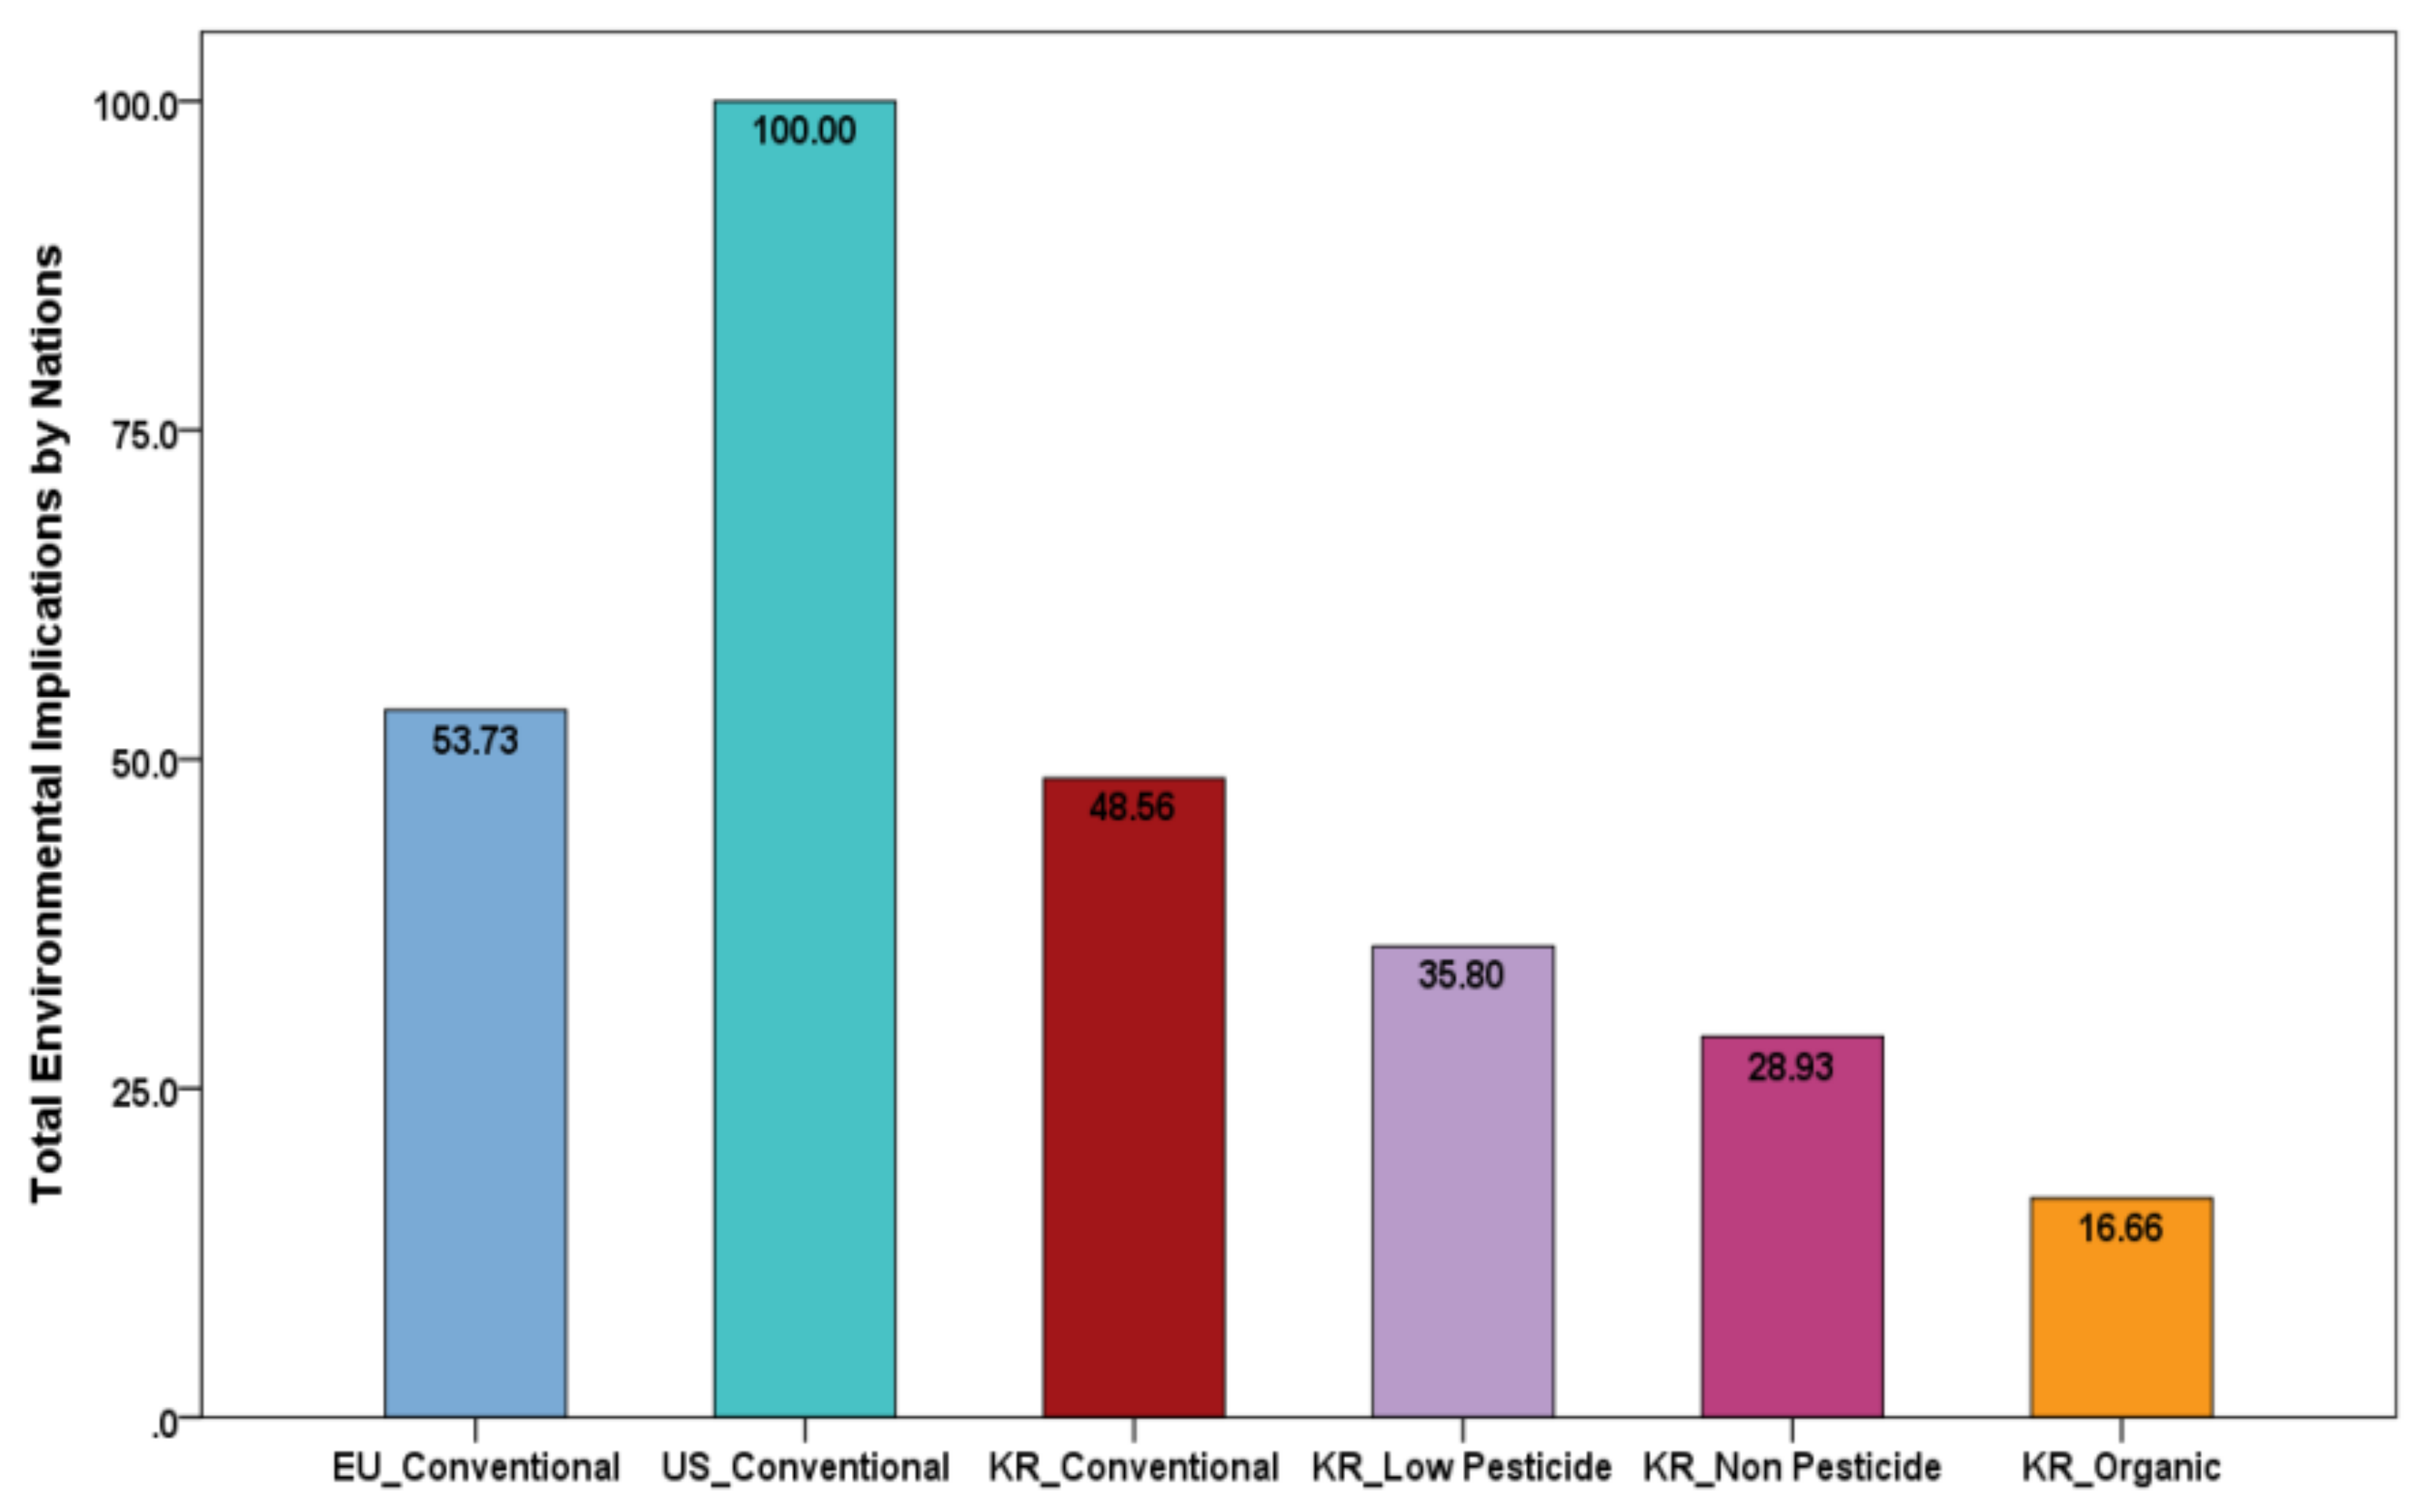
3.3. Comparison of Environmental Implications of Rice Farming Systems by Country
4. Conclusions
Acknowledgments
Author Contributions
Conflicts of Interest
References
- Agriculture and Climate Change in the EU: An Overview. Available online: http://climatepolicyinfohub.eu/agriculture-and-climate-change-eu-overview (accessed on 27 October 2015).
- Haines, A.; McMichael, A.J.; Smith, K.R.; Roberts, I.; Woodcock, J.; Markandya, A.; Armstrong, B.G.; Campbell-Lendrum, D.; Dangour, A.D.; Davies, M.; et al. Public health benefits of strategies to reduce greenhouse-gas emissions: Overview and implications for policy makers. Lancet 2009, 374, 2104–2114. [Google Scholar] [CrossRef]
- Leggett, J.A. China’s greenhouse gas emissions and mitigation policies. Curr. Politics Econ. North. West. Asia 2011, 20, 533–560. [Google Scholar]
- Parry, I.W.H. Are the costs of reducing greenhouse gases from passenger vehicles negative? J. Urban Econ. 2007, 62, 273–293. [Google Scholar] [CrossRef]
- UNTC. Paris Agreement; United Nations Treaty Collection: Paris, France, 2016. [Google Scholar]
- Smith, P.; Martino, D.; Cai, Z.; Gwary, D.; Janzen, H.; Kumar, P.; McCarl, B.; Ogle, S.; O’Mara, F.; Rice, C.; et al. Policy and technological constraints to implementation of greenhouse gas mitigation options in agriculture. Agric. Ecosyst. Environ. 2007, 118, 62–68. [Google Scholar] [CrossRef]
- Lehuger, S.; Gabrielle, B.; Laville, P.; Lamboni, M.; Loubet, B.; Cellier, P. Predicting and mitigating the net greenhouse gas emissions of crop rotations in Western Europe. Agric. For. Meteorol. 2011, 151, 1654–1671. [Google Scholar] [CrossRef]
- Smith, P.; Martino, D.; Cai, Z.; Gwary, D.; Janzen, H.; Kumar, P.; McCarl, B.; Ogle, S.; O’Mara, F.; Rice, C. Agriculture In ‘Climate Change 2007: Mitigation—Contribution of Working Group III to The Fourth Assessment Report of The Intergovernmental Panel on Climate Change’; Cambridge University Press: Cambridge, UK, 2007. [Google Scholar]
- Smith, P.; Martino, D.; Cai, Z.; Gwary, D.; Janzen, H.; Kumar, P.; McCarl, B.; Ogle, S.; Mara, F.; Rice, C.; et al. Greenhouse gas mitigation in agriculture. Philos. Trans. R. Soc. Lond. B Biol. Sci. 2008, 363, 789–813. [Google Scholar] [PubMed]
- Weersink, A.; Livernois, J.; Shogren, J.F.; Shortle, J.S. Economic instruments and environmental policy in agriculture. Can. Public Policy Anal. Politiques 1998, 24, 309–327. [Google Scholar] [CrossRef]
- Tacconi, L. Redefining payments for environmental services. Ecol. Econ. 2012, 73, 29–36. [Google Scholar] [CrossRef]
- Friel, S.; Dangour, A.; Garnett, T.; Lock, K.; Chalabi, Z.; Roberts, I.; Butler, A.; Butler, C.; Waage, J.; McMichael, A.; et al. Public health benefits of strategies to reduce greenhouse-gas emissions: Food and agriculture. Lancet 2009, 374, 2016–2025. [Google Scholar] [CrossRef]
- Codex Alimentarius Commission; Joint FAO/WHO Food Standards Programme; World Health Organization. Codex Alimentarius Commission: Procedural Manual; Food & Agriculture Organization: Rome, Italy, 2007. [Google Scholar]
- Codex Alimentarius: How It All Began. Available online: http://www.fao.org/docrep/v7700t/v7700t09.htm (accessed on 1 April 2018).
- Scott, J. The WTO Agreement on Sanitary and Phytosanitary Measures: A Commentary; OUP Catalogue: Geneva, Switzerland, 2009. [Google Scholar]
- WHO. Understanding the Codex Alimentarius; World Health Organization: Geneva, Switzerland, 2006. [Google Scholar]
- Suh, S.; Choi, E.; Jeong, H.; Lee, J. Study on evaluation of carbon emission and sequestration in pear orchard. Korean J. Environ. Biol. 2016, 34, 257–263. [Google Scholar] [CrossRef]
- Life Cycle Assessment in Agriculture. Available online: http://www1.agric.gov.ab.ca/$Department/deptdocs.nsf/all/sag15417/$FILE/LifeCycle-Assessment.pdf (accessed on 15 May 2016).
- Directions toward Sustainable Agriculture. Com 22: Final; Commission of the European Communities: Brussels, Belgium, 1999.
- UN-DSD. Improving Governments’ Role in The Promotion of Environmental Managerial Accounting; United Nations Publications: New York, NY, USA, 2000. [Google Scholar]
- Brentrup, F.; Küsters, J.; Kuhlmann, H.; Lammel, J. Environmental impact assessment of agricultural production systems using the life cycle assessment methodology: I. Theoretical concept of a LCA method tailored to crop production. Eur. J. Agron. 2004, 20, 247–264. [Google Scholar] [CrossRef]
- Ryu, J.; Kim, K. Application of LCA methodology on lettuce cropping systems in protected cultivation. Korean J. Soil Sci. Fertil. 2010, 43, 705–715. [Google Scholar]
- Stoessel, F.; Juraske, R.; Pfister, S.; Hellweg, S. Life cycle inventory and carbon and water footprint of fruits and vegetables: Application to a Swiss retailer. Environ. Sci. Technol. 2012, 46, 3253–3262. [Google Scholar] [CrossRef] [PubMed]
- Kalhor, T.; Rajabipour, A.; Akram, A.; Sharifi, M. Environmental impact assessment of chicken meat production using life cycle assessment. Inf. Process. Agric. 2016, 3, 262–271. [Google Scholar] [CrossRef]
- The World Food LCA Database Project: Towards More Accurate Food Datasets. Available online: http://lcafood2014.org/papers/19.pdf (accessed on 1 April 2018).
- ISO. ISO 14040:2006—Environmental Management—Life Cycle Assessment–Principles and Framework; International Organization for Standardization: Geneva, Switzerland, 2006. [Google Scholar]
- Boyd, C.; Cady, R. A 50-Year Comparison of the Carbon Footprint of the U.S. Swine Herd: 1959–2009; Camco: London, UK, 2012. [Google Scholar]
- Capper, J. The environmental impact of United States beef production: 1997 compared with 2007. J. Anim. Sci. 2011, 89, 4249–4261. [Google Scholar] [CrossRef] [PubMed]
- Capper, J.; Cady, R.; Bauman, D. The environmental impact of dairy production: 1944 compared with 2007. J. Anim. Sci. 2009, 87, 2160–2167. [Google Scholar] [CrossRef] [PubMed]
- Shim, K.; Jeong, J.; So, K.; Lim, S.; Roh, K.; Kim, G.; Jeong, H.; Lee, D. Environmental Impact Assessmentimpact assessment of Agricultural Systems Usingagricultural systems using the Life Cycle Assessmentlife cycle assessment. Korean J. Soil Sci. Fertil. 2010, 43, 237–241. [Google Scholar]
- Lim, S.; Lee, C.; Yang, S. Environmental impact and external cost analysis by LCA: Conventional vs. organic rice. Korean J. Org. Agric. 2010, 18, 1–19. [Google Scholar]
- FAO. Food Outlook; Food and Agriculture Organization of the United Nations: Rome, Italy, 2017. [Google Scholar]
- KOSIS. Trend of Arable Land Area; Korean Statistics: Daejeon, Korea, 2017. [Google Scholar]
- Choi, Y. A Study on The Recognition And Purchase of Environmental-Friendly Agricultural Products—Focus on The Housewives in Chungnam Area. Master’s Thesis, Gongju University, Chngnam, Korea, 2014. [Google Scholar]
- Borregaard, N.; Dufey, A. Challenging Preconceptions about Trade In Sustainable Products—Toward Win-Win-Win For Developing Countries; International Institute for Environment and Development: London, UK, 2005. [Google Scholar]
- Komatsuzaki, M.; Syuaib, M.F. Comparison of the farming system and carbon sequestration between conventional and organic rice production in West Java, Indonesia. Sustainability 2010, 2, 833. [Google Scholar] [CrossRef]
- Perception of Eco-Labels: Organic and Biodynamic Wines. Available online: https://www.researchgate.net/profile/Magali_Delmas2/publication/265928639_PERCEPTION_OF_ECO-LABELS_ORGANIC_AND_BIODYNAMIC_WINES/links/54c011e50cf28eae4a6704af/PERCEPTION-OF-ECO-LABELS-ORGANIC-AND-BIODYNAMIC-WINES.pdf (accessed on 1 April 2018).
- McCullough, M.; Qenani, E.; MacDougall, N. Biodynamic practices, eco-label wines and Millennial consumers. J. Agric. Sci. Technol. A 2012, 2, 1364. [Google Scholar]
- Participatory Guarantee Systems—PGS; Swedish Society for Nature Conservation. Available online: https://www.ifoam.bio/sites/default/files/page/files/pgsstudybyssnc_2008.pdf (accessed on 20 May 2017).
- MAFRA. Environmental—Friendly Agricultural Promotion Act; Ministry of Agriculture, Food and Rural Affairs: Seoul, Korea, 2017; Volume 14305. [Google Scholar]
- Uphoff, N.; Dazzo, F.B. Making Rice Production More Environmentally-Friendly. Environments 2016, 3, 12. [Google Scholar] [CrossRef]
- Young, R.A.; Akhtar, M. Environmentally Friendly Technologies for The Pulp and Paper Industry; John Wiley & Sons: Hoboken, NJ, USA, 1998. [Google Scholar]
- NAQS. Certification Application Infomation; National Agricultural Products Quality Management Service: Seoul, Korea, 2017. [Google Scholar]
- Sung, J.; Lee, H. Domestic and Foreign Production and Market Outlook of Environmentally-Friendly; Agricultural Products Korea Rural Economic Institiute: Seoul, Korea, 2017; Volume 39. [Google Scholar]
- MAFRA. Fertilizer Control Act. Ministry of Agriculture. Available online: http://www.law.go.kr/lsSc.do?tabMenuId=tab18&p1=&subMenu=1&nwYn=1§ion=&tabNo=&query=%EB%B9%84%EB%A3%8C%EA%B4%80%EB%A6%AC%EB%B2%95#undefined (accessed on 15 September 2017).
- MAFRA. Pesticide Control Act. Ministry of Agriculture. Available online: http://www.law.go.kr/lsSc.do?tabMenuId=tab18&p1=&subMenu=1&nwYn=1§ion=&tabNo=&query=%EB%B9%84%EB%A3%8C%EA%B4%80%EB%A6%AC%EB%B2%95#undefined (accessed on 15 September 2017).
- Costello, C.; Xue, X.; Howarth, R. Comparison of production-phase environmental impact metrics derived at the farm-and national-scale for United States agricultural commodities. Environ. Res. Lett. 2015, 10, 114004. [Google Scholar] [CrossRef]
- World Food LCA Database Methodological Guidelines for the Life Cycle Inventory of Agricultural Products. Available online: https://www.researchgate.net/publication/264942094_World_Food_LCA_Database_Methodological_Guidelines_for_the_Life_Cycle_Inventory_of_Agricultural_Products (accessed on 20 May 2017).
- Lin, H.; Fukushima, Y. Rice cultivation methods and their sustainability aspects: Organic and conventional rice production in industrialized tropical monsoon Asia with a dual cropping system. Sustainability 2016, 8, 529. [Google Scholar] [CrossRef]
- Corrado, S.; Ardente, F.; Sala, S.; Saouter, E. Modelling of food loss within life cycle assessment: From current practice towards a systematisation. J. Clean. Prod. 2017, 140, 847–859. [Google Scholar] [CrossRef]
- RDA. Agricultural Production Cost Survey; The Rural Development Administration: Jeonju, Korea, 2015. [Google Scholar]
- RDA. The Income of Agricultural and Livestock Products; The Rural Development Administration: Jeonju, Korea, 2015. [Google Scholar]
- KCPA. Agrochemicals Use Guide Book (Annually); Korea Crop Protection Association: Seoul, Korea, 2003. [Google Scholar]
- Kang, C.; Park, H. Analysis of production efficiency of environmentally-friendly rice. J. Rural Dev. 2005, 28, 19–30. [Google Scholar]
- Thanh Nguyen, T.; Hoang, V.N.; Seo, B. Cost and environmental efficiency of rice farms in South Korea. Agric. Econ. 2012, 43, 369–378. [Google Scholar] [CrossRef]
- Smith, K.W. Drone technology: Benefits, risks, and legal considerations. Seattle J. Environ. Law 2015, 5, 290–302. [Google Scholar]
- Ecoinvent. Ecoinvent DATA v2.2. Ecoinvent Reports No. 1-25; Swiss Centre for Life Cycle Inventories: Dubendorf, Germany, 2012. [Google Scholar]
- Pardo, G.; Zufía, J. Life cycle assessment of food-preservation technologies. J. Clean. Prod. 2012, 28, 198–207. [Google Scholar] [CrossRef]
- Roy, R.; Misra, R.; Lesschen, J.; Smaling, E. Assessment of Soil Nutrient Balance: Approaches and Methodologies; Food and Agriculture Organization: Rome, Italy, 2003. [Google Scholar]
- Ruviaro, C.F.; Gianezini, M.; Brandão, F.S.; Winck, C.A.; Dewes, H. Life cycle assessment in Brazilian agriculture facing worldwide trends. J. Clean. Prod. 2012, 28, 9–24. [Google Scholar] [CrossRef]
- Saarinen, M.; Kurppa, S.; Virtanen, Y.; Usva, K.; Makela, J.; Nissinen, A. Life cycle assessment approach to the impact of home-made, ready-to-eat and school lunches on climate and eutrophication. J. Clean. Prod. 2012, 28, 177–186. [Google Scholar] [CrossRef]
- FAO. Internatioanl Reference Life Cycle Data System (Ilcd) Handbook—General Guide For Life Cycle Assessment—Detailed Guidance; First Edition March 2010 ed.; EUR 247108 EN; European Commision; Joint Research Centre; Institute for Environment and Sustainability: Luxembourg, 2010. [Google Scholar]
- Huppes, G.; van Oers, L.; Pretato, U.; Pennington, D.W. Weighting environmental effects: Analytic survey with operational evaluation methods and a meta-method. Int. J. Life Cycle Assess. 2012, 17, 876–891. [Google Scholar] [CrossRef]
- Ryu, J.; Lee, J.; Kim, K.; Kim, G.; Choi, E. A case study to estimate the greenhouse-gas mitigation potential on conventional rice production system. Korean J. Soil Sci. Fertil. 2013, 46, 502–509. [Google Scholar] [CrossRef]
- Blengini, G.; Busto, M. The life cycle of rice: LCA of alternative agri-food chain management systems in Vercelli (Italy). J. Environ. Manag. 2009, 90, 1512–1522. [Google Scholar] [CrossRef] [PubMed]
- Hokazono, S.; Hayashi, K. Variability in environmental impacts during conversion from conventional to organic farming: A comparison among three rice production systems in Japan. J. Clean. Prod. 2012, 28, 101–112. [Google Scholar] [CrossRef]
- Kasmaprapruet, S.; Paengjuntuek, W.; Saikhwan, P.; Phungrassami, H. Life cycle assessment of milled rice production: Case study in Thailand. Eur. J. Sci. Res. 2009, 30, 195–203. [Google Scholar]
- Chung, Y.; Kim, S.; Moon, J.; Lee, K. Determination of the Korean normalization scores for the life cycle assessment. J. Korea Soc. Environ. Eng. 1997, 19, 269–279. [Google Scholar]
- Noh, J.; Lee, K.; Kim, S. Methodology for the Key Issue Identification in Life Cycle Assessment. J. Korean Soc. Environ. Eng. 1997, 19, 1233–1245. [Google Scholar]
- Thanawong, K.; Perret, S.; Basset-Mens, C. Eco-efficiency of paddy rice production in Northeastern Thailand: A comparison of rain-fed and irrigated cropping systems. J. Clean. Prod. 2014, 73, 204–217. [Google Scholar] [CrossRef]
- Brodt, S.; Kendall, A.; Mohammadi, Y.; Arslan, A.; Yuan, J.; Lee, I.-S.; Linquist, B. Life cycle greenhouse gas emissions in California rice production. Field Crops Res. 2014, 169, 89–98. [Google Scholar] [CrossRef]
- Ryu, J.; Jung, S.; Kim, G.; Lee, J.; Kim, K. LCA (Life Cycle Assessment) for evaluating carbon emission from conventional rice cultivation system: Comparison of top-down and bottom-up methodology. Korean J. Soil Sci. Fertil. 2012, 45, 1143–1152. [Google Scholar] [CrossRef]


| Country | Rice Production in 2015 (Million Tons) | Rice Utilization in 2015/16 (Million Tons) | Per Capita Consumption of Rice in 2015/16 (kg/year) |
|---|---|---|---|
| China | 142.6 (29.0%) | 145.4 (29.4%) | 77.2 |
| India | 104.4 (21.2%) | 97.5 (19.7%) | 48.2 |
| Indonesia | 45.8 (9.3%) | 46.8 (9.4%) | 135.0 |
| Bangladesh | 35.0 (7.1%) | 35.8 (7.2%) | 180.8 |
| Vietnam | 29.4 (6.0%) | 21.8 (4.4%) | 155.7 |
| Thailand | 18.9 (3.8%) | 14.6 (2.9%) | 102.3 |
| Myanmar | 16.5 (3.4%) | 15.2 (3.1%) | 193.6 |
| Philippines | 11.4 (2.3%) | 12.7 (2.6%) | 116.3 |
| Brazil | 8.5 (1.7%) | 7.8 (1.6%) | 33.9 |
| Japan | 7.6 (1.5%) | 8.5 (1.7%) | 50.3 |
| Pakistan | 6.8 (1.4%) | 2.7 (0.5%) | 11.7 |
| United States | 6.1 (1.2%) | 3.6 (0.7%) | 8.9 |
| South Korea | 4.1 (0.9%) | 4.5 (0.9%) | 76.0 |
| World | 491.7 (100.0%) | 495.3 (100.0%) | 54.0 (average) |
| Asia | 428.8 (87.2%) | 434.3 (87.7%) | 78.1 (average) |
| Standards for Agricultural Products | Low Pesticide | Non-Pesticide | Organic | |
|---|---|---|---|---|
| Chemical fertilizer | less than half of the recommended amount of applied fertilizer | less than one-third of the recommended amount of applied fertilizer | without the use | |
| Organo-synthetic pesticide | Dosage | less than half of the recommended amount of applied pesticide | without the use | without the use |
| Spray time | two multiples in the period of the safety use standard | without the use | without the use | |
| Input | Life Cycle Inventory | Unit | CRF | LRF | NRF | ORF | Sources |
|---|---|---|---|---|---|---|---|
| Fertilizer | Urea | kg | 1.25 × 10⁻³ | 6.26 × 10⁻⁴ | 4.13 × 10⁻⁴ | - | RDA |
| Ammonium sulfate | kg | 6.48 × 10⁻⁴ | 3.24 × 10⁻⁴ | 2.14 × 10⁻⁴ | - | RDA | |
| Fused phosphate | kg | 2.03 × 10⁻⁴ | 1.02 × 10⁻⁴ | 6.72 × 10⁻⁵ | - | RDA | |
| Fused superphosphate | kg | 9.94 × 10⁻⁶ | 4.97 × 10⁻⁶ | 3.28 × 10⁻⁶ | - | RDA | |
| Potassium chloride | kg | 1.83 × 10⁻⁴ | 9.13 × 10⁻⁵ | 6.02 × 10⁻⁵ | - | RDA | |
| Potassium sulfate | kg | 1.42 × 10⁻⁵ | 7.11 × 10⁻⁶ | 4.70 × 10⁻⁶ | - | RDA | |
| Calcium carbonate | kg | 1.82 × 10⁻³ | 9.08 × 10⁻⁴ | 5.99 × 10⁻⁴ | - | RDA | |
| Calcium silicate | kg | 2.76 × 10⁻³ | 1.38 × 10⁻³ | 9.12 × 10⁻⁴ | - | RDA | |
| Compound fertilizer | Nitrogen fertilizer | kg | 3.17 × 10⁻³ | 1.58 × 10⁻³ | 1.05 × 10⁻³ | - | RDA |
| Phosphorous fertilizer | kg | 2.64 × 10⁻³ | 1.32 × 10⁻³ | 8.72 × 10⁻⁴ | - | RDA | |
| Potassium fertilizer | kg | 2.60 × 10⁻³ | 1.30 × 10⁻³ | 8.58 × 10⁻⁴ | - | RDA | |
| Germicide | Thiocarbamate compound | kg | 6.64 × 10⁻⁶ | 3.32 × 10⁻⁶ | - | - | KCPA |
| Acetamide-anilide compound | kg | 2.32 × 10⁻⁷ | 1.16 × 10⁻⁷ | - | - | KCPA | |
| Benzimidazole compound | kg | 1.17 × 10⁻⁶ | 5.85 × 10⁻⁷ | - | - | KCPA | |
| Cyclic N compound | kg | 8.86 × 10⁻⁶ | 4.43 × 10⁻⁶ | - | - | KCPA | |
| Organophosphorus compound | kg | 1.46 × 10⁻⁴ | 7.29 × 10⁻⁵ | - | - | KCPA | |
| Pesticide unspecified | kg | 1.52 × 10⁻⁴ | 7.59 × 10⁻⁵ | - | - | KCPA | |
| Insecticide | Thiocarbamate compound | kg | 2.19 × 10⁻⁴ | 1.10 × 10⁻⁴ | - | - | KCPA |
| Organophosphorus compound | kg | 6.50 × 10⁻⁵ | 3.25 × 10⁻⁵ | - | - | KCPA | |
| Pesticide unspecified | kg | 1.31 × 10⁻⁴ | 6.53 × 10⁻⁵ | - | - | KCPA | |
| Pyretroid compound | kg | 1.21 × 10⁻⁶ | 6.07 × 10⁻⁷ | - | - | KCPA | |
| Herbicide | Sulfonyl urea compound | kg | 7.57 × 10⁻⁶ | 3.79 × 10⁻⁶ | - | - | KCPA |
| Thiocarbamate compound | kg | 6.75 × 10⁻⁵ | 3.38 × 10⁻⁵ | - | - | KCPA | |
| Benzothiadiazole compound | kg | 2.47 × 10⁻⁵ | 1.23 × 10⁻⁵ | - | - | KCPA | |
| Dinitroaniline compound | kg | 2.44 × 10⁻⁶ | 1.22 × 10⁻⁶ | - | - | KCPA | |
| Diphenylether compound | kg | 3.60 × 10⁻⁶ | 1.80 × 10⁻⁶ | - | - | KCPA | |
| Organophosphorus compound | kg | 5.16 × 10⁻⁷ | 2.58 × 10⁻⁷ | - | - | KCPA | |
| Pesticide unspecified | kg | 2.09 × 10⁻⁴ | 1.05 × 10⁻⁴ | - | - | KCPA | |
| Phenoxy compound | kg | 5.89 × 10⁻⁶ | 2.95 × 10⁻⁶ | - | - | KCPA | |
| Triazine compound | kg | 6.32 × 10⁻⁷ | 3.16 × 10⁻⁷ | - | - | KCPA | |
| Deposition | Sulfonyl urea compound | kg | 6.73 × 10⁻¹¹ | 3.37 × 10⁻¹¹ | - | - | NAQS |
| Thiocarbamate compound | kg | 9.39 × 10⁻⁸ | 4.69 × 10⁻⁸ | - | - | NAQS | |
| Bipyridylium compound | kg | 3.26 × 10⁻⁷ | 1.63 × 10⁻⁷ | - | - | NAQS | |
| Cyclic N compound | kg | 8.07 × 10⁻⁷ | 4.03 × 10⁻⁷ | - | - | NAQS | |
| Pesticide unspecified | kg | 3.32 × 10⁻⁴ | 1.66 × 10⁻⁴ | - | - | NAQS | |
| Energy | Electricity | kW | 4.11 × 10⁻³ | 3.61 × 10⁻³ | 2.30 × 10⁻³ | 2.05 × 10⁻³ | RDA |
| Diesel | m3 | 5.18 × 10⁻³ | 4.55 × 10⁻³ | 2.90 × 10⁻³ | 2.59 × 10⁻³ | RDA | |
| Kerosene | m3 | 7.61 × 10⁻⁴ | 7.61 × 10⁻⁴ | 7.61 × 10⁻⁴ | 7.61 × 10⁻⁴ | RDA | |
| Gasoline | m3 | 2.03 × 10⁻³ | 1.79 × 10⁻³ | 1.14 × 10⁻³ | 1.02 × 10⁻³ | RDA |
| Impact Category | Characterized Value | Normalized Value | |||||||
|---|---|---|---|---|---|---|---|---|---|
| CRF | LRF | NRF | ORF | CRF | LRF | NRF | ORF | ||
| CCP | kg CO2-equiv. | 1.01 (100.00) | 0.701 (69.41) | 0.537 (53.17) | 0.234 (23.17) | 2.20 × 10⁻¹³ | 1.52 × 10⁻¹³ | 1.17 × 10⁻¹³ | 5.09 × 10⁻¹⁴ |
| HTP-CE | CTUh | 8.02 × 10⁻¹⁰ (100.00) | 4.13 × 10⁻¹⁰ (51.50) | 3.63 × 10⁻¹⁰ (45.26) | 4.04 × 10⁻¹¹ (5.04) | 4.36 × 10⁻¹⁴ | 2.24 × 10⁻¹⁴ | 1.97 × 10⁻¹⁴ | 2.20 × 10⁻¹⁵ |
| HTP-NCE | CTUh | 1.19 × 10⁻⁷ (100.00) | 1.03 × 10⁻⁷ (86.55) | 9.04 × 10⁻⁸ (75.97) | 7.27 × 10⁻⁸ (61.09) | 4.47 × 10⁻¹³ | 3.87 × 10⁻¹³ | 3.40 × 10⁻¹³ | 2.73 × 10⁻¹³ |
| PMP | kg PM2.5-equiv. | 7.28 × 10⁻⁵ (100.00) | 5.94 × 10⁻⁵ (81.59) | 5.54 × 10⁻⁵ (76.10) | 4.10 × 10⁻⁵ (56.32) | 3.83 × 10⁻¹⁴ | 3.13 × 10⁻¹⁴ | 2.92 × 10⁻¹⁴ | 2.16 × 10⁻¹⁴ |
| POFP | kg NMVOC-equiv. | 6.38 × 10⁻⁴ (100.00) | 5.66 × 10⁻⁴ (88.71) | 5.21 × 10⁻⁴ (81.66) | 4.44 × 10⁻⁴ (69.59) | 4.04 × 10⁻¹⁴ | 3.58 × 10⁻¹⁴ | 3.30 × 10⁻¹⁴ | 2.81 × 10⁻¹⁴ |
| AP | mole of H+-equiv. | 6.33 × 10⁻⁴ (100.00) | 4.91 × 10⁻⁴ (77.57) | 4.35 × 10⁻⁴ (68.72) | 3.13 × 10⁻⁴ (49.45) | 2.68 × 10⁻¹⁴ | 2.08 × 10⁻¹⁴ | 1.84 × 10⁻¹⁴ | 1.33 × 10⁻¹⁴ |
| EP-T | mole of N-equiv. | 3.02 × 10⁻³ (100.00) | 2.48 × 10⁻³ (82.12) | 2.33 × 10⁻³ (77.15) | 1.73 × 10⁻³ (57.28) | 3.45 × 10⁻¹⁴ | 2.83 × 10⁻¹⁴ | 2.66 × 10⁻¹⁴ | 1.97 × 10⁻¹⁴ |
| EP-A | Mole of P-equiv. | 6.03 × 10⁻⁶ (100.00) | 3.02 × 10⁻⁶ (50.08) | 3.13 × 10⁻⁸ (0.52) | 6.47 × 10⁻⁹ (0.11) | 8.14 × 10⁻¹⁵ | 4.08 × 10⁻¹⁵ | 4.22 × 10⁻¹⁷ | 8.73 × 10⁻¹⁸ |
| FATP | CTUe | 0.111 (100.00) | 7.70 × 10⁻² (69.37) | 5.18 × 10⁻² (46.67) | 3.63 × 10⁻² (32.70) | 2.55 × 10⁻¹⁴ | 1.77 × 10⁻¹⁴ | 1.19 × 10⁻¹⁴ | 8.33 × 10⁻¹⁵ |
| Weighted value | 8.11 × 10⁻¹² (100.00) | 5.98× 10⁻¹² (73.73) | 4.83× 10⁻¹² (59.57) | 2.78× 10⁻¹² (34.31) | |||||
| Comparison | Greenhouse Gas Emissions (kg CO2–Equiv. per kg Rice) | |||
|---|---|---|---|---|
| Total | Direct | Indirect | ||
| Thanawong et al. | 4.51–5.12 (100.0%) | 2.79–3.17 (61.9%) | 1.72–1.95 (38.1%) | |
| Brodt et al. | 1.59 (100.0%) | 1.02 (64.1%) | 0.57 (35.9%) | |
| Blengini and Busto | 2.90 (100.0%) | 1.97 (68.0%) | 0.93 (32.0%) | |
| Current study | CRF | 2.65–2.98 | 1.64–1.97 (61.9–68.0%) | 1.01 |
| LRF | 2.34–2.67 | 0.70 | ||
| NRF | 2.18–2.51 | 0.54 | ||
| ORF | 1.87–2.20 | 0.23 | ||
| Impact Category | Unit | Characterized Value | Normalized Value | ||
|---|---|---|---|---|---|
| Ecoinvent (EU) | U.S. LCI (U.S.) | Ecoinvent (EU) | U.S. LCI (U.S.) | ||
| CCP | kg CO2-equiv. | 1.14 | 1.62 | 2.48 × 10⁻¹³ | 3.52 × 10⁻¹³ |
| HTP-CE | CTUh | 1.04 × 10⁻⁹ | 6.28 × 10⁻¹⁰ | 5.65 × 10⁻¹⁴ | 3.41 × 10⁻¹⁴ |
| HTP-NCE | CTUh | 1.12 × 10⁻⁷ | 2.48 × 10⁻⁷ | 4.21 × 10⁻¹³ | 9.32 × 10⁻¹³ |
| PMP | kg PM2.5-equiv. | 9.92 × 10⁻⁵ | 1.76 × 10⁻⁴ | 5.22 × 10⁻¹⁴ | 9.26 × 10⁻¹⁴ |
| POFP | kg NMVOC-equiv. | 9.89 × 10⁻⁴ | 4.32 × 10⁻³ | 6.26 × 10⁻¹⁴ | 2.73 × 10⁻¹³ |
| AP | mole of H+-equiv. | 8.50 × 10⁻⁴ | 5.83 × 10⁻³ | 3.60 × 10⁻¹⁴ | 2.47 × 10⁻¹³ |
| EP-T | mole of N-equiv. | 4.14 × 10⁻³ | 1.21 × 10⁻² | 4.73 × 10⁻¹⁴ | 1.38 × 10⁻¹³ |
| EP-A | Mole of P-equiv. | 1.47 × 10⁻⁶ | 3.05 × 10⁻⁵ | 1.98 × 10⁻¹⁵ | 4.12 × 10⁻¹⁴ |
| FATP | CTUe | 0.100 | 0.408 | 2.29 × 10⁻¹⁴ | 9.36 × 10⁻¹⁴ |
| Weighted value | 8.97 × 10⁻¹² | 1.67 × 10⁻¹¹ | |||
© 2018 by the authors. Licensee MDPI, Basel, Switzerland. This article is an open access article distributed under the terms and conditions of the Creative Commons Attribution (CC BY) license (http://creativecommons.org/licenses/by/4.0/).
Share and Cite
Kim, S.; Kim, T.; Smith, T.M.; Suh, K. Environmental Implications of Eco-Labeling for Rice Farming Systems. Sustainability 2018, 10, 1050. https://doi.org/10.3390/su10041050
Kim S, Kim T, Smith TM, Suh K. Environmental Implications of Eco-Labeling for Rice Farming Systems. Sustainability. 2018; 10(4):1050. https://doi.org/10.3390/su10041050
Chicago/Turabian StyleKim, Solhee, Taegon Kim, Timothy M. Smith, and Kyo Suh. 2018. "Environmental Implications of Eco-Labeling for Rice Farming Systems" Sustainability 10, no. 4: 1050. https://doi.org/10.3390/su10041050
APA StyleKim, S., Kim, T., Smith, T. M., & Suh, K. (2018). Environmental Implications of Eco-Labeling for Rice Farming Systems. Sustainability, 10(4), 1050. https://doi.org/10.3390/su10041050