The Impact of Photovoltaic Applications on Urban Landscapes Based on Visual Q Methodology


1
School of Architecture, Harbin Institute of Technology, Harbin 150006, China
2
Heilongjiang Cold Region Urban-Rural Human Settlements Science Key Laboratory, No. 66 Xidazhi St., Harbin 150006, China
*
Author to whom correspondence should be addressed.
Sustainability 2018, 10(4), 1051; https://doi.org/10.3390/su10041051
Submission received: 16 January 2018
/
Revised: 30 March 2018
/
Accepted: 30 March 2018
/
Published: 2 April 2018
(This article belongs to the Section Sustainable Urban and Rural Development)
Abstract
:In recent years, the installation of photovoltaic systems in China has increased steadily to gradually become large-scale, having a significant impact on the urban landscape. Research on this impact mostly focuses on visual impact and glare risk. However, differences in urban land use types may lead to differences in the impact of photovoltaic applications on the landscape. This study adapts visual Q methodology to assess the impact of photovoltaic applications on the landscape in urban areas. Landscape photographs of photovoltaic applications in different cities of China are collected and used during the concourse and Q sorting. The final Q sample is composed of 36 photographs of different photovoltaic materials at different levels of integration in six urban land use types. The P set is composed of 36 respondents, including experts and non-experts. In conclusion, environmental harmony, power generation, innovative design, installation height, and social benefits of photovoltaic systems are the main impacts of photovoltaic systems on urban landscapes. Photovoltaic systems in different urban land use types have different impacts on the landscape. The conclusions have policy implications for different urban land use types, which has significance for the construction of urban photovoltaic systems in the future.
1. Introduction
The installation of photovoltaic systems provides significant economic and environmental benefits, such as CO2 and greenhouse gas reductions, in comparison to conventional energy production. However, these positive effects of photovoltaic systems are partially offset by negative impacts that cause restrictions to social acceptance [1]. The published research provides a good understanding of environmental (human health, farmland, wellbeing, wildlife and habitat, geohydrological resources and climate change) [2,3], territorial and landscape (land use, visual impact, and glare risk included) impacts from photovoltaic systems [4,5,6]. The environmental impacts are beneficial or neutral when compared to traditional means of power generation, and territorial and landscape impacts are always studied together. Photovoltaic systems require suitable land, which otherwise may lead to land use changes and landscape fragmentation.
The implementation of various energy policies promotes the development of photovoltaic applications at the global level [7]. Incentive policies and ideal geographical location ensure an optimal use of solar energy in Europe [8,9]. The photovoltaic industry has been growing rapidly in northern European countries and the UK by incentives. Regarding Italian regions, particular geographical positioning of photovoltaic plants can cause significant differences in profitability and environmental impacts. Environmental damages such as agricultural land consumption and soil sealing are caused by the booming sprawl of solar modules in rural areas [10,11]. Instead of large ground-mounted photovoltaic arrays in rural or peri-urban areas, landscape integrated photovoltaic systems might be required in important sites in urban areas. The impact of photovoltaic systems on the urban landscape is an important area of research in IEA-SHC (Solar Heating and Cooling Programme, International Energy Agency) Task 51 [12]. The sustainable solar city design combines urban planning integrated with solar energy [13], using the core theory of “energy landscape” [14]. Based on the energy landscape theory, concerns over the design and assessment of “photovoltaic landscapes” [15] are increasing. The concept of a photovoltaic landscape means that photovoltaic systems should be designed as an element of the landscape to which they belong to reduce the visual impact of photovoltaic systems. Not only landscape components, solar panels on building facades, transportation facilities, and other public utilities in urban areas cause visual impacts as well. Clearly, landscape and visual impacts have become factors that affect photovoltaic applications in urban areas and policy-making.
Several methodologies have been developed for the landscape impact assessment of photovoltaic applications. Torres et al. [16] highlighted the aesthetic impact of solar power plants (for example, visibility and color) and used objective and subjective approaches in which photographs and interviews were combined. Chiabrando et al. emphasized the territorial and landscape impacts (mainly, a visual impact evaluation was presented) of photovoltaic systems by geographical information systems (GIS) and daylighting software tools, which assessed the risk of glare by the reflection of direct sunlight from the surface of photovoltaic cells. Mondino et al. [17,18] summarized four different types of documents regarding the evaluation of the site and used GIS to select a suitable site for photovoltaic plants, but actual landscape assessment was not studied. However, the authors noted that landscape assessment of a new photovoltaic plant should be made with GIS spatial analyses and with other software tools and techniques (for example, picture analysis). Additionally, Mauro and Lughi [19] investigated the impact of photovoltaics on land use through the Open Street Map (OSM) platform and GIS-based techniques. Afterwards, Rodrigues et al. [20] proposed a method addressing the impact from both a spatial and perceptive approach to assess the visual impact caused by wind farms and solar photovoltaic or solar thermal plants. Additionally, Naspetti et al. [21] used a quantitative and qualitative approach (visual Q sorting) to determine the impact of photovoltaic applications on urban and rural landscapes. Visual Q sorting is particularly suited for studying the subjective perception of landscape assessment since it considers the characteristics and preferences of the individual. Landscape impact is particularly critical for assessment, and subjective landscape perception should be considered to create a relationship between human perception and the environment. These methodologies are useful when assessing the landscape impact of photovoltaic applications. Satellite methodologies are more effective for the performance evaluation of medium and large photovoltaic plants, while visual Q sorting is more suitable for small photovoltaic applications in cities. Further research should focus on the assessment of the observer’s experience with satellite methodologies.
In China, photovoltaic applications in urban areas are mainly divided into distributed and central photovoltaic applications [22]. Central photovoltaic applications refer to large-scale photovoltaic power stations designed for long-distance power transmission, which are located far from urban areas in places such as deserts. Distributed photovoltaic applications operate in or near the users for their own use, and extra power is transferred to the national grid [23]. Distributed photovoltaic applications are appropriate to build in an urban context because site selection is flexible and the ability to make full use of building surfaces to conserve land. In 2017, the installed capacity of China’s distributed photovoltaic power generation increased by 19.44 GW. By the end of 2017, the total distributed photovoltaic power generation of China was 29.66 GW. Decreasing installation costs and government subsidies are the main factors causing the sharp increase in photovoltaic installations.
In 2014, policies for distributed photovoltaic applications were made by the National Energy Administration (NEA), which applied distributed photovoltaic power generation to urban master planning. The areas of roofs, electricity load and other indexes were considered in distributed photovoltaic application planning. Demonstration areas of distributed photovoltaic applications were established by the National Energy Administration (NEA) and National Development and Reform Commission to improve photovoltaic technology and decrease costs and electricity prices. Financial subsidies to investment enterprises, energy service companies and individual investors are the government’s main means of inspiring the development of distributed photovoltaic applications. From 2013 to 2017, the national subsidy for distributed photovoltaic applications was 0.42 yuan per kilowatt, which decreased to 0.37 yuan per kilowatt since 2018. The local government was encouraged to provide matching financial subsidies based on national subsidies. Moreover, commercial enterprises and industrial areas with higher electricity prices and public utilities, such as roads, parks and parking lots are encouraged to prioritize the construction of photovoltaic systems. Buildings integrated with photovoltaic (BIPV), especially public buildings, such as schools, hospitals, stations, airport terminals, stadiums, and official buildings, are also encouraged by the Chinese government.
China has introduced a variety of energy policies in recent decades. The policies ignore the landscape assessment of photovoltaic systems and the visual impact for the public. The majority of the installation of photovoltaic systems is the government’s responsibility in China, and the public has to bear the impact of photovoltaic applications on the landscape, especially in urban areas where the single and mechanical appearance of photovoltaic systems has a negative impact on the landscape and human perception.
Recently, given the increased concerns towards effects of photovoltaic system on landscapes, the application of photographs, interviews with the public, subjective feelings, and behaviors were considered with a landscape assessment, which creates a connection between individuals and photovoltaic policy-making. However, current studies lack consideration of the urban context, particularly urban land use types. In this article, urban land use types are discussed, and the different impacts of photovoltaic applications on the landscape are investigated in different land use types.
Here, we seek to understand and explore the landscape assessment of photovoltaic systems in different urban land use types in China and to clarify preferences by sorting people with similar opinions into groups. In Q methodology [24], particularly visual Q sorting, individual express personal subjective points of view on a series of semantic photographs of a photovoltaic system. A statistical analysis method is used to determine the impact of photovoltaic systems on urban landscapes. We first select 36 photographs representing typical photovoltaic systems in different urban land use types as the Q sample. In total, 36 participants (including experts and non-experts) serve as the P set. Five factors are then extracted by factor analysis. After interpretation and explanation of the five factors, the impacts of photovoltaic applications on the urban landscape are analyzed. Based on the results, we determine the differential impacts in different urban land use types. We also make suggestions for future policy and planning.
2. Methodology
Q methodology, which evolved from factor analysis, was first introduced by British physicist-psychologist William Stephenson in the mid-1930s [25,26]. Q methodology collects subjective perceptions of a discourse on a specific topic and sorts them during statistical analysis [27], which combines quantitative and qualitative research [28]. This methodology collects the viewpoint of certain groups of people on an issue and sorts respondents into groups with similar attitudes. Generally, there is no hypothesis about the issue. Q methodology is applicable to exploratory research; new thoughts from individuals are discovered during the research. Therefore, the advantage of this method is combining the objective issues and preferences of the individuals. Q methodology emphasizes the importance of the individuality of the respondents, which is a research method with a small sample. Therefore, the respondents of the Q methodology should represent the range of opinions on the issue.
Q methodology is constantly performed with statements (words) from the respondents, but previous research has shown that using photographs as statements is more suitable for discourse [29]. Images, intuitive feelings, emotions, and types of reasons from the respondents can be recorded more easily. The combination of Q methodology and visual images makes the interview more reliable and valid and is called visual Q methodology (visual Q sorting) [30,31].
In the present study, Q methodology and visual Q methodology were applied to evaluate land use [32] and assess a specific landscape in the field of tourism and landscape architecture [33,34]. Landscape assessment and evaluation depends on the features of the physical environment and the preferences of the individuals; Q methodology was suitable to be employed as a means to connect a landscape and personal thinking. Visual Q methodology was also applied to identify an individual acceptance of photovoltaic systems and determine the impact on the urban and rural landscape. Using visual Q methodology to evaluate the value of a landscape could provide guidance for landscape planning, governance of policy and management.
Visual Q methodology was selected in this study. The process of visual Q methodology consists of five steps that are illustrated by McKeown and Thomas [35] based on Brown’s research: definition of the concourse, development of the Q sample, selection of the P set, Q sorting, factor analysis and interpretation. In the concourse, samples of the issue should be collected. We selected a variety of photographs of landscapes concerned with photovoltaic systems in urban contexts. A total of 468 photographs were collected by the authors during the investigation representing photovoltaic systems in an urban landscape. Based on inductive studies, the photographs included different geographical areas and different urban land use types, different types of photovoltaic applications (photovoltaic systems on grounds, buildings, lights, pavilions, sculptures), and different photovoltaic cells (crystalline silicon cells, amorphous silicon cells, and organic cells) were included.
2.1. The Q Sample
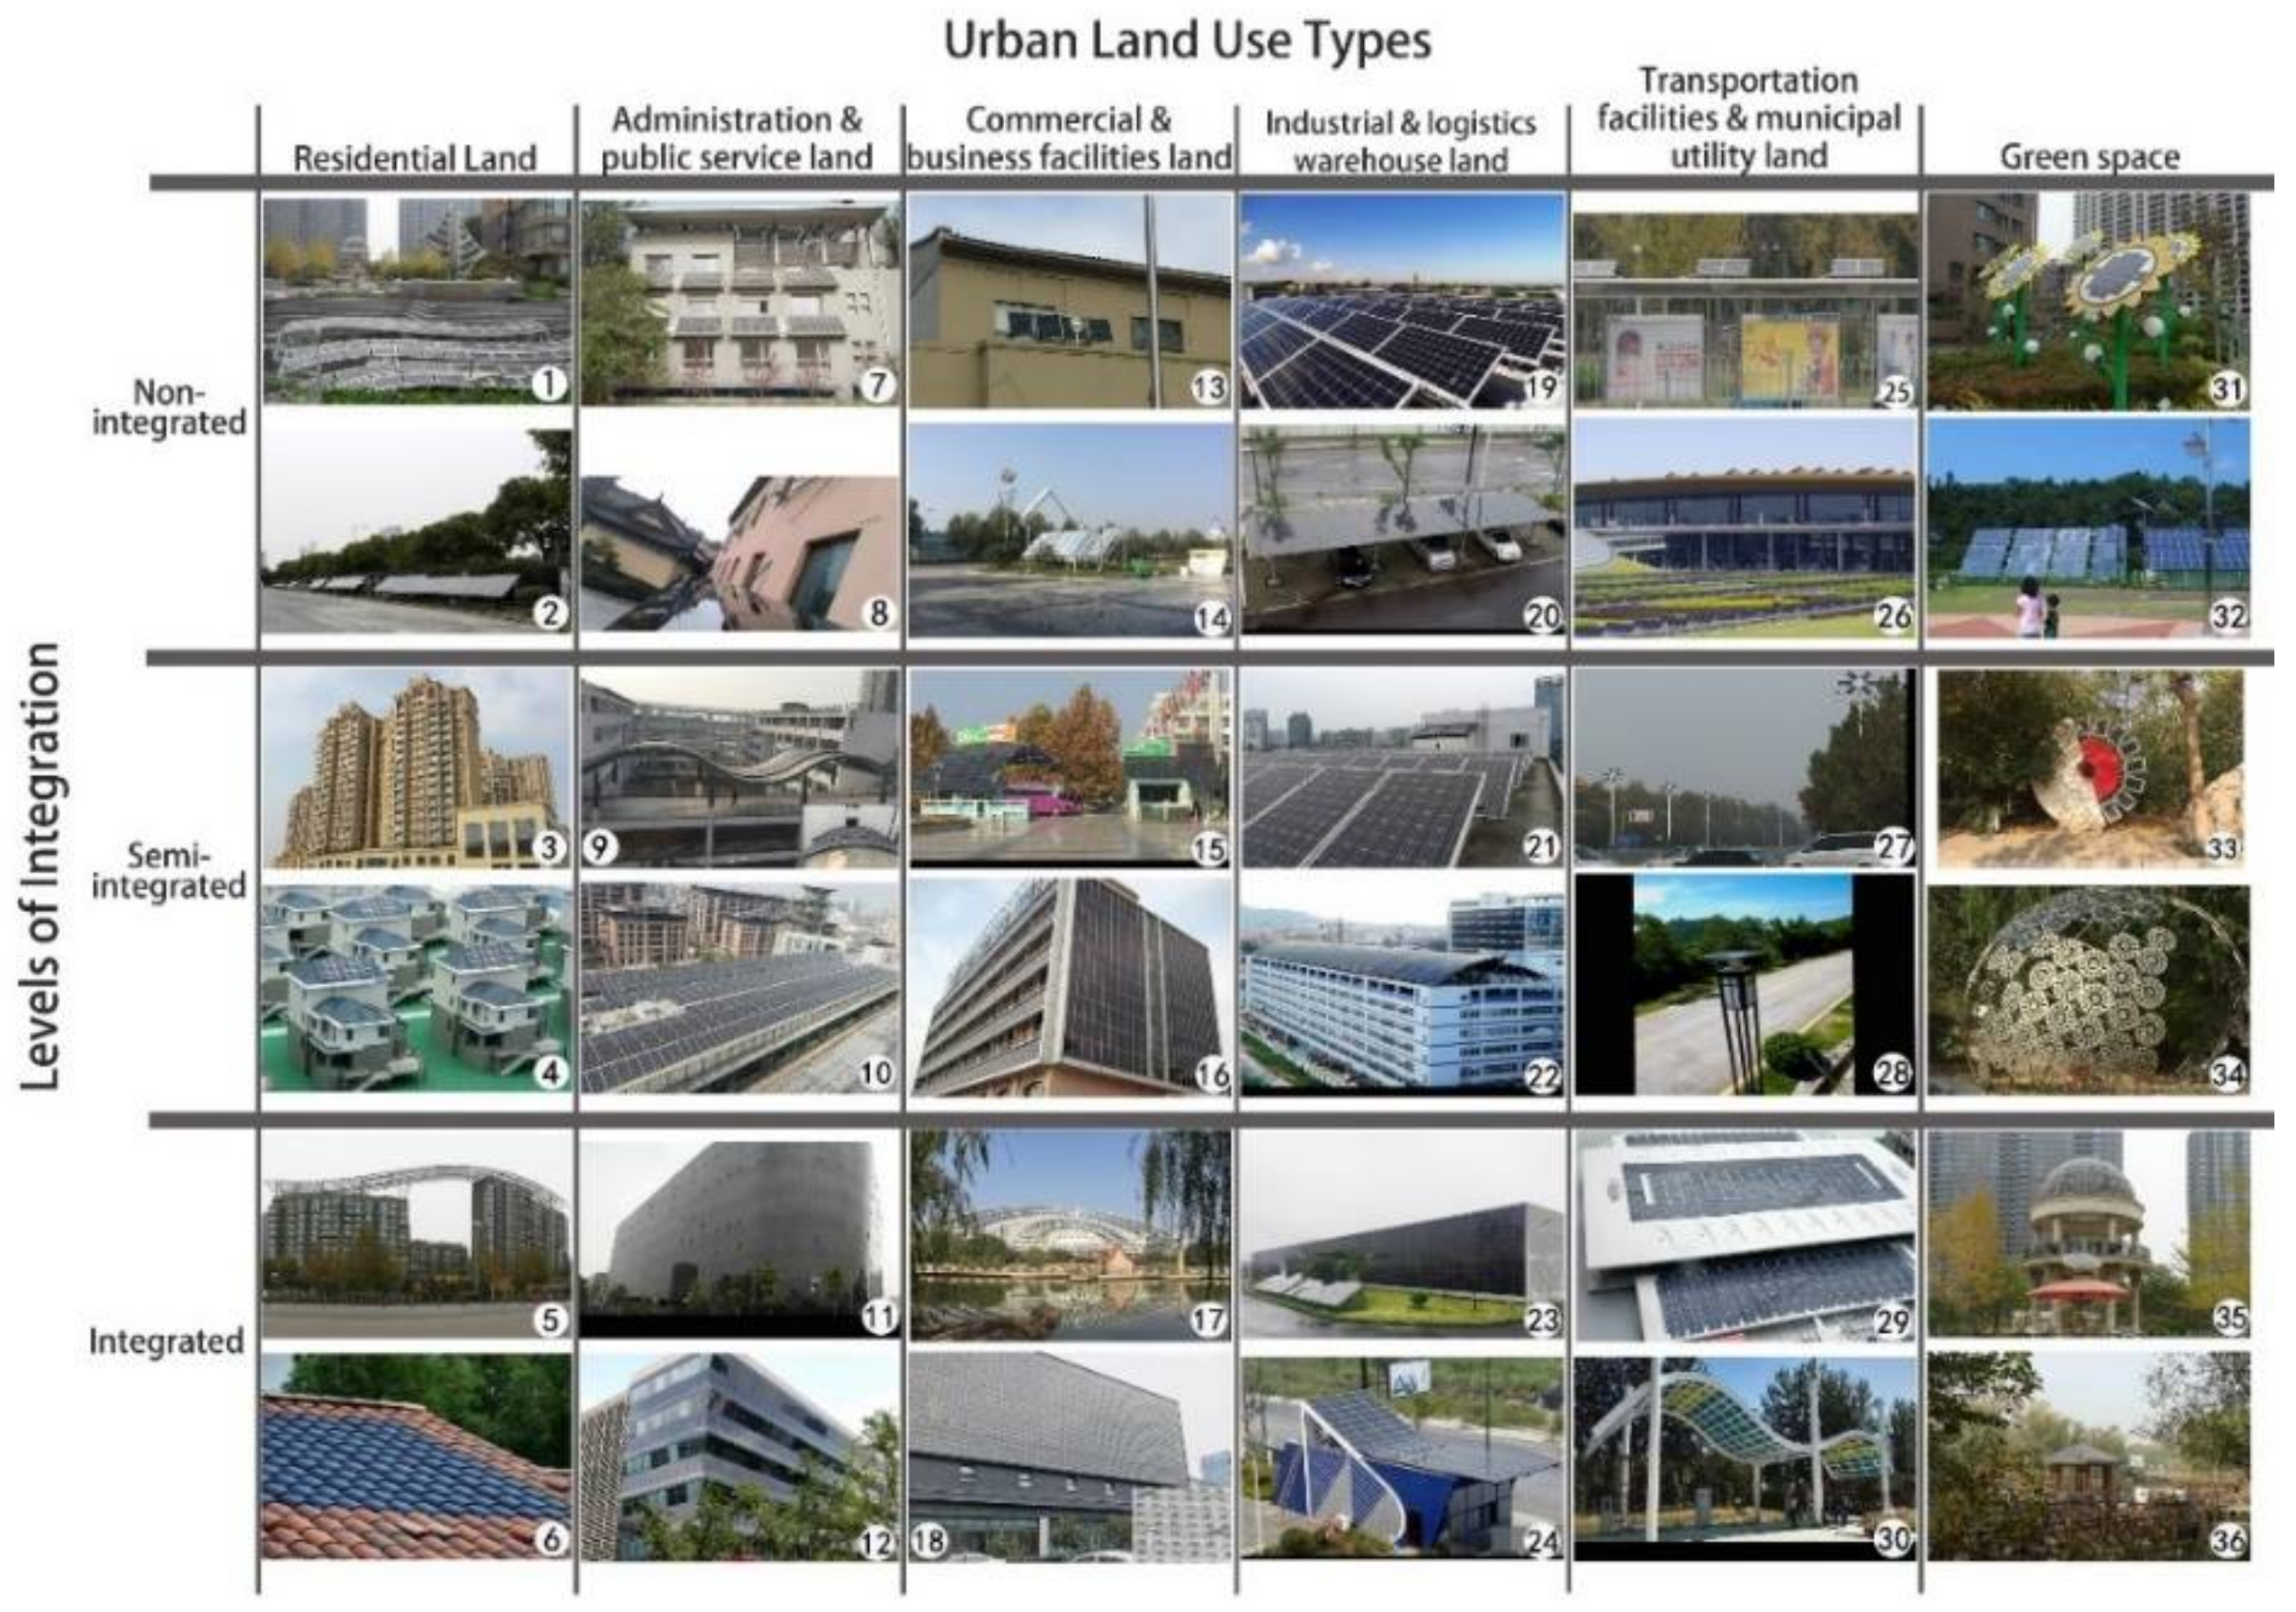
The Q sample included images to sort from the concourse. The number of images should be 30–60 in general [36]. The Q sample needs to be diverse rather than random or representative [37]. According to Q methodology, the photographs should be diverse and specific. In the process of photograph selection, opinions and suggestions from local experts were considered. Moreover, the number of photographs was reduced by removing those with low pixels and without typical features. After classification, we found that the remaining photographs reflected the following aspects: the main urban land use types were residential land, administration and public service land, commercial and business facilities land, industrial and logistics warehouse land, transportation facilities and municipal utility land, and green space [38]. Each urban land use type had three levels of integration: photovoltaic systems that were non-integrated, semi-integrated or integrated. Two photographs were selected for each category to make them representative. Therefore, as shown in Figure 1, the final Q sample was composed of 6 × 3 × 2 = 36 photographs.
2.2. The P Set
Q methodology ensures that participants express their individual opinions and subjective feelings about an issue. In this study, the participants were asked to express their opinions about photovoltaic systems in an urban context and should be aware of photovoltaic applications. To make the opinions from the participants more reasonable, the participants in this study were classified into two groups, experts and non-experts. Experts tended to be more professional regarding the national policy and technology of the photovoltaic systems; non-experts were mainly concerned about the influences of photovoltaic systems. The P-set was composed of 36 participants, 19 experts and 17 non-experts. The group of experts included 4 landscape and urban planning designers, 6 photovoltaic engineers and 9 urban planning students. The group of non-experts included 7 general students, 2 staff members, 3 politicians, 2 laborers, 2 retired persons and 1 housewife. As seen in Table 1, all participants were coded.
2.3. The Q Sorting
Before the interview, the purpose of this research and instructions on completing the questionnaire were explained to the participants. First, the participants were asked to sort the photographs into three groups according to their subjective feelings: “most liked”, “most disliked”, and “neutral or indifferent”. The participants were then asked to sort the 36 photographs in a forced normal distribution that was defined as 11 groups: from “most disliked” (−5) to “most liked” (+5). The groups were scored as −5, −4, −3, −2, −1, 0, +1, +2, +3, +4, and +5, which was almost a normal distribution. After the sorting, the participants were asked to explain their choices, especially regarding photographs that scored in the four extremes (−5, −4, +4, and +5). The interviews were conducted from March to May 2017 and were held in Dezhou (known as the Solar City of China), Shandong Province; Hangzhou, Zhejiang Province; and the Harbin Institute of Technology in Heilongjiang Province. The average time of the interview was 25 min. Finally, we obtained 36 Q sorts. We coded these Q sorts and entered them into the PQ Method software 2.35 [39] for quantitative analysis.
2.4. Analysis and Interpretation
We applied a factor analysis using PQ Method software to investigate patterns in the Q sorts. To determine the extent to which a participant agreed or disagreed with a factor, we used factor loadings. Factor arrays illustrating these photographs accounted for each factor. Five factors were extracted using principal component analysis; afterwards, a varimax rotation of these factors were performed. Five factors sorted participants with similar opinions regarding the impact of photovoltaic systems on landscapes together (see Table 2). The factor loadings of the five factors were statistically significant with a p-value < 0.01 and accounted for 62% of the variance.
The interpretation of the five factors was based on the factor arrays (see Table A1 in Appendix A). The content was recorded during interview, especially the reasons why respondents most liked or most disliked a photograph, to make the results scientific and professional.
3. Results
3.1. Factor 1 (F1) Photovoltaic Applications in Harmony with the Environment
F1 was defined by 11 participants, which included one landscape designer, two urban planning designers, one urban planning student, three general students, one photovoltaic engineer, one politician, and two retired persons. This factor had an eigenvalue of 11.21 and explained 31% of the study variance.
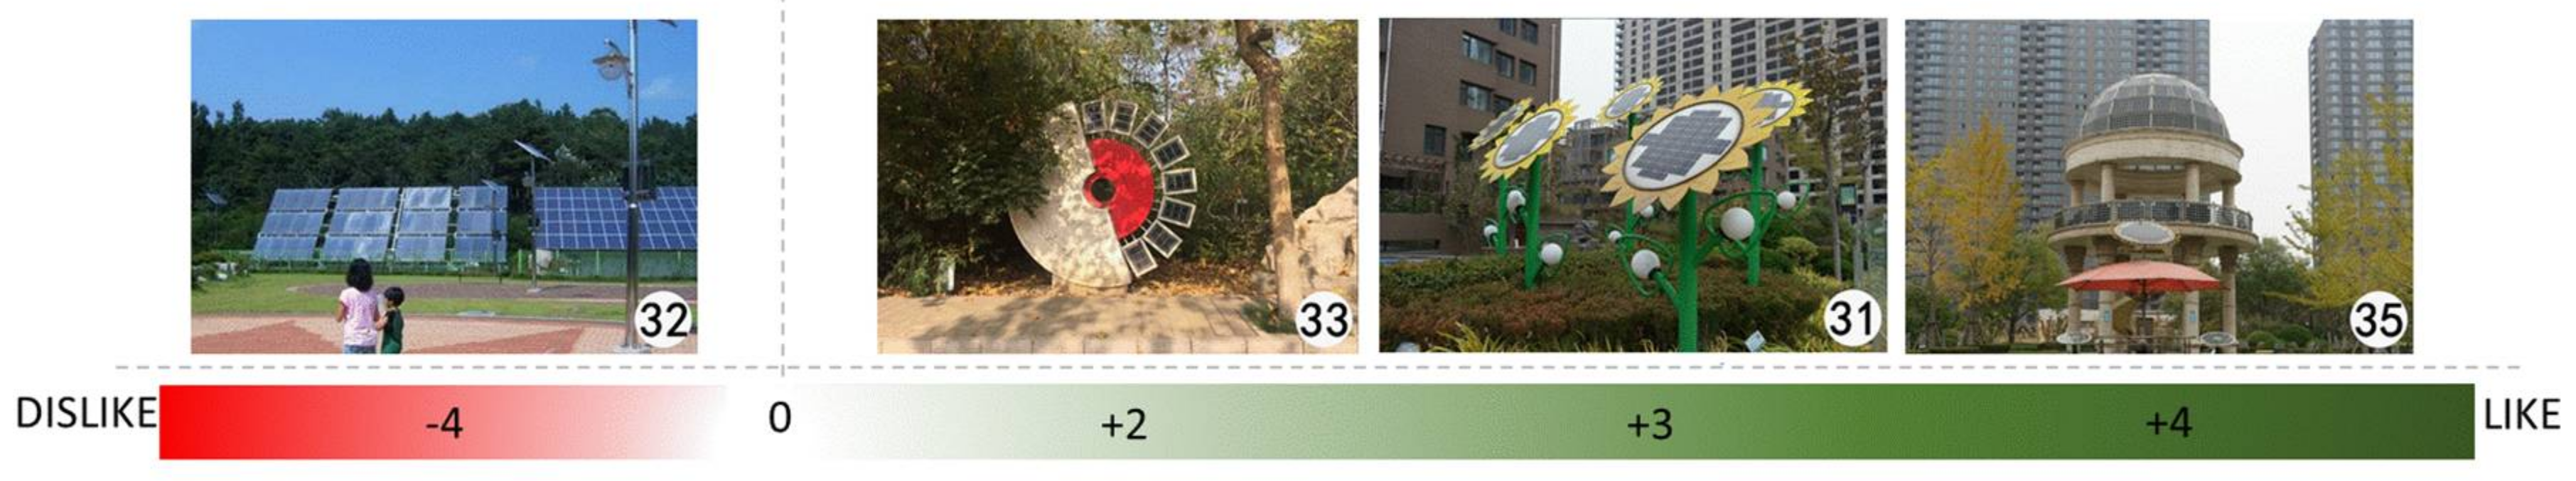
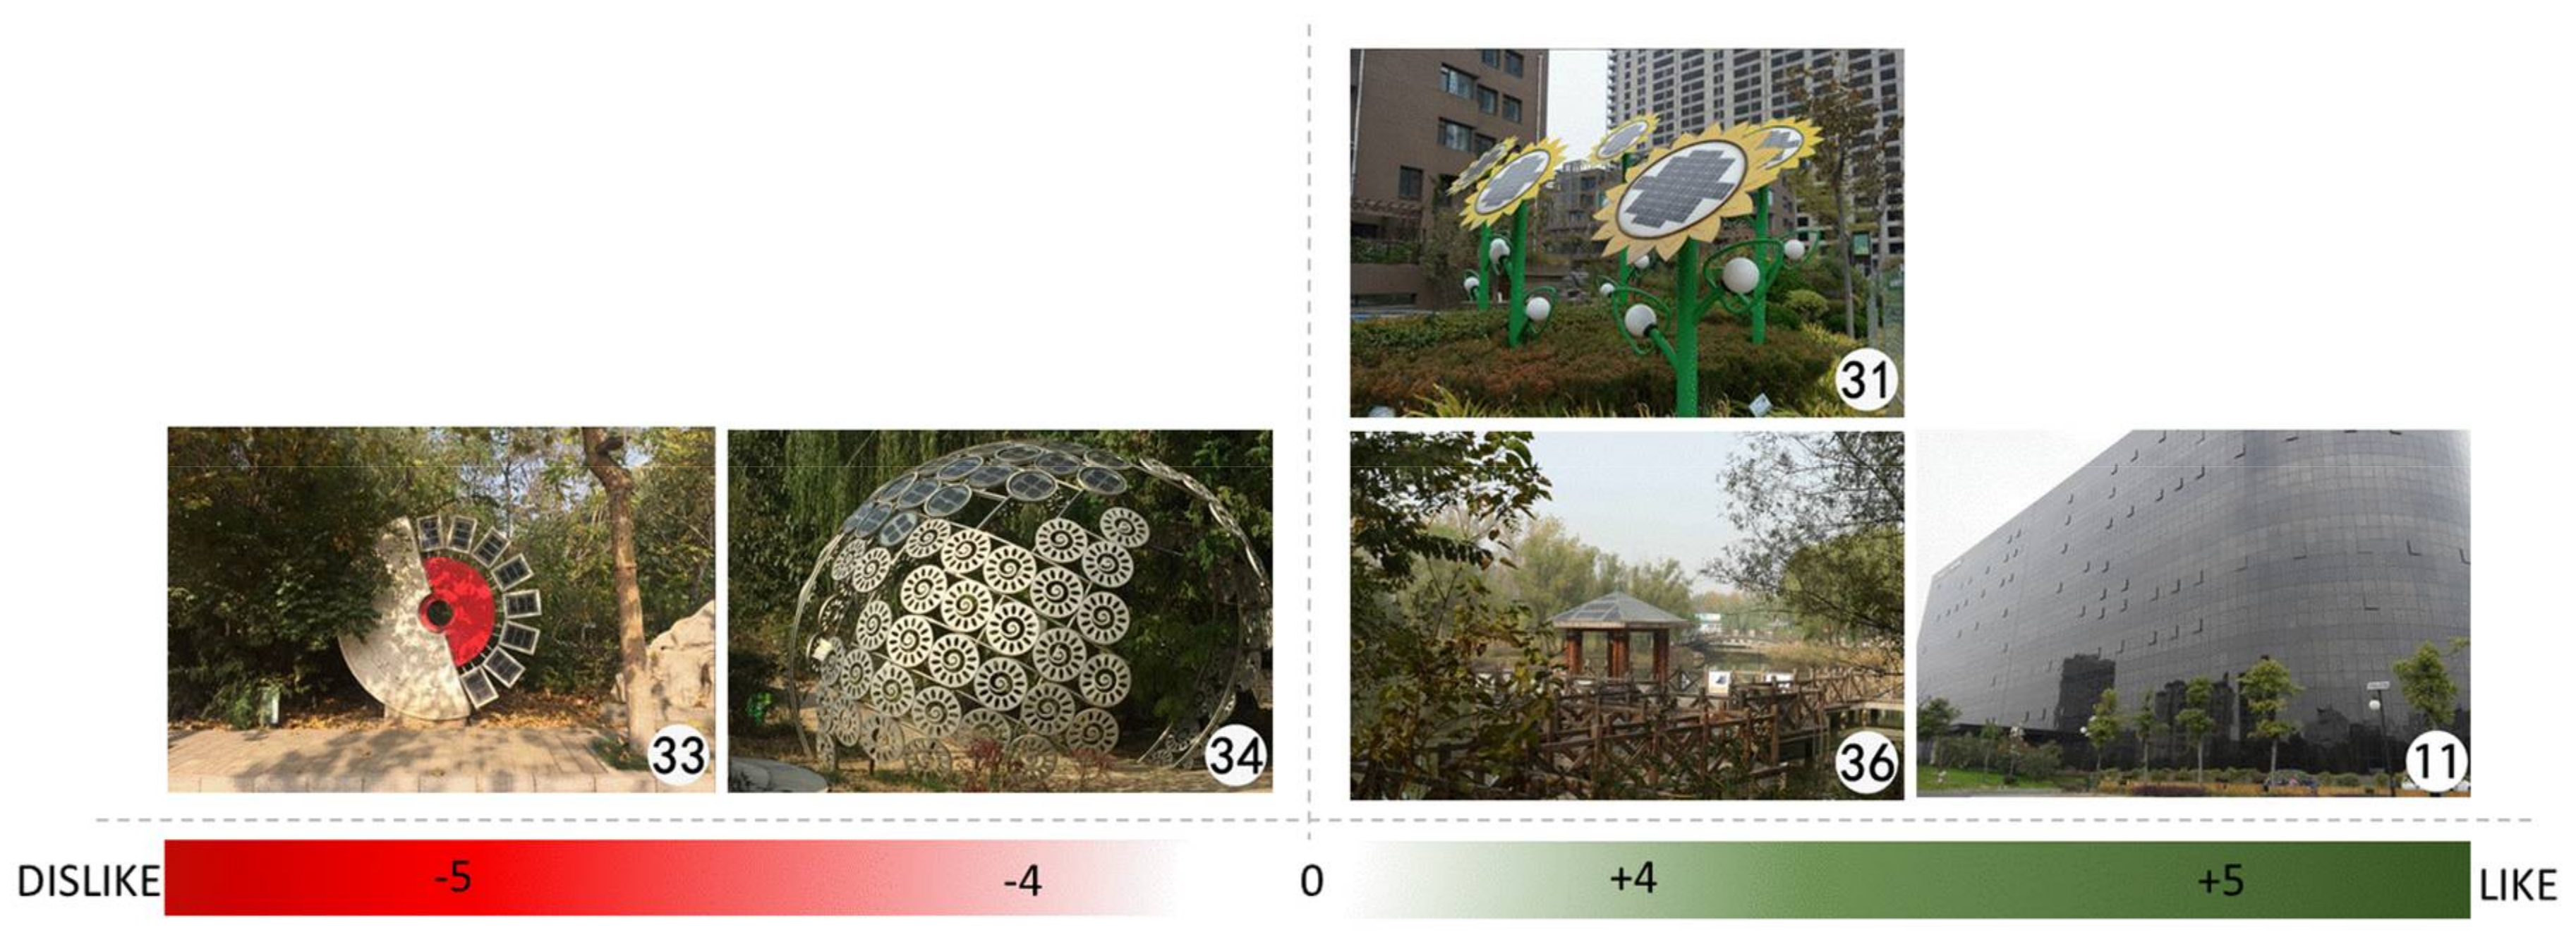
The photographs that received the highest scores in this factor were #35, #33 and #31, and the lowest score in this factor was #32 (see Figure 2). All the photographs showed the photovoltaic applications in green space. Individuals loading onto this factor preferred to see photovoltaic systems integrated with landscape structures (pavilions, sculptures, and garden lights). F1 was sensitive to the camouflage of the photovoltaic systems. Photovoltaic systems integrated into the infrastructure minimized the impact on land use or the function of the green space, which is more aesthetically harmonious with the environment. The designs were intended to increase public acceptance. The participants in this group disliked seeing non-integrated photovoltaic systems on the ground. Ground-mounted photovoltaic systems affected public perception of the landscape in urban areas, which may cause a visual impact and limit quality of life, according to the interview.
3.2. Factor 2 (F2) Power Generation of Photovoltaic Systems
F2 was defined by nine participants, including seven experts. These nine participants were comprised of two urban planning designers, two urban planning students, three photovoltaic engineers, one staff member, and one politician. This factor had an eigenvalue of 4.18 and explained 12% of the study variance.
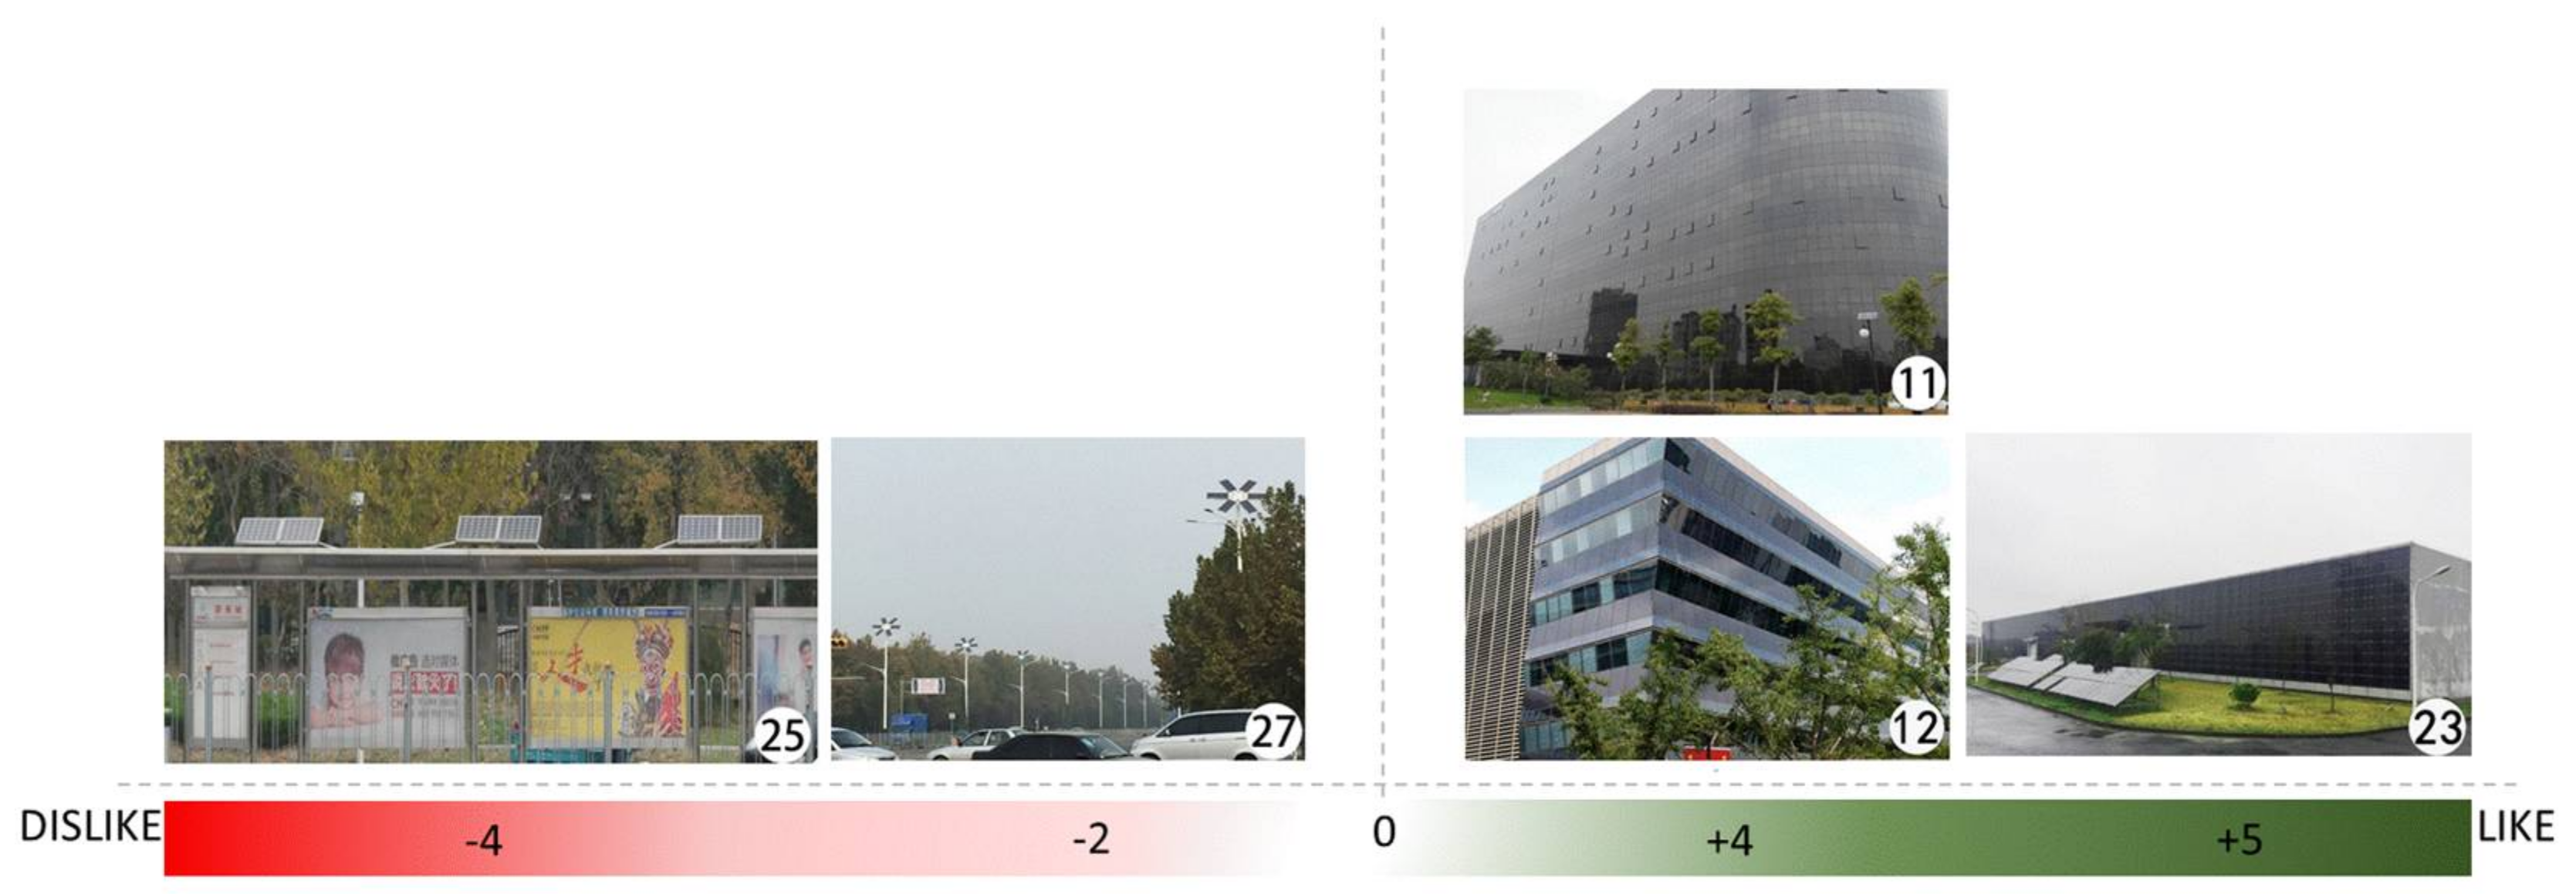
F2 suggested that photovoltaic power generation should be considered a priority (see Figure 3). The common feature of the three top-ranked photographs were photovoltaic systems integrated with facades of industrial buildings (#23) and public buildings (#11 and #12). The bottom-ranked photographs showed the photovoltaic systems that were non-integrated or semi-integrated with transportation infrastructures. F2 individuals preferred photovoltaic facades with higher power generation. These individuals gave the lowest score to the bus shelter roof with a small area of photovoltaic cells (#25). The group that defined F2 were mostly experts who observed a strong need for power generation. These individuals shared the viewpoints that integrated photovoltaic facades did not occupy human living space and that considerable power generation was more useful for human life. According to post-sorting interviews, photovoltaic engineers thought that photovoltaic systems with a certain level of power generation offered more socio-economic benefits and reduced the energy pressure. Photovoltaic systems integrated with transportation infrastructures caused negative visual impacts. Moreover, the electricity generated by these photovoltaic systems may not be as much as expected, which was not preferable.
3.3. Factor 3 (F3) Innovative Design of Photovoltaic Applications
Five participants defined F3, including three urban planning students, one general student, and one laborer. This factor had an eigenvalue of 2.59 and explained 7% of the study variance.
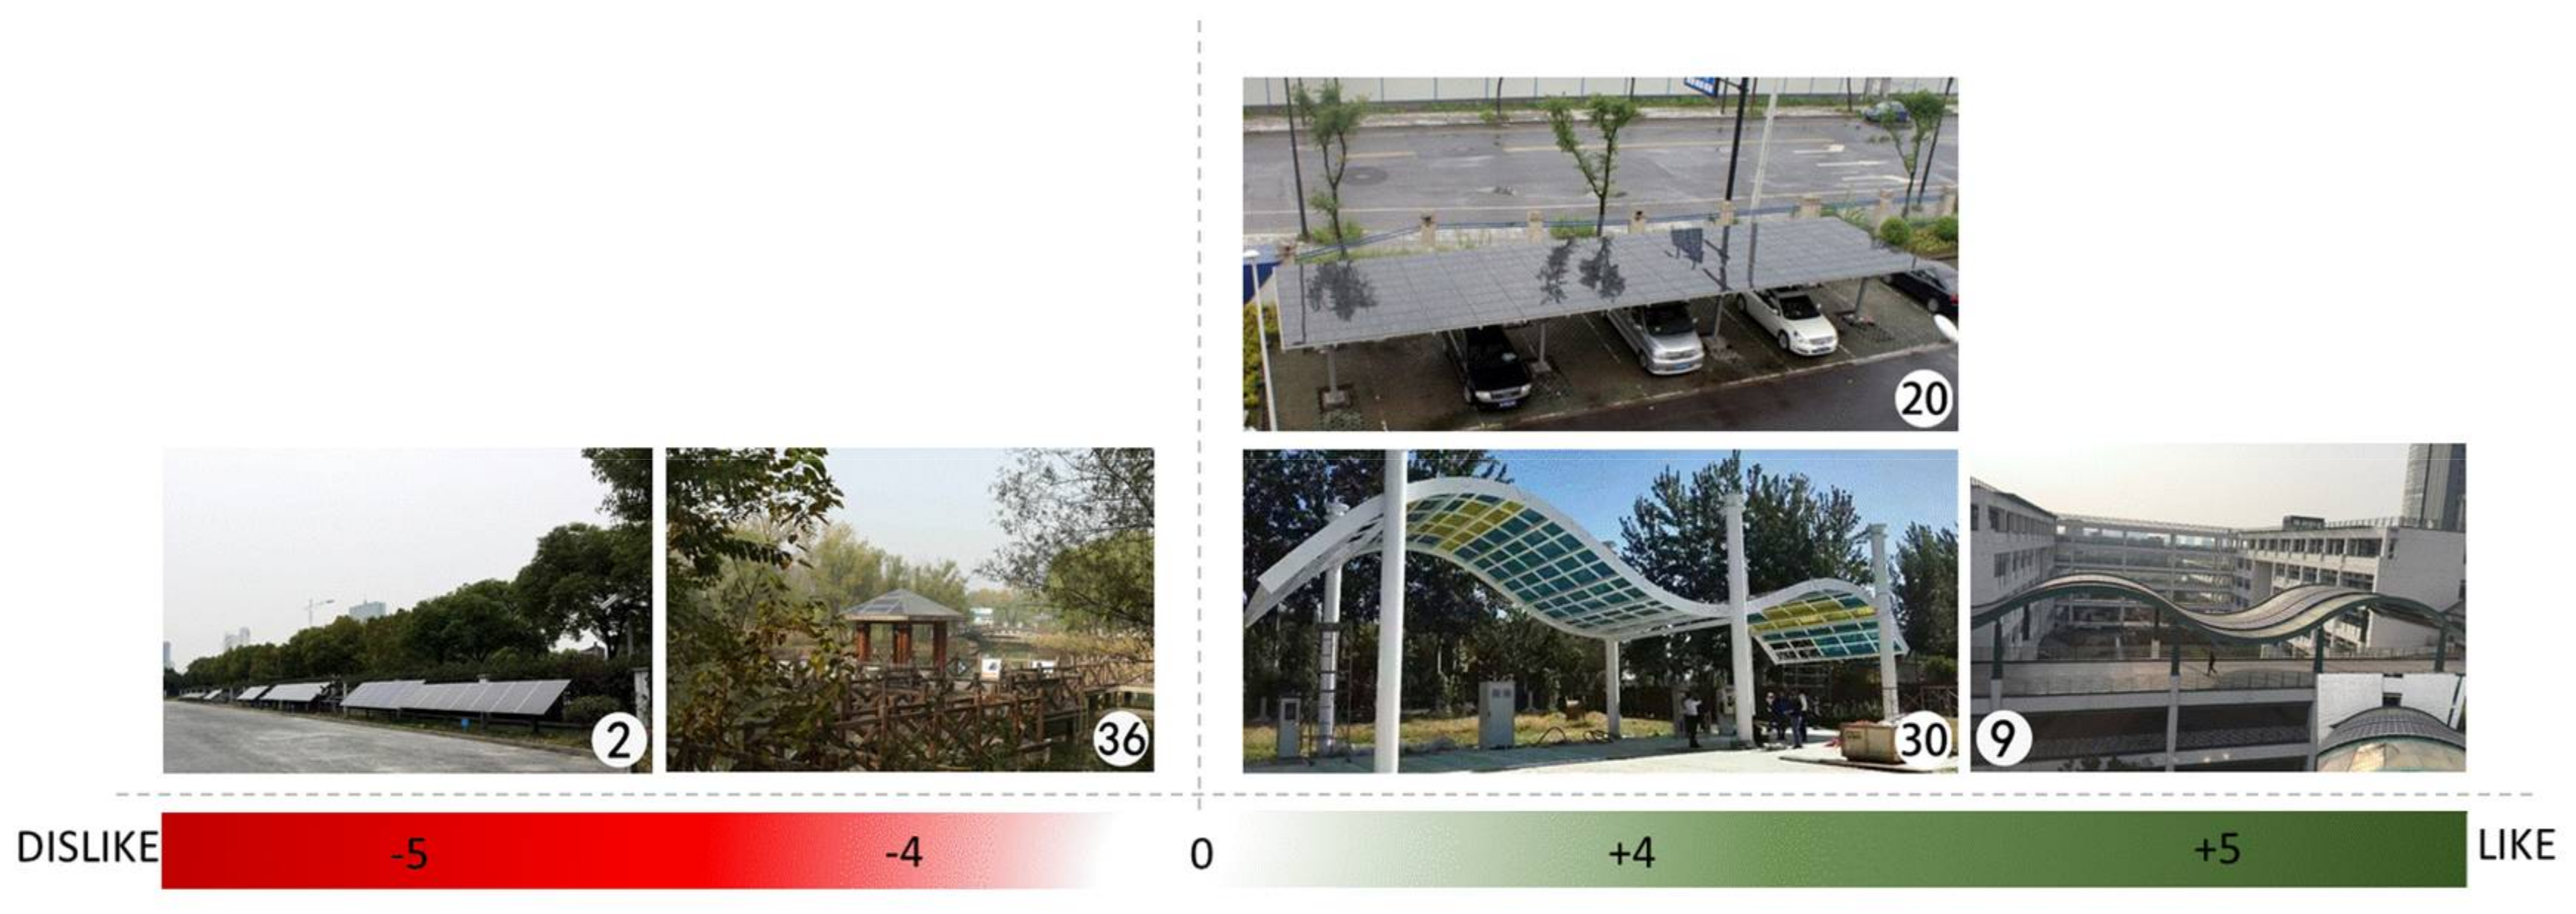
The photographs (#9, #20, and #30) that received the highest scores in this factor showed innovative design in which the patterns and colors were designed to aesthetically integrate with corridors and car sheds. Innovative design refers to the perfect combination of colors and patterns of photovoltaic cells with buildings or structures through splicing, compression and coating processes, making them invisible. The photographs that received the lowest scores showed the photovoltaic systems being mechanically placed on the ground and on landscape structures (see Figure 4). For the individuals in F3, these photovoltaic applications had no consideration on aesthetic harmony between human activities and the urban facilities. The color selection and patterns of photovoltaic cells were associated with impacts on the urban landscape. The innovative design of photovoltaic systems emphasized the invisible design of color and patterns of photovoltaic cells.
3.4. Factor 4 (F4) Social Benefits of Photovoltaic Applications
Three participants defined F4: one urban planning student, one photovoltaic engineer, and one general student. This factor had an eigenvalue of 2.21 and explained 6% of the study variance.
F4 showed a preference for the social benefits of photovoltaic systems. All photographs (see Figure 5) in this group showed aesthetic harmony with the environment. In addition, photographs that accounted for F4 were mostly in green space as well. F4 shared similarities with F1 but with a primary focus on social benefit. F4 was not interested in high landscape camouflage. The photographs that received the highest scores from F4 showed the photovoltaic applications that provided social benefits, such as illumination and indications for citizens. The photovoltaic facade in #11 was connected to the national grid. F4 individuals liked the photovoltaic systems for creating socio-economic benefits for human daily life and disliked the photovoltaic systems on landscape structures.
3.5. Factor 5 (F5) Installation Height of Photovoltaic Systems
Three participants defined F5: one urban planning student, one general student, and one housewife. This factor had an eigenvalue of 2.11 and explained 6% of the study variance.
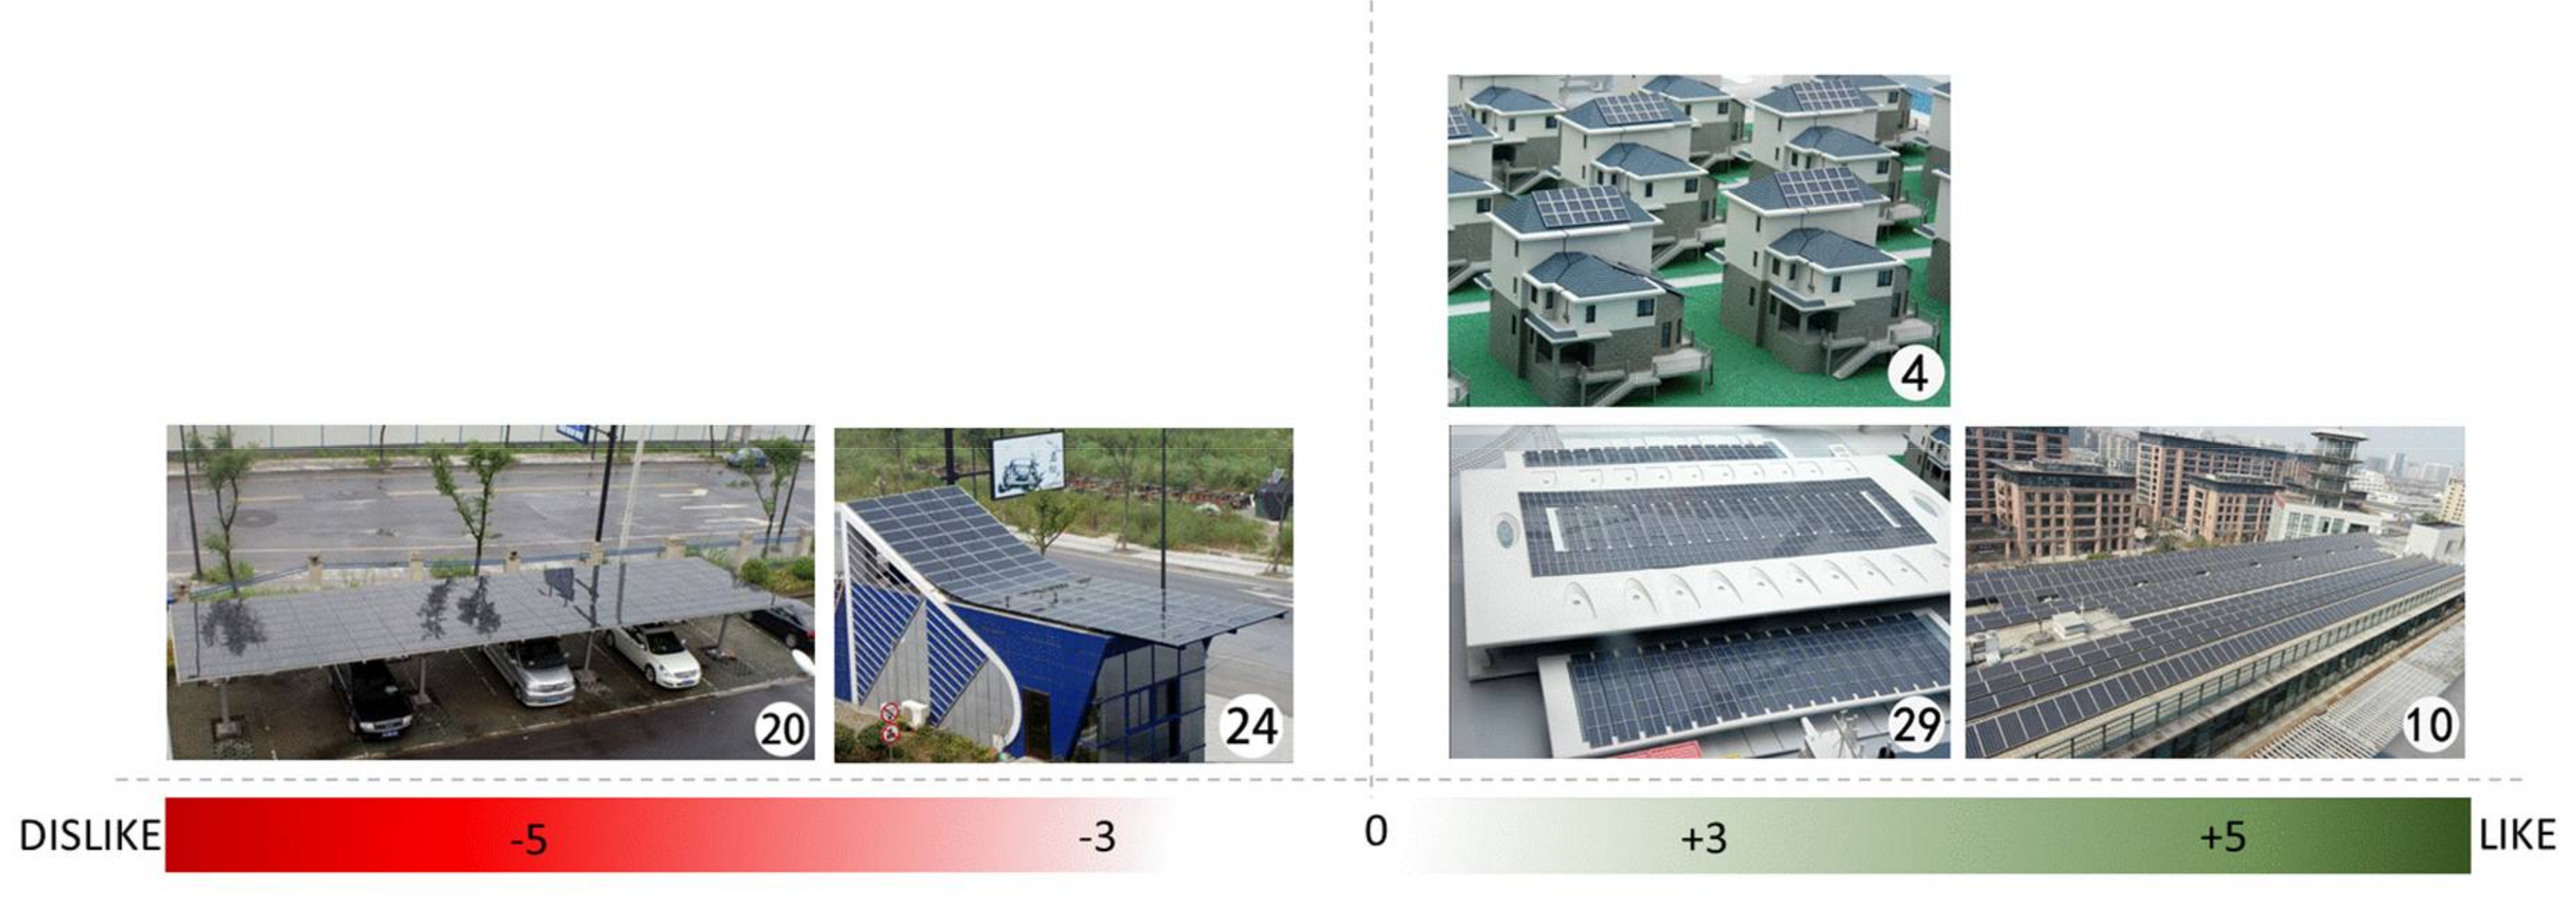
In this factor, the arrangement of photographs emphasized photovoltaic applications on roofs that were out of the public eye, suggesting high appreciation for photovoltaic rooftops on multi-story and high-rise buildings. Photographs displaying a public building (#10), residential building (#4) and train station (#29) ranked highest in F5. These settings were described as “out of the public eye”. The least-liked photographs showed photovoltaic roofs on one-story buildings (see Figure 6). In F5, the individuals were concerned about glare risk from the photovoltaic cells. F5 indicated a concern for the installed height of photovoltaic systems. Visual impact was caused when the installed height was within sight, for example, roofs on one-story buildings. When the installed height was out of sight, the negative visual impact was reduced. F5 respondents supported photovoltaic applications on the roofs of high buildings.
3.6. Consensus Photographs and Opinions
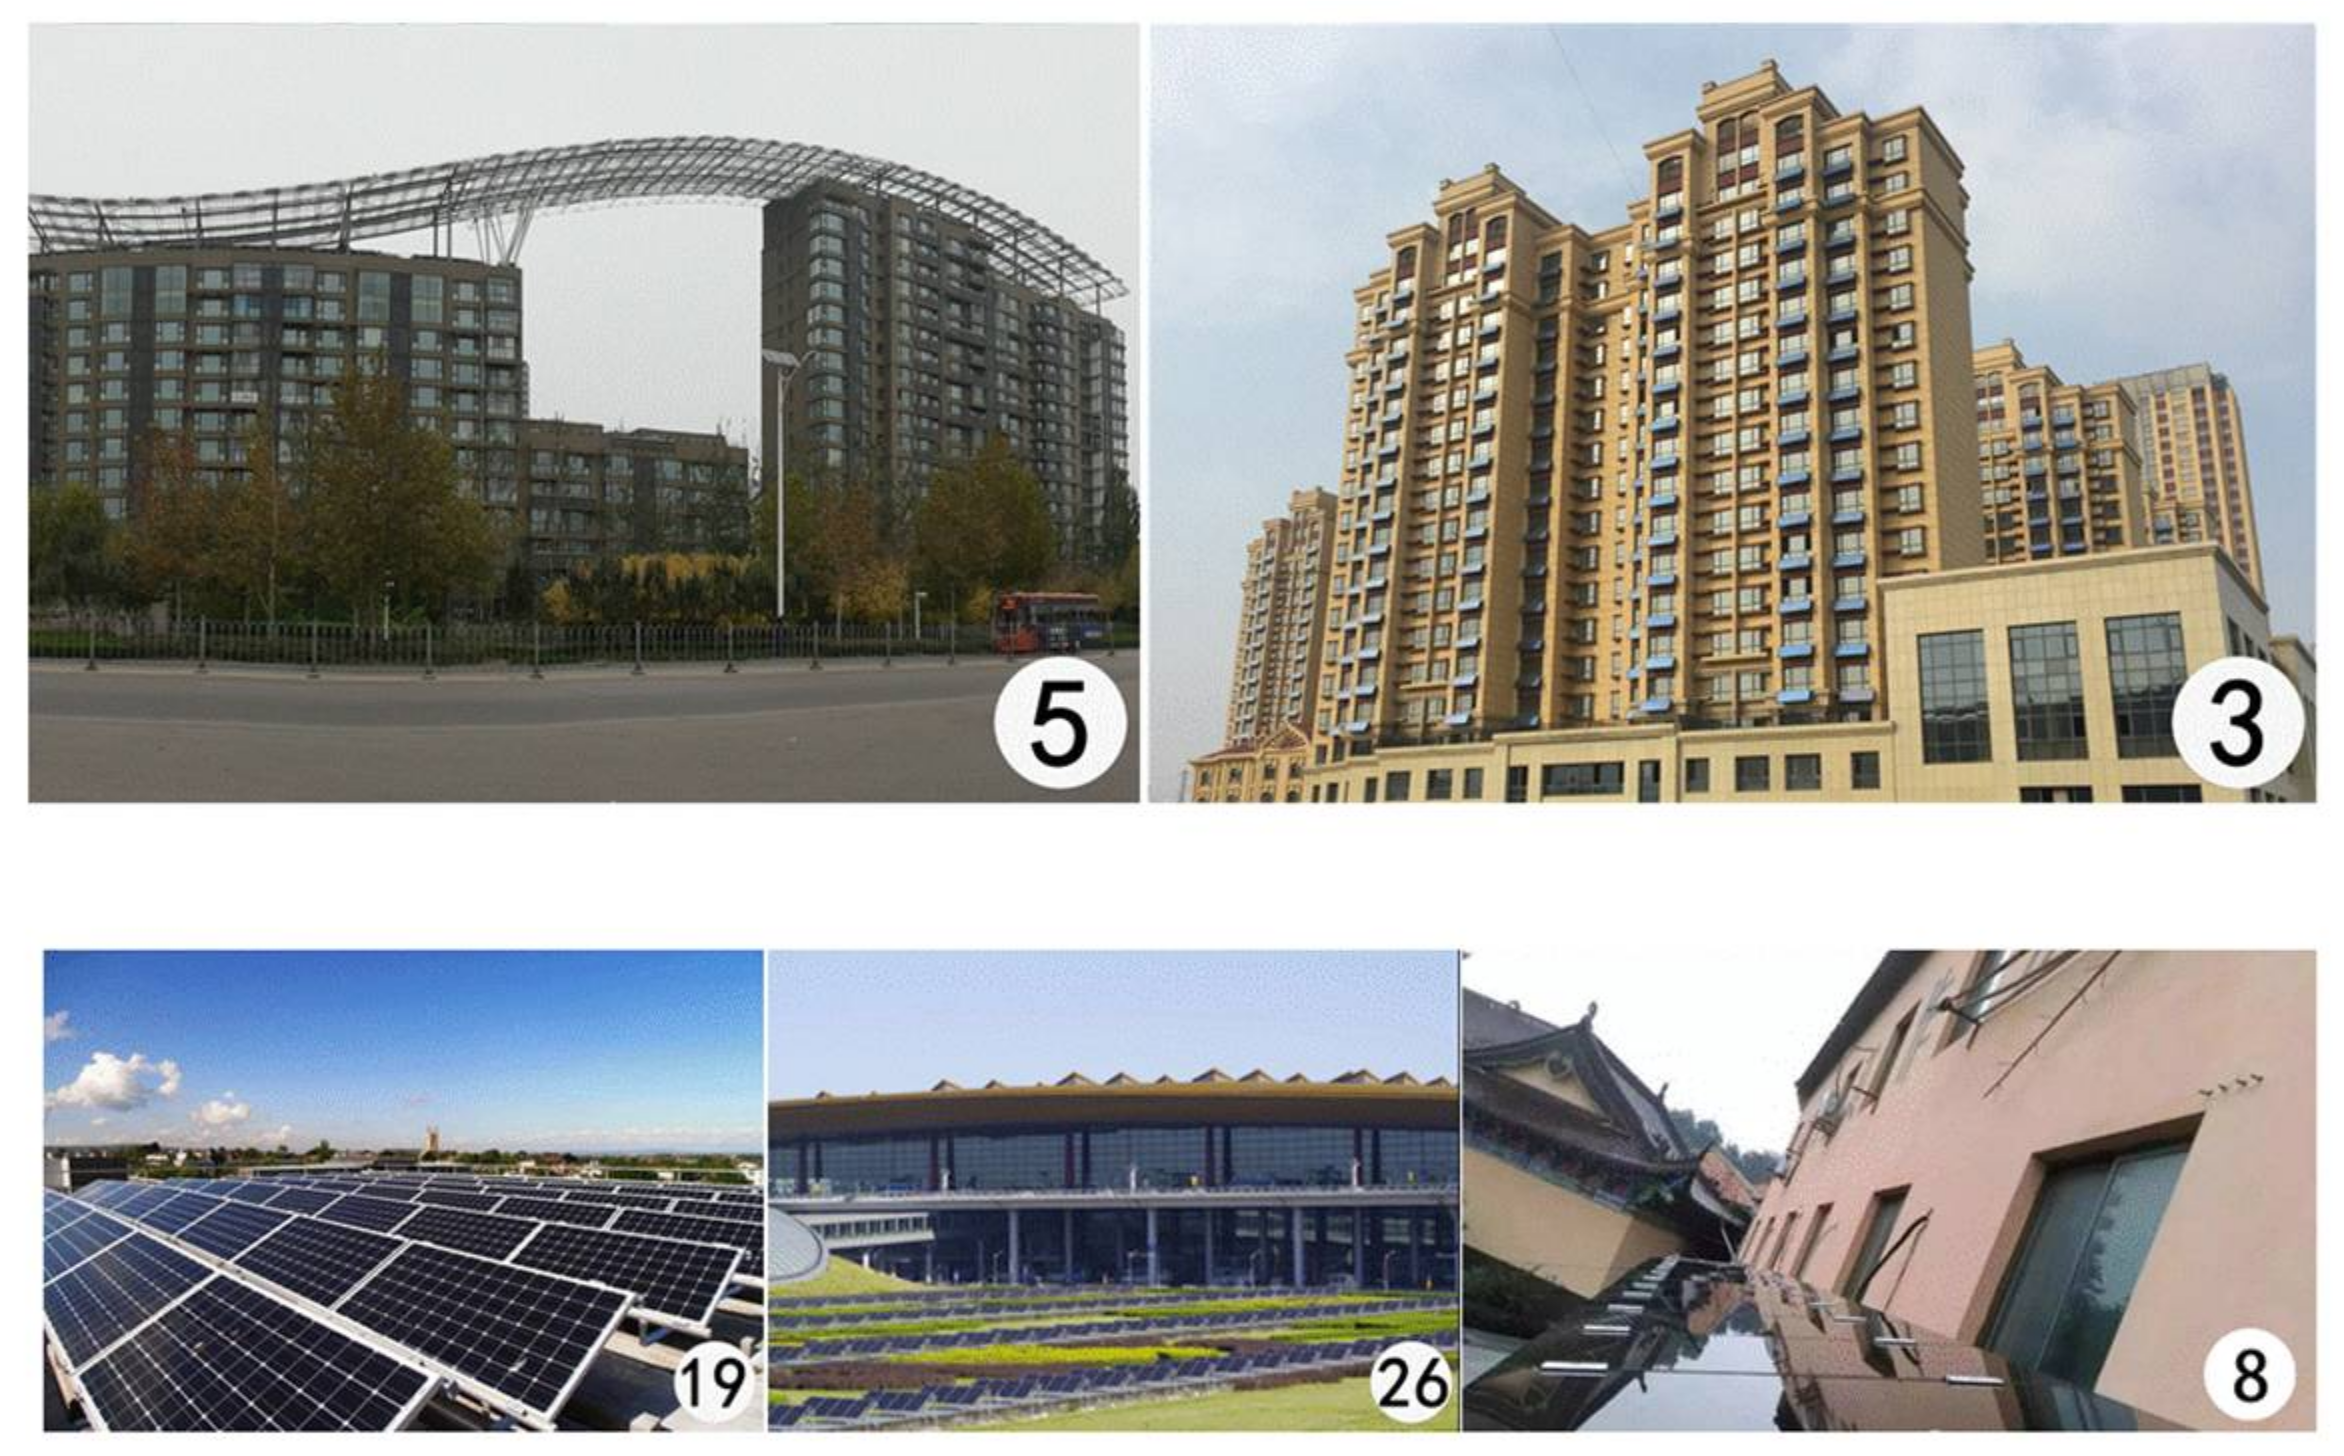
There were relatively high correlations between factor scores (see Table 3), but there were no consensus photographs in this study. Consensus photographs referred to photographs that did not distinguish between any pair of factors and were non-significant. The highest rankings of the consensus were found for #3 (photovoltaic systems on facades of high-rise residential buildings), #5 (innovative design of a photovoltaic roof on multi-story resident buildings), #8 (photovoltaic shading structures for temples), #19 (photovoltaic plants on industry grounds), and #26 (photovoltaic cells on airport grounds) (see Figure 7).
The most common opinions proposed from the post-sorting interviews were resistance to ground-mounted photovoltaic systems (#19 and #26). When the mechanical photovoltaic panels were placed on the ground, urban planners and landscape designers were needed to intervene to enhance the design beauty. Other opinions mentioned were about photovoltaic systems on historical or protected buildings; participants disliked the photovoltaic applications on these buildings, whether it was integrated or non-integrated (#8). Even though the non-integrated photovoltaic utilization had no effect on protected buildings’ structures, it decreased the cultural and ornamental values of these buildings. The participants, especially non-experts, showed great interest in the innovative design of photovoltaic applications on residential buildings (#5); both #3 and #5 were strongly accepted by participants, which brought economic and social benefits.
4. Discussion
Photovoltaic applications in urban contexts aim to address energy crises and electricity shortages, but they should not conflict with the urban landscape. By using visual Q methodology, we sought to better understand the impacts of photovoltaic applications on landscapes in different land use types. In a quantitative research setting, we collected and clarified the landscape preferences of experts and non-experts. We first discuss the role of public participation and landscape preferences in five factors. In addition, the different benefits of photovoltaic applications are compared. Afterwards, site selection for photovoltaic applications in different land use types is expounded from the perspective of decision makers. The academic contributions to the discipline in the study are presented. Lastly, the advantages and limitations are clarified regarding the application of the visual Q methodology in the landscape assessment of photovoltaic applications.
4.1. The Relationship between Factors and Public Participation
First, an attempt has been made to demonstrate the importance of public participation in this research. These five factors reflect the preferences of the public in multiple ways. A complete understanding of the diversity of perceptions could help promote the design of photovoltaic systems. By taking public preferences into account, planning of photovoltaic utilization and city planning will be performed with justice and integrity. The participation of the public in the decision-making process should be considered in advance. The relationship between factors and public participation yields recommendations for landscape assessment based on empirical research.
The results suggest that respondents from F1 support a photovoltaic landscape designed to be aesthetically harmonious with the environment. Similarly, the respondents from F4 are also concerned with aesthetic harmony, but unlike the F1 participants, their current need for photovoltaic applications strongly emphasized the social benefits of photovoltaic systems. For F2, “photovoltaic power prioritized” was particularly important to offer economic and environmental benefits. This group aligned closely with the objective of “photovoltaic systems on transportation facilities”. For F3, the most obvious preference was “innovative design”. Individuals in this group were interested in seeing innovative designs of color and pattern of photovoltaic systems. F5, however, was more specific in preferring photovoltaic roofs that were designed out of sight or invisible with the lowest visual impact (glare risk). Additionally, all participants showed a preference for integrated photovoltaic applications rather than semi-integrated or non-integrated photovoltaic applications.
4.2. The Relationship between Factors and Benefits of Photovoltaic Applications
Moreover, the quantitative results also emphasized the importance of the social and environmental benefits together with the economic value of photovoltaic applications. Photovoltaic applications have been increasingly used to produce electricity with a decrease in the emissions of greenhouse gases, which contributes to economic development. Power generation is considered a priority when making decisions about a project. Experts in F2, particularly photovoltaic engineers, favored photovoltaic systems that were integrated with buildings to produce more electricity due to the larger surface area of the buildings. For F4 individuals, social benefits were more important, which was reflected in the service capability of photovoltaic applications. Economic values and social and environmental benefits need to be accounted for so that a reasonable decision from an energy perspective can be made when a photovoltaic power station is built. Unlike F2 and F4, individuals from F1, F3 and F5 considered photovoltaic applications from a social-psychological perspective.
Photovoltaic applications in urban areas represent more than an economic issue, and a cost–benefit analysis is deficient. Landscape assessments, together with social-psychological patterns from the public, are both indexes that can be used to evaluate the impact of a project.
4.3. The Relationship between Urban Land Use Types and Photovoltaic Applications
These results illustrate that differences in urban land use types may influence the impact of photovoltaic systems on the landscape. The corresponding monetary policy and solar photovoltaic policy for different land use types will bring about significant improvements in the layout and design of photovoltaic applications in urban areas. This approach provides references for decision-makers to reconsider photovoltaic applications for different land use types.
F1 and F4 mainly accounted for the impact of photovoltaic systems on the landscape in urban green space, although F4 was more important than F1. F3 is needed less in green space. For green space, social benefits and the environmental harmony of photovoltaic systems are the main impacts on the landscape.
While F2–F5 explained the impact on public service land, F2 was the most important factor. The increase of photovoltaic power generation results in an increase in the number of photovoltaic panels, which causes an impact on the landscape.
F2, F3 and F5 accounted for the impact on industrial and transportation land. Photovoltaic roofs are suitable for industrial land since the greater height of photovoltaic systems does not generate a landscape and visual impact. Photovoltaic power generation is the main impact on the landscape on transportation land; transportation facilities, such as lights and bus stops, integrated with photovoltaic offer fewer benefits than transportation buildings, such as train stations and airport terminals. Therefore, photovoltaic applications on transportation buildings are preferable to transportation facilities.
F3 and F5 were the main determinants for residential land. Residents showed significant preferences for photovoltaic applications that were out of sight. Additionally, innovative designs of color made the photovoltaic panels more invisible.
There were no factors that accounted for the impact of photovoltaic systems on the landscape on commercial land. According to the post-interview with participants, they believed that any type of photovoltaic applications would change the landscape and distinguish the features of business quarters.
The results also suggest that differences in the backgrounds of the participants may influence the landscape preferences. The experts from F1 and F2 were concerned about the integration and power generation of photovoltaic systems. Among experts, photovoltaic engineers advocate for BIPV, which conserves urban land and does not affect people’s activities, while urban planners and landscape designers claim that photovoltaic applications should be harmonious with the landscape and be based on the landscape camouflage so that the social benefits of photovoltaic systems are maximized. Non-experts linked to these five factors were concerned with the visual impact and aesthetic design of photovoltaic applications, while obscuring of the landscape and glare risk were objections.
Landscape assessments of photovoltaic applications are currently under development in many different fields (landscape planning, urban planning, energy, economics, and psychology). Due to the academic background of the P sample, this study was an interdisciplinary study of urban planning, landscape architecture and energy. Efforts should be made to enhance the integrated design of photovoltaic applications with the landscape to ensure that the ecological and aesthetic values of photovoltaic systems on the basis of electricity generation and emissions reduction are maximized.
Progress has been made by previous studies regarding the importance of landscape assessment for urban photovoltaic applications. Based on previous studies, this paper focused on the differences in landscape impacts in different land use types. The process of visual Q methodology for evaluating the impact of photovoltaic applications on the landscape can be quickly implemented. By using this method, the importance of understanding the factors relevant to public acceptance towards photovoltaic applications are emphasized. Our study had some limitations that should be noticed. This study used visual Q methodology for the verification of landscape impact of an existing photovoltaic system. This progress may be affected by the conditions with which the photographs were taken (distance and sky cover). The analysis of the landscape impacts carried out by means of photographs involves the climate conditions and should be carefully selected. Further research activity should be carried out to minimize the effects of different photographs. Furthermore, a tool based on visual analysis for the landscape impact assessment may be used in the case of an unbuilt photovoltaic project to understand the degree of landscape impact. Further research should focus the assessment on the observer’s experience with GIS-based techniques. We propose establishing a landscape assessment system that can quantify these indexes to evaluate the landscape impact of photovoltaic applications.
Although our work was applied to urban land use types in China, which may be different from other countries, our approach and results will be relevant to other countries or districts attempting to consider landscape assessments for solar energy policy.
5. Conclusions
The objective of this study is to identify the impact of photovoltaic applications on the urban landscape by using visual Q methodology. The impacts of photovoltaic systems on the landscape are different in six urban land use types. Five factors (photovoltaic system harmony with the environment, power generation, innovative design, installation height, and social benefits) are the main impacts of photovoltaic applications on the landscape. These impacts place more restrictions on photovoltaic applications. These five factors are determinants for the future direction of photovoltaic applications in an urban context and are closely linked with landscape assessment.
We reached the following conclusions:
- Integrated and semi-integrated photovoltaic applications should be emphasized. Photovoltaic applications for buildings should prioritize roof-based applications, supplemented by photovoltaic facades. Photovoltaic landscapes are recommended for landscape structures. The selection of solar photovoltaic panels should be environmentally friendly and add more varieties of color and shape. In general, the impact of distributed photovoltaic applications on urban building roofs is less than that of those on the ground or on landscape structures.
- The impacts of photovoltaic applications in six urban land use types are different. Photovoltaic landscapes should be aesthetically harmonious with the surrounding environment in green spaces. Photovoltaic power generation is a significant factor for public service land and transportation land. Photovoltaic systems on transportation facilities are rejected, while those on transportation buildings are promoted. Photovoltaic applications on rooftops are more favorable on residential and industrial land because of the lower visual impact (glare risk). The acceptance of photovoltaic applications on commercial land is very poor.
The conclusions have important implications for policy-makers and academic studies on urban photovoltaic utilization. A key contribution of this study is that it can ensure the future development of photovoltaic systems promoted by the government and consider landscape assessment in the initial stages. Policy effects, which make the urban photovoltaic utilization a “top-down” system and increase social acceptance, should be considered.
The impact of photovoltaic applications on landscapes must be considered during the project approval process. We suggest a utilization that reduces landscape impacts because the policies have the power to shape social acceptance patterns. Additional supportive measures on urban land use policy and energy policy should be made by the government and related authorities (for example, photovoltaic investors, building industry associations and companies) to guide the installation of photovoltaic systems, including: (1) appropriate financial subsidy systems for different urban land use; (2) reduction of the cost of photovoltaic applications and increases in investment and technological innovation; and (3) a focus on public acceptance and psychological determinants to encourage the financing and installation of photovoltaic systems.
Acknowledgments
This study was supported by the National Natural Science Foundation of China (No. 51438005), Key Science and Technology Program of Heilongjiang Province (No. GZ15A508) and Scientific Research Project of the Ministry of Housing and Urban-Rural Development (No. 2016-K1-011).
Author Contributions
The paper was a collaborative effort among the authors. M.L. provided the research direction; A.L. and J.S. were involved in processing phase and data collection; A.L. and M.L. designed and performed the experiments; and A.L. and J.S. analyzed the data. Both authors have concluded the scientific findings.
Conflicts of Interest
The authors declare no conflict of interest.
Appendix A

Table A1.
Factor arrays.
| Photo | Factor | Photo | Factor | ||||||||
|---|---|---|---|---|---|---|---|---|---|---|---|
| 1 | 2 | 3 | 4 | 5 | 1 | 2 | 3 | 4 | 5 | ||
| 1 | 1 | 0 | −2 | 0 | 2 | 19 | −2 | −1 | −3 | −1 | 0 |
| 2 | −4 | −4 | −5 | −3 | −2 | 20 | −1 | 1 | 4 | 3 | −5 |
| 3 | 1 | 1 | −1 | 0 | 1 | 21 | −3 | −2 | 1 | 2 | 1 |
| 4 | 0 | −2 | 2 | 1 | 3 | 22 | 1 | 1 | 1 | 3 | −1 |
| 5 | 1 | 0 | 0 | 2 | 2 | 23 | −1 | 5 | 0 | 0 | −1 |
| 6 | −1 | 2 | 3 | 1 | −3 | 24 | −1 | 2 | 2 | −1 | −3 |
| 7 | 0 | −1 | −1 | 1 | 2 | 25 | −3 | −4 | 0 | −2 | −4 |
| 8 | −3 | −1 | −2 | −1 | 0 | 26 | −2 | 0 | −2 | 0 | −2 |
| 9 | 3 | 2 | 5 | −1 | 3 | 27 | 2 | −2 | 2 | 1 | 1 |
| 10 | −2 | 0 | 0 | 2 | 5 | 28 | 2 | −1 | 1 | −2 | −1 |
| 11 | −1 | 4 | 2 | 5 | 1 | 29 | 1 | 3 | 3 | 2 | 3 |
| 12 | 0 | 4 | 3 | −2 | 1 | 30 | 3 | 1 | 4 | −4 | −1 |
| 13 | −5 | −5 | −4 | −2 | −2 | 31 | 3 | −3 | 1 | 4 | −1 |
| 14 | −2 | −3 | −3 | 3 | 0 | 32 | −4 | −3 | −2 | 0 | −4 |
| 15 | 0 | 1 | 0 | −3 | 2 | 33 | 2 | −2 | 0 | −5 | 4 |
| 16 | 0 | 3 | −1 | 0 | −3 | 34 | 4 | 0 | 1 | −4 | 4 |
| 17 | 5 | 2 | −1 | 1 | 0 | 35 | 4 | 0 | −3 | −3 | −2 |
| 18 | 0 | 3 | −1 | −1 | 0 | 36 | 2 | −1 | −4 | 4 | 0 |
References
- Zoellner, J.; Schweizer-Ries, P.; Wemheuer, C. Public acceptance of renewable energies: Results from case studies in Germany. Energy Policy 2008, 36, 4136–4141. [Google Scholar] [CrossRef]
- Turney, D.; Fthenakis, V. Environmental impacts from the installation and operation of large-scale solar power plants. Renew. Sustain. Energy Rev. 2011, 15, 3261–3270. [Google Scholar] [CrossRef]
- Burnett, D.; Barbour, E.; Harrison, G.P. The UK solar energy resource and the impact of climate change. Renew. Energy 2014, 71, 333–343. [Google Scholar] [CrossRef]
- Chiabrando, R.; Fabrizio, E.; Garnero, G. On the applicability of the visual impact assessment OAI tool to photovoltaic plants. Renew. Sustain. Energy Rev. 2011, 15, 845–850. [Google Scholar] [CrossRef]
- Chiabrando, R.; Fabrizio, E.; Garnero, G. The territorial and landscape impacts of photovoltaic systems: Definition of impacts and assessment of the glare risk. Renew. Sustain. Energy Rev. 2009, 13, 2441–2451. [Google Scholar] [CrossRef]
- Liu, F.F.; Zhan, C.H.; Kang, J.; Wu, Y. Integrated design of the solar roofs in cold regions based on a questionnaire survey on problems in current devices. J. Harbin Inst. Technol. 2016, 48, 163–166. [Google Scholar] [CrossRef]
- Sahu, B.K. A study on global solar PV energy developments and policies with special focus on the top ten solar PV power producing countries. Renew. Sustain. Energy Rev. 2015, 43, 621–634. [Google Scholar] [CrossRef]
- Dusonchet, L.; Telaretti, E. Comparative economic analysis of support policies for solar PV in the most representative EU countries. Renew. Sustain. Energy Rev. 2015, 42, 986–998. [Google Scholar] [CrossRef]
- Cucchiella, F.; D’Adamo, I.; Koh, S.C.L. Environmental and economic analysis of building integrated photovoltaic systems in Italian regions. J. Clean. Prod. 2015, 98, 241–252. [Google Scholar] [CrossRef]
- Landscape Policy and Guidance. Available online: http://www.devon.gov.uk/landscape-policy-guidance (accessed on 27 May 2016).
- Marcheggiani, E.; Gulinck, H.; Galli, A. Detection of fast landscape changes: The case of solar modules on agricultural land. In Proceedings of the Computational Science and Its Applications, Ho Chi Minh City, Vietnam, 24–27 June 2013; Murgante, B., Ed.; Springer: Berlin/Heidelberg, Germany, 2013. [Google Scholar]
- Solar Energy in Urban Planning. Available online: http://task51.iea-shc.org/ (accessed on 29 June 2017).
- Amado, M.; Poggi, F. Towards solar urban planning: A new step for better energy performance. In Proceedings of the 1st International Conference on Solar Heating and Cooling for Buildings and Industry, San Francisco, CA, USA, 9–11 July 2012; pp. 1261–1273. [Google Scholar]
- Blaschke, T.; Biberacher, M.; Gadocha, S.; Schardinger, I. ‘Energy landscapes’: Meeting energy demands and human aspirations. Biomass Bioenergy 2013, 55, 3–16. [Google Scholar] [CrossRef] [PubMed]
- Scognamiglio, A. ‘Photovoltaic landscapes’: Design and assessment. A critical review for a new transdisciplinary design vision. Renew. Sustain. Energy Rev. 2016, 55, 629–661. [Google Scholar] [CrossRef]
- Torres-Sibille, A.D.C.; Cloquell-Ballester Vicente, A.; Cloquell-Ballester Víctor, A.; Ramírez, M.Á.A. Aesthetic impact assessment of solar power plants: An objective and a subjective approach. Renew. Sustain. Energy Rev. 2009, 13, 986–999. [Google Scholar] [CrossRef]
- Mondino, E.B.; Fabrizio, E.; Chiabrando, R. A GIS tool for the land carrying capacity of large solar plants. Energy Procedia 2014, 48, 1576–1585. [Google Scholar] [CrossRef]
- Mondino, E.B.; Fabrizio, E.; Chiabrando, R. Site selection of large ground-mounted photovoltaic plants: A GIS decision support system and an application to Italy. Int. J. Green Energy 2015, 12, 515–525. [Google Scholar] [CrossRef]
- Mauro, G.; Lughi, V. Mapping land use impact of photovoltaic farms via crowdsourcing in the Province of Lecce (Southeastern Italy). Sol. Energy 2017, 155, 434–444. [Google Scholar] [CrossRef]
- Rodrigues, M.; Montañés, C.; Fueyo, N. A method for the assessment of the visual impact caused by the large-scale deployment of renewable-energy facilities. Environ. Impact Assess. 2010, 30, 240–246. [Google Scholar] [CrossRef]
- Naspetti, S.; Mandolesi, S.; Zanoli, R. Using visual Q sorting to determine the impact of photovoltaic applications on the landscape. Land Use Policy 2016, 57, 564–573. [Google Scholar] [CrossRef]
- Circular of the State Council on Printing and Distributing the Plan for Energy Development in 12th Five-Year. Available online: http://www.nea.gov.cn/2013-01/28/c_132132808.htm (accessed on 24 January 2013).
- Notice of the National Energy Administration on Issuing Interim Measures for the Management of Distributed Photovoltaic Power Generation Projects. Available online: http://zfxxgk.nea.gov.cn/auto87/201312/t20131211_1735.htm (accessed on 11 December 2013).
- Brown, S.R. Political Subjectivity: Applications of Q Methodology in Political Science; Yale University Press: New Haven, CT, USA, 1980; p. 355. [Google Scholar]
- Stephenson, W. The inverted factor technique. Br. J. Psychol. 1936, 26, 344–361. [Google Scholar] [CrossRef]
- Watts, S.; Stenner, P. Doing Q Methodological Research: Theory, Method & Interpretation; Sage Publications: London, UK; Thousand Oaks, CA, USA; New Delhi, India; Singapore, 2012; pp. 7–8. [Google Scholar]
- Goldman, I. Q Methodology as process and context in interpretivism communication and psychoanalytic psychotherapy research. Psychol. Rec. 1999, 49, 589–604. [Google Scholar] [CrossRef]
- Baker, R.M. Economic rationality and health and lifestyle choices for people with diabetes. Soc. Sci. Med. 2006, 63, 2341–2353. [Google Scholar] [CrossRef] [PubMed]
- Milcu, A.I.; Sherren, K.; Hanspach, J.; Abson, D.; Fischer, J. Navigating conflicting landscape aspirations: Application of a photo-based Q-method in Transylvania (Central Romania). Land Use Policy 2014, 41, 408–422. [Google Scholar] [CrossRef]
- Hawthorne, T.; Krygier, J.; Kwan, M.P. Mapping ambivalence: Exploring the geographies of community change and rails-to-trails development using photo-based Q method and PPGIS. Geoforum 2008, 39, 1058–1078. [Google Scholar] [CrossRef]
- Størksen, I.; Thorsen, A.A. Young children’s participation in a Q study with visual images: Some comments on reliability and validity. Oper Subj. 2011, 34, 146–171. [Google Scholar]
- Swaffield, S.R.; Airweather, J.R. Investigation of attitudes towards the effects of land use change using image editing and Q sort method. Landsc. Urban Plan. 1996, 35, 213–230. [Google Scholar] [CrossRef]
- Mokry, S.; Dufek, O. Q Method and its use for segmentation in tourism. In Proceedings of the Enterprise and the Competitive Environment Conference, Brno, Czech Republic, 6–7 March 2014; pp. 445–452. [Google Scholar]
- Fairweather, J.R.; Swaffield, S.R. Visitors’ and locals’ experiences of Rotorua, New Zealand: An interpretative study using photographs of landscapes and Q method. Int. J. Tour. Res. 2002, 4, 283–297. [Google Scholar] [CrossRef]
- McKeown, B.; Thomas, D. Q methodology, 2nd ed.; Sage Publications: Newbury Park, CA, USA, 2013; pp. 10–11. [Google Scholar]
- Given, L.M. The Sage Encyclopedia of Qualitative Research Methods; Sage Publications: London, UK; Thousand Oaks, CA, USA; New Delhi, India; Singapore, 2008; ISBN 978-1-41-294163-1. [Google Scholar]
- Neff, M.W. What research should be done and why? Four competing visions among ecologists. Front. Ecol. Environ. 2011, 9, 462–469. [Google Scholar] [CrossRef]
- Ministry of Housing and Urban-Rural Development of the People’s Republic of China. Urban land Classification and Land Use Standards for Planning and Construction; China Architecture & Building Press: Beijing, China, 2011; pp. 6–9. [Google Scholar]
- Q Methodology for the Scientific Study of Human Subjectivity. Available online: https://qmethod.org/resources/software/ (accessed on 20 April 2017).
Figure 1.
The factorial design of the Q sample.

Figure 2.
F1 sorting photographs: most liked and most disliked.

Figure 3.
F2 sorting photographs: most liked and most disliked.

Figure 4.
F3 sorting photographs: most liked and most disliked.

Figure 5.
F4 sorting photographs: most liked and most disliked.

Figure 6.
F5 sorting photographs: most liked and most disliked.

Figure 7.
Photographs with common opinions.

Table 1.
Number of Participants.
| Experts | Non-Experts | ||||
|---|---|---|---|---|---|
| 1–4 | Landscape and urban planning designers | 14–20 | General students | 32–33 | Laborers |
| 5–13 | Urban planning students | 27–28 | Staff members | 34–35 | Retired persons |
| 21–26 | Photovoltaic engineers | 29–31 | Politicians | 36 | Housewife |
Table 2.
Attribution of Q sorts to each factor.
| Participants | No. of Participants | |||||
|---|---|---|---|---|---|---|
| F1 | F2 | F3 | F4 | F5 | None | |
| Experts | 1, 3, 4, 8, 22 | 1, 2, 7, 13, 21, 23, 25 | 5, 9, 11 | 12, 24 | 6 | 10, 26 |
| Non-experts | 16, 18, 19, 30, 34, 35 | 28, 29 | 14, 32 | 15 | 17, 36 | 20, 27, 31, 33 |
| Total | 11 | 9 | 5 | 3 | 3 | 6 |
Table 3.
Correlations between factor scores.
| F1 | F2 | F3 | F4 | F5 | |
|---|---|---|---|---|---|
| F1 | 1.0000 | 0.3735 | 0.3803 | −0.1404 | 0.3778 |
| F2 | 0.3735 | 1.0000 | 0.5026 | 0.1042 | 0.0901 |
| F3 | 0.3803 | 0.5026 | 1.0000 | 0.1031 | 0.1854 |
| F4 | −0.1404 | 0.1042 | 0.1031 | 1.0000 | −0.1331 |
| F5 | 0.3778 | 0.0901 | 0.1854 | −0.1331 | 1.0000 |
© 2018 by the authors. Licensee MDPI, Basel, Switzerland. This article is an open access article distributed under the terms and conditions of the Creative Commons Attribution (CC BY) license (http://creativecommons.org/licenses/by/4.0/).
Share and Cite
MDPI and ACS Style
Lu, M.; Lin, A.; Sun, J. The Impact of Photovoltaic Applications on Urban Landscapes Based on Visual Q Methodology. Sustainability 2018, 10, 1051. https://doi.org/10.3390/su10041051
AMA Style
Lu M, Lin A, Sun J. The Impact of Photovoltaic Applications on Urban Landscapes Based on Visual Q Methodology. Sustainability. 2018; 10(4):1051. https://doi.org/10.3390/su10041051
Chicago/Turabian StyleLu, Ming, Alin Lin, and Jiyi Sun. 2018. "The Impact of Photovoltaic Applications on Urban Landscapes Based on Visual Q Methodology" Sustainability 10, no. 4: 1051. https://doi.org/10.3390/su10041051
Note that from the first issue of 2016, this journal uses article numbers instead of page numbers. See further details here.