3.1. Sample Design
This study examined part suppliers participating in the NPP of Apple iPhone and Samsung Galaxy 5 series. The specific data collection method of iPhone part suppliers is first, to collect data based on the supplier list provided in Apple’s annual report [
37], and secured data based on the vendor list publicly announced by Apple [
38]. Then, to check the part vendors solely for iPhone, smart phones were disassembled, and vendors were confirmed on sites providing information on the technologies applied to each part [
39].
Next, Samsung Galaxy S part vendors’ data were collected based on the vendor list provided by Samsung’s annual report. Moreover, among Samsung’s vendors, Korean vendors were manually collected primarily in the KINDS (Korean Integrated News Database System). Secondarily, in the DART (Data Analysis, Retrieval and Transfer System), the corresponding companies were checked and confirmed to be the final samples of this research. To limit the vendor check solely to Galaxy 5, smart phones were disassembled, and vendors were confirmed on sites providing information on the technologies applied to each part.
Final samples selected on these criteria were 912 Apple vendors and 574 Samsung vendors, making a total of 1486 [
40]. Specifically, for 10 years from 2007 to 2017, the entire vendors joining the NPP of iPhone were classified according to country as shown in
Table 1. The average number of Apple iPhone vendors is 91 including 30 US firms, 26 Taiwan firms and 27 Japanese firms, showing even distribution excluding 8 South Korean firms providing key parts.
On the other hand, for 7 years from 2010 to 2016, Galaxy S vendors were classified according to country as in
Table 2. Due to the parent subsidiary model of Samsung, among the average number of 82 firms, 64 were Korean firms, showing intensive concentration on Korean firms (14 KOSPI firms, 50 KOSDAQ firms).
This study identified stock prices of vendors and event day based on the following criteria; First, concerning daily closing price, since there could be a discrepancy between the post-ex-rights present stock price and pre-ex-rights stock price because of market factors such as rights issue/bonus issue, dividend and stock split; adjusted stock price was employed to maintain stock price continuity. Second, concerning Apple’s iPhone, based on the new product announcement days of WWDC (2007–2010) and separate Apple Event-Keynote (2011–2016), each corresponding country’s (US, Taiwan, Japan, South Korea) time difference was applied to adjust event days. Third, for Samsung Galaxy S, the event day was adjusted by applying the corresponding country’s (US, Taiwan, Japan, South Korea) time difference based on the new product announcement day of yearly-held MWC (2010–2016). Forth, generally if these relevant events were not stock trading day, they were excluded from the study samples. Fifth, based on the event day, if additional data were less than the estimated period, they were excluded from the study samples.
Event day was defined as the new product announcement day of iPhone and Galaxy S, respectively by Apple and Samsung. iPhone was classified from 2007 to 2016 as in
Table 3 based on the day announced in WWDC (Worldwide Developers Conference) and Keynote. Galaxy S, from 2010 to 2016, was classified as in
Table 4 based on the day announced in The International Consumer Electronics Show (CES), MWC (Mobile World Congress), and International Funkausstellung (IFA). Specifically, iPhone 2G was first announced on 9 January 2007 then launched on 29 June. iPhone 3G, iPhone 3GS and iPhone 4 were announced in June and iPhone 4S, in October; then they were released in about 10 days from announcement. From iPhone 5 to iPhone 7, after they were announced in September then repeatedly launched in October in about 10 days on average.
Galaxy S1 was first announced on 23 March 2010, then launched on 24 June. Galaxy S2 was announced on 13 February 2011, then launched on 29 April. Galaxy S3 was announced on 3 May 2012, then launched on 25 June. Galaxy S4 was announced on 14 March 2013, then, launched on 29 April. Galaxy S5 was announced on 24 February 2014, then launched on 27 March. Galaxy S6 was announced on 1 March, then, launched on 10 April. Galaxy S7 was announced on 21 February, then launched on 11 March repeatedly each year.
The additional data and financial data necessary for this study were collected in the following method; Frist, the stock price and financial data of US, Japanese, and Taiwanese firms were collected from Osiris DB [
41]. Korean companies’ financial data were collected from the KIS-VALUE.
According to Gartner, an academic investigation company in the IT field, Apple maintained No. 1 position in supply chain management (hereinafter, SCM) for 10 years from 2007 to 2016. The reason is that Apple seeks to build a value-oriented SCM containing design and contents, instead of the existing efficiency-centered one. As such, Apple focuses its core competences on high value-added areas such as iPhone design, marketing and SW while outsourcing all the other procedures from parts to final assembly. Thanks to this outsourcing production strategy, Apple discovers top-notch new companies in each part area and let them join its new product development every year. By launching single models, in particular, Apple can efficiently manage SCM while guaranteeing a huge quantity for vendors to maximize synergistic effect.
On the other hand, Samsung internalized key smart phone parts provision or vertically integrated affiliated firms or smaller vendors. This vertical integration strategy helps reinforce the purchasing power for raw materials, enhancing cost competitiveness and minimize development period to enable prompt response to market change. It also allows more effective control over information security including product development and price. Its full line-up strategy, in particular, that increases market share by launching diversified derived models for each price range from low to high, as well as each country and telecommunication company helps offer expanded choices for consumers as similar same-branded products are sold at lower prices.
As explained above, Apple, the front runner in the smart phone market, focuses on consumer value; and Samsung, a second mover, on technology efficiency in selecting their own partners respectively. Based on the criteria, Apple and Samsung’s vendors were classified into new partner, old partner, and revocation partner (see
Table 5 and
Table 6).
Table 5 exhibits the numbers of new or revocation Apple iPhone partners. Starting from the initial 76 partners selected in 2007; 75 in 2008; 83 in 2009; 74 in 2010; 90 in 2011; 80 in 2012; 100 in 2013; 90 in 2014; 99 in 2015; and 95 in 2016 partners were selected to make the total 862. Many of them are consecutive partners so the numbers of new partners and old partners were separately identified in each year. Consecutively, during the sample period, 157 companies were new partners and 755, old partners. On the other hand, 50 companies were revocation partners who lost their partnership in the previous year.
Table 6 exhibits the numbers of new or revocation Samsung Galaxy S partners. Starting from the initial 69 partners selected in 2010; 70 in 2011; 72 in 2012; 80 in 2013; 82 in 2014; 80 in 2015; and 74 in 2016 partners were selected to make the total 527. Many of them are consecutive partners so the numbers of new partners and old partners were separately identified in each year. Consecutively, during the sample period, 137 companies were new partners and 437, old partners. On the other hand, 47 companies were revocation partners who lost their partnership in the previous year.
3.2. Measures and Data Analysis
3.2.1. Overview of Data Analysis
This study aims to analyze the signal effect between partner volatility and firm value in in rapidly changing technical advances. To analyze the relationship in highly intensified business environment, we cased both Apple and Samsung which have bisected the premium smart phone market, examining part suppliers participating in the NPP of Apple iPhone and Samsung Galaxy 5 series.
Data analysis procedures are as follow: first, to analyze the effect of a specific event on firm value, this study identified stock prices of vendors and event day, and event day was defined as the new product announcement day of iPhone and Galaxy S, respectively by Apple and Samsung. Details for the event study are described in the following
Section 3.2.3. Second, to analyze the effect of company innovative capacity and slack resources on excess return, this study classified partner type into new partners, old partners, and revocation partners for cross-sectional regression analysis. In addition, Apple and Samsung’s NPP joining vendors were classified into new partners and revocation partners to establish a study model to test the multiple effects of innovative capacity. Details for the analysis are presented in the following section.
3.2.2. Event Study
Event study methodology is an empirical method analyzing the effect of a specific event on firm value. It is an appropriate method to extract the effect of a specific event of an individual company on the overall stock market fluctuation. An important aspect of event study method is to set an event day, estimate excess return and set a period.
To estimate and test excess return, this study implemented event study using market model. First, the estimation period to estimate excess return was based on daily stock price data from day (−170) to day (−6) and the regression coefficient
of individual company stock
was estimated according to OLS in Equation (1). Event day was set as the period from day −5 to day +5. During this period, change in abnormal return was investigated. The 5-day pre-event period was excluded from the estimation to rule out the effect of NPP from individual stock price estimation [
42]. It is likely that, if event day is accurate and there is no previous information leakage, stock market response on a specific event is observed on day −1 and 0 [
43].
Here,
represents individual company
i’s return on day
t;
, market portfolio return on day
t;
, unique risk of individual company
i;
, change in individual company
i’s return according to change in the whole market;
, individual company
i’s error term on day
t, explaining change in a specific firm’s return that cannot explain market-wide change. It is assumed as
. Market portfolio return
employed here is the corresponding stock exchange’s composite stock price index. The parameter of Equation (1) was estimated using regression analysis. Then, individual company
i’s excess return at the point
t is calculated as follows;
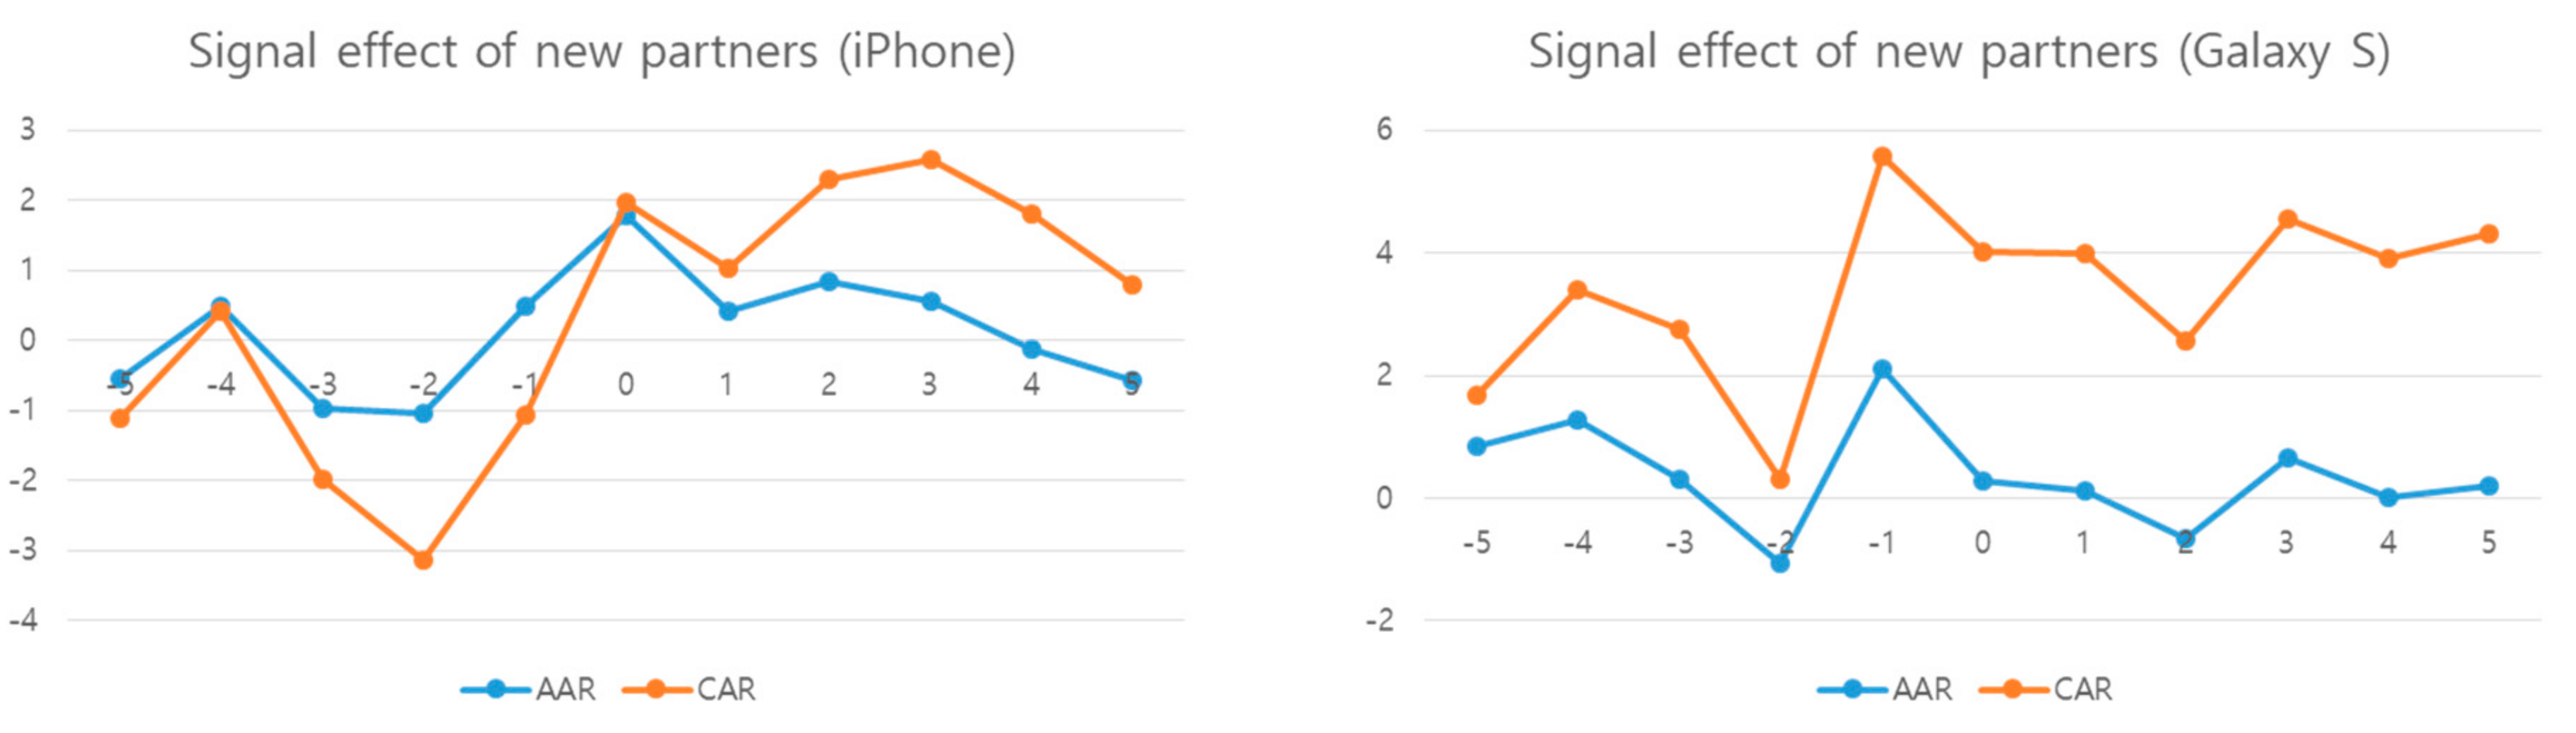
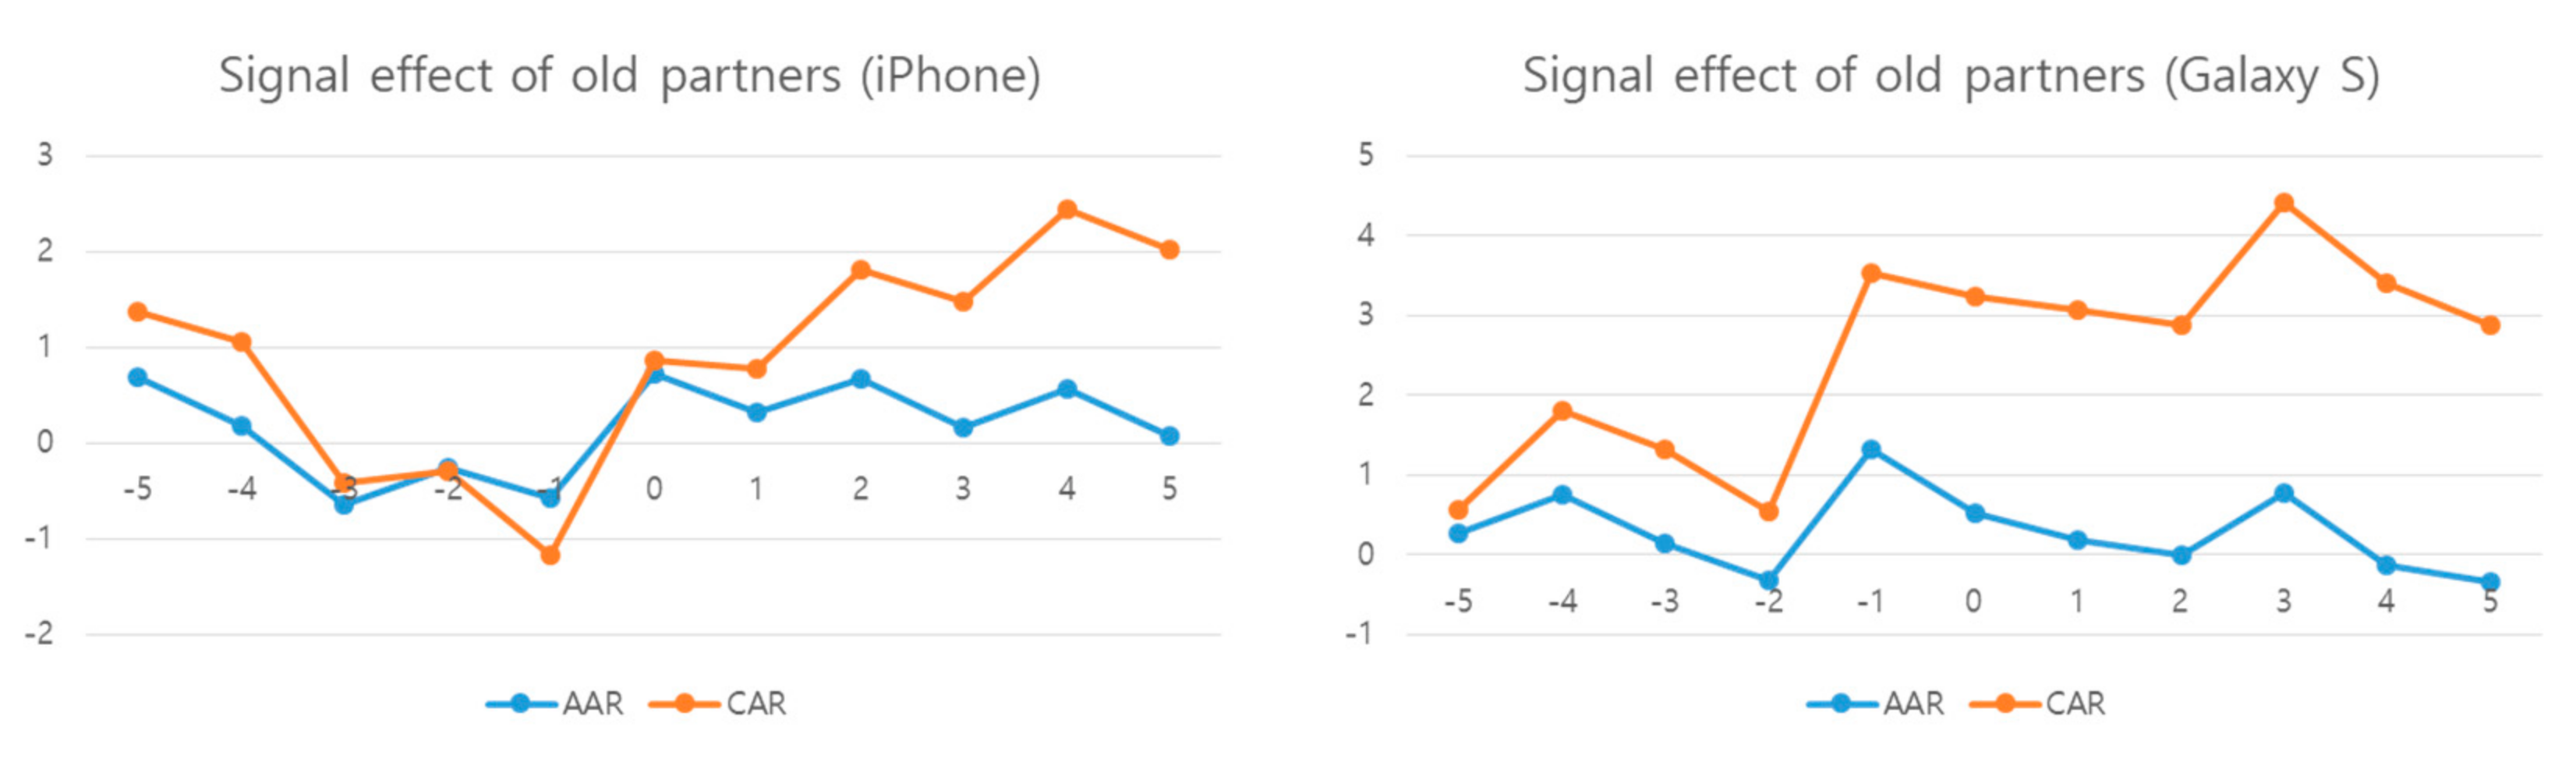
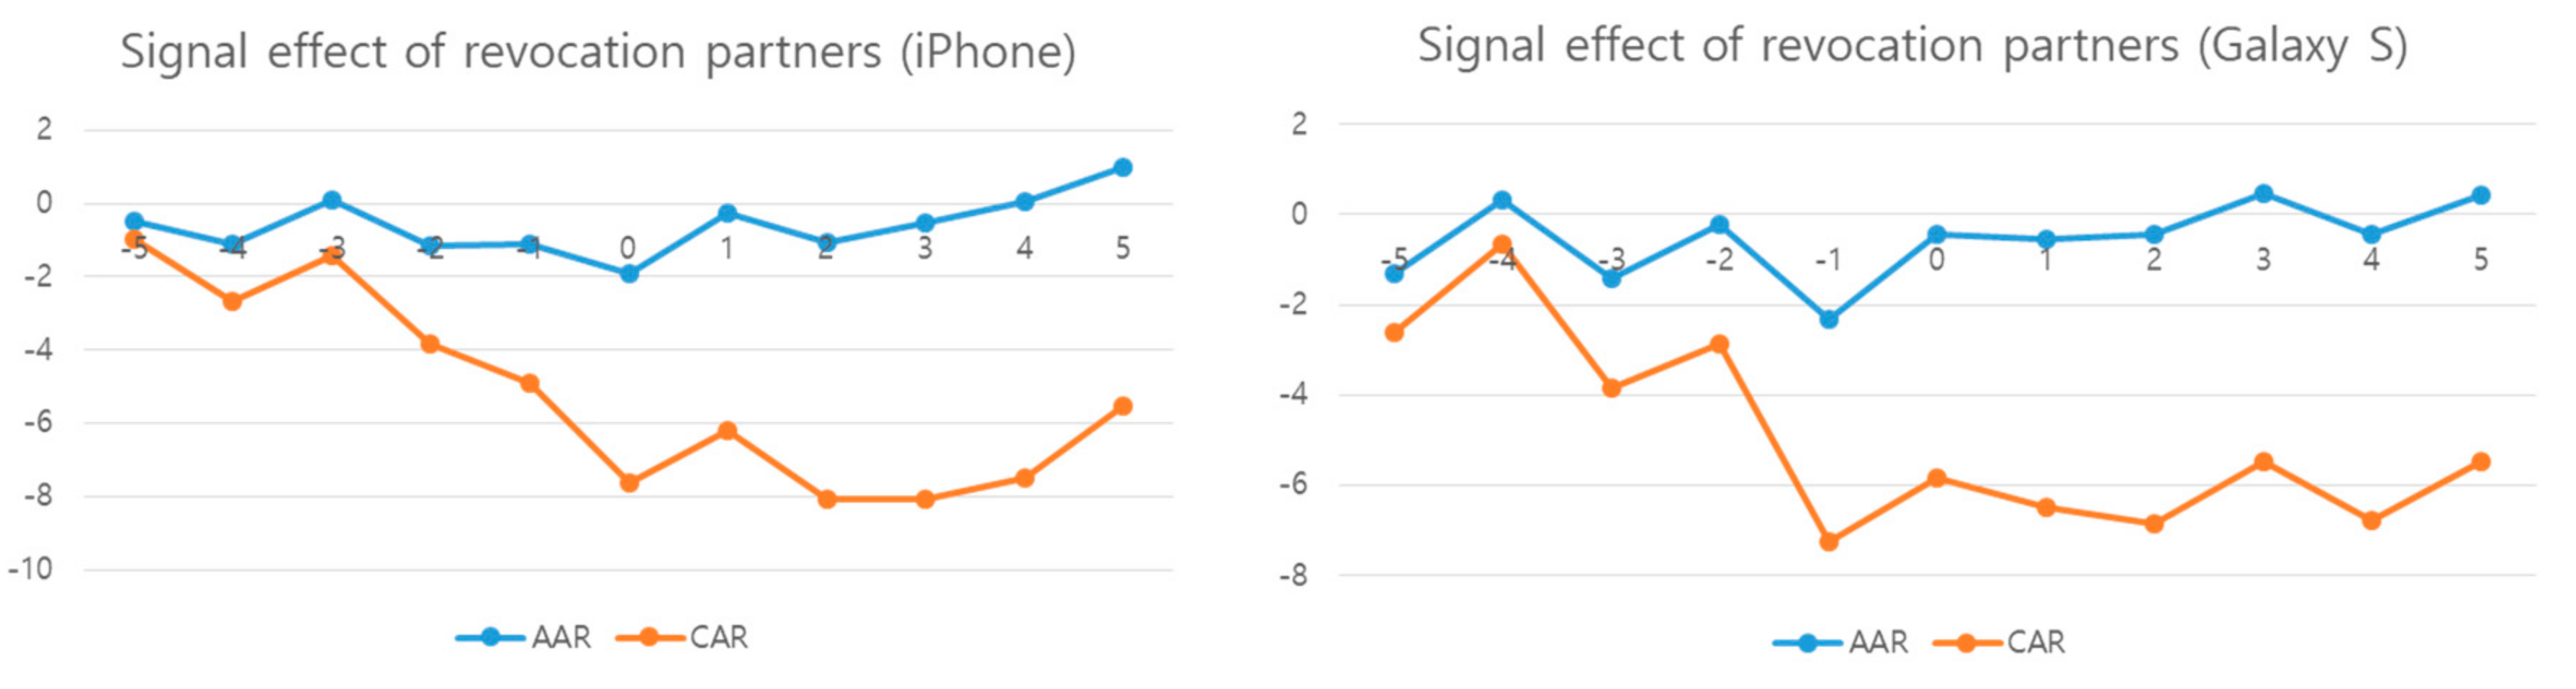
Here, is excess return of individual company i on day t; , cumulative average excess return during the event period from to (CAR). The average excess return (AAR) means the average value of excess return calculated in each sample. The cumulative average excess return refers to the cumulative value of average excess return during the (−5, 5) period.
This study employed the method by Brown and Warner [
44], which assumed the independence of statistical significance of
and
during the derived event period as in Equation (5);
3.2.3. Regression Analysis
This study employs event study to estimate and test excess return to identify differentiated market response by separating Apple and Samsung NPP participating companies in the smart phone industry according to their partner volatility. In addition, to analyze the effect of company innovative capacity and slack resources on excess return, their partners were classified into new partners, old partners and revocation partners for cross-sectional regression analysis as in the model below; Generally, the variables included in the regression analysis are standardized by being divided by total asset to control the heterogeneousness of size effect [
26].
Revocation partner model:
Here, NP_AR = new partner’s excess return on NPP day, OP_AR = old partner’s excess return on NPP day, RP_AR = revocation partner’s excess return on NPP day, IC = independent variable having the innovative capacity value of R&D expenditure divided by total asset, SLACK = independent variable having the slack resource value of retained earning divided by total asset, SIZE = control variable having the company size value of log value of total asset, LEV = control variable having the debt ratio value of total debt divided by total asset, and PPE = control value having the tangible asset ratio value of tangible asset divided by total asset.
Dependent variables are excess return (NP_AR, OP_AR, RP_AR) at the NPP point. Independent variables are the variables expected to influence NPP partner selection–innovative capacity (IC), and slack resource (SLACK). Control variables are the corporate characteristics variables of company size (SIZE), debt ratio (LEV), and tangible asset ratio (PPE). To control the heterogeneousness of size effect due to the gap in total asset in general, the R&D expenditure was divided by total asset.
Independent variables are innovative capacity and slack resource. Companies utilize both subjective and objective methods to assess their innovative capacity [
45]. Preceding studies diversely measure the proxy of innovative capacity. Specifically, the number of patents [
46], variable dividing R&D personnel by total personnel [
47], and R&D intensity which divides R&D expenditure by total asset are most frequently utilized. Eberhart et al. [
48] said that R&D expenditure was indispensable for company competitive edge such as new product development and innovation. R&D expenditure is the long-term accumulation of company knowledge and capacity to release a new product, influencing company competitiveness and company performance positively [
5]. In this sense, this present study utilizes R&D expenditure as an indication of core competence.
Slack resource is measured diversely in both financial and non-financial methods [
49]. Of them the financial methods of slack resource measurement include cash and cashable assets [
27], current ratio [
50], quick ratio [
29], ratio of working capital to sales turnover [
51], and retained earnings [
32]. Dechow et al. [
52] contended that retained earnings exceeding normal quick ratio increases company market value. In this sense, the present study employed retained earnings as an indication of slack resource.
Control variables are company size, debt ratio, and tangible asset ratio. Company size is the natural log value of total asset. The larger the size of a partner company, the higher the performance it has in terms of innovation and growth. The smaller the company is and the fewer the company experiences are in the relevant area, its partnership with a larger company works as a higher performance factor. The reason is that a partnership with a highly reputed company has a free ride effect representing a partner company’s performance. A low debt ratio may cause a company to lose profit generation opportunities. The higher the tangible asset ratio, the more positive the effect on firm value is.


