Article

Evaluating Tourist Destination Performance: Expanding the Sustainability Concept

College of Tourism, Hunan Normal University, Changsha 410081, China
Sustainability 2018, 10(2), 516; https://doi.org/10.3390/su10020516
Submission received: 18 January 2018 / Revised: 3 February 2018 / Accepted: 12 February 2018 / Published: 14 February 2018
(This article belongs to the Section Economic and Business Aspects of Sustainability)

Abstract

:
Performance evaluations are a critical tool in promoting the sustainability of tourist destinations. The literature shows a lack of consensus on basic terminology and definitions of destination performance. While research focuses on business efficiency, areas such as development effectiveness, social equality, and environmental integrity are still not well understood, even though these are salient elements of sustainable development. This paper provides a framework for evaluating destination performance under the 4E rubric of economy, efficiency, effectiveness, and environmental quality, which reflects a more holistic and effective destination performance. The information entropy weight method and a multi-factor comprehensive evaluation model are developed and applied to an international destination, Zhangjiajie, China, which was selected as a case study to test the framework developed. Results show that the economy, efficiency, effectiveness, and environmental quality aspects should be considered when evaluating tourism development performance. The empirical analysis shows that based on these criteria, Zhangjiajie’s destination performance improved measurably during the test period from 2005 to 2009. The results indicate that significant events, natural disasters, and financial crises influence performance most.

1. Introduction

Tourism has grown quickly over the last few decades, providing an economic boom for many regions. With competition between destinations rising sharply, evaluating destination performance has become a crucial topic in destination management [1,2,3]. To understand better how to improve a destination’s competitive advantage, scholars have undertaken destination competitiveness studies [3,4], with competitiveness being related, but not equal to, destination performance. Most competitiveness studies emphasize simple economic variables [1,2,5,6]; few have considered environmental quality (ecological or social value) in value-added considerations, even though these are clearly an important part of sustainable destination development. The economic benefits of tourism are obvious, and have long received priority attention from governments and the industry. Consequently, performance evaluations in destination management have often been substituted with simple economic indicators in marketing-oriented development models. These indicators, such as revenue, foreign exchange earnings, inbound international arrivals, domestic tourism income, and numbers of domestic stays, are frequently used in destination performance evaluations. A direct consequence of this has been a simplistic and one-sided understanding of real destination performance, which is not conducive to deeper systematic analyses or true indicators of holistic and sustainable performance.
In light of this situation, this paper develops an analytic formula that extends traditional measures of performance to include critical measures of sustainability, including environmental and social benefits, in destination performance assessments. It uses other factors besides those related to competitiveness that are commonly written about in tourism studies. Further, the paper uses this 4E framework to analyze tourist destination performance (TDP) and its most influential factors. The model is then applied to Zhangjiajie, China, to test the evaluation framework and index system, and measure the performance of this destination in the test period from 2005 to 2009.

2. Literature Review

Although it is difficult to define the concept of “performance” and the different ways to measure it [7], competitiveness and economic efficiency alone cannot define performance [8]. Tourist destination performance (TDP) should be a more comprehensive concept, referring not only to economic growth and production, but also the maturity of tourism market development, efficiency, improvement of quality, and social and environmental improvements through tourism. This understanding derives from sustainable development research.
Sustainable development has become a hot topic in development research since the late 1980s [9], which has also been discussed in tourism research. The problem of negative environmental impact in destination is a trigger to take sustainable development as a guideline to tourism development. However, what is sustainability of tourism development still has been debated in different voices [9,10,11,12,13], and several scholars have tried to explore the differences between sustainability, sustainable tourism, and sustainable development, to make the definition of sustainable tourism clearer [10,14]. Saarinen (2006) indicates that there are three traditions in different understandings, which are referred to as resource-, activity-, and community-based sustainability [15]. Although it is hard to reach an agreement in definition, as a guideline, the solution and philosophy for addressing the problems of negative impacts and maintaining its long-term viability have been confirmed internationally. Sustainable tourism development is also being regarded as a solution to protect the environmental resources, respect the local culture and social development, and ensure long-term economic gain at an international level [16]. Sustainable tourism development has been applied in destination management research in recent years, especially in nature-based tourism destination [17,18,19,20]. Nature-based tourism incorporates the enjoyment of wildlife or undeveloped natural areas. Due to tourists’ need for natural experience and the essence of nature-based tourism, improving the sustainability is of crucial importance to destination management. Accordingly, studies on approaches to promote sustainability and how to evaluate sustainability have become more and more obvious in nature-based destination management [17,18,19,20]. Eco-efficiency of land use and tourists’ perception of environment value and responsible behavior are regarded as important factors to promote destination sustainability [17,18]. Furthermore, a composite evaluation index is a necessary construction to monitor the development state [17,21]. Some scholar takes the sustainability as the main factor of destination competitiveness [22]. The research of sustainable tourism development has provided some implications to the study of destination performance.
The concept of sustainable tourism maintains that tourism development should not focus only on the speed, scale, and economic output of tourism, but also on its greater public good, such as environmental protection and social development [23,24]. This is referred to as the “triple bottom line” approach to sustainable tourism [25,26,27], which views destination success as being far beyond solely economic measures. In addition to ongoing attention to the results of balance, there should be more focus on the process of coordination and community development. In recent years, how tourism destinations should perform, and how TDP should be evaluated objectively, have become deeply contemplated questions throughout the world. The scientific evaluation of TDP favors a comprehensive mastery of development performance indicators, correcting deviations from traditional performance, strengthening industry management, avoiding blind promotion and inefficient development, protecting natural and cultural resources, improving management efficiency, achieving social equity, and ultimately, promoting sustainable tourism development [28].

2.1. Tourist Destination Performance

Most tourism performance studies focus on the hotel sector [29,30,31,32,33,34,35], largely ignoring the interdependent nature of tourism [36]. Yidirim (2006) offers a tourism value chain performance measurement framework to understand the different sectors of tourism [35]. Kozak (2002) measured destination performance by comparing Spain and Turkey, and was one of the first to use the term “destination performance” [36]. Today, research on TDP has increased substantially, and is especially rich in the following areas: tourism enterprises [31,32,33,34,37,38,39,40], hotels industry [29,30,31,32,33,34], partnerships [41], research performance in tourism and hospitality [42], marketing [43,44], environmental performance in the lodging sector [45,46,47], public transport destination satisfaction [48,49], assessing destination performance [50,51,52,53,54], sustainable performance indicators of tourism development policies [55], website information, and destination brand quality [56]. These studies illustrate the diversity of performance research. However, investigations of TDP and its evaluation indices more broadly, have not been done in depth. More attention has been paid to economic indicators in service production, while the use of quantitative tools, such as data envelopment analysis (DEA) [51], a Bayesian approach [50], and mean-variance space [53], which provide only economic efficiency evaluations of destination performance, while ignoring the crucial elements of social development and environmental improvement.

Conceptual Foundations of Destination Performance

Although the concept of performance has been discussed in management studies since the early 1980s, there is no agreement about its basic definition. Effectiveness seems to be the best expression of performance in organizational and strategic management [57]. While prescriptions for improving and managing TDP are widely available, the academic community has been preoccupied with discussions and debates about issues of definition [49,50,51,52,53]. Most studies use production efficiency as a proxy meaning for performance by equating the destination with a firm for the purpose of measuring competitiveness [51,58]. However, production efficiency is just one aspect of performance in market competition, and derives from an economic development perspective. Research on TDP in this way is, therefore, incomplete. TDP analyses should not only consider business management or customer demands. Destination development no longer refers only to industrial or economic growth. Instead, the contribution of tourism development to added public value and social capital has become increasingly important in mitigating conflicts between residents and tourists.
Thus, TDP assessments would benefit by adopting more from a public administration perspective on performance. This is reflected in Hatry’s (1999) study, where performance is defined in terms of the outcomes and outputs that follow from a public production process [59]. Outcomes are the result of activities that convert inputs to outputs, which reflects the characteristics of process in performance measurement. In Chinese, performance, which is also regarded as accomplishment, work efficiency, and achievement, reflects the accomplishments of organizations or individuals engaging in certain activities. Different actors define performance differently, without invalidating its conceptual definition in term of output and outcome [60].
According to the performance literature, there are three main areas of public administration management. The first is behavioral performance [61], which refers to the observed action or behavior related to organizational goals. The second is results performance, which emphasizes the record of achievement or outcome of work or other activity [62]. Finally, integrated performance [63] indicates that both behavior processes and activity outcomes should be measured. The latter is generally most recognized [64], but both provide a way of understanding TDP.
From the perspective of public administration, this paper regards tourism destinations as a public commodity with public value. Destination development is a results-oriented, continuous implementation process. Thus, tourism performance evaluation ought to pay increasing attention to the results of development, focusing on the development process and considering the relationship of input–output ratios, and costs and benefits. A comprehensive and objective performance evaluation should consider both inputs and outputs. It should focus not only on quantifiable economic growth and improving industrial efficiency, but also recognize the importance of the effectiveness of investments, enhancing social benefits and environmental protection [4,65]. As well, destination performance should not be confined only to tourism, but should also focus on public programs that benefit residents and community development more generally. As the general definition of performance as outputs and outcomes of public services does not show what these outputs and outcomes should be [66], this paper defines TDP as the contribution of the economic, industrial, social, and environmental aspects generated by tourism activities and processes within a destination during a certain period of time, including economic growth, improved industrial productivity, environmental protection, and the enhancement of social justice.

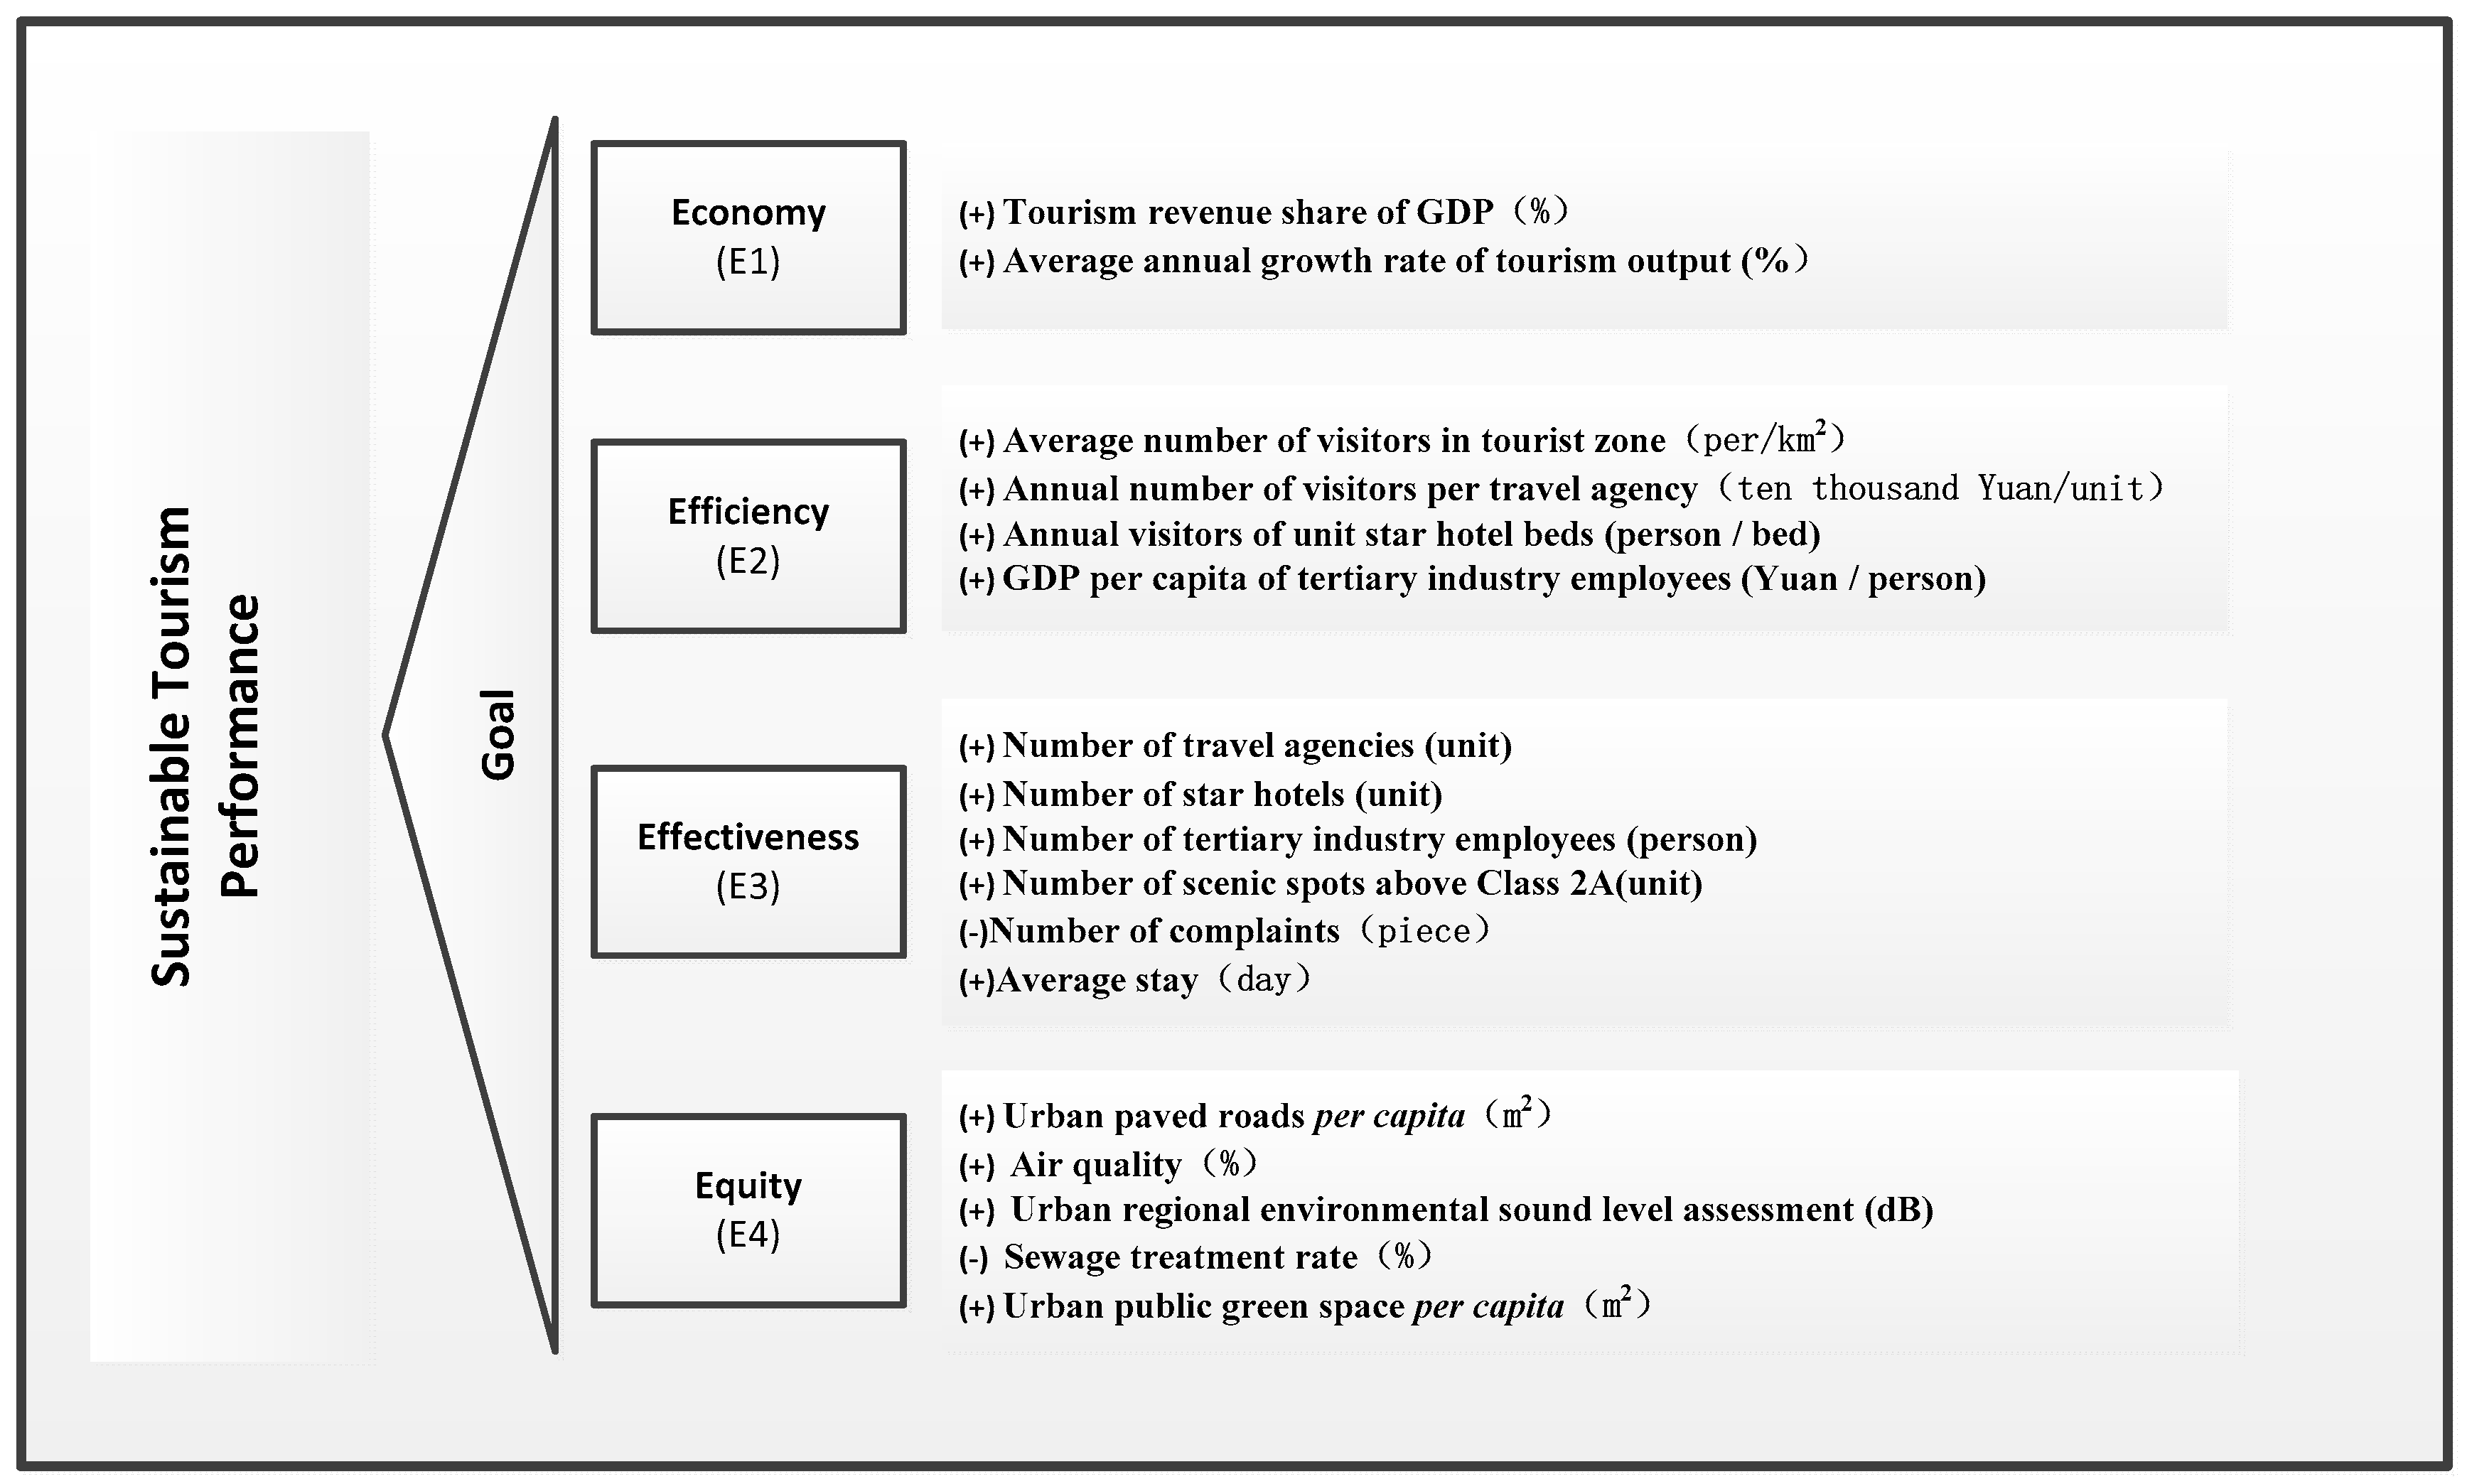
2.2. Constructing the TDP Evaluation Framework

Different from the typical management of private firms, TDP should be more holistic and comprehensive in its approach from the perspective of sustainability. In the academic literature, TDP is often found in the work associated with competitiveness and indices of success. Most studies and early models of destination success and competitiveness focused on economic outputs, and many in contemporary research continue to focus overwhelmingly on economic indicators. Since the turn of the new millennium, however, many scholars have begun including other factors of success that are geared more toward the principles of sustainability. Dwyer, Livaic, and Mellor (2003) developed a model of destination competitiveness based on certain elements of supply and demand [67]. What makes a destination competitive, according to their model, are the destination’s inherited resources (natural and cultural), created resources (shopping, recreational opportunities, and events), and supporting factors and resources, which include infrastructure, service quality, accessibility, and connections to the market. Destination success is also determined by situational conditions (e.g., political stability, laws, policies, technology, security, etc.), destination management (e.g., destination management organizations, destination marketing plans, human resource management, environmental management, etc.), and demand conditions (e.g., visitors’ awareness, perceptions, and preferences) [67]. Hassan (2000) took destination success a step further and developed a framework that emphasized more the destination environment as a critical factor of destination competitiveness [68], this being determined by the destination’s commitment to the principles of sustainability. Ritchie and Crouch’s (2003) now well-known model of destination competitiveness embraces sustainability wholeheartedly [69], encompassing comparative advantages of places as regards their endowments/resources, and how those are deployed. In their model, this is couched within the broad global macro-environment, as well as the local tourism micro-environment, where they suggest the best chances and most achievable factors of success can be found, implemented, and measured in the micro-environmental elements of the destination.
According to the definition and review outlined above, the pursuit of tourism development should focus more on environmental and social harmony—critical factors of sustainability. It is therefore important to construct suitable evaluation frameworks carefully. Within the public management literature as noted earlier in the paper, economy, efficiency, and effectiveness (the 3 Es) have been generally discussed and accepted for measuring performance, notwithstanding the more recent tourism-specific efforts to measure destination competitiveness and success. Economy refers to the minimum degree of input cost or economic growth; efficiency refers to the ratio of input and output; and effectiveness stands for the contribution of output to achieve organizational goals. A fourth E, however, has been identified as being another critical element of understanding performance from an “equity” perspective that includes progress in human social development and environmental sustainability, which have been emphasized more in recent years [65,68,69,70]. All of these fit the definition of tourism destination performance very well.
In light of these issues, and based on a thorough review of the extant literature, this article develops a mathematical formula-based 4E evaluation framework to measure TDP, that is unlike the competitiveness models noted earlier, but with some common elements. Compared to the traditional economics-oriented evaluation system, the 4E model considers efficiency (production process) and effectiveness (the results), as well as environmental equity (social and ecological environments). Therefore, it is key in evaluating the real performance of destination development comprehensively, and scientifically better than the single dimension of economics.
According to the 4E framework presented here, and the connotation of performance, the fundamental principles of selecting the evaluation indicator of TDP are as follows:
(1)
Economy refers to the extent of tourism’s contribution to regional economic development, mainly through fiscal growth. Based on the literature, tourism’s share of GDP and the average annual growth rate of tourism output were selected as main indicators.
(2)
Efficiency refers to the ratio between the inputs and outputs of tourism development [71,72]. Considering the main stakeholders of tourism supply, such as travel agencies, hotels, and employees, this article builds an efficiency evaluation index based upon input and output. On the input side, the traditional investment indicators, namely financial, material, and human resources, according to the degree of association between the elements and tourism development—the performance input index of tourism development will be determined as the number of tourist attractions, travel agencies, hotels, and employees in the tertiary industrial sector [51]. On the output side, tourism revenue and number of visitors are used as the most important measurement indexes. Thus, combining the four input elements (i.e., the numbers of tourist attractions, travel agencies, hotels, and employees) with the two output elements (i.e., tourism revenue and the number of visitors), the following efficiency indexes were derived: the average number of visitors in a tourist zone, the annual number of visitors per travel agency, the annual number of guests per hotel, and the annual per capita output of tertiary industry employees (the annual tourism revenue divided by annual numbers of tourism practitioners).
(3)
Effectiveness is a quality dimension that primarily measures the outcomes achieved in relation to destination development goals [71], namely performance results, which also means the outcomes result from tourism development, directly. This is reflected in the TDP evaluation as the quality of the tourist experience, and the efficiency of the industry’s scale of growth. The principal indicators selected are the number of travel agencies, the number of star hotels that are certificated by an authorized organization, the number of attractions, the number of complaints, and the average length of stay.
(4)
Equity (social and ecological) refers to the public welfare that tourism brings to destination communities, and measures whether residents benefit from tourism development [70,71,73], as reflected in public facilities and services, ecological quality, and other aspects. This study does not treat environment as a single dimension of performance, which does not suggest that it is unimportant. In fact, environmental performance is becoming increasingly important in destination development [74], which can be translated into a competitive advantage for a destination. To represent this category, the following five indicators were selected for the purposes of this study: number of employees, developed infrastructure as measured by per capita extent of urban paved roads, air quality, the auditory environment or lack of sound pollution, sewage treatment levels, and per capita urban green space.
In summary, the evaluation framework and index system of TDP are shown in Figure 1.

3. Methods

To achieve the aims and objectives of this study, information entropy weight and weighted comprehensive evaluation were applied.

3.1. Data Normalization and Index Weigh

3.1.1. Data Standardization

To eliminate the differences between evaluation unit and dimension, and to improve data comparability, indicator data were normalized with the range standardized method. Since the constructed 4-E evaluation system has positive and negative indicators, it is, therefore, calculated as follows [75,76]:
{ X ' i j = X i j X min X max X min ( 1 a ) X ' i j = X max X i j X max X min ( 1 b ) i = 1 , 2 , ... m ; j = 1 , 2 , ... n ;
X ' i j is the standardized value of the j-th evaluation index of the i-th evaluation object; X i j is the pre-treatment value of index j; X max is the j-th maximum value for the pre-treatment evaluation of the i-th evaluation object, X min is the j-th minimum value for the pre-treatment evaluation of the i-th evaluation object. For positive indicators (mainly relevant to Formula (1a)), the greater the value, the better the index. For negative indicators (mainly relevant to Formula (1b)), the lower the value, the better the indicators.

3.1.2. Index Weight Calculated by Information Entropy Weight (IEW)

The information entropy weight (IEW) method is one of the two types of weight calculation methods, and is based on statistical properties and measurement data. It is referred to as the objective weight [1]. In this paper, the information entropy weight is calculated primarily as follows [75,76]:
calculating p i j , namely the index value weight of the i-th evaluated object among the j-th evaluation index
p i j = X ' i j i = 1 m X ' i j
X ' i j is the standardized value of the j-th evaluation index of the i-th evaluation object.
calculating the entropy of the i-th evaluation index
h j = 1 ln m i = 1 m p i j ln p i j
h j is the entropy, when 0 ≤ h j ≤ 1, p i j = 0, p i j ln p i j = 0.
calculating the coefficient of variation of the j-th evaluation index.
For the j-th index, the smaller the h j , the greater the variability index value; the larger the h j , the smaller the degree of variation. The variation coefficient is
g j = 1 h j
calculating the weight of the j-th index.
w j = g j i = 1 n g j
when 0 ≤ w j ≤ 1, i = 1 n w j = 1 .
According to the above formulae, the index weights can be obtained; the specific results are shown in Table 1.

3.2. Constructing the Evaluation Method

After determining the evaluation criteria for each individual index through weighted comprehensive evaluation, this paper constructs its tourism development performance evaluation model specifically as follows:
P i = j = 1 n X ' i j W j
Here, X ' i j is the standardized value of the j-th evaluation index of the i-th object, Wj is the weight of the j-th index, and Pi is the comprehensive performance value of the i-th object.

3.3. Establishing the Evaluation Level

According to the comprehensive evaluation value range, the ranking standards of tourism development performance evaluation results were determined. In accordance with the concept of equalization, the qualitative evaluation result was divided into four levels—“excellent”, “good”, “fair”, and “poor”, respectively, in order to distinguish different performance levels and judge the development state. An average law was taken to keep each grade having an equal value range. Thus, we divided the value 0–1 into four equal intervals: 0.76 to 1, 0.51 to 0.75, 0.26 to 0.50, and 0 to 0.25, accordingly, as shown in Table 2.

4. Empirical Test Study

4.1. Study Area

Zhangjiajie is located in northwestern Hunan Province, China. It includes two municipal districts, Yongding and Wulingyuan, and two counties, Cili and Sangzhi, with a total area of 9518 square kilometers and a 2015 population of 1.7 million, comprised largely of the Bai ethnic group and a Tuija minority. Zhangjiajie is one of the most important international nature-based destinations in China. In September 1982, Zhangjiajie became China’s first national forest park. In August 1988, Wulingyuan was included in the second round of national key scenic locales, and in 1992, Wulingyuan was added to UNESCO’s World Heritage List as a natural heritage site. Over the past thirty years, Zhangjiajie has attracted many domestic and foreign tourists with its unique quartz-sandstone peaked landforms, and other natural environmental resources. Since 2005, the number of tourists has shown steady growth, increasing from 14,533,600 visitors in 2005 to 19,284,200 in 2009. In December 2010, Zhangjiajie was identified in the first group of China Tourism Comprehensive Reform Pilot cities, increasing the need for the region to improve its TDP. Zhangjiajie has a tourism-led economy, with the ratio of tourism to GDP reaching 76.10% in 2015 (Figure 2). Because of its strategic position and distinctive destination in regional tourism development in Hunan province and in China, and its requirement to enhance destination management, Zhangjiajie has been chosen as a study case for this research. The period from 2005 to 2009 was selected as the tested timeframe, owing to the unique patterns in its tourism development (see Figure 2).

4.2. Data Sources

This study uses secondary evaluation index data for Zhangjiajie (based on annual figures) during 2005–2009. Data were received from the Zhangjiajie Statistical Information Network about tourism income, GDP, numbers of visitors in the core area (Wulingyuan), number of travel agencies, star hotels, and hotel beds, number of higher than 2A-level scenic attractions, grade of air quality, degree of urban environmental evaluation, and the rate of sewage treatment. Data on the number of employees in the tertiary sector, output value of the services sector, and the per capita coverage of urban roads and public green space derived from the China City Yearbook (2006–2010). Data on the Wulingyuan scenic area were acquired from the China Urban Construction Statistical Yearbook (2006–2010). Finally, information about tourists’ complaints and average lengths of stay were acquired from the staff of the Zhangjiajie Tourism Bureau.

4.3. Data Analysis

By inputting the data in the evaluation model, we were able to identify the performance evaluation results of Zhangjiajie from 2005 to 2009 (Table 3 and Table 4).
Based on the assessment of variables, the overall performance of Zhangjiajie’s tourism development increased annually (aside from the 2008 dip) from 2005′s “poor” rating (performance value 0.1609), up to the 2006, 2007, and 2008 “fair” ratings (performance values were 0.3313, 0.4294, and 0.3629, respectively), while in 2009, the performance value was 0.5857, achieving a “good” measure. The reason for the unanticipated sudden decline in performance in 2008, which can be seen as the point of change in performance, will be examined later. For the specific value of the performance level, the two extreme values appeared in 2005 and 2009. The 2005 performance value (p = 0.1609) was the lowest in the entire study period, while the 2009 performance levels improved significantly (p = 0.5857), becoming the highest value in the entire study period. Comparing the extreme values of performance in 2005 and 2009, the analysis found that Zhangjiajie’s performance improved by nearly 264 percent over the four-year period, indicating remarkable results.

4.4. Influential Factors

Understanding the influential factors of TDP is fundamental for making improvements. From the developmental perspective of tourism performance, the mutation value and the extreme value are extremely critical to overall performance. Therefore, as it will be more representative to analyze the influential factors of performance from those two values, we selected 2005, 2008, and 2009 as samples, because their performance values can be characterized as either mutations or extreme values.

4.4.1. Analyzing the Influential Factors of Changing Performance Value

Evaluating the above results, 2008 was a major point of change in the development of Zhangjiajie’s tourism performance; the main reason for the changes are as follows.
In 2008, Zhangjiajie’s tourism performance declined substantially. This was attributable to a debilitating snowstorm, a powerful earthquake, the Beijing Olympics, the international financial crisis, and other momentous events. The snow disaster and the Wenchuan earthquake had significant impacts on domestic tourism. With an overarching sense of national mourning and a major focus on relief efforts, the Chinese national travel psyche was affected, and both domestic and inbound tourism declined significantly. Affected by the financial crisis, China’s overall economic situation was poor. The consumer price index remained high, resulting in declining consumer spending, and tourism spending power and revenues declined. Simultaneously, the Olympics attracted a global gaze focused on Beijing, which relegated Zhangjiajie and other destinations to secondary importance, by diverting much of the market away from these locales to the capital.
Data show that the number of consumers at Zhangjiajie’s attractions, travel agencies, and star hotels, as well as the output of employees in the tertiary industry, declined to different degrees. Therefore, the efficiency index E2 declined (Table 4). During the Olympics, large flows of tourists to Beijing and Hainan resulted in relative reductions in the market share for other provinces. Zhangjiajie’s summer tourist peak did not achieve desired levels. Based on relevant data projections, Zhangjiajie’s tourism revenue to GDP fell from 60.30% in 2007, to 45.38% in 2008; the annual average growth rate of tourism output also dropped from 14.95% to −8.5%, the first negative measure. Overall, therefore, the economic indicators in E1 declined. Meanwhile, a new holiday system was introduced in 2008, which shortened the May Day holiday, leaving only the National Day as a longer holiday period. To some extent, these changes affected the Zhangjiajie tourism market. Thus, the two indexes E1 (economy) and E2 (efficiency) both declined (Table 4), leading to the overall decline in performance of Zhangjiajie’s tourism development.

4.4.2. The Influential Factors of Performance Extreme Value

The results show that 2005 and 2009 provided the extremes in Zhangjiajie’s TDP. In 2005, Zhangjiajie’s tourism performance was low, owing to a decline in the construction of public facilities in the main tourist area, low per capita road surface of only 8.46 square meters, insufficient attention to protecting the environment, and a low air quality rate of 84.9%. Moreover, per capita urban green space was only 3.94 square meters, only half the size of that in 2009, and the sewage treatment rate index was at an especially low level of only 4.6%. In 2006, the Zhangjiajie government proposed eight programs to develop ecological security and ecological tourism. Before this, the negative environmental effects wrought by tourism were not a salient concern in Zhangjiajie. Consequently, the E4 (equity) index was low overall (Table 4). Conversely, hospitality facilities were fewer, the number of employees in tourism was small, there were many problems with tours offered, and travel was generally in a state of disorder, resulting in lower demand and higher numbers of complaints. As a result, both the E2 (efficiency) index and the E3 (effectiveness) index were low (Table 4). Meanwhile, due to the slowing of tourism development, growth was insignificant, there were many problems in tourism development, and tourism-based income was relatively low; the E1 (economy) indicators in Zhangjiajie’s tourism performance were low in general (Table 4).
In 2009, China’s economy was gradually recovering from the 2008 financial crisis. According to statistics, China’s GDP growth in 2009 was 8.7%. China’s first, second, third, and fourth quarterly GDP growth was 6.2%, 7.9%, 9.1%, and 10.7%, respectively, showing improvements in economic growth. With this national growth, tourism enjoyed good market prospects. During this time, Zhangjiajie planned many marketing programs and events, such as “International Country Music Week” and others. Regarding the internal and external effects, Zhangjiajie’s tourism boomed in 2009; tourism’s proportion of the GDP accounted for 49.34%, with an average annual growth rate of tourism output of 220.01%, compared to 45.83% and −8.5%, respectively, in 2008. Clearly, the value of the economic indexes had risen sharply.
In the same year, the provincial government held meetings with leading tourism industry groups, to study the accelerated development and expansion of the pillar industries in Hunan’s tourism strategy implementation outline, and introduce several tourism support policies. With the government’s support, the development of Zhangjiajie’s tourism flourished. Public facilities and public services increased; the quantity of star hotels, number of employees in the tertiary sector, and the quantity of higher than 2A-level attractions all experienced significant growth compared to the previous year. Likewise, the per capita extent of urban roads, the excellent or good rate of air quality, the rate of sewage treatment, and the spread of per capita public green space also improved. Against the background of steady national economic growth, through a variety of marketing programs and government support, the 4E evaluation indicators reflect the steady growth of Zhangjiajie tourism.

5. Discussion

It should be noted that TDP evaluation and management are becoming increasingly important both in private sector business management and in public administration. It not only concerns competitiveness in marketing, but also relates to the sustainable development of the region. Tourism destination performance research has attracted much attention in recent years. Nevertheless, the basic concept and suitable evaluation frameworks are still not widely discussed within a clear public value orientation. Most researchers pay too much attention to the dimensions of efficiency and economy to enhance the competitiveness of hotels or businesses, while few consider the public value (triple bottom line) in destination performance. We acknowledge that performance is hard to define in totality, and its measurement is a highly dynamic endeavor that involves constant change, uncertainty, ambiguity, and negotiation [77]. However, these difficulties should not hamper efforts to address this meaningful topic in tourist destination management. As part of the growing sustainability paradigm [15,21], sustainable tourism is a major focus in tourism development research. However, existing research shows that sustainability is a complex concept, which requires more comprehensive analysis [10], and the measurement of sustainability is still far behind. Thus, more exploration of measurement on sustainable tourism development needs to be implemented, and this paper is a trial. For the nature-based tourism destination, what attracts tourists most is the enjoyment from the interaction with the natural environment and culture, which makes the concept of sustainability a little bit clearer. To protect the environmental and ecological resource, local culture, improving the quality of development and enhancing the public welfare are necessary objectives in nature-based tourism sustainable management [70,71,73,74]. Tourism destination developers should care not only about the economic value of tourism, but also the public good and the ecological environment. The holistic dimensions of economy, efficiency, effectiveness and environmental quality reflect the public value orientation in assessing TDP. This study helps close this gap by defining tourism destination performance more holistically, with more social and environmental indicators, and constructing an evaluation framework based upon the contents of the extant literature and elements of public administration performance. The influential factors analysis, which is based on the data used in a calculated model, should be carried out to explore the reasons in depth, and provide more suggestions for destination sustainable management.
The case study leaves room for improvement; additional reflection and empirical work remain crucial to the development of this matter. This study aims to provide evidence regarding performance evaluation and management in Zhangjiajie, China, as an emerging tourist destination. To achieve further progress in TDP research, more work is needed by scholars and practitioners in this field.

6. Conclusions

This paper focuses on tourism destination performance from a multi-interface perspective. The study analyzes the concept of tourist destination performance using a 4E evaluation framework, into destination performance management, which includes economic, efficiency, effectiveness, and equity (social and ecological), and emphasizes a higher public value than traditional performance studies. An evaluation index was devised, and an information entropy weight (IEW) analysis was done to evaluate TDP fully and objectively.
To test the model, an empirical assessment was carried out with data from Zhangjiajie, China, with a test period of 2005–2009. The results show that performance values from 2005 to 2009 were 0.1609, 0.3313, 0.4294, 0.3629, and 0.5857, respectively, of which the maximum performance value was 0.5857 in 2009 (a good level), and the minimum performance value was 0.1609 in 2005 (a poor level). Overall, Zhangjiajie’s tourism development performance showed sustained improvement. Secondly, there was a notable upward trend in the performance value of Zhangjiajie’s tourism development from 2005–2009, reflecting good momentum. In 2008, the declining development performance was influenced by natural disasters, financial crises, and other major national and global events. By comparison, the evaluation result was consistent with the actual situation, thereby showing that the proposed method was operational and scientific. Third, analyzing the factors in TDP from the perspective of extreme value and mutation value, referring to the data used in the model, can help recognize the key factors for a given time period, and offer a new framework for analyzing the performance of triple bottom line-based tourism development. The performance value was low in 2005, due to the presence of many problems in the process of tourism development. The performance value declined in 2008, influenced by a devastating snowstorm, major earthquake, the international financial crisis, and the impact of the Olympic Games and other major events. In 2009, however, with national economic growth and the government’s scenic attractions administration having implemented many measures, the development of regional tourism in Zhangjiajie recovered rapidly, demonstrating better performance.
Measuring the performance of tourist destinations is an urgent and meaningful work for sustainable development. In most research on destination management, economic indexes are still used overwhelmingly to evaluate performance and success. Unfortunately, this mainstream approach ignores other important variables, such as the community’s quality of life and environmental quality. Researchers need to shift away from individualism and a strict market-orientation, to emphasis a more holistic and sustainable triple bottom line approach that addresses socioeconomic well-being and environmental quality [26]. This paper moves the destination evaluation measures closer in this direction by developing a 4E measurement framework.
Although the results derived from the performance evaluation framework and method provided here were fairly clear and straightforward, it should be noted that TDP is a complicated concept, and there are many other variables that could be considered to complete the evaluation framework if indexes and data were available. Moreover, another limitation of this study is the use of a single case study. More comparative studies, with other destinations and in an international perspective, should be carried out to test and improve the model provided here, in future research. Clearly, truly sustainable tourism development must consider more than just economics. It must also consider the broader social and ecological environments, in order to be considered successful and to achieve high levels of holistic performance.

Acknowledgments

This work has been supported by Excellent Youth scientific research project of Ministry of Education in Hunan Province (No.15B148),and the Natural Sciences Foundation in Hunan Province (No.2016JJ3087) and, Tourism Youth Expert Training Program of National Tourism Administration (No.TYETP201539),and the National Natural Sciences Foundation of China (No.41301629). The author would like to thank Professor Dallen J. Timothy of Arizona State University for the generous work and constructive suggestion for this paper, PhD Candidate Ambrozio Correa de Queiroz Neto of Griffith University for his good suggestion in the first draft, Associate professor Lihua Jiang of Hunan Normal University for english modification suggestion in the first draft, and Professor Zhangfeng Wang, Master Candidate Yanqing Gong, Bei Meng, ChengZhong of Hunan Normal University for the help of data collection.

Conflicts of Interest

The authors declare no conflict of interest.

References

  1. Dwyer, L.; Forsyth, P.; Rao, P. The price competitiveness of travel and tourism: A comparison of 19 destinations. Tour. Manag. 2000, 21, 9–22. [Google Scholar] [CrossRef]
  2. Dwyer, L.M.N.; Forsyth, P.; Rao, P. International price competitiveness of Australia’s mice industry. Int. J. Tour. Res. 2001, 3, 123–139. [Google Scholar] [CrossRef]
  3. Zhang, H.; Gu, C.-L.; Gu, L.-W.; Zhang, Y. The evaluation of tourism destination competitiveness by topsis & information entropy—A case in the Yangtze river delta of China. Tour. Manag. 2011, 32, 443–451. [Google Scholar]
  4. Mihalič, T. Environmental management of a tourist destination: A factor of tourism competitiveness. Tour. Manag. 2000, 21, 65–78. [Google Scholar] [CrossRef]
  5. Candela, G.A.F.P. The Economics of Tourism Destinations; Springer: Berlin, Germany, 2012. [Google Scholar]
  6. Kayar, Ç.H.; Kozak, N. Measuring destination competitiveness: An application of the travel and tourism competitiveness index (2007). J. Hosp. Market. Manag. 2010, 19, 203–216. [Google Scholar] [CrossRef]
  7. Barros, C.P. Evaluating the efficiency of a small hotel chain with a malmquist productivity index. Int. J. Tour. Res. 2005, 7, 173–184. [Google Scholar] [CrossRef]
  8. Gomezelj, D.O.; Mihalič, T. Destination competitiveness—Applying different models, the case of Slovenia. Tour. Manag. 2008, 29, 294–307. [Google Scholar] [CrossRef]
  9. Liu, Z. Sustainable tourism development: A critique. J Sustain. Tour. 2003, 11, 459–475. [Google Scholar] [CrossRef] [Green Version]
  10. Butler, R.W. Sustainable tourism: A state-of-the-art review. Tour. Geogr. 1999, 1, 7–25. [Google Scholar] [CrossRef]
  11. Hardy, A.; Beeton, R.J.S.; Pearson, L. Sustainable tourism: An overview of the concept and its position in relation to conceptualisations of tourism. J. Sustain. Tour. 2002, 10, 475–496. [Google Scholar] [CrossRef]
  12. Bramwell, B.; Lane, B. Interpretation and sustainable tourism: The potential and the pitfalls. J. Sustain. Tour. 1993, 1, 71–80. [Google Scholar] [CrossRef]
  13. Wan, Y.K.P.; Li, X. Sustainability of tourism development in Macao, China. Int. J. Tour. Res. 2004, 15, 52–56. [Google Scholar] [CrossRef]
  14. Harris, R.A.L.N. Sustainable Tourism: An Australian Perspective; Butterworth-Heinemann: Oxford, UK, 1995. [Google Scholar]
  15. Saarinen, J. Traditions of sustainability in tourism studies. Ann. Tourism. Res. 2006, 33, 1121–1140. [Google Scholar] [CrossRef]
  16. Lozano-Oyola, M.; Blancas, F.J.; González, M.; Caballero, R. Sustainable tourism indicators as planning tools in cultural destinations. Ecol. Indic. 2012, 18, 659–675. [Google Scholar] [CrossRef]
  17. Pérez, V.; Guerrero, F.; González, M.; Pérez, F.; Caballero, R. Composite indicator for the assessment of sustainability: The case of Cuban nature-based tourism destinations. Ecol. Indic. 2013, 29, 316–324. [Google Scholar] [CrossRef]
  18. Tyrväinen, L.; Uusitalo, M.; Silvennoinen, H.; Hasu, E. Towards sustainable growth in nature-based tourism destinations: Clients’ views of land use options in Finnish Lapland. Landsc. Urban Plan. 2014, 122, 1–15. [Google Scholar] [CrossRef]
  19. Pérez, V.E.; Santoyo, A.H.; Guerrero, F.; León, M.A.; da Silva, C.L.; Caballero, R. Measuring the sustainability of Cuban tourism destinations considering stakeholders’ perceptions. Int. J. Tour. Res. 2017, 19, 318–328. [Google Scholar] [CrossRef]
  20. Huang, Y.; Coelho, V.R. Sustainability performance assessment focusing on coral reef protection by the tourism industry in the coral triangle region. Tour. Manag. 2017, 59, 510–527. [Google Scholar] [CrossRef]
  21. Juan Ignacio Pulido, F.; Marcelino Sánchez, R. Measuring tourism sustainability: Proposal for a composite index. Tour. Econ. 2009, 15, 277–296. [Google Scholar]
  22. Ritchie, J.R.B.; Crouch, G.I. A model of destination competitiveness/sustainability: Brazilian perspectives. Rev. Adm. Públ. 2010, 44, 1049–1066. [Google Scholar] [CrossRef]
  23. Buckley, R. Sustainable tourism: Research and reality. Ann. Tour. Res. 2012, 39, 528–546. [Google Scholar] [CrossRef]
  24. Miller, G.; Rathouse, K.; Scarles, C.; Holmes, K.; Tribe, J. Public understanding of sustainable tourism. Ann. Tour. Res. 2010, 37, 627–645. [Google Scholar] [CrossRef] [Green Version]
  25. Darcy, S.; Cameron, B.; Pegg, S. Accessible tourism and sustainability: A discussion and case study. J. Sustain. Tour. 2010, 18, 515–537. [Google Scholar] [CrossRef]
  26. Tyrrell, T.; Paris, C.M.; Biaett, V. A quantified triple bottom line for tourism: Experimental results. J. Travel Res. 2013, 52, 279–293. [Google Scholar] [CrossRef]
  27. Wise, N. Outlining triple bottom line contexts in urban tourism regeneration. Cities 2016, 53, 30–34. [Google Scholar] [CrossRef]
  28. Lew, A.A.; Hall, C.M.; Timothy, D.J. World Regional Geography: Human Mobilities, Tourism Destinations, Sustainable Environments; Kendall Hunt: Dubuque, IA, USA, 2015. [Google Scholar]
  29. Atkinson, H.; Brander Brown, J. Rethinking performance measures: Assessing progress in UK hotels. Int. J. Contemp. Hosp. Manag. 2001, 13, 128–136. [Google Scholar] [CrossRef]
  30. Chen, T.-H. Performance measurement of an enterprise and business units with an application to a Taiwanese hotel chain. Int. J. Hosp. Manag. 2009, 28, 415–422. [Google Scholar] [CrossRef]
  31. Chen, M.-H. The economy, tourism growth and corporate performance in the Taiwanese hotel industry. Tour. Manag. 2010, 31, 665–675. [Google Scholar] [CrossRef]
  32. Guetat, H.; Jarboui, S.; Boujelbene, Y. Evaluation of hotel industry performance and corporate governance: A stochastic frontier analysis. Tour. Manag. Perspect. 2015, 15, 128–136. [Google Scholar] [CrossRef]
  33. Hsieh, L.-F.; Lin, L.-H. A performance evaluation model for international tourist hotels in Taiwan—An application of the relational network DEA. Int. J. Hosp. Manag. 2010, 29, 14–24. [Google Scholar] [CrossRef]
  34. Gabrila, T.G.B.C. Supply chain management performance in tourism continental hotels chain case. Amfiteatru Econ. J. 2013, 15, 103–115. [Google Scholar]
  35. Yıldırım Yılmaz, U.S.B. Performance measurement in tourism a value chain model. Int. J. Contemp. Hosp. Manag. 2006, 18, 341–349. [Google Scholar] [CrossRef]
  36. Kozak, M. Measuring comparative destination performance: A study in Spain and Turkey. J. Travel Tour. Mark. 2002, 13, 83–110. [Google Scholar] [CrossRef]
  37. Avci, U.; Madanoglu, M.; Okumus, F. Strategic orientation and performance of tourism firms: Evidence from a developing country. Tour. Manag. 2011, 32, 147–157. [Google Scholar] [CrossRef]
  38. Chen, M.-H. Interactions between business conditions and financial performance of tourism firms: Evidence from China and Taiwan. Tour. Manag. 2007, 28, 188–203. [Google Scholar] [CrossRef]
  39. Molina-Azorin, J.F.; Pereira-Moliner, J.; Claver-Cortés, E. The importance of the firm and destination effects to explain firm performance. Tour. Manag. 2010, 31, 22–28. [Google Scholar] [CrossRef]
  40. Reichel, A.; Haber, S. A three-sector comparison of the business performance of small tourism enterprises: An exploratory study. Tour. Manag. 2005, 26, 681–690. [Google Scholar] [CrossRef]
  41. Augustyn, M.M. Performance of tourism partnerships—A focus on York. Tour. Manag. 2000, 21, 341–351. [Google Scholar] [CrossRef]
  42. Law, R.; Chon, K. Evaluating research performance in tourism and hospitality: The perspective of university program heads. Tour. Manag. 2007, 28, 1203–1211. [Google Scholar] [CrossRef]
  43. Chen, H.-M.; Tseng, C.-H. The performance of marketing alliances between the tourism industry and credit card issuing banks in Taiwan. Tour. Manag. 2005, 26, 15–24. [Google Scholar] [CrossRef]
  44. Sigala, M. Evaluating the performance of destination marketing systems (DMS)-stakeholder perspective. Mark. Intell. Plan. 2014, 32, 208–231. [Google Scholar] [CrossRef]
  45. Aminian, A. Environmental performance measurement of tourism accommodations in the pilgrimage urban areas: The case of the holy city of Mashhad, Iran. Procedia Soc. Behav. Sci. 2012, 35, 514–522. [Google Scholar] [CrossRef]
  46. Erdogan, N.; Tosun, C. Environmental performance of tourism accommodations in the protected areas: Case of Goreme historical national park. Int. J. Hosp. Manag. 2009, 28, 406–414. [Google Scholar] [CrossRef]
  47. Leslie, D. The missing component in the ‘greening’ of tourism: The environmental performance of the self-catering accommodation sector. Int. J. Hosp. Manag. 2007, 26, 310–322. [Google Scholar] [CrossRef]
  48. Thompson, K.; Schofield, P. An investigation of the relationship between public transport performance and destination satisfaction. J. Transp. Geogr. 2007, 15, 136–144. [Google Scholar] [CrossRef]
  49. Gronau, W.; Kagermeier, A. Key factors for successful leisure and tourism public transport provision. J. Transp. Geogr. 2007, 15, 127–135. [Google Scholar] [CrossRef]
  50. Assaf, A.G.; Tsionas, E.G. Incorporating destination quality into the measurement of tourism performance: A bayesian approach. Tour. Manag. 2015, 49, 58–71. [Google Scholar] [CrossRef]
  51. Barros, C.P.; Botti, L.; Peypoch, N.; Robinot, E.; Solonandrasana, B.A.G.A. Performance of French destinations: Tourism attraction perspectives. Tour. Manag. 2011, 32, 141–146. [Google Scholar] [CrossRef]
  52. Kozak, M.; De Carlo, M.; Cugini, A.; Zerbini, F. Assessment of destination performance: A strategy map approach. Tour. Rev. 2008, 63, 25–37. [Google Scholar]
  53. Zhang, L.; Botti, L.; Petit, S. Destination performance: Introducing the utility function in the mean-variance space. Tour. Manag. 2016, 52, 123–132. [Google Scholar] [CrossRef]
  54. Luo, W.; Xu, A. Research on performance evaluation on tourist destinations based on 4E and CSI. J. Hunan Financ. Econ. Univ. 2017, 33, 92–98. [Google Scholar]
  55. Castellani, V.; Sala, S. Sustainable performance index for tourism policy development. Tour. Manag. 2010, 31, 871–880. [Google Scholar] [CrossRef]
  56. Bastida, U.; Huan, T.C. Performance evaluation of tourism websites’ information quality of four global destination brands: Beijing, Hong Kong, Shanghai, and Taipei. J. Bus. Res. 2014, 67, 167–170. [Google Scholar] [CrossRef]
  57. Venkatraman, N.; Ramanujam, V. Measurement of business performance in strategy research: A comparison of approaches. Acad. Manag. Rev. 1986, 11, 801–814. [Google Scholar]
  58. Cracolici, M.F. Assessment of tourism effectiveness by analysing destinaiton efficiency. Tour. Econ. 2008, 14, 325–342. [Google Scholar] [CrossRef] [Green Version]
  59. Hatry, H.P. Performance Measurement: Getting Results; Urban Institute Press: Washington, DC, USA, 1999. [Google Scholar]
  60. Van Dooren, W.; Bouckaert, G.; Halligan, J. Performance Management in the Public Sector; Routledge: London, UK, 2010. [Google Scholar]
  61. Campbell, J.P.; Mchenry, J.J.; Wise, L.L. Modeling job performance in population of jobs. Personal. Psychol. 1990, 43, 313–575. [Google Scholar] [CrossRef]
  62. Bernardin, H.J. Performance Appraisal Design Development and Implementation; Blackwell: Cambridge, MA, USA, 1995. [Google Scholar]
  63. Brumbrach, G.B. Performance Management; The Cromwell Press: London, UK, 1988. [Google Scholar]
  64. Luo, W. Method and case study of performance evaluation on land consolidation projects based on matter-element model. In Proceedings of the International Conference on Information Management, Innovation Management and Industrial Engineering (ICIII), Shenzhen, China, 26–27 November 2011. [Google Scholar]
  65. Timothy, D.J. Destination Communities and Responsible Tourism. In Responsible Tourism: Concepts, Theory and Practice; Leslie, D., Ed.; CAB International: Wallingford, CT, USA, 2012. [Google Scholar]
  66. Lonti, Z.; De Caluwe, C.; Van Dooren, W. How to measure public administration performance. Public Perform. Manag. Rev. 2012, 35, 489–508. [Google Scholar]
  67. Dwyer, L.; Livaic, Z.; Mellor, R. Competitiveness of Australia as a tourist destination. J. Hosp. Tour. Manag. 2003, 10, 60–78. [Google Scholar]
  68. Hassan, S.S. Determinants of market competitiveness in an environmentally sustainable tourism industry. J. Travel Res. 2000, 38, 239–245. [Google Scholar] [CrossRef]
  69. Ritchie, J.R.B.; Crouch, G. The Competitive Destination: A Sustainable Tourism Perspective; CABI: Wallingford, CT, USA, 2003. [Google Scholar]
  70. Timothy, D.J. Participatory Planninga view of tourism in Indonesia. Ann. Tour. Res. 1999, 26, 371–391. [Google Scholar] [CrossRef]
  71. Andrews, R.; Entwistle, T. Does cross-sectoral partnership deliver? An empirical exploration of public service effectiveness, efficiency, and equity. J. Public Adm. Res. Theory 2010, 20, 679–701. [Google Scholar] [CrossRef]
  72. Keh, H.T.; Chu, S.; Xu, J. Efficiency, effectiveness and productivity of marketing in services. Eur. J. Oper. Res. 2006, 170, 265–276. [Google Scholar] [CrossRef]
  73. Timothy, D.J. Empowerment and Stakeholder Participation in Tourism Destination Communities. In Tourism, Power and Space; Church, A., Coles, T., Eds.; CAB International: Wallingford, CT, USA, 2007. [Google Scholar]
  74. Lim, C.; McAleer, M. Ecologically sustainable tourism management. Environ. Model. Softw. 2005, 20, 1431–1438. [Google Scholar] [CrossRef]
  75. Sun, B.Z.Y.; Sun, L. Application of an improved fuzzy comprehensive evaluation to investment risk analysis of thermal power projects. Eng. J. Wuhan Univ. 2010, 43, 194–197. [Google Scholar]
  76. Luo, W.B.; Rong, T. Quantitative study on the coordination of urban tourism and urban development. Geogr. Res. 2012, 31, 1103–1109. [Google Scholar]
  77. Gao, J. Performance measurement and management in the public sector: Some lessons from research evidence. Public Adm. Dev. 2015, 35, 86–96. [Google Scholar] [CrossRef]
Figure 1. Evaluation framework and index system of tourism destination performance.
Sustainability 10 00516 g001
Figure 2. The ratio of tourism revenue share of GDP from 2001 to 2015.
Sustainability 10 00516 g002
Table 1. Weight calculated by information entropy weight (IEW).
Goal LayerCriteria LayerIndex LayerEffectWeight
Performance of tourism destinationEconomy (E1)Tourism revenue share of GDP (%)+0.0409
Average annual growth rate of tourism output (%)+0.0920
Efficiency (E2)Average number of visitors in tourist zone (per/km2)+0.0828
Annual number of visitors per travel agency (ten thousand Yuan/unit)+0.0394
Annual visitors of unit star hotel beds (person/bed)+0.0568
GDP per capita of tertiary industry employees (Yuan/person)+0.0482
Effectiveness (E3)Number of travel agencies (unit)+0.0340
Number of star hotels (unit)+0.0690
Number of tertiary industry employees (person)+0.0528
Number of scenic spots above Class 2A (unit)+0.0413
Number of complaints (piece)-0.0400
Average stay (day)+0.1970
Environment (E4)Urban paved roads per capita (m2)+0.0466
Air quality (%)+0.0325
Urban regional environmental sound level assessment (dB)-0.0620
Sewage treatment rate (%)+0.0334
Urban public green space per capita (m2)+0.0309
Table 2. Domain of performance evaluation grade.
Evaluation Grade Domain
0–0.250.26–0.500.51–0.750.76–1
Poorfairgoodexcellent
Table 3. Performance evaluation results.
Year20052006200720082009
Evaluation value0.16090.33130.42940.36290.5857
Gradepoorfairfairfairgood
Table 4. Performance evaluation results of each 4E dimension.
Dimensions/Years20052006200720082009
E10.03800.05380.04180.00000.1006
E20.02580.10120.19520.05770.1072
E30.05280.11920.10700.13060.1768
E40.04440.05720.08570.17460.2011

