Measuring the Impact of Economic Crisis to the Greek Vehicle Market

Department of Mechanical Engineering Bakola and Salviera, University of Western Macedonia, 50100 Kozani, Greece
Sustainability 2018, 10(2), 510; https://doi.org/10.3390/su10020510
Submission received: 15 December 2017
/
Revised: 12 February 2018
/
Accepted: 12 February 2018
/
Published: 14 February 2018
(This article belongs to the Special Issue Sustainability Indicators for Renewable Energy Transition)
Abstract
:The fallout of the global economic crisis has impacted Greece severely as the austerity measures that were implemented since 2009 have had a devastating effect on poverty and the level of living. The financial agreement of the Greek government with the International Monetary Fund (IMF) gave rise to a deep recession phase in the Greek market that started in early 2008. The automobile industry is among the sectors that have been severely affected by the economic crisis. Given that the demand for cars fell sharply and that the Greek car market is facing serious problems, mapping and understanding them can provide useful input to the Greek vehicle market. Regression analysis is being employed, and the interrelations of different variables, such as net disposable income, unemployment rate, fuel prices, the Greek crisis, loans directed to the vehicle market, as well as the inflation rate for the period of 2000–2016, are investigated. Analyzing the factors affecting car sales can provide policy-makers with knowledge in order to take legislative and economic measures, so as to boost sales of new environmental friendly vehicles not only in Greece, but in all EU states.
1. Introduction
The failure of major financial institutions in the past few years led to the global financial crisis which impacted the world economy. In this unstable economic environment businesses were affected both from the demand and supply sides of the economy. The economic downturn and fiscal austerity have a negative effect on the aggregate demand. In addition, the banking crisis has led to tougher credit conditions. Some sectors, which were most exposed to the above-mentioned conditions, were severely affected. One of the most exposed branches to the ongoing crisis is the automobile industry as many consumers and firms postpone their purchases of new cars.
The automotive industry constitutes a key pillar of the EU economy as it directly contributes 2% of the EU’s GDP and employs 1.5% of the EU’s workforce [1]. In addition, the automobile value chain employs a large number of people through various service activities, such as car financing, insurance, dealers, and maintenance. Falling demand in the EU market had a strong impact on the European sales of vehicles. It is noted that the manufacturers that focused on the markets most severely hit by the crisis (Greece, Italy, and Spain) faced the consequences of the economic crisis [2]. Low sales aggravated the problem of overcapacity forcing some European manufacturers to reduce their workforce and close down several production sites. On the other hand, growing sales in the external markets enabled export-oriented companies to compensate for the dropping revenues from the European markets and remain profitable in 2012.
The global financial crisis, the intrinsic and skewed Greek economic model from the 1970s onwards, in conjunction with the adopted austerity measures imposed by the Financial Assistance Programme (May 2010), resulted in sweeping changes in the society. To be more specific, since May 2010, after the announcement of the financial agreement of the Greek government with the Eurozone countries and the IMF on a bailout loan for the country, conditional on the implementation of austerity measures, Euro area Member States and the IMF provided financial support to Greece through an Economic Adjustment Programme [3]. The release of the disbursements was based on quantitative performance criteria and on the evaluation of the progress made with respect to policy criteria (initially detailed in Council Decision 2001/734/EU of 12 July 2011—as amended in November 2011, and on 13 March and 4 December 2012—and the Memorandum of Understanding setting the economic policy conditionality—with the last update signed on 7 December 2012). As of November 2016, lenders concluded the first review of Greece’s bailout programme, releasing a €2.8bn subtranche, with the focus now on second review and possible debt relief. On 23 January 2017, the boards of directors of the European Stability Mechanism and the European Financial Stability Facility formally adopted the rules on short-term debt relief measures for Greece. The measures were endorsed by the Eurogroup on 5 December 2016. The Euro Working Group on 2 May 2017 ended with confirmation of the provisional agreement between the Greek government and its creditors, but without any talks on the lightening of the Greek debt.
The car sales sector is a sector of great importance for the Greek economy since it accounts for a significant part of government revenues, especially through the registration taxes that are directly implemented whenever a car sale takes place, as well as through the presumptions implemented once a year. The market of new sold cars experienced a deep crisis, having very large decreases on the sales, despite the bonuses provided by the state, under the status of the “vehicle withdrawal program” that has run in Greece since 2011. It is estimated that about 3000 dealerships have shut down since 2010. Based on the above-mentioned, and in the face of the recent financial crisis, the arising question is the future of economic growth of the Greek transportation sector. Therefore, the current crisis can be seen as a challenge for Greek policy-makers on how Greek fiscal policy can contribute to mitigating the impact of the economic crisis on the transport sector.
During the past years, a number of studies have attempted to analyze the impacts of the economic crisis to the automotive industry and the effects on the transport sector. These studies include, inter alia, the studies of Haugh et al. [4], who investigated the effect of economic crisis to the decrease in car sales during the period of 2008–2009; of Sturgeon and Biesebroeck [5], who paid special attention to the effects of the recent economic crisis on the auto industry in developing countries; as well as of Yan et al. [6]. In addition, the relation between economic and freight transport indicators has been investigated by Garcia et al. [7], who examined a number of correlations between road freight indicators and economic indicators, such as share of employment per sector, GDP per capita, etc., in a selected number of regions in EU countries. Verny [8], using time series data, investigated the relation between freight transport and the distances covered, with economic growth. In regards to Greece, many studies have investigated the effects of the economic recession to health, to the healthcare system [9,10], to unemployment [11], to the income [12], to the Greek airports [13], and to urban travel behavior [14]; nonetheless, there is limited research to the effects of the current economic crisis to Greek vehicle market.
Based on the above-mentioned, it is of great importance to further investigate, analyze, and measure the impact of economic recession to the Greek vehicle market. The objective of this study is to assess the impact of the fiscal crisis on the new car sales levels in the Greek vehicle market and to establish a model, which will correlate all the variables affecting the car sales in Greece, during the period of 2000–2016. In addition, this study intends to provide a background on a number of crucial aspects explaining the impact of the economic crisis on the Greek transport sector. This study is structured as follows: Firstly, the current situation presented. The impact of the economic crisis in terms of passenger transport and car sales is analyzed, by using a set of key indicators, micro- and macroeconomic data, as well as employment figures. Then data are processed and analyzed. Further analysis on the results is performed by attempting to express the outcome of the above analysis in mathematical relations between economic, social, and transport indicators.
2. Materials and Methods
The dataset used in this study consists of monthly car registration numbers officially recorded by the Greek authorities. The Greek Association of Motor Vehicle Importers—Representatives (AMVIR) statistical data base, which includes information regarding the car representatives operating in Greece [15], was used. Data on monthly new car registrations officially recorded by the Greek authorities are equivalent to new car sales. Statistical correlation, as well as descriptive statistics, is used, in order to assess the impacts of economic crisis to the Greek vehicle market.
The time period recorded starts from January 2000 and ends in December 2016. Time series data from different motor vehicle importers–representatives, which operate in the Greek automobile retail market, are analysed. Data regarding total car sales come from AMVIR (Association of Motor Vehicle Importers Representatives); Net Disposable Income, Unemployment from ELSTAT [16], inflation rate comes from Eurostat [17], while the data on fuel prices come from the Observatory of Fuel Prices [18].
The method of regression analysis has been employed, in order to analyse the interrelations among variables. Multiple regression is being employed. All the independent variables are regressed together in one regression model.
Both quantitative and qualitative variables have been chosen, so as to reflect social, economic, and technical aspects of the Greek vehicle market. The unemployment rate, fuel prices, the net disposable personal income, the average inflation, as well as the impacts of economic crisis, are assessed. The significance between these variables is also analysed. It is noted that the variables taken into consideration can be used, in order to estimate the changes in the vehicle market. In this way, all variables have this feature since all of them are used for expressing the economic market through different perspectives. Lt is the dummy variable of the loans directed to the car market taking the value 1 for the period 2003–2008, and 0 elsewhere. RT is the dummy variable of the registration taxes taking the value of 1 in the period 2004–2008 and 0 elsewhere. Ct is the dummy variable of the crisis taking the value of 1 in time interval 2010–2016 and 0 elsewhere.
The regression model is based on Equation (1); whereas the characteristics of the independent variables are summarized in Table 1.
CAR = β1INC + β2FP+ β3IR+ β4UR+ β5Lt + β6Rt + β7Ct + e
2.1. Multicollinearity
When fitting a regression model, multicollinearity is a problem that potentially arises. It exists when two or more of the predictors in a regression model are moderately or highly correlated. When there is multicollinearity, it makes the t-test unreliable, where the signs of the coefficient will be varied. To examine the multicollinearity of the model, variance inflation factor (VIF) can be used. There is high multicollinearity between the variables if the independent variables have a VIF that is higher than 10.
2.2. Autocorrelation
Autocorrelation occurs when there are correlation between the values of the same variables is based on related objects. The Durbin-Watson statistic (d) can be used to test for the presence of autocorrelation in time series data. The hypothesis for the Durbin-Watson test is shown below:
- H0 = No autocorrelation
- H1 = Autocorrelation exits.
If the null hypothesis is rejected, the data is correlated, and if the null hypothesis is not rejected, there are no autocorrelation.
3. Current Situation
During the period of 2008–2014, the GDP per capita in Greece dropped by 25.5%. This percentage represented the greatest decline of GDP in comparison to six other European countries affected by the crisis (Ireland, Portugal, Spain, Italy, and France). Moreover, the unemployment rate surged from 7.3% in May 2008 to 27.2% in May 2014. Specifically, among youth aged 15–29, unemployment was 47.5% in 2014. The purchasing power of the average gross wage during the five years 2010–2014 decreased by 23% and returned to the salary levels of 1995 [19,20,21,22].
In regards to the number of vehicles sold, it is noted that between 1990 and 2010 this increased by 204%; whereas the average age of the fleet was 10.5 years [23], with 24% of the fleet comprising of vehicles older than 16 years, manufactured before the adoption of the EURO emission standards [24]. The introduction of biodiesel in the local transport sector does not yet reach high enough values. Bioethanol is not available at all since there is no local production nor any imports. Investments in bioethanol require legislation with specific targets, state incentives, and other financial support schemes. In Greece, the passenger car fleet is dominated by gasoline ICE vehicles falling in the less than 1.4 L class, whereas the fraction of large gasoline ICE vehicles (greater than 2.0 L) is less than 2% due to high purchase taxes on this vehicle category. Diesel passenger vehicles were banned until 2010, for environmental reasons from the two main cities (Athens and Thessaloniki), which corresponds to 70% of the Greek market.
To be more specific, as per SEAA’s report, from the beginning of 2016, 74,108 new passenger cars were registered, compared to 68,989 the year before (+7.4%). Despite this slight increase, the passenger car market was still down 71.2% compared to the 2000–2009 average. It is noted that in November of 2016, diesel passenger cars dominated over the petrol variants (62.1% diesel, 35.2% petrol). The passenger car market in November 2016 posted 5897 registrations, compared to 5859 the year before. Diesel passenger car registrations reached 3660 units (62.1%), followed by 2076 petrol passenger cars (35.2%), 132 hybrids (2.2%), 16 CNG-powered cars (0.3%), 11 dual-fuel cars (0.2%), and two electrics. It should be mentioned that during the first six months of 2017, the new passenger car market was up 14.4% compared with the same period the year before. This increase was based on the increased demand for rentals but, nevertheless, the passenger car market was down 66.9%, compared to the 2000–2009 average.
Aggregated car sales slumped after the start of the financial crisis. Annual unit sales had totalled close to 180,000 before 2007. By 2011, as the Greek economy contracted at a rapid pace, car sales had fallen to barely 60,000 per annum, a decline by two-thirds within four years. Figure 1 depicts the increase in sales of second-hand “cheap” cars. Very small vehicles (Category A, city-cars, small size, and ~1.000 cc) represent 16.5–18% of the market; whereas this share in 2010 was 10%. The share of small cars (Category B, ~1.400 cc) represents 38% the market share; whereas this share in 2010 was 30%. It is also evident that between 2009 and 2014, sales of new cars fell by 66%. From 208,802 in 2009 they dropped to 58,696 in 2013 and 71,222 in 2014 after 2014’s market stabilization. Additionally, sales of new cars—compared to 2001—were 76% lower.
To be more specific, between 2009 and 2014 in Greece, the share of mini and small vehicles increased, while sales in other segments declined considerably. The greatest impact can be seen on the medium segment, which diminished from 14% in 2009 to a mere 3% in 2014. Additionally, the percentages of upper-medium, luxury, and sport segments were almost completely eliminated by 2014 as the number of cars with 1929–2000 cc engine capacity sold in 2009 was 19,826, falling to 1774 in 2013 and 2588 in 2014, reporting an 87% decline [25]. The number of cars with engine capacities of over 2000 cc sold in 2009 was 12,238. Their number was only 439 in 2013 and 656 in 2014. Sales decline in this category was 95%. It should be noted that not only was there no demand for high-cc vehicles, Jeeps, SUVs, and luxury cars, but even plenty of second-hand vehicles are for sale, even at half the price than five years ago, and still remain in stock. The latter can be attributed to the fact that the increase of the cost of the fuel, in combination with the decrease of the consumer’s income, has led consumers in search of low consumption and taxation vehicles.
3.1. Energy Consumption
As per data submitted to the Climate Change Convention [26,27] it is estimated that 80–87% of gasoline consumption in Greece is attributed to passenger cars.
Gasoline demand decreased by 1.9% during the first seven months of 2016, while diesel sales for the same period increased by 3.5%. However, demand for both products increased in July alone year-over-year, with gasoline and diesel demand increasing by 8.4% and 10.4%, respectively. It should be noted that in July 2015 capital controls were imposed, which affected consumers’ willingness to spend and, consequently, demand for fuel products dropped. The demand for petroleum products in the Greek market, after peaking in 2007, has fallen dramatically, reversing a longstanding upward trend, which was closely connected with the growth of the Greek economy. Diesel fuel consumption by passenger cars was virtually increased after 2010, given that circulation of diesel passenger cars was prohibited in the two major metropolitan areas of Athens and Thessaloniki.
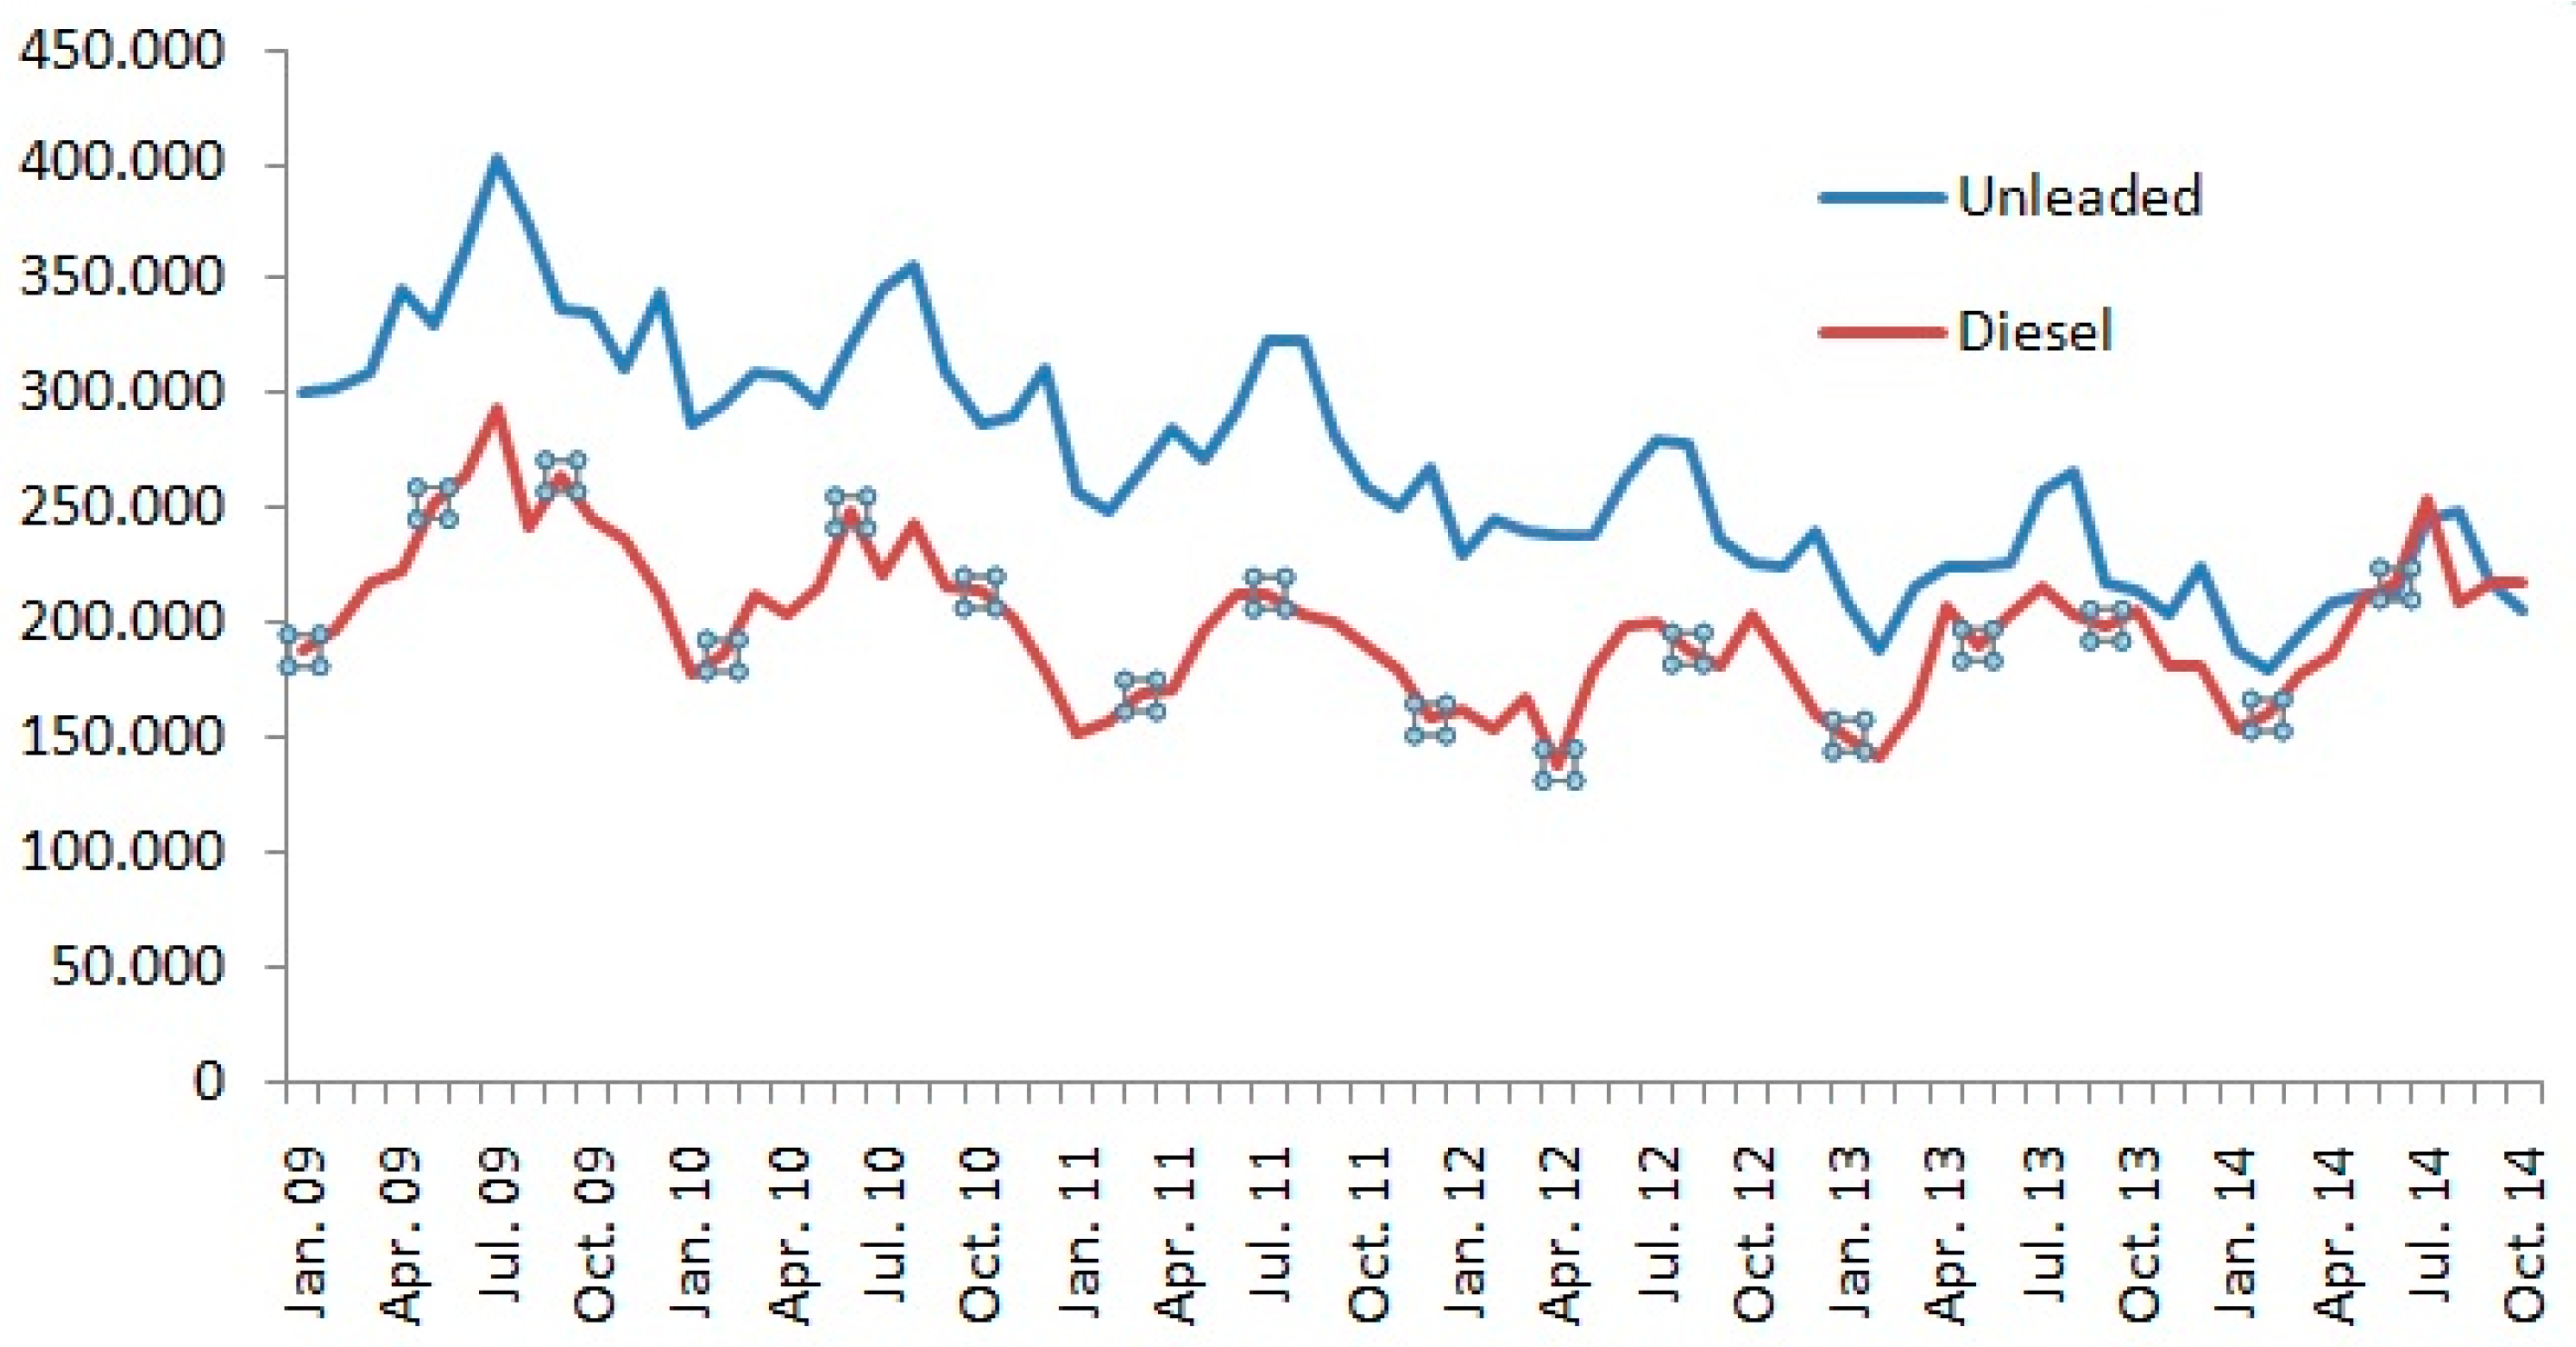
Monthly trends of transport fuels consumption attributed to passenger cars for the period of 2009–2014 are presented in Figure 2. It is noted that in Greece the consumption of unleaded petrol was higher than diesel consumption, but lately this tends to equate. The fuel consumption during the summer months is increased. During the last six years, the use of gasoline decreased, while the use of diesel remained relatively stable. It seems that the economic crisis, coupled with the increase in international prices of crude oil until 2013, as well as the increased taxation of unleaded petrol, has resulted in significant reduction in petrol consumption. To be more specific, in March 2017 the gasoline demand decreased by 1% compared to March 2016, while the demand ended up 4.3% lower year over year in the first quarter of 2017. Diesel demand increased by 8.6% year over year in March. Diesel demand was also down 0.8% year over year in the first quarter of 2017.
In regards to fuel pricing, it is worth mentioning that fuel taxes in Greece increased in recent years, reaching one of the highest levels for the same products in the EU (Figure 3). The same holds for the contribution of petroleum products to tax revenues. Fuel prices decreased in the pre-tax prices after September 2012, while the decrease in final prices was not so strong. This is due to the constant taxation and other charges that represent a significant proportion of the final price. With regards to the abovementioned, even if the price of unleaded petrol before taxes is lower than the price of diesel, the final prices are opposite, because of the lower tax rates on diesel.
Figure 4 presents the trends in fuel prices during the period of 1990–2016. It should be noticed that automobile gas in Greece stood at €1.294/L on 27 February 2017, again higher than the EU-28 average of €1.250/L. This was the highest price of automobile gas in the country since 17 November 2014, when the price reached €1.304/L. It should be mentioned that price hikes went into effect on 1 January 2017 in Greece on the excise tax on petrol that increased by three cents per litre, from €0.67 to €0.70, while diesel rose by eight cents per litre, from €0.33 to €0.41, and propane went up 10 cents per litre—from €0.33 to €0.43. These pushed up retail prices to reach an additional five cents per litre on petrol, eight cents on diesel, and 0.12–0.13 cents per litre for propane.
4. Results—Effects of Economic Crisis to Greek Car Market
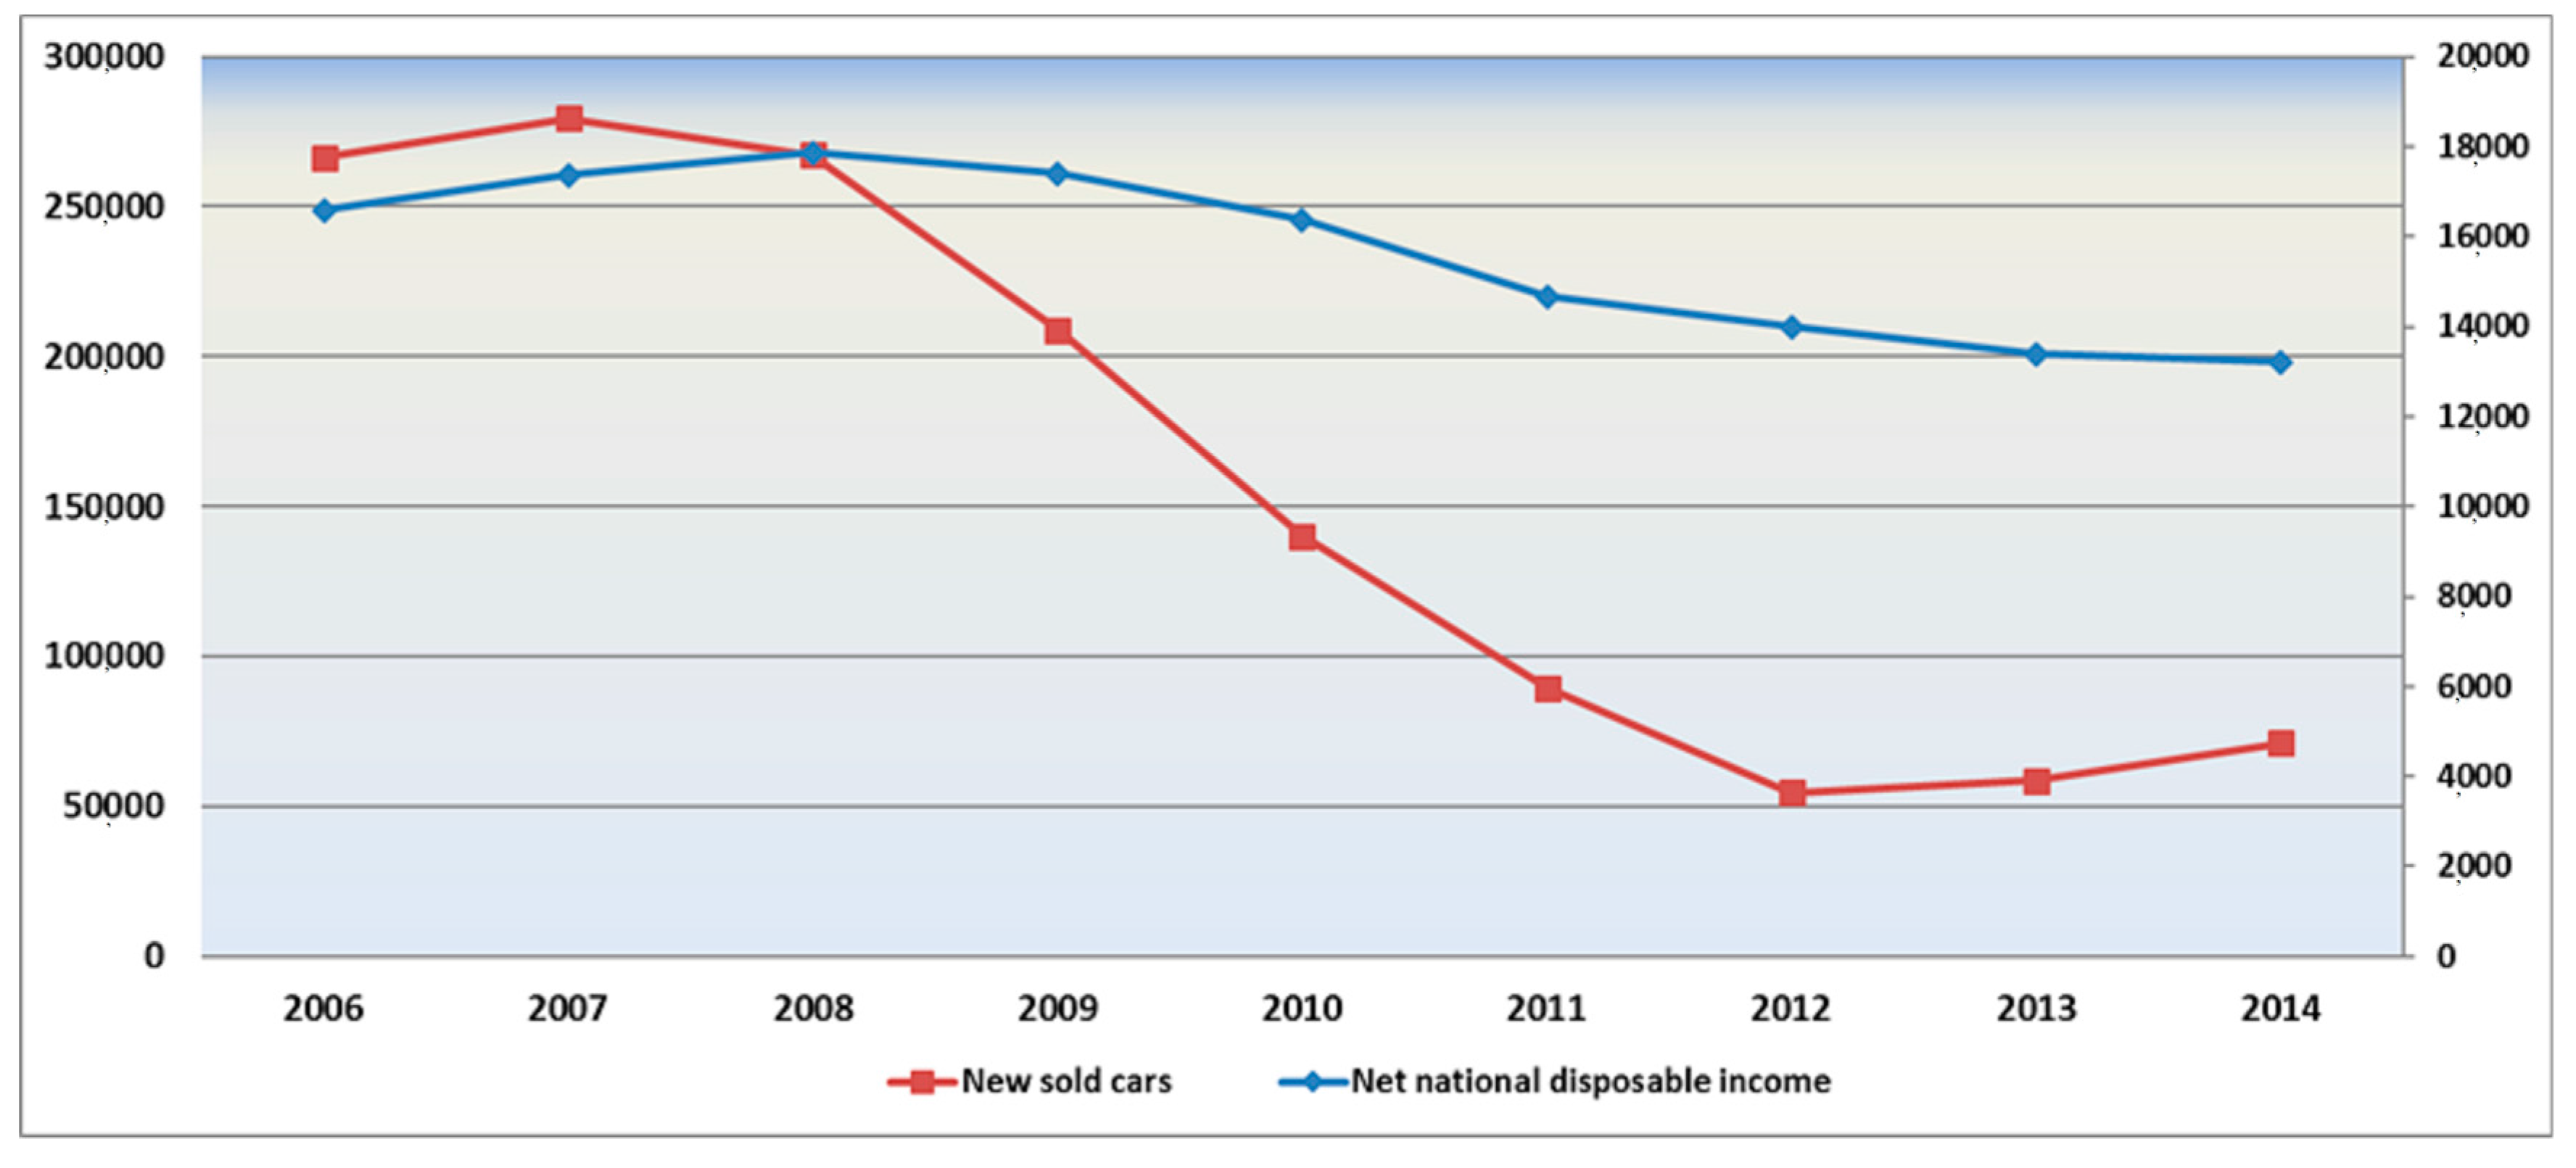
Car sales can be considered to be a result of consumer’s behaviour, which is affected by many factors, such as social, cultural, personal, economic, as well as demographic influences. For instance, people with high income consider that more expensive models are best suited to their status. The implementation of austerity measures, which have been applied in Greece since February 2010 had, as a result, prolonged income declines. As a result citizens’ behaviour changed, causing an important decrease in consumption and especially in the number of new cars sold (Figure 5). The results of the correlation matrix of the model under study are summarized in Table 2.
In order to detect the presence of multicollinearity, a multicollinearity test is conducted. Table 3 summarizes the VIF results for the model under study. As the VIF values are between 1 and 10, the independent variables do not have high correlations and multicollinearity does not exist. In order to investigate the presence of autocorrelation, a Durbin–Watson test is carried out. As the computed p value is 0.044 (lower than the level alpha = 0.05), one should reject the null hypothesis H0, and accept the alternative hypothesis Ha—as presented in Section 2. In regards to heteroscedasticity, a Breusch-Pagan test is carried out. As the computed p value is 0.048 (lower than the level alpha = 0.05) the null hypothesis is of homoskedasticity is rejected. Table 4 summarizes model’s parameters.
Taking into consideration the fact that relative poverty has increased in Greece by 1.7% (from 19.7% in 2009 to 21.4% in 2015), it is evident that this change in the economy would influence the purchasing behaviour of potential buyers. Special attention should be given to the fact that the austerity measures have disproportionally affected the living conditions of different population groups. Whereas for the general population in Greece the index of severe material deprivation has more than doubled in recent years (21.3% in 2015 against 10.6% in 2009), it is the unemployed persons who have suffered the most from deprived living conditions. Specifically, for this population group, severe material deprivation has risen from 20.2% in 2009 to 43.4% in 2015, meaning that more than 4 out of 10 jobless people do not have the means to meet at least four key requirements for a decent life. This development is strongly correlated to disposable income.
Disposable income is an important factor which largely determines the behaviour of car buyers. Since financial resources are those which provide the possibility of acquiring an asset, it would be expected that sales of cars are closely influenced by the net disposable income. Net disposable income (INC) is significant at 1%, 5%, and 10%. When INC increases by 1%, the car sales unit increases by 16 units. This implies that when there is an increase in INC, the car sales will increase. This is attributed to the increase of the purchasing power of the consumer, which, in turn, increases the demand for new cars. The adverse effects of austerity measures in the labour market are reflected on the rise of unemployment rates. During the period of 2008 to 2016 unemployment in Greece has recorded a surge, rising from 8% to 23.1% of total labour force. The unemployment rate is significant at the 5% and 10% levels. This indicates that there is a negative relationship between UR and car sales. This indicates that the employment instability causes buyers to be more restrained in car purchase decisions.
Fuel prices also play a significant role in shaping the trends regarding the number of new cars sold. High oil prices are expected to have a negative impact on the consumer demand for vehicles. Taking into consideration [30], which suggested that the vehicle industry is negatively affected by oil price shocks and that the long run effects of oil price shocks will result in a weakening demand for full-sized cars, or opting for alternative means of transportation, the correlation between the number of new cars sold and fuel prices is expected to be negative. Indeed, as illustrated in Table 2 the negative correlation coefficient indicates that as fuel prices are rising, the number of new cars sold is decreasing. Previous studies [31] have indicated that as inflation rate increases, the number of car sales decreases as the real purchasing power of consumer declines. The result for inflation rate are aligned with the findings of above -mentioned studies—Table 2 indicates that there is negative relationship between inflation rate and car sales. The inflation rate is significant at 5%. This result is attributed to the fact that inflation rate increases the price of the car and decreases the car sales. The real purchasing power of consumer declines.
In regards to key dummy variables that enter the model under study, it is shown that the Greek crisis has a negative and statistically significant impact on car sales. Due to the Greek crisis, the implemented austerity measures led car sales to a significantly lower level. The dummy variable of loans has a positive and statistically significant effect on Greek car sales. This fact is attributed to the favourable loan terms that either the banks or the car dealerships offered their customers, increasing people’s interest in buying cars. The dummy variable of registration taxes has a positive and statistically significant impact on Greek car sales. This can be attributed to the fact that the government put forward legislation leading to a reduction of 50% in the registration taxes during 2009.
The model under study has a high F-statistic which is satisfactory for this type of investigation in the sense that, overall, the estimated coefficients of this model are statistically significantly different than zero. All variables of the model are statistically significant at the 5% level or higher, while the model is able to interpret 68% of the variance that the data exhibit. Finally, according to the Durbin-Watson statistic, there is no evidence of serious autocorrelation of the residuals
5. Conclusions and Discussion
Transport activities play an important role to a country’s economic growth. Taking into consideration the fact that transport enables movement of people and goods, the direct result is the enhancement of market and economic development [25], the increase in poverty rates in Greece between 2009 and 2013 caused both by the economic crisis, and the effects of the austerity policies which followed, severely affected the transport sector and, consequently, the automotive sector.
The findings of this study indicate that the economic, social, and technical variables under study are strongly correlated with the number of new sold cars. From the analysis results, it can be seen that the net disposable income has a positive relationship with car sales, whereas the unemployment rate, the inflation rate, and the fuel price have a negative relationship. It is also suggested that the Greek crisis and the implemented austerity measures led car sales to a significantly lower level. In addition, favorable loan terms during the period of 2003–2008 increased people’s interest in buying cars. Finally, the legislation of the Greek government, in regards to registration taxes affected car sales.
The demand for passenger cars is driven mainly by greater affordability, which, in turn, increases the aspiration level of the customers. Thus, high growth in GDP reflects higher economic activity and higher disposable income, which typically results in higher demand for commercial vehicles. The increase in per capita income and the standard of living should result in a higher demand for cars. The impacts of the Greek budget deficit in 2009 (reaching about 15% of the GDP for that year) resulted not only in an unprecedented economic crisis, but also caused its inability to borrow money from the markets. As a consequence, the per capita net disposable income was decreased, whereas the unemployment rate was increased. From the above-mentioned, it is obvious that the car sales are affected by both social and economic changes, leading to a 40% reduction during the period of 2008–2014.
The rise of unemployment rates (climbing from 8% in 2008 to 23.1% of total labour force in 2016) not only is indicative of the severe socio-economic disruptions of recession, but also corresponds to an explosive increase in the total number of unemployed by more than 700,000 persons. This development has changed the consumer’s behavioural attitude, leading them to buy vehicles of smaller engine capacity that are less expensive, and with lower maintenance and usage costs.
The large reduction of fuel consumption after 2009 cannot be attributed to environmental or public transport policies, but it is directly related to the recent economic crisis in Greece. Taxes imposed on fuels have risen significantly in 2010 and combined with the reduction of the available income have resulted in a sharp decline in fuel consumption. It could be claimed that fuel consumption indicates a society’s standard of living; the higher its level the greater the number of existing vehicles. Consequently, changes to fuel consumption attributed to austerity measures should reflect changes of people’s habits and the standard of living. The inflation rate has a medium strength correlation with new vehicles registrations. However, the correlation shows that the increasing prices partly determine new automobile registrations.
The results of this study are consistent with the studies performed by Guonason and Jonsdottir [31], Nawi, et al. [32], Muhammad, et al. [33] and Smusin and Makayeva [34] regarding the impact of unemployment rate, GDP, fuel prices, and inflation rate to vehicle market.
Despite the aforementioned situation, the economic crisis might be seen as a challenge for policy-makers to implement low-carbon energy policies in order to address obligations deriving from commitments to European initiatives regarding the penetration and promotion of low-carbon vehicle technologies. Furthermore, the European Parliament and the Council of the European Union have set mandatory CO2 emission targets, which new passenger cars and light commercial vehicles must meet by 2020. By this time, 95% of all new cars sold in the EU must emit on average 95 g/km CO2 or less—a limit that becomes mandatory for all cars on sale from 2021.
Into this direction Greece could benefit from both EU support and introduce measures, such as subsidies, so as to encourage owners of old cars to scrap them in return for buying vehicles of new technologies and lower emissions. These subsidies will help not only the automotive industry, but will also benefit the environment, since new vehicle technologies emit less CO2 emissions. In this way, the potential increase in car sales will take into consideration their influence on the environment. In support of these financial incentives proposed under EU directives for energy saving improvements in vehicles, as well as the promotion of less polluting technology, should be specified and put into practice. Furthermore, measures, such as the implementation of allocation schemes to dispose of motor vehicles that are older than 8–10 years, the introduction of larger taxes for vehicles emitting pollutants above certain limits, as well as the provision of loans with subsidized interest, could be beneficial to a fleet renewal program, which would increase car sales. Policy-makers should ensure that communities and local authorities have an understanding of the aforementioned situation, so as to effectively address energy efficiency policies without hindering economic growth. It should be noted that not only policy-makers should be involved in this, but also local communities should insist in the collective awareness of the need to implement energy efficiency policies, through plans, programs, and projects, aiming to reduce the environmental impacts and to have a better quality of life.
Taking into consideration the fact that the car sales industry constitutes an important part of the Greek economy, future research would be of great interest, given that the majority of variables are affected by institutional changes. Further analysis can be implemented for a longer period of time. In addition, analysis could be extended by incorporating data for additional indicators, which would probably affect the Greek automotive sector. Therefore, a deeper investigation of existing or available data about consumer’s buying behaviour, interest rates, taxes and duties, as well as regulation of safety and emission standards, would throw light to the extent of their interrelation and give the opportunity to gain a deeper insight into the subject. It would be also interesting to investigate the potential economic recovery impacts on the automotive sector.
Conflicts of Interest
The author declares no conflict of interest.
References
- European Automobile Manufacturers Association (ACEA). Facts about the Automobile Industry. Available online: http://www.acea.be/automobile-industry/facts-about-the-industry (accessed on 14 December 2016).
- FTI Consulting, Regulation and Competitiveness of the EU Automotive Industry. 2015. Available online: http://www.fticonsulting.com/~/media/Files/us-files/intelligence/intelligence-research/regulation-and-competitiveness.pdf (accessed on 21 September 2016).
- Economic and Financial Affairs: Third Economic Adjustment Programme for Greece. Available online: http://www.consilium.europa.eu/en/policies/financial-assistance-eurozone-members/greece-programme/ (accessed on 26 September 2016).
- Haugh, D.; Mourougane, A.; Chatal, O. The Automobile Industry in and Beyond the Crisis, OECD Economics Department Working Papers; Organisation for Economic Co-operation and Development (OECD): Paris, France, 2010. [Google Scholar]
- Sturgeon, T.; Biesebroeck, J. Effects of the Crisis on the Automotive Industry in Developing Countries, WPS5330; The World Bank: Washington, DC, USA, 2010. [Google Scholar]
- Yan, H.; Tu, X. Short-term sales forecasting with change-point evaluation and pattern matching algorithms. Expert Syst. Appl. 2012, 39, 5426–5439. [Google Scholar] [CrossRef]
- Garcia, C.; Levy, S.; Limão, S.; Kupfer, F. Correlation between transport intensity and GDP in European regions: A new approach. In Proceedings of the 8th Swiss Transport Research Conference, Ascona, Italy, 17–19 September 2008. [Google Scholar]
- Verny, J. The problem of decoupling between freight transport and economic growth. Eur. J. Transp. Infrastruct. Res. 2007, 7, 113–128. [Google Scholar]
- Economou, M.; Madianos, M.; Peppou, L.E.; Patelakis, A.; Stefanis, C.N. Major depression in the Era of economic crisis: A replication of a cross-sectional study across Greece. J. Affect. Disord. 2013, 145, 308–314. [Google Scholar] [CrossRef] [PubMed]
- Simou, E.; Koutsougeorgou, E. Effects of the economic crisis on health and healthcare in Greece in the literature from 2009 to 2013: A systematic review. J. Health Policy 2014, 115, 111–119. [Google Scholar] [CrossRef] [PubMed]
- Karafolas, S.; Alexandrakis, A. Unemployment Effect of the Greek Crisis: A Regional Examination, The Economies of Balkan and Eastern Europe Countries in the changed world, EBEEC 2014, Nis, Serbia. Procedia Econ. Financ. 2015, 19, 82–90. [Google Scholar] [CrossRef]
- Magoulios, G.; Kydros, D.; Stergios, A. The Economic Crisis 2008 and Effects on Income. The Case of Greece. The Economies of Balkan and Eastern Europe Countries in the changed world, EBEEC 2014, Nis, Serbia. Procedia Econ. Financ. 2015, 19, 27–36. [Google Scholar]
- Fragoudaki, A.; Giokas, D.; Glyptou, K. Efficiency and productivity changes in Greek airports during the crisis years 2010–2014. J. Air Transp. Manag. 2016, 57, 306–315. [Google Scholar] [CrossRef]
- Papagiannakis, A.; Baraklianos, I.; Spyridonidou, A. Urban travel behaviour and household income in times of economic crisis: Challenges and perspectives for sustainable mobility. J. Transp. Policy 2017. [Google Scholar] [CrossRef]
- Association of Motor Vehicle Importers Representatives. Available online: http://www.seaa.gr/en/content/81 (accessed on 11 April 2016).
- ELSTAT Hellenic Statistic Authority. Available online: www.statistics.gr (accessed on 11 April 2016).
- Eurostat Database. Available online: http://ec.europa.eu/eurostat/data/database (accessed on 11 April 2016).
- Observatory of Fuel Prices. Available online: http://www.fuelprices.gr/ (accessed on 11 August 2017).
- ELSTAT (Hellenic Statistical Authority). Employment Force Survey; Press Release June 2013. Available online: http://www.statistics.gr/documents/20181/611fc7e1-118f-4761-9da6-3e6e745114eb (accessed on 11 December 2013). (In Greek)
- ELSTAT (Hellenic Statistical Authority). Living Conditions in Greece. Press Release November 2014. Available online: http://www.statistics.gr/documents/20181/1216581/LivingConditionsInGreece_1114.pdf/515660fd-81eb-4377-9e87-b4c4b8c225df (accessed on 11 December 2014).
- ELSTAT (Hellenic Statistical Authority). Registered Vehicles by Category, Type of Ownership and Region in Greece: 2008–2014 (Raw Data). Available online: http://www.statistics.gr/el/statistics/-/publication/SME18/-〉 (accessed on 11 December 2014). (In Greek)
- INE/GSEE (The Labour Institute of the Greek General Confederation of Labour). The Greek Economy and Employment; Annual Report; INE/GSEE: Athens, Greece, 2014. (In Greek) [Google Scholar]
- ACEA. 2010 European Automobile Manufacturers Association, The Automobile Industry Pocket Guide. Available online: http://www.acea.be/uploads/publications/POCKET_GUIDE_2010.pdf (accessed on 11 April 2016).
- Ministry of Environment and Energy. Annual Inventory Submission under the Convention and the Kyoto Protocol for Greenhouse and Other Gases for the Years 1990–2010; Piraeus, Athens, 2012. Available online: http://www.ypeka.gr/LinkClick.aspx?fileticket=Ejz%2F1MO%2Fg3U%3D&tabid=470&language=el-GR (accessed on 13 February 2018).
- European Vehicle Market Statistics. The International Council of Clean Transportation; European Vehicle Market Statistics: San Francisco, CA, USA, 2015. [Google Scholar]
- UNFCCC 2011 Greenhouse Gas Inventory Data 2009. Available online: http://unfccc.int/ghg_data/items/3800.php (accessed on 22 November 2017).
- International Tennis Federation (ITF). Near-Term Outlook for the Economy, Trade and Transport, in ITF Transport Outlook 2015; OECD Publishing: Paris, France, 2015. [Google Scholar] [CrossRef]
- Ministry of Environment and Energy. Available online: http://www.ypeka.gr/Default.aspx?tabid=37&locale=en-US&language=el-GR (accessed on 22 November 2017).
- European Environment Agency–EEA. 2017. Available online: https://www.eea.europa.eu/data-and-maps/indicators/fuel-prices-and-taxes/assessment-6 (accessed on 22 November 2017).
- Kiseok, L.; Ni, S. On the Dynamic Effects of Oil Price Shocks: A Study Using Industry Level Data. J. Monetary Econ. 2002, 49, 823–885. [Google Scholar]
- Guðnason, R.; Jónsdóttir, G. The Icelandic CPI House Price Index. In Owner Occupied Housing in the Icelandic CPI; Diewert, W.E., Balk, B.M., Fixler, D., Fox, K.J., Nakamura, A.O., Eds.; Trafford Publishing: Bloomington, IN, USA, 2009; pp. 147–150. [Google Scholar]
- Nawi, A.; Ahmad, B.S.; Mahmood, W.; Nurathirah, S.; Hamid, B.A. Determinants of passenger car sales in Malaysia. World Appl. Sci. J. 2013, 23, 67–73. [Google Scholar]
- Muhammad, F.; Yahya, M.; Hussin, M.; Razak, A.A.; Rambeli, N.; Tha, G. The relationship between macroeconomic variables and passenger vehicle sales in Malaysia. Bus. Econ. Res. 2013, 3, 115–126. [Google Scholar] [CrossRef]
- Smusin, V.; Makayeva, N. Short-run macroeconomic factors affecting car sales. J. Bus. Manag. 2009, 4, 16–31. [Google Scholar]
Figure 1.
Greece’s market share by new and second-hand cars from 1998 to 2015 [16].
Figure 1.
Greece’s market share by new and second-hand cars from 1998 to 2015 [16].
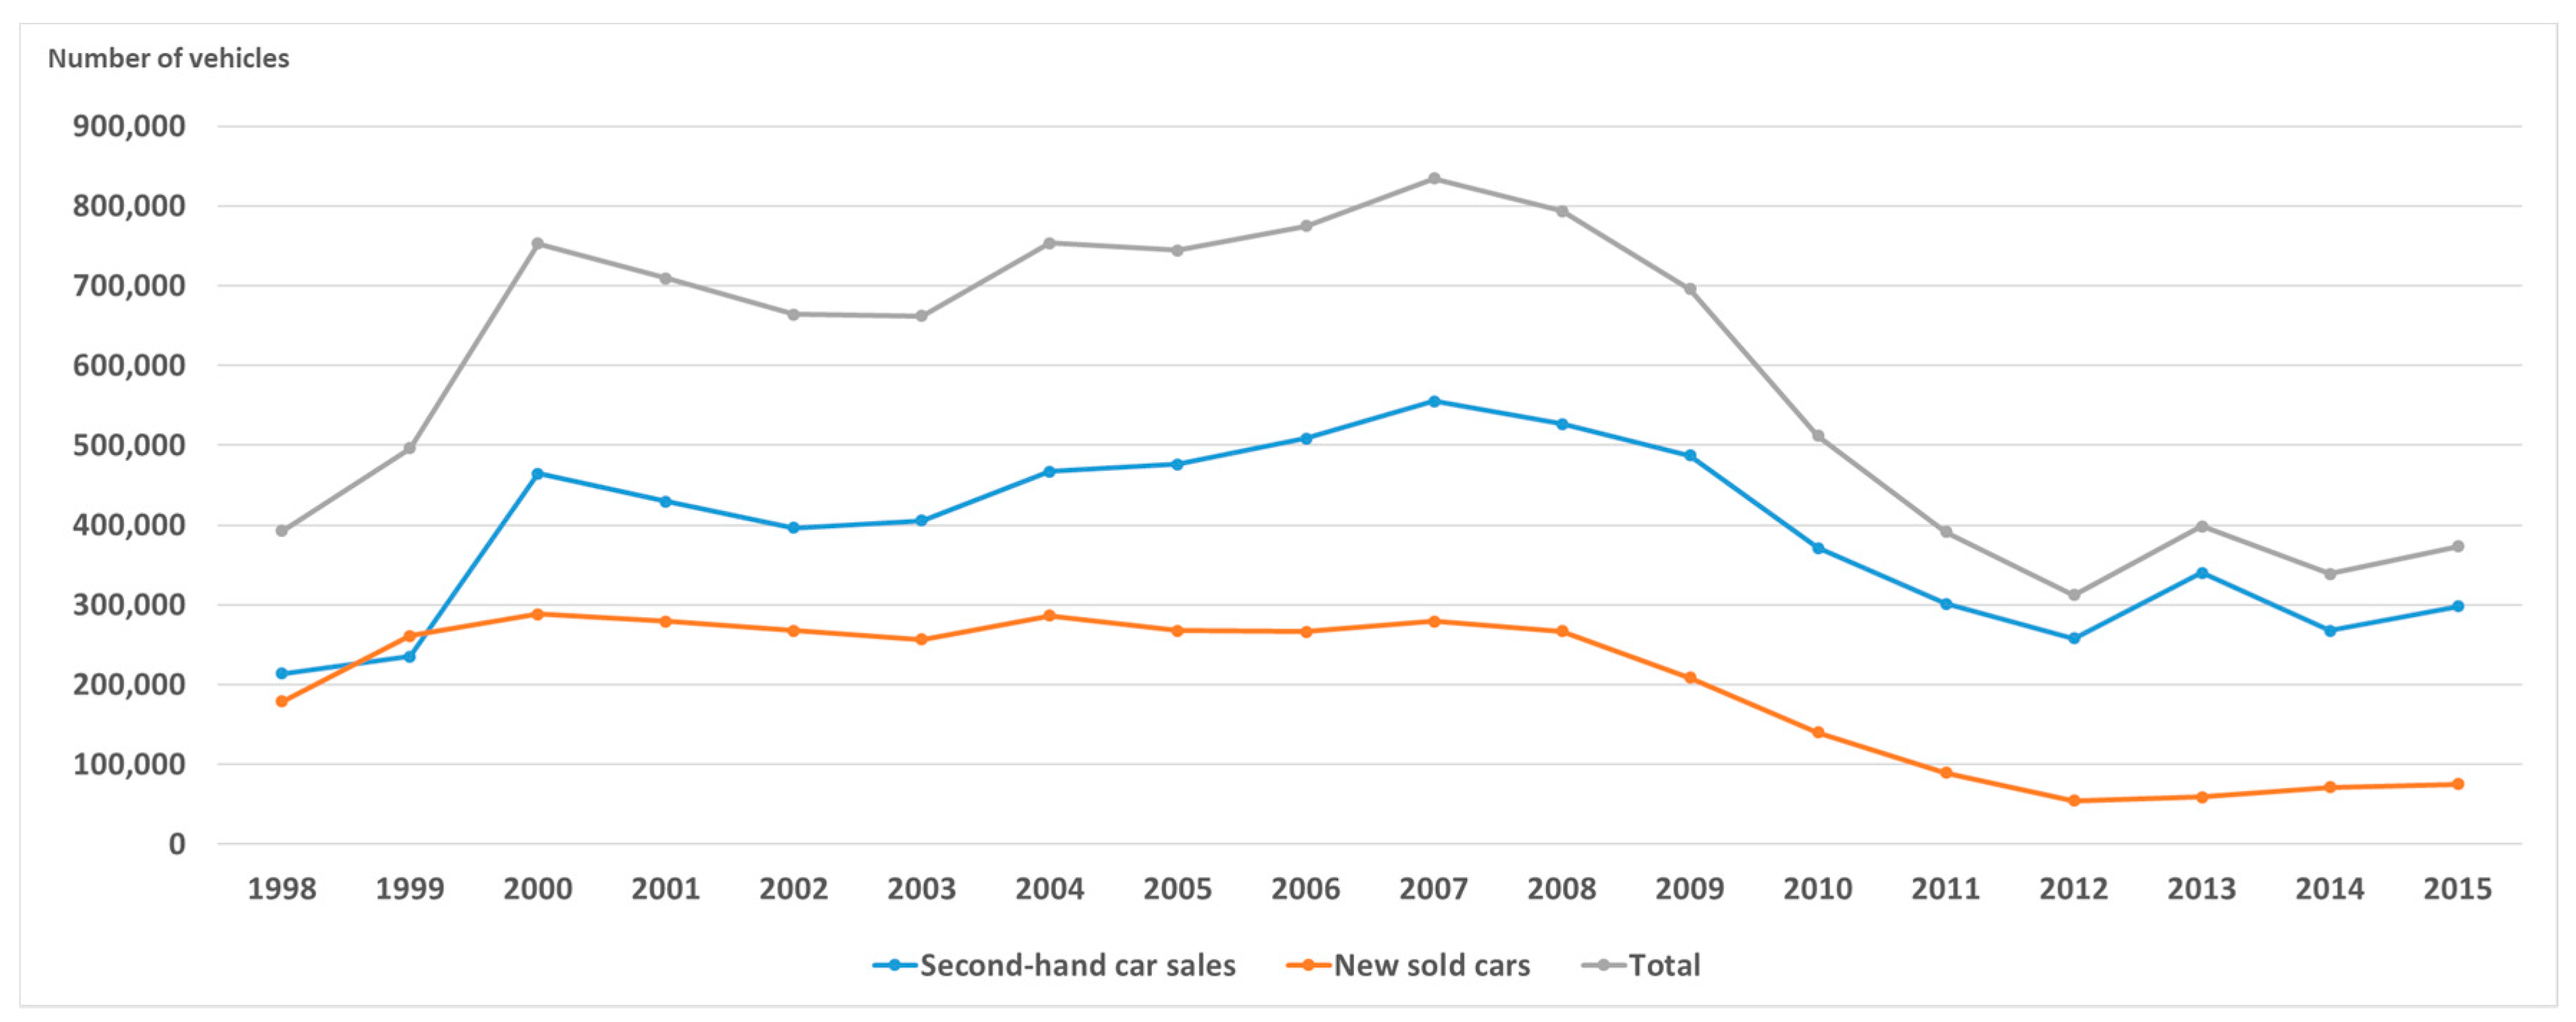
Figure 2.
Transport fuels consumption (in tonnes) during the period of 2009–2014 [28].
Figure 2.
Transport fuels consumption (in tonnes) during the period of 2009–2014 [28].

Figure 3.
Road fuel excise duties in EU countries—data for July 2016 [29].
Figure 3.
Road fuel excise duties in EU countries—data for July 2016 [29].
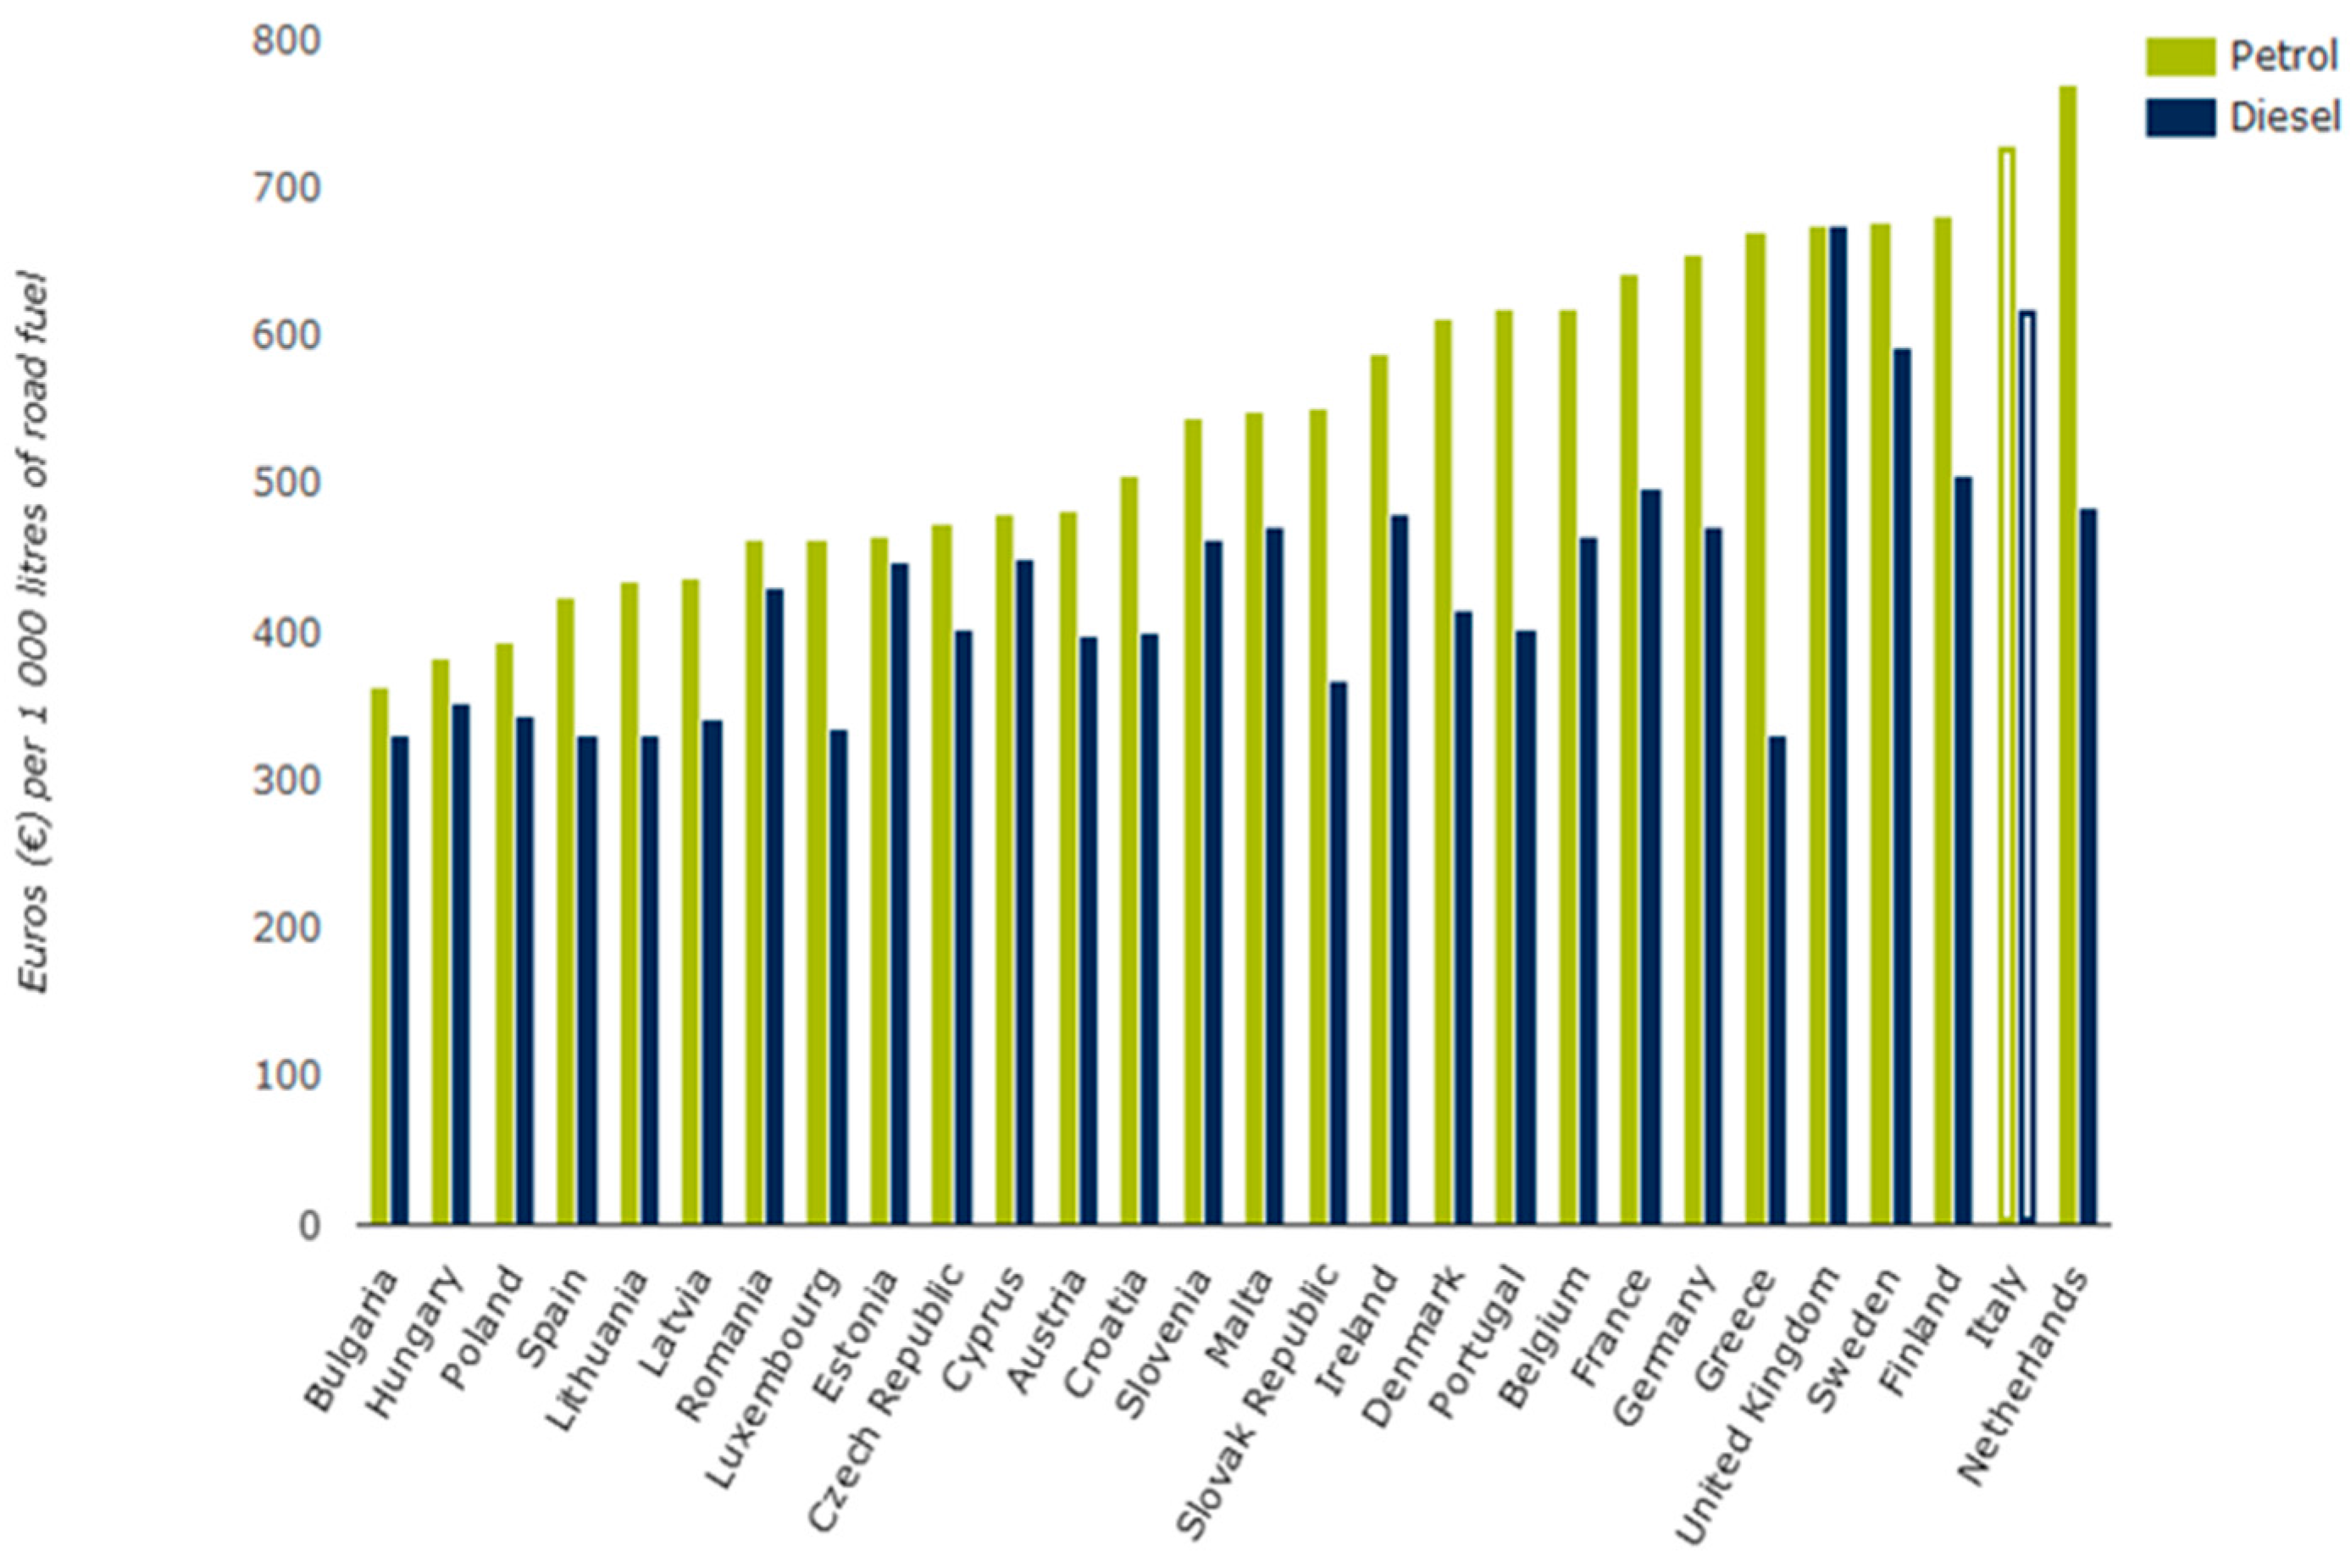
Figure 4.
Fuel prices for the period of 1990–2016 [18].
Figure 4.
Fuel prices for the period of 1990–2016 [18].
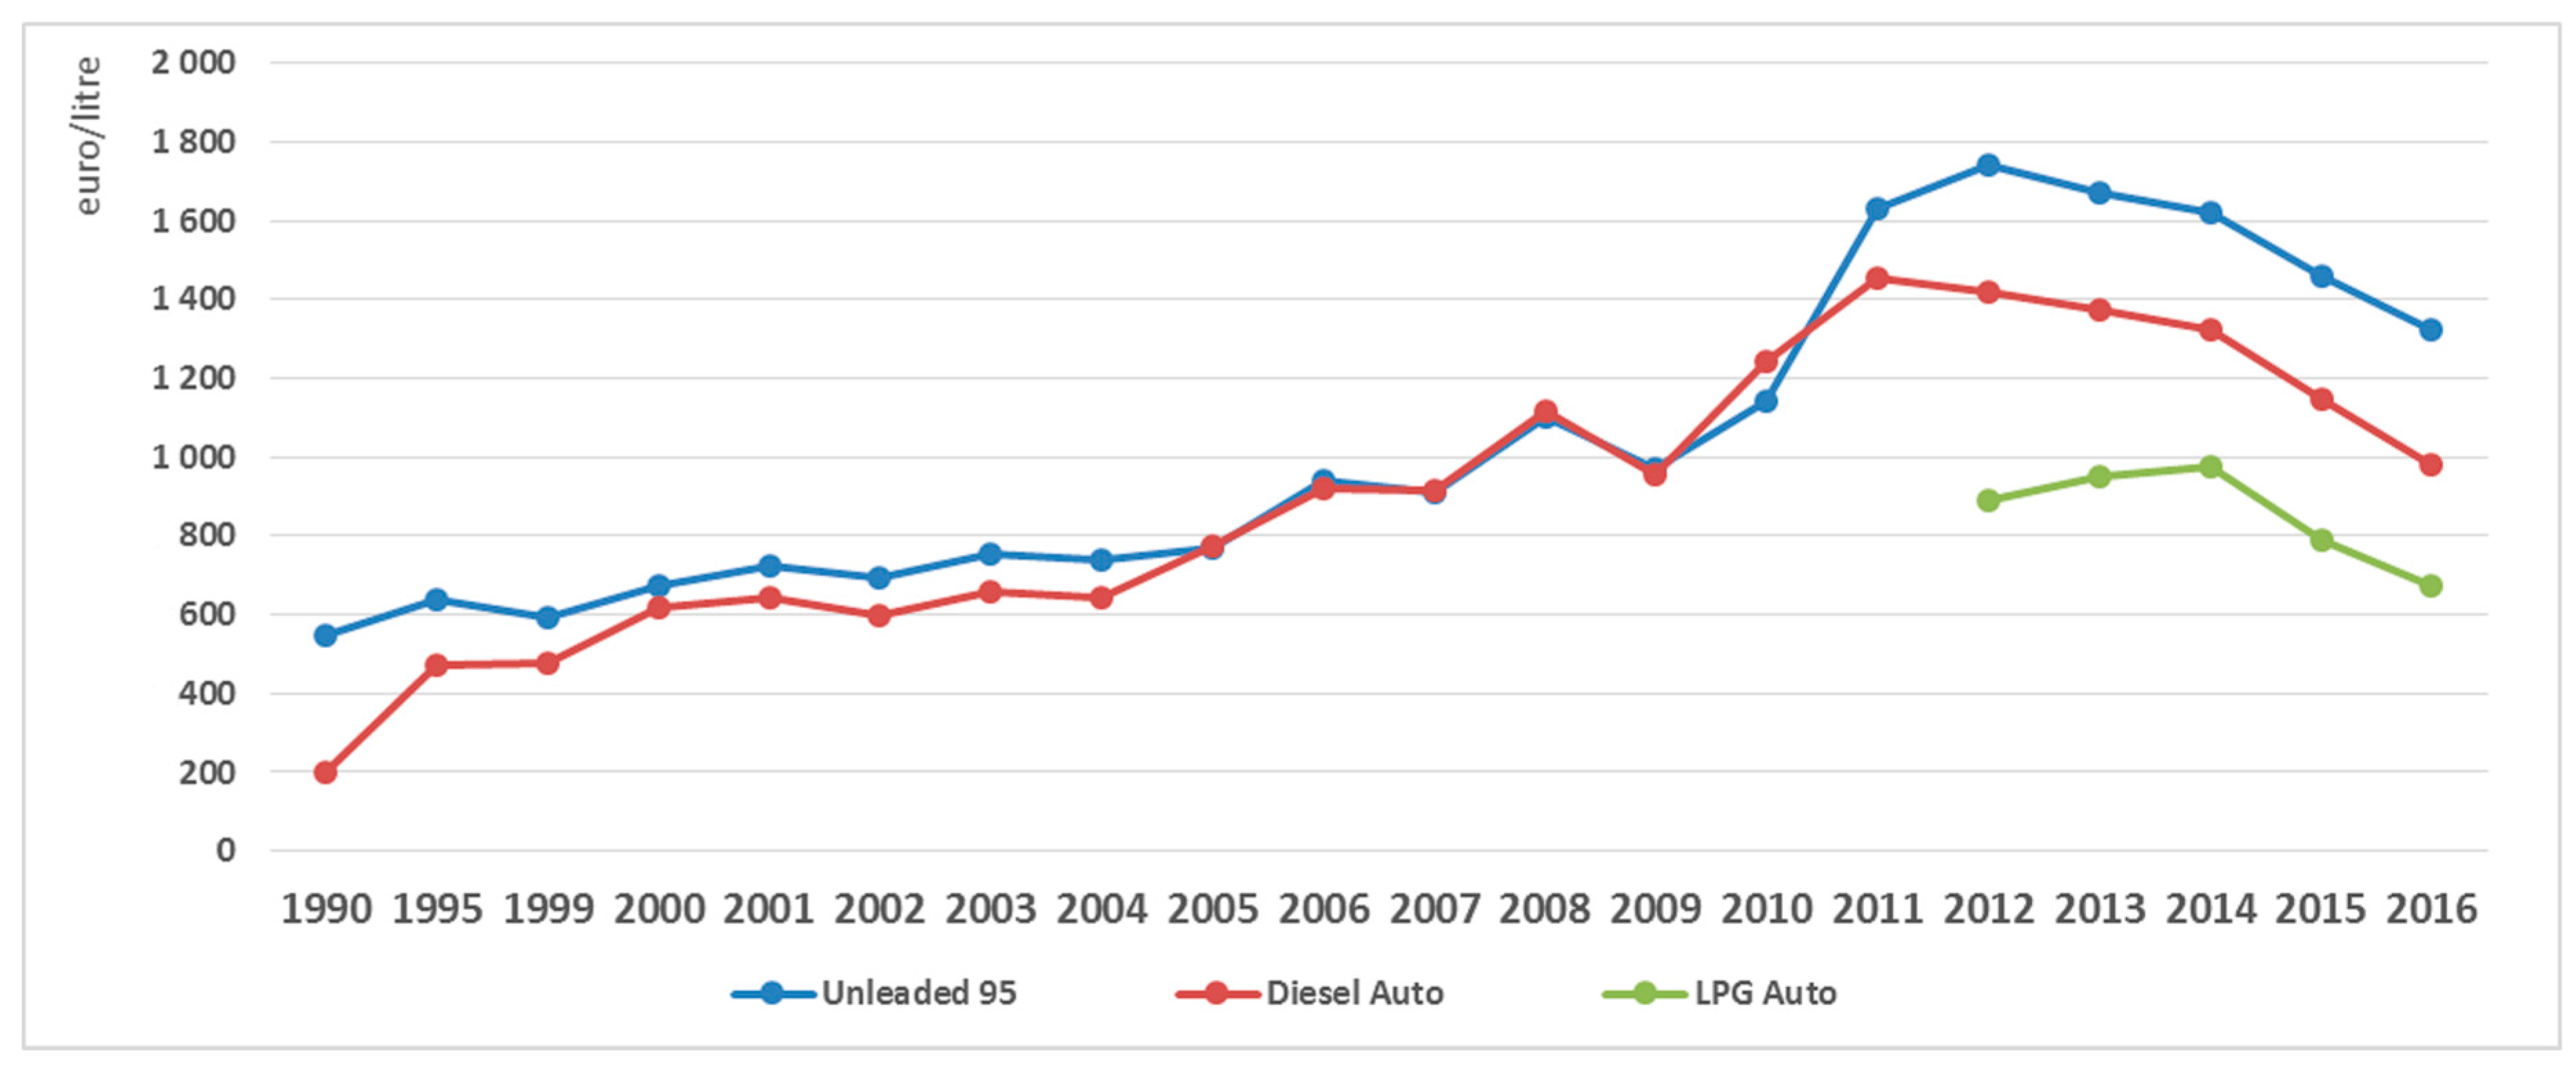
Figure 5.
Number of new cars sold vs. net national disposable income.

Table 1.
Independent variables of the model under study.
| (y) CAR | Number of new cars sold |
| (x1) INC | Net disposable income per capita expressed in € |
| (x2) FP | Price of fuels, expressed in €/lt |
| (x3) IR | Inflation rate expressed in Consumer Price Index (CPI) |
| (x4) UR | Unemployment rate expressed in % of population |
| (x5) Lt | Dummy variable of loans directed to car market |
| (x6) Rt | Dummy variable of registration taxes |
| (x7) Ct | Dummy variable of economic crisis |
| e | Error term |
Table 2.
Correlation matrix of the model under study.
| INC | FP | IR | UR | Lt | Rt | Ct | CAR | |
| INC | 1 | |||||||
| FP | −0.81471 | 1 | ||||||
| IR | 0.812837 | −0.56513 | 1 | |||||
| UR | −0.97917 | 0.892077 | −0.80455 | 1 | ||||
| Lt | 0.529444 | −0.75408 | 0.429013 | −0.58677 | 1 | |||
| Rt | 0.529444 | −0.75408 | 0.429013 | −0.58677 | 1 | 1 | ||
| Ct | −0.86962 | 0.87378 | −0.53147 | 0.864982 | −0.72008 | −0.72008 | 1 | |
| CAR | 0.90256 | −0.94529 | −0.63659 | −0.92704 | 0.770235 | 0.770235 | −0.95852 | 1 |
Table 3.
Correlation matrix of model under study.
| Model | Collinearity Statistics—VIF | Autocorrelation Statistics—DW |
|---|---|---|
| Constant | 1.127 | |
| INC | 2.608 | |
| FP | 7.973 | |
| IR | 5.474 | |
| UR | 3.947 | |
| Lt | 1.000 | |
| Rt | 2.645 | |
| Ct | 5.474 |
Table 4.
Model’s parameters.
| Variables | Coefficients | T-stat |
|---|---|---|
| INC | 0.480 | 3.15 * |
| FP | −17.75 | −4.26 * |
| IR | −0.11 | −4.16 * |
| UR | −11.23 | −2.55 * |
| Lt | 2.8 | 2.54 * |
| Rt | 11.25 | −2.69 * |
| Ct | −7.64 | 4.6 * |
| Intercept | 52.86 | 3.62 * |
| F-Stat | 68.083 | |
| R2 | 0.877 | |
| Adjusted R2 | 0.857 | |
| df | 13 |
* denotes statistical significance in 5% level or higher.
© 2018 by the author. Licensee MDPI, Basel, Switzerland. This article is an open access article distributed under the terms and conditions of the Creative Commons Attribution (CC BY) license (http://creativecommons.org/licenses/by/4.0/).
Share and Cite
MDPI and ACS Style
Nanaki, E.A. Measuring the Impact of Economic Crisis to the Greek Vehicle Market. Sustainability 2018, 10, 510. https://doi.org/10.3390/su10020510
AMA Style
Nanaki EA. Measuring the Impact of Economic Crisis to the Greek Vehicle Market. Sustainability. 2018; 10(2):510. https://doi.org/10.3390/su10020510
Chicago/Turabian StyleNanaki, Evanthia A. 2018. "Measuring the Impact of Economic Crisis to the Greek Vehicle Market" Sustainability 10, no. 2: 510. https://doi.org/10.3390/su10020510
Note that from the first issue of 2016, this journal uses article numbers instead of page numbers. See further details here.