Abstract
Households’ food access remains a concern primarily in rural households in lower- and middle-income countries. The purpose of this study is to measure food access and to identify the coping strategies in indigenous households of the communities of Sierra Tarahumara in Mexico. The representative sample was made up of 123 households from 38 communities. The survey was conducted face to face during the winter season between February and March 2015. Since all respondents only speak the Tarahumara language, authors were assisted by translators. The level of access to food was low in 54.47% of households. The main coping strategies used by households were rationing and augmenting short-term household food availability. Bivariate analyses were used, with Chi-square () test suggesting that coping strategies associated with food access included: reliance on less expensive foods, purchasing food on credit, limiting portion size at meal times, skipping meals, and restricting consumption of adults to secure children’s intake. One-way analysis of variance (ANOVA) test indicated that the income derived from various households are identical across all food access levels. We conclude that the indigenous households did experience difficulties in obtaining food.
1. Introduction
“Food security exists when all people, at all times, have physical and economic access to sufficient, safe and nutritious food that meets their dietary needs and food preferences for an active and healthy life” [1]. Unfortunately, food insecurity has been shown to affect many dimensions of well-being as a form of deprivation [2]. Around the world, hundreds of millions of families are trapped in a cycle of hunger (795 million), mainly in rural areas [3,4].
“Fundamentally, poverty is a denial of choices and opportunities, a violation of human dignity. It means lack of basic capacity to participate effectively in society. It means not having enough to feed and clothe a family, not having a school or clinic to go to, not having the land on which to grow one’s food or a job to earn one’s living, not having access to credit. It means insecurity, powerlessness and exclusion of individuals, households and communities. It means susceptibility to violence, and it often implies living on marginal or fragile environments, without access to clean water or sanitation” [5]. Extreme poverty rates have been cut by more than half since 1990. However, 767 million people live below the international poverty line of $1.90 a day, one in five people in developing regions [6].
In Mexico between 2012 and 2014, the population suffering from poverty increased from 53.3 to 55.3 million people, representing a raise of approximately 2.0 million people. The percentage of the population living in poverty in rural and urban areas by 2014 was 61.1 and 41.7 percent respectively [7]. Poverty is primarily concentrated in rural and marginal areas where indigenous people tend to live [3,8,9]. The lack of access to food affected 28.0 million people, and of these, 2.9 million people residing in largely indigenous municipalities [7]. These statistics reflect the impact that the condition of poverty has on food security either because the quality or quantity of the food they always eat has decreased or because they have not eaten for an entire day owing to inadequate income [10]. The poverty increases the likelihood of food insecurity [11,12]. One of the reasons why people may not have access to food even when enough is available in the aggregate is that there is no guarantee that a market economy will generate a distribution of income that provides enough income for all to purchase the food they need [13]. The challenge to provide food security for all it involves not just ensuring the availability of adequate food in total, but that all people have access, at all times, to safe, nutritious food. Reducing poverty is a key element in a policy for food security, because poor people spend three quarters of their income on staple food, leaving them vulnerable to high food prices, and many poor people obtain much of their income from farming, leaving them vulnerable to declines in agricultural output. Policies and projects that increase the incomes could be successful in enhancing food security of low-income households [11,13].
The Mexican Constitution recognizes indigenous people as an essential component of the nation, as well as their right to the public use of their languages and customs, whether they live in the countryside or in the city. However, at present, the people who belong to indigenous communities suffer from various forms of social disadvantages that leave them behind the rest of the population [14]. The Mexican National Commission of Indigenous Peoples Development considers an indigenous person as someone living in a household whose head of the family, spouse and/or an ascendant self-identifies as a speaker of an indigenous language [8,9,14].
Food insecurity is one of the most important challenges in Mexico. Monitoring food security can be useful to identify population subgroups or regions with particularly severe conditions [15]. For this reason, methodological tools have been developed to measure the state of food insecurity at household level. The methodology, called “Months of Adequate Household Food Provisioning (MAHFP)”, developed by the FANTA (Food and Nutrition Technical Assistance) Project [16], allows to identify food access levels by counting the months in which a household was unable to provide adequate food. This tool captures changes in the capacity of the household to address vulnerability in such a way, that guarantees a supply above a minimum level throughout the year as well as, to identify the population’s food deficiencies or excesses. It also provides the baseline for interventions that improve the food consumption in households [17,18,19].
In addition, households that are vulnerable to shocks such as poverty and food insecurity may develop different temporary or permanent measures or defense mechanisms in order to survive in the absence of food and economic resources. These mechanisms are considered as strategies for coping with food insecurity that can go from dietary changes to permanent migration [20,21,22,23].
In general, being indigenous in Mexico carries a high probability of being poor and subsequently, food insecure [24]. Among the indigenous communities most seriously affected we can find the ones from the Sierra Tarahumara, which are known for being the Mexico’s poorest citizens, with lower development and greater indigenous inequality [8]. For this reason, the objective of this study was to measure food access and to identify the coping strategies in indigenous households of communities of the Sierra Tarahumara in Mexico.
2. Material and Methods
2.1. Location
This research was carried out in the Sierra Madre Mountain Range, also known as the Tarahumara region, which is located in the northern state of Chihuahua [25,26,27]. The ecology of the region consists of a system of deep subtropical canyons, alternating with high mountains up to 3300 m above sea level where around 15 per cent of Mexico’s national forest surface lies [28]. It is also an area of cultural diversity, being home to four indigenous groups: Rarámuris or Tarahumara, Pima, Guarojío and Tepehuanes. The biggest group is Rarámuri, one of the largest groups of indigenous peoples in Mexico [29]. The high poverty levels in the Tarahumara region show how the indigenous population is systematically excluded from access to health services and quality public service, land management benefits and access to income, when compared with the non-indigenous population [25,26,28]. Despite the importance of these indigenous communities, this is the first study performed to determine food access throughout the months of adequate household food provisioning (MAHFP) of the communities located in the Sierra Tarahumara.
2.2. Data Collection
The present research was household-based and cross-sectional. The selection of indigenous communities was made from a list of communities provided by the National Institute of Statistics and Geography of Mexico [30], and were classified according to the distance to the development centre, in this case, the city of Creel (0–3 km, 3–6 km, 6–9 km y 9–12 km). The representative sample was 123 surveys, based on a total of 337 households, from 38 communities, with a confidence rate of 95 percent and a precision rate of 7 percent. Data was collected through household-based face-to-face interviews using a pre-tested coping strategy interview schedule along with experts’ opinion. The authors were assisted by translators from the area. The survey was conducted in February and March 2015 (winter season). The participants were females of the household who were involved in cooking and purchasing food and were therefore aware of household food insecurity conditions. Prior to data collection, they gave their consent to participate in the study. They were also informed that their identity would be kept confidential. The surveys were distributed on different weekdays and different times of the day in order to ensure that every household had the same probability of being surveyed. The ethical approval of this research was given by the Research Council of the Centro de Extensión e Innovación Rural del Noroeste (CEIR) of the Universidad Autónoma de Chihuahua, Mexico.
2.3. Questionnaire
The survey consisted of the following questionnaires: (a) Socio-demographics and household characteristics; (b) MAHFP, through which respondents were asked to identify the months (during the last 12 months) that they did not have access to enough food to meet their needs [16]; and (c) Coping strategies adopted by households to prevent food insecurity. The coping strategy questionnaire was created using different bibliographic references [2,22,31,32], and by visiting indigenous communities during preparatory stage (the pilot test of the survey).
2.4. Analysis of the MAHFP
To calculate the months of Adequate Household Food Provisioning (MAHFP) indicator, a sum is made for each household in the sample: twelve months minus the total number of months in the previous 12 months in which the household was unable to meet its food needs. The applicable values to the months between the letter A and L will be “0” or “1”.
Second, an average is calculated for all households that participated in the sample.
Third, we considered a logical categorization of low, moderate and high food access to be ≤9, 10–11, and 12 respectively (12: a higher score represents a household that has more consistent food access all year round, and ≤9: low food access, implying at least a quarter of the year with food access problems) [16,19].
2.5. Coping Strategies’ Classification
Food insecure households often use four groups of coping strategies to deal with food insecurity [22,31,32]: (1) Rationing or managing the shortfall strategies (limited portion size at meal times; skip meals and restricted consumption of adults so small children can eat) are the most common; (2) Decreasing number of household members (sent household members to eat elsewhere); (3) Dietary changes (rely on less expensive food). (4) Increasing short term household availability of funds (borrow food from a friend or relative; purchased food on credit; send household members to beg; gather wild food, hunt, or harvest immature crops; consume seed stock held for next season; make handicrafts to raise money for food; the household head migrates to work) (Table 1).

Table 1.
Descriptive analysis.
2.6. Statistical Analysis
The first step was to identify the variables that are candidates to better explain food access (Table 1). In the second step, the Chi-square () test was used to examine associations of variables of the coping strategies by food access levels (MAHFP score category). Also, we used the contingency coefficient, which is a measure of association based on chi-square. The value ranges between 0 and 1, with 0 indicating no association between the row and column variables, and values close to 1 indicating a high degree of association between the variables. It is important to note that all the above variables are nominal or categorical variables. The null hypothesis is that no relationship exists between variables [33,34]. Finally, this study presents the empirical analysis using the one-way analysis of variance (ANOVA) approach. It was used to examine the association of the continuous variables (income, age, size of the households) with food access levels. The ANOVA procedure uses an F-test with (k−1) and (N−k) degrees of freedom, where k is the number of groups and N is the total number of observations. The null hypothesis is that these sample means of continuous variables from various households are identical for all the food access levels. Levene’s statistic was used, which tests the null hypothesis that several sample variances are equal [33,34]. This statistical analysis was performed using the software SPSS®, version 20.0 (IBM, Armonk, NY, USA).
3. Results
3.1. Descriptive Analyses
3.1.1. Socio-Demographics and Household Characteristics
In our survey sample among indigenous communities of Sierra Tarahumara of the Mexican State of Chihuahua, men run 65% of the households and women 35%. On average, a household is composed of 4.3 household members. The average age of the household head for indigenous communities of Sierra Tarahumara was 40.7 years old. Furthermore, household heads have a generally low level of education (23.58% with no studies and 61.79% with only elementary education). They live, mainly, in a family status of non-marital cohabitation (57.72%) and the income per household is 2199.92 Mexican pesos. It was observed that the households of these communities do not have access to an improved installation of safe water. Also, 70.73% use water to cook and drink obtained from pits and 29.27% use water taken from rivers and springs. In terms of sanitation, only 30.89% of people use the bathroom as type of sanitation facility, whereas 69.11% have their bowel movements outdoors. In addition, the 82.11% are not connected to an electricity network. Also, 54.47% of the households had between 1 and 2 hectares of land; 21.95% of the households were landless. However, 66.67% are beneficiary of the Prospera conditional cash transfer (Table 1).
3.1.2. Food Access (as Measured by MAHFP)
The MAHFP provides an indication of households’ access to food by providing information on the months in which households have food during the year. Figure 1 displays the months of provisioning, showing that in no month all surveyed households have enough food. May was the month in which the highest number of households (57.72%) were food insecure, followed by January (56.91%), February (55.28%), March (52.03%), and December (49.59%); more than 50% of households reported that they do not have adequate food quantities. The month with the highest food supply is September, with only 16.26% of households suffering some form of food deprivation. December, January, February and March are the winter months with little food available from gardens and plots in this community.
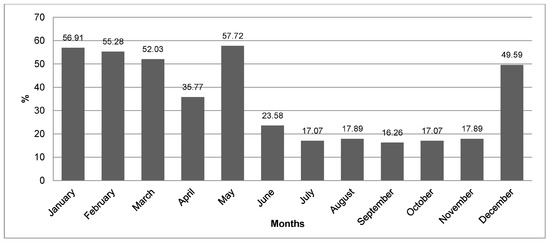
Figure 1.
Percentage of households experiencing hunger over a year. Note: (n = 123). Source: Own elaboration with information obtained from surveys.
Table 1 shows that the level of access to food is low in 54.47% of households, while 39.84% has moderate access, and only 5.69% of households surveyed reported having no difficulty in accessing food, obtaining food for their household members in the past year (high food score access 12). On average, MAHFP was 7.83, which means that the sampled population of households has, on average, low access to food (range ≤9).
3.1.3. Coping Strategies
As indicated, this study was carried out during the winter season, when food insecurity is most acute. The households used several coping strategies to mitigate the effects of food shortage (shown in Table 1 and plotted in Figure 2). The main coping strategies used by households were those related to the group of ‘food rationing’: skipping meals (56.10%), restricting consumption of adults to secure small children’s intake (52.85%), and limiting the portion size at meal times of the whole family (49.59%). This was followed by the coping strategies that belong to the group of ‘augmenting short-term household food availability’: making handicrafts for cash to buy food (45.53%), consuming seed stock held for next season (41.46%), the household’s head migrating to work (39.84%), and the household’s head engaging casual labor (34.15%). The least commonly employed strategies were sending household members to beg and gathering wild food, hunting, or harvesting immature crops.
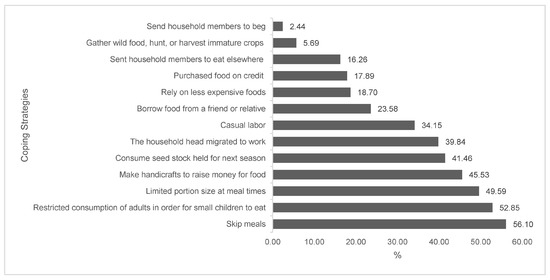
Figure 2.
Coping strategies used by households. Note: (n = 123). Source: Own elaboration with information obtained from surveys.
3.2. Results of the Statistical Analysis
By using cross-tabulation procedures and Chi-square tests, we investigated the relationship between coping strategies and food access levels. The variables of the coping strategies associated with food access included: reliance on less expensive food (p < 0.01), purchasing food on credit (p < 0.05), limiting portion size at meal times (p < 0.05), skipping meals (p < 0.10), and restricting adults’ consumption to secure small children’s intake (p < 0.10). The only household variable characteristic that was significantly associated with food access levels was the access to bathroom (p < 0.05). There was no significant association between the following variables of the coping strategies and food access levels: borrowing food from a friend or relative, gathering wild food, hunting, or harvesting immature crops, sending household members to eat elsewhere, consuming seed stock held for next season, the household head migrating to work, occasional job and sending household members to beg (Table 2).
Table 2.
Bivariate associations between food access levels (as measured by Months of Adequate Household Food Provisioning (MAHFP)), socio-demographics and household variable characteristics and variables of the coping strategies.
On the other hand, the ANOVA indicated that the null hypothesis cannot be rejected, this is that the population’s means of continuous variables (income, age and size of households) derived from various households, are identical across all food access levels. Levene’s statistic showed normality in all these continuous variables (p > 0.05) (Table 2).
4. Discussion
In terms of the socioeconomic situation, our results can be compared to other investigations related to households’ food access. Legwegoh and Hovorka [35], found in Gaborone, Botswana, that the households were composed, on average, of 4.4 members; the average age of the head of household was 44.80 years old; around 20% of the heads of household did not have formal education and 50% had basic education; and 15% of the heads of household reported being employed on a part-time basis. For their part, Thorne-Lyman et al. [36], in the rural area of Bangladesh, they found that the size of the household was 5.7 members. More than 90% of the households had <1 hectare of land; most of the households were landless. Slightly more than half of the heads of household had received some type of formal education and reported having been short-term employed. These sampled populations have similar characteristics to ours.
Regarding the measurement of the food access in the households, the MAHFP was used, a methodology proposed by Swindale and Bilinsky [16]. Our findings indicate that in all months of the year the households do not have enough food, mainly during January, February, March, May and December. However, these results do not match with those reported by Leah et al. [19] who in three Central Andean metropolitan, peri-urban regions (Cochabamba, Bolivia; Pillaro, Ecuador; Huancayo, Peru) found that 41% of households surveyed do not experienced any difficulties in obtaining food for their home in the last 12 months (MAHFP score 12). In the work of De Cock et al. [17] carried out in the rural areas of Limpopo province, South Africa, showed that households experienced hunger, the period ranged from 1 to 4 months, with the largest number of households suffering from one or two months of food insecurity (13.2% and 10.2%, respectively). January was the month in which the highest number of households (25.9%) experienced hunger, followed by June (17.2%), February (16.2%), July (15.5%) and December 15.2%). The proportion of households reporting difficulties in obtaining food for their homes for 3 months or more in the last 12 months was 18.6%. In our work, we found that households have low access to food (7.83 on average, range ≤9). These findings are lower than those obtained by De Cock et al. [17], at 10.28, within the range of moderate food access (10–11).
In the present study, we found that the coping strategies used to deal with indigenous household food insecurity were focused on two main groups of strategies, rationing and the group of increased short-term household food availability. This finding was consistent with previous studies done in other countries. In the research Ngidi and Hendriks [32] performed at Jozini, a rural Municipality in South Africa, they found that relying on less preferred and/or inexpensive food was the most commonly employed strategy (88.4%)—followed by borrowing food or money for food and begging from friends or relatives for food (85.5%, in both). Grobler [37] found in Bophelong, a low-income neighborhood in South Africa, that the coping strategies used by most of the households in the sample is relying on less expensive commodities, followed by buying only necessities, sticking to budget, limiting portions and skipping meals. For their part, the work of Chagomoka et al. [38], carried out in Ghana, pointed out that households used coping strategies more frequently, such as skipping meals the whole day, borrowing food or money to buy food, consuming seed stock and purchasing food on credit. Shariff and Khor [2] found, in a rural community in Malaysia, that borrowing money to buy food, receiving food from family members, relatives and neighbors and reducing the number of meals seemed to cushion the food insecure households from experiencing food insufficiency. Shisanya and Hendriks [39] found in Maphephetheni uplands, South Africa, that the most used coping strategies by households were eating smaller meals than they needed (83% of the households) and eating fewer meals in a day (91% of the households).
We showed that there was a statistically significant association between food access levels and coping strategies (relying on less expensive food; purchased food on credit; limited portion size at meal times; skipped meals and restricted consumption of adults in order for small children to eat). In this way, the results suggest that coping strategies can help to determine the food access levels and identify the most vulnerable households.
Overall, despite failing to find significant relationships between the socio-demographics and household variable characteristics and food access levels, our comparison across measures reveals that indigenous households were food insecure. Servan-Mori et al. [9] and CONEVAL [14] in Mexico found that municipalities with a higher proportion of indigenous population have less availability of basic services such as durable homes floor material, access to clean water and sanitation and medical insurance. According to SHCP [40], the minimum wage in Mexico was 2103.00 Mexican pesos per month and contrasts with the results of this research, because most of the heads of households had low-income. Also, CONEVAL [14] indicated that the precariousness of income is one of the most dramatic and particular characteristics of poverty in individuals with some ethnic trait. Servan-Mori et al. [9] indicated that the distribution of household’s expenditure showed that the indigenous populations are disadvantaged economically. They also showed that, regardless of the type of poverty index estimated and the different thresholds of the poverty line, indigenous population consistently have greater poverty index values than non-indigenous populations. In addition, low-income families have been forced to cut their food budgets, which has increased the purchase of cheaper and less healthy food products [41,42]. On the other hand, it is worth mentioning that no significant difference was found between the Prospera variable and food access levels. According to FAO et al. [3], Servan-Mori et al. [9] and Attanasio et al. [43], Prospera conditional cash transfer (before Oportunidades) has shown positive effects on basic health, nutrition, and education indicators among disadvantaged groups. However, Sonnino and Hanmer [44], Peña [45] and Servan-Mori et al. [9] found that the program requirements applied on indigenous families are often incompatible with their migration patterns tied to family and community obligations. Moreover, Prospera implementation is planned as if beneficiaries were culturally homogeneous, but they are not. Some marginalized indigenous households have not been included in the program due to the remote location of the communities where they live, which is against the Mexican Constitution. According to the Constitution, all citizens are equal regardless of where they live [14,45]. This leads us to think that Prospera may have failed to alleviate poverty significantly in indigenous groups.
5. Conclusions
This study investigated the food access and coping strategies of households in the indigenous communities of Sierra Tarahumara in Mexico. The MAHFP, as food access indicator and coping strategies, was used to determine the status of households. Chi-square and ANOVA tests were used to determine association between food access levels and coping strategies that were used by households.
It was found that all our surveyed households do not have access to enough food in any month. The month with the greatest supply problem was May with 57.72% of households suffering food insecurity, and the one with the highest supply was September, with 16.26% of the households suffering from food insecurity. In addition, households were found to have a low level of access to food (54.47%). Therefore, it is concluded that all surveyed households experienced some difficulties in obtaining food during the 12 months of 2014. Also, the results reported that the households used various strategies to address the problem of access to food, including, eating cheaper food, limiting portion sizes at meals and reducing meals for whole days, among others. From the analysis, one might think that a smaller variety of food was served in the home, since food access is limited. This is a very critical issue, because it is associated with negative health consequences.
The use of the MAHFP indicator and coping strategies to measure food insecurity has low cost, has a simple procedure, it is comprehensible by everyone and can be used in combination with other measures of food insecurity. Coping strategies may vary due to different geography, economy, social and environmental circumstances. For this reason, the type of coping strategies used should be validated against other indicators, such as poverty measures, nutritional status and food consumption. Knowledge on such information will facilitate efforts to influence public policies and to improve the situation of household food insecurity among rural the areas mainly within indigenous communities.
The limitation of this study is that it consisted of a rather small sample that may not be representative of the general population. Despite this limitation, this study constitutes an initial baseline to understand the food situation of indigenous households in the Sierra Tarahumara and can be seen as a contribution to the growing body of knowledge in food insecurity among indigenous communities. Food insecurity remains a challenge for Mexico. Thus, hunger eradication should remain a key commitment of decision-makers at all levels. It is suggested that policymakers should consider developing a comprehensive food security strategy framework, focusing on promoting growth in agriculture sector, greater social inclusion and improving food security and nutrition of these indigenous communities.
Acknowledgments
The fieldwork was supported by the Mexican Ministry of Agriculture, (in Spanish: Secretaría de Agricultura, Ganadería, Desarrollo Rural, Pesca y Alimentación, SAGARPA), within agreement with the Autonomous University of Chihuahua, (in Spanish: Universidad Autónoma de Chihuahua, UACH) (grant number CONV/UACH/SAGARPA2014). We would like to express our sincere gratitude to all the surveyed communities, their great kindness contributed decisively to the completion of the field work. Also, we are grateful to local leaders of San Ignacio de Arareco, CEIGRAM-UPM, CEIR-UACH and REINU-UACH for their logistic support into this research. Otilia-Vanessa Cordero-Ahiman acknowledges a scholarship for PhD studies from the Secretary of Higher Education, Science, Technology and Innovation of Ecuador (SENESCYT).
Author Contributions
Methodology conception and design: O.V.C.-A., E.S.-E. and A.G. Data acquisition: O.V.C.-A. and E.S.-E. Statistical analysis: O.V.C.-A. and A.G. Technical, administrative and material support: O.V.C.-A., E.S.-E. and A.G. Paper writing: O.V.C.-A. Paper revision: A.G. All authors read and approved the final version of the manuscript.
Conflicts of Interest
The authors declare no conflict of interest.
Funding
Mexican Ministry of Agriculture (SAGARPA), as part of the agreement with the Autonomous University of Chihuahua (UACH), grant number CONV/UACH/SAGARPA2014.
References
- Food and Agriculture Organization (FAO). The Rome Declaration on World Food Security. Popul. Dev. Rev. 1996, 22, 807–809. [Google Scholar]
- Shariff, Z.M.; Khor, G.L. Household food insecurity and coping strategies in a poor rural community in Malaysia. Nutr. Res. Pract. 2008, 2, 26–34. [Google Scholar] [CrossRef] [PubMed]
- Food and Agriculture Organization (FAO); International Fund for Agricultural Development (IFAD); World Food Programme (WFP). The State of Food Insecurity in the World: Meeting the 2015 International Hunger Targets: Taking Stock of Uneven Progress; FAO, IFAD and WFP: Roma, Italy, 2015; pp. 1–54. Available online: http://www.fao.org/3/a4ef2d16-70a7-460a-a9ac-2a65a533269a/i4646e.pdf (accessed on 20 December 2016).
- Food and Agriculture Organization (FAO). The State of Food and Agriculture Social Protection and Agriculture: Breaking the Cycle of Rural Poverty. Rome, 2015. Available online: http://www.fao.org/3/a-i4910e.pdf (accessed on 20 December 2016).
- United Nations. Tolerance United Nations Definition of Poverty. 1998. Available online: https://www.tolerance.org/sites/default/files/tt_poverty_h1.pdf (accessed on 1 February 2018).
- United Nations. Poverty—United Nations Sustainable Development. 2016. Available online: http://www.un.org/sustainabledevelopment/poverty/ (accessed on 1 February 2018).
- CONEVAL. Coneval Informa Los Resultados de la Medición De Pobreza 2014; CONEVAL: Mexico City, Mexico, 2015; Volume 5, pp. 1–30. [Google Scholar]
- Fernández Ham, P.; Tuirán Gutiérrez, A.; Ordorica Mellado, M.; Salas y Villagómez, G.; Camarena Córdova, R.M.; Serrano Carreto, E. Informe Sobre Desarrollo Humano de los Pueblos Indígenas de México 2006 (Versión Electrónica Base 2000). 2006. Available online: http://www.cdi.gob.mx/idh/informe_desarrollo_humano_pueblos_indigenas_mexico_2006.pdf (accessed on 15 December 2016).
- Servan-Mori, E.; Torres-Pereda, P.; Orozco, E.; Sosa-Rubí, S.G. An explanatory analysis of economic and health inequality changes among Mexican indigenous people, 2000–2010. Int. J. Equity Health 2014, 13, 21. [Google Scholar] [CrossRef] [PubMed]
- Shamah-Levy, T.; Mundo-Rosas, V.; Flores-De la Vega, M.M.; Luiselli-Fernández, C. Food security governance in Mexico: How can it be improved? Glob. Food Secur. 2017, 14, 73–78. [Google Scholar] [CrossRef]
- Maitra, C.; Rao, D.S.P. Poverty-Food Security Nexus: Evidence from a Survey of Urban Slum Dwellers in Kolkata. World Dev. 2015, 72, 308–325. [Google Scholar] [CrossRef]
- Wight, V.; Kaushal, N.; Waldfogel, J.; Garfinkel, I. NIH Public Access. J. Child. Poverty 2015, 20, 1–20. [Google Scholar] [CrossRef] [PubMed]
- Martin, W. Food Security and Poverty—A Precarious Balance. World Bank Group, 2010. Available online: https://blogs.worldbank.org/developmenttalk/food-security-and-poverty-a-precarious-balance (accessed on 2 February 2018).
- Consejo Nacional de Evaluación de la Política de Desarrollo Social. La Pobreza en la Población Indígena de México, 2012; Consejo Nacional de Evaluación de la Política de Desarrollo Social: Mexico City, Mexico, 2014; p. 107. [Google Scholar]
- Magaña-Lemus, D.; Ishdorj, A.; Rosson, C.P.; Lara-Álvarez, J. Determinants of household food insecurity in Mexico. Agric. Food Econ. 2016, 4, 10. [Google Scholar] [CrossRef]
- Swindale, A.; Bilinsky, P. Months of Adequate Household Food Provisioning (MAHFP) for Measurement of Household Food Access : Indicator Guide VERSION 4 Paula Bilinsky Months of Adequate Household Food Provisioning (MAHFP) for Measurement of Household Food Access: Indicator Guid. 2010. Available online: http://www.fantaproject.org/sites/default/files/resources/MAHFP_June_2010_ENGLISH_v4.pdf (accessed on 15 November 2016).
- De Cock, N.; D’Haese, M.; Vink, N.; van Rooyen, C.J.; Staelens, L.; Schönfeldt, H.C.; D’Haese, L. Food security in rural areas of Limpopo province, South Africa. Food Secur. 2013, 15, 269–282. [Google Scholar] [CrossRef]
- Frayne, B.; McCordic, C. Planning for food secure cities: Measuring the influence of infrastructure and income on household food security in Southern African cities. Geoforum 2015, 65, 1–11. [Google Scholar] [CrossRef]
- Leah, J.; Pradel, W.; Cole, D.C.; Prain, G.; Creed-Kanashiro, H.; Carrasco, M.V. Determinants of household food access among small farmers in the Andes: Examining the path. Public Health Nutr. 2012, 16, 136–145. [Google Scholar] [CrossRef] [PubMed]
- Frankenberger, T.R.; Spangler, T.; Nelson, S.; Langworthy, M. Enhancing Resilience to Food Insecurity amid Protracted Crisis. Food Insecurity in Protracted Crises: High-Level Expert Forum. 2012. Available online: http://www.fao.org/fileadmin/templates/cfs_high_level_forum/documents/Enhancing_Resilience_FoodInsecurity-TANGO.pdf (accessed on 15 August 2016).
- Anater, A.; McWilliams, R.; Latkin, C. Food Acquisition Practices Used by Food-Insecure Individuals When They Are Concerned About Having Sufficient Food for Themselves and Their Households. J. Hunger Environ. Nutr. 2011, 6, 27–44. [Google Scholar] [CrossRef]
- Maxwell, D.G.; Caldwell, R. The Coping Strategies Index Field Methods Manual; CARE: Atlanta, GA, USA, 2008; Volume 47. [Google Scholar]
- Maxwell, D.; Ahiadeke, C.; Levin, C.; Armar-Klemesu, M.; Zakariah, S.; Lamptey, G.M. Alternative food-security indicators: Revisiting the frequency and severity of “coping strategies”. Food Policy 1999, 24, 411–429. [Google Scholar] [CrossRef]
- Navarrete, F.; Los Pueblos Indígenas de México. Pueblos Indígenas del México Contemporáneo; PNUD: Mexico City, Mexico, 2008; p. 141. [Google Scholar]
- Cordero-Ahiman, O.V.; Santellano-estrada, E.; Garrido, A. Dietary Diversity in Rural Households: The Case of Indigenous Communities in Sierra Tarahumara, Mexico. J. Food Nutr. Res. 2017, 5, 86–94. [Google Scholar]
- Loera-Gonzalez, J. Wellbeing Dimensions and Inter-ethnic Determinants. Ethnopolitics Pap. 2012, 2, 31. [Google Scholar]
- Salmón, E. Kincentric ecology: Indigenous perceptions of the human-nature relationship. Ecol. Appl. 2000, 10, 1327–1332. [Google Scholar]
- Pérez-Cirera, V.; Lovett, J.C. Power distribution, the external environment and common property forest governance: A local user groups model. Ecol. Econ. 2006, 59, 341–352. [Google Scholar] [CrossRef]
- Larochelle, S.; Berkes, F. Traditional Ecological Knowledge and Practice for Edible Wild Plants : Biodiversity Use by the Raramuri in the Sierra Tarahumara, Mexico. Int. J. Sustain. World Ecol. 2003, 10, 361–375. [Google Scholar] [CrossRef]
- INEGI. Censo de Población y Vivienda 2010; Instituto Nacional de Estadística y Geografía (INEGI): Aguascalientes, Mexico, 2010; p. 105. Available online: http://www.inegi.org.mx/est/contenidos/proyectos/ccpv/cpv2010/Default.aspx (accessed on 20 January 2015).
- Gupta, P.; Singh, K.; Seth, V.; Agarwal, S.; Mathur, P. Coping Strategies Adopted by Households to Prevent Food Insecurity in Urban Slums of Delhi, India. J. Food Secur. 2015, 3, 6–10. [Google Scholar]
- Ngidi, M.S.C.; Hendriks, S.L. Coping with Food Insecurity in Rural South Africa: The Case of Jozini, KwaZulu-Natal. Mediterr. J. Soc. Sci. 2014, 5, 278. [Google Scholar]
- Sanyal, P.; Babu, S. Food Security, Poverty and Nutrition Policy Analysis: Statistical Methods and Applications; Academic Press: Cambridge, MA, USA, 2009. [Google Scholar]
- Pérez, C. Técnicas Estadísticas Predictivas con IBM SPSS Modelos; (Primera ed) (Ibergarceta Publicacione SL, ed.); Garceta: Madrid, Spain, 2014; p. 474. [Google Scholar]
- Legwegoh, A.F.; Hovorka, A.J. Assessing food insecurity in Botswana: The case of Gaborone. Dev. Pract. 2013, 23, 346–358. [Google Scholar] [CrossRef]
- Thorne-Lyman, A.L.; Valpiani, N.; Sun, K.; Semba, R.D.; Klotz, C.L.; Kraemer, K.; Akhter, N.; de Pee, S.; Moench-Pfanner, R.; Sari, M.; et al. Household Dietary Diversity and Food Expenditures Are Closely Linked in Rural Bangladesh, Increasing the Risk of Malnutrition Due to the Financial Crisis. J. Nutr. 2010, 140, 182S–188S. [Google Scholar] [CrossRef] [PubMed]
- Grobler, W.C.J. Food insecure household coping strategies: The case of a low income neighborhood in South Africa. Mediterr. J. Soc. Sci. 2014, 5, 100–106. [Google Scholar] [CrossRef]
- Chagomoka, T.; Unger, S.; Drescher, A.; Glaser, R.; Marschner, B.; Schlesinger, J. Food coping strategies in northern Ghana. A socio-spatial analysis along the urban–rural continuum. Agric. Food Secur. 2016, 5, 1–18. [Google Scholar] [CrossRef]
- Shisanya, S.O.; Hendriks, S.L. The contribution of community gardens to food security in the Maphephetheni uplands. Dev. S. Afr. 2011, 28, 509–526. [Google Scholar] [CrossRef]
- SHCP. Cuadro Histórico de los Salarios Mínimos (1982–2016). México, 2016. Available online: http://www.sat.gob.mx/informacion_fiscal/tablas_indicadores/Paginas/salarios_minimos.aspx (accessed on 27 June 2016).
- Ventosa, M.M. Disentangling effects of socioeconomic status on obesity: A cross-sectional study of the Spanish adult population. Econ. Hum. Biol. 2016, 22, 216–224. [Google Scholar] [CrossRef] [PubMed]
- Fiese, B.H.; Gundersen, C.; Koester, B.; Jones, B. Family chaos and lack of mealtime planning is associated with food insecurity in low income households. Econ. Hum. Biol. 2016, 21, 147–155. [Google Scholar] [CrossRef] [PubMed]
- Attanasio, O.; Di Maro, V.; Lechene, V.; Phillips, D. Welfare consequences of food prices increases: Evidence from rural Mexico. J. Dev. Econ. 2013, 104, 136–151. [Google Scholar] [CrossRef]
- Sonnino, R.; Hanmer, O. Beyond food provision: Understanding community growing in the context of food poverty. Geoforum 2016, 74, 213–221. [Google Scholar] [CrossRef]
- Guillermo de la Peña, P. Cultural Shock and Social Policy: Indigenous Urban Families and the Oportunidades Program; Columbia University: New York, NY, USA, 2014; pp. 1–18. [Google Scholar]
© 2018 by the authors. Licensee MDPI, Basel, Switzerland. This article is an open access article distributed under the terms and conditions of the Creative Commons Attribution (CC BY) license (http://creativecommons.org/licenses/by/4.0/).