Brand Equity of a Tourist Destination

1
Department of Hotel Management, Jeju International University, Jeju City 63309, Korea
2
Division of Tourism & Hospitality, Ritsumeikan Asia Pacific University (APU), Beppu 874-8577, Japan
*
Author to whom correspondence should be addressed.
Sustainability 2018, 10(2), 431; https://doi.org/10.3390/su10020431
Submission received: 18 December 2017
/
Revised: 23 January 2018
/
Accepted: 25 January 2018
/
Published: 7 February 2018
(This article belongs to the Section Economic and Business Aspects of Sustainability)
Abstract
:In the current climate of severe competition among tourist destinations, the importance of brand equity in tourism marketing is increasing. This study looks at the impact of branding in relation to the largest group of inbound overseas tourists to South Korea, the Chinese. Data for the current study were obtained from a survey of tourists visiting Seoul from the Greater China region, including Mainland China, Hong Kong, Macao, Taiwan, and the Chinese living in Southeast Asia. The survey was conducted in popular sightseeing spots, four and five-star hotels in the Seoul Metropolitan Area, and the Incheon International Airport. The respondents were selected randomly, with effort expended to avoid any potential bias in the composition of the sample. Out of a total of 385 distributed questionnaires, 350 (China 191, Hong Kong 71, Taiwan 68, others 20) were selected as valid and finally used in the analysis. The results of this study suggest that price and word of mouth have beneficial effects on perceived quality, publicity, and brand awareness, and advertisement has beneficial effects on brand image. We also found that brand awareness and perceived quality have impacts on brand image, and brand image is related to brand loyalty. This is a pioneering study on the relationships between influencing factors, destination brand equity and its elements, and brand loyalty, with respect to Seoul, South Korea, as a tourism destination for tourists from China.
1. Introduction
Creating and developing a “brand” is one of the core-strategies of tourist destination management [1]. Branding as a concept is applied not only to commodities and companies but also to fields of tourism [2,3,4,5]. Branding of the destination is one of the principal topics in tourism marketing in terms of enhancing differentiation and competitiveness [6,7,8,9,10], but establishing a strong brand has increasingly been of significant concern because of fierce competition between places for visitor expenditures [11,12]. The lack of points of difference between most South Korean tourism destinations has led to deepening competition among them, resulting in the recognition of the importance of brand as an effective method to win markets [13,14,15,16,17]. South Korea (Korea, hereafter) has experienced rapid growth of international tourist arrival numbers in recent years, yet competition with neighboring countries remains fierce. It is now recognized that the branding of Seoul, which is the predominant Korean tourist destination is vital.
The current volume of Chinese outbound tourism worldwide is phenomenal; just under 100 million Chinese people are engaging in international travel every year, making China the world’s largest spender on international tourism at US$128.6 billion in 2013 [18]. The rapid expansion of Chinese tourism is attracting increasing attention from government organizations, tourism investors, and tourism marketers throughout the global tourism industry. Given their close historical relationships, cultural commonality, geographic proximity, and as a large trade partner in other commodities, the Korean Government and Korean tourism organizations are no exception. National and state level tourism organizations are seeking to strategically prepare for economic opportunities associated with Chinese tourists [19].
China has been the overseas country with the largest number of inbound tourists into Korea since 2006 [19]. Researchers have investigated a diverse range of aspects of Chinese tourists overseas including their tourist behaviors [20,21], economic impacts and tourism policies [22,23], their package trips to overseas destinations [24,25], and their future demand for tourism [26,27,28].
Korea has 51 million people, with nearly half living within 100 km of Seoul, the capital city. In 2014, more than 14 million overseas tourists visited Korea and approximately 75% visited the Seoul Metropolitan Area as their destination or as a stopover [19]. With its constantly growing economy, China’s market importance in tourism is continually expanding [29]. In 2014, more than half the overseas tourists who visited Seoul were from the Greater China Region including China, Hong Kong, Macao, and Taiwan. Since China became a core market, the Seoul Municipal Government has targeted more than 40% of its marketing budget to China [30]. However, academic research on the motivations of Chinese tourists visiting Seoul is lacking. It is therefore important to understand Seoul’s brand assets that tourists from Greater China recognize, and based on that understanding, develop a concrete implementation of strategies aiming at the long term sustainable growth of Seoul as a tourist destination. However, in the last couple of decades, the marketing, planning and management of Destination Seoul has not been successful; there have been frequent changes of the catch-phrase (slogan), political interference, lack of creative and efficient planning, and weak awareness from the public [19].
To develop and implement more sustainable, strategic and systematic marketing approaches for any destination, it is important to investigate its brand association and brand equity, especially when targeting a specific group of tourists [8,11,31,32]. However, most of the previous studies that have focused on the brand equity of a tourist destination have been explored at the level of country rather than a particular city. In addition, most studies of brand equity of a tourist destination have not been specifically focused on particular groups of tourists. Their scope has been rather broad and general.
To overcome and complement these limitations of previous studies, this study aimed to provide data to inform tourist management strategies for Seoul, and to assist in the promotion of effective destination branding to Chinese tourists by examining the relationship between brand equity influencing factors, their components, and the creation of brand loyalty. The intention of this paper is to understand the significance of the branding effect of a tourist destination using the example of Greater Chinese tourists visiting the Seoul Metropolitan area in South Korea. The paper discusses the theoretical evolution of brand-related components in a tourist destination focusing on brand equity and brand loyalty. It explains the methodological approach for the study before verifying the research hypotheses. It concludes with suggesting implications for the tourist destination marketer who is particularly aiming at securing a competitive edge in attracting Chinese outbound tourists.
2. Literature Review
2.1. Brand-Related Components in a Tourist Destination
Brand image rises as customer perception of the price fairness of products and services [26,33,34,35,36]. Ooi [35] proposed that the function of tourism destination branding is to create public recognition of a destination, to commercialize that location, to allow that location to compete with other destinations in the market, and to help form tourism experiences. The choice of tourism destination is determined by the brand value of each potential tourism destination, and this is a result of the consideration of the merits and attractions of the various options. The same mechanism governing consumers’ general purchase decision making is applied to destination choices [6,24,37,38,39]. Perceived quality is defined as the elements that make people visit a particular tourism destination, and is the subjective judgment of overall quality [40,41]. When assessing the quality of a tourism destination, the destination’s brand equity can be evaluated based on how well potential tourists recognize it, and whether it is worth visiting [2,9,34,42,43].
Brand awareness is defined as the ability to remember a brand’s logo, and the existence of a degree of intimacy and acquaintance with it [44]. Seo and Lim [45] defined awareness as the extent to which a specific brand is distinguishable among many others. Brand awareness of tourist destinations is also defined as the ability of tourists to recall a specific tourism destination among various locations, and to distinguish it from others [46,47]. The brand image of a tourism destination is a set of associations about that destination which includes feelings generated by a variety of functional attributes and activities that the destination has [33,48].
2.2. Brand Equity
Keller [49] expressed the concept of brand equity based on consumers; brand equity has been defined as a differentiated effect of brand knowledge on consumer responses (consumer perception, preferences, and behavior) to brand marketing activities. Simon and Sullivan [43] defined brand equity as the increments of cash flow to be generated in the future due to the brand, and by utilizing value-based techniques, this can be measured in financial terms. Axelrod [50] also considered brand equity in financial terms as the increase in the amount paid by a specific customer to acquire a particular brand without selecting alternatives that are functionally similar. Yoo, Donthu, and Lee [51] understood brand equity as the difference in the choices made by consumers when comparing branded and non-branded products of the same level; whereas Park [52] defined it as the current value of future benefits resulting from having a brand compared to not having a brand. Baldauf, Cravens and Binder [53], and Kang [13] stated that from the perspective of consumers, distribution channels, participants, and enterprises, brand equity ensures higher revenues and margins compared to non-branded products, and is an aggregate that provides stronger, sustainable, and differentiated advantages compared to competitors. Brand equity has a desirable marketing effect (e.g., high loyalty, market share or revenue) that occurs because a product or service has a brand [8,54]. Table 1 presents a summary of studies of the definition of brand equity to assist in our understanding of the trends over time in the concept of brand equity among academics.
The current study applies Aaker’s [1] components of brand equity: perceived quality, brand awareness and brand image (also used by Cobb-Walgren, Ruble, and Donthu [42]):
Perceived quality of a brand: Zeithaml [58] broadly defined quality of brands as superiority or excellence, and with this definition as the base, defined perceived quality as the judgment of consumers about the overall superiority or excellence of a product. In other words, perceived quality, unlike objective quality, is subjective and refers to what consumers think regarding the quality or service. In this study, perceived quality is defined as the extent to which tourists see the overall quality of tourism products and services in Seoul as a tourism destination. The questionnaire items adopted were configured based on the research of Yoo and colleagues [51], Zeithaml [58], Dodds, Monroe, and Grewal [59].
Brand awareness: Aaker [1] argued that brand awareness is a combination of whether a specific brand is stored in the memory of consumers and their ability to recall a specific brand within a product category. Brand awareness is created by increasing brand familiarity through strong association and repetitive positive exposure. In this study, brand awareness is defined as the extent to which Seoul was distinguished from other cities; for example, the degree of knowledge regarding Seoul as a tourism destination, (was it) the first tourism site that comes to mind, and so on. Based on the research of Yoo and colleagues [51], Konecnik and Gartner [9], and Ha [60], four items were selected for the survey questionnaire.
Brand image: Brand image can be defined as perceptions about a brand as reflected by the cluster of associations that consumers connect to the brand name in memory [49,55]. Thus, brand image associations are the informational nodes linked to the brand node in memory, and contain the meaning of the brand for consumers [49]. When a given node concept is recalled, the strength of association determines what other nodes will be activated [1]. When a brand image becomes popular, in their minds, visitors link it to an array of benefits and positive expectations. Im, Kim, Elliot, and Han [38] developed a conceptual framework for destination brand equity that goes beyond image by adapting and expanding a multidimensional consumer-based brand equity scale for application within a tourism context. Destination image refers to a tourist-based subjective impression of a given destination [8].
Although brand image is not the sole component of destination branding, destination image is central to the formation of a destination-branding model [4,9,61]. Tasci and colleagues [62] posit that destination image should have cognitive, affective, and conative components. In this regard, destination image is defined as “an interactive system of thoughts, opinions, feelings, visualizations, and intentions toward a destination” [62] (p. 200). The subject of destination image has received great attention in the context of tourism destination branding [63,64,65]. Kim [66] argues brand image includes all thoughts, emotions, and imaginations associated with the brand. Seeing brand image as playing an important role in differentiation, Ha [67] determined that an image of a brand can be a key component of brand equity formation only when differentiation with competing brands exists. This study understands brand image as a concept that includes tourists’ differentiated emotions with competing tourism destinations following tourism activities. Based on the research of Dodds, Monroe, and Grewal [59], Konecnik and Gartner [9], and Ha [60], three items were measured. However, over-emphasis on image may lead to the misconception that image is simply all about constituting destination branding; this has been raised in several destination branding studies [3,4,9] and is addressed here.
2.3. Factors Affecting Brand Equity in a Tourism Destination
Brand equity can exert a significant influence on re-purchase (revisit) intention [3,34,53,54]. Aaker [1] (p. 15) describes brand equity as “a set of brand assets and liabilities linked to a brand, its name, and symbol that add to or subtract from the value provided by a product or service to a firm and/or to that firm’s customers”. Keller [49] (p. 8) defines brand equity as “the differential effect of brand knowledge on consumer response to the marketing of a brand”. Influencing factors of brand equity means employing marketing communication activities that increase the asset value of corporate brands, which in turn helps them to accomplish their goals, including superiority over market competition, continuous growth of profit, loyalty of long-term customers, and so on [34,37,51,68,69,70].
Yoo and colleagues [51] incorporated four constructs (brand awareness, brand image, brand associations, and brand loyalty) as the dimensions of tourist destination brand equity. Washburn and Plank [71] detected a significant correlation between brand equity dimensions and re-purchase intention in a co-branding context. Im, Kim, Elliot, and Han [38] further developed a conceptual framework for destination brand equity that goes beyond image by adapting and expanding a multidimensional consumer-based brand equity scale for application within the tourist destination context. The empirical results of their study, based on a consumer survey in Malaysia that measured the brand dimensions of Korea, identified the relational linkages between four principal brand equity dimensions (brand awareness, brand image, brand associations, and brand loyalty), and overall customer-based brand equity. They emphasize the importance of brand image, associations and awareness, and furthermore highlight the mediating role of brand loyalty in building destination brand equity.
In the U.S. context, Huang, Oh, Zhang, and Choi [6] identified four competitor cities to Buffalo, New York, and the key attributes that those cities possess to attract tourists. The relative importance of the key attributes including city brand was investigated through a choice-based conjoint analysis. Shopping opportunities was found to be the most important attribute, followed by restaurant/food, culture/festivals, sports, nature-based attractions and city brand. Their study identified three distinctive tourist segments (food and shopping lovers, city-driven do-it-all tourists, and cultural tourists). Similarly, Tsai, Lo, and Cheung [68] discovered that customer-based casino brand equity is a higher order factorial structure amongst the four first-order constructs that they identified a priori in their study. The strongest association was found to be with brand image, followed by perceived quality, brand loyalty, and brand awareness. Perceived value and revisit intention were found to be the two direct consequences of customer-based casino brand equity. Lim and Weaver [48] examined the relationship between tourists’ destination preference and preference for products associated with the destination’s brand. The results revealed that both the cognitive and the affective images of a destination are positively related to the preference for products associated with the destination.
Most of the research on the brand equity of tourist destinations discussed above focused on general customers, and almost none scrutinized the detailed influential factors of destination branding for tourists specifically. Although the results of previous research present a wide range of influential factors affecting brand equity, in consideration of the fact that its target is Seoul with respect to Chinese tourists, the present study has set price, advertisement, public relations and word of mouth as the influential factors [51,72,73,74,75,76,77].
Price: Price is often used as a signal to indicate quality [59,78]. Zeithaml [58] argues that since consumers expect the quality of products to increase when higher prices are charged, price has a positive impact on purchase probability. Based on market principles, when good materials are used for good quality products, consumers will naturally pay more, and expensive products are formed. Brucks, Zeithaml, and Naylor [78] discuss price discounts as one of the most important variables in promotion-related events, and that continued price differentiation strategies provide an opportunity for further development. Price has been used as an important positioning tool in differentiating products, and is considered one of the most important factors in determining the market share and profitability of firms. In this study, price is defined as the charge that is subjectively perceived by tourists as appropriate considering the total cost of consumption before and during their visit to Seoul, and the cost of each consumer segment (accommodation shopping, transportation, and so on). As the tour price in this current study refers to the price of tourism products within the destination, and it is not appropriate to compare single products, the measuring scale, based on the research of Smith and Park [79], Kirmani and Wright [80], and Yoo et al. [51], was composed of four items.
Advertising: Advertising plays a central role within marketing communications, and therefore in building brand equity [61,74]. Advertising is a form of persuasive communication designed to form a positive attitude towards a particular product or change attitudes in a positive way by delivering persuasive messages [78]. Furthermore, since advertisements can transfer information and the image of the brand to many people in a short amount of time, many companies prefer to communicate through advertising [68]. In this study, the operational definition is the extent of favorability regarding advertisements of Seoul that tourists subjectively perceive. The questionnaire items were configured based on the research of Cobb-Walgren et al. [42], Kirmani and Wright [80], and Yoo [81].
Promotion: Promotion is a way of advertising firms, products, services, etc. using many methods that allow contact with consumers. News or editorials in the mass media are considered highly reliable compared to other marketing communication tools. Promotion activities increase the recognition level of consumers regarding business activities such as products and services and this increases brand sales, improves brand image and awareness, and ultimately leads to a high level of brand loyalty [34]. The operational definition used here is the frequency and manner to which tourists encounter Seoul as a tourism destination through promotions such as news reports and articles. The questionnaire items were configured based on the research of Keller [34], and Ryu [77].
Word of mouth (WoM): Yoon and Kim [30] argue that consumers attempt to obtain information before purchasing to minimize the chance of failure of the purchase, and a common method used is Word of Mouth (WoM). Online WoM can be defined as the process of communication among consumers exchanging positive or negative information obtained through direct or indirect experiences regarding certain firms, products, or services via e-mail or hypertext [72,76,82]. This approach emphasizes that a perceived and transmitted destination image becomes a projected image through the electronic WoM (eWoM) effect, and contributes to closing the circle of tourist destination image formation in a holistic way. A significant diffusion of a tourist destination image is performed through eWoM communication, which takes place in online information sources that present traveller comments, reviews, and ratings, and through search engines that locate these sources and present a summary of the collected data [24,83]. In this study, WoM was defined as information obtained from other people’s experiences and recommendations, and indirect WoM as information obtained through the internet [77,81,84,85]. The spread of word of mouth information is widely used to measure tourists’ primary behavioral intentions [73], destination loyalty [86], and future behavior [87].
2.4. Brand Loyalty
Brand loyalty is the foundation of a consumer intention to repetitively purchase certain brands or services [88,89,90]. Chaudhuri and Holbrook [53] examined two aspects of brand loyalty; purchase loyalty and attitudinal loyalty, as linking variables in the chain of effect from brand trust and brand affect to brand performance (market share and relative price). However, an agreed concept of brand loyalty has not yet been established. In past research, brand loyalty has been measured as an attitudinal dimension, behavioral dimension or as multi-dimensional. Seeing brand loyalty as preference and a psychological commitment to a particular brand, the attitudinal approach determines brand loyalty by measuring the favorable attitude of consumers towards it. The behavioral approach considers loyalty to be the tendency to repeatedly purchase a specific brand for a period. Finally, as a combination that integrates attitudinal and behavioral approaches, the multi-dimensional approach sees brand loyalty as a favorable trend in consumer attitudes and repetitive purchasing tendencies related to a specific brand. Day [91] argued that consumers are showing true brand loyalty when they repeatedly purchase a brand and simultaneously possess a favorable attitude. In addition, psychological attachment and behavioral consistency are understood to be main components of loyalty. The research of Song, Su, and Li [46] proposes a multiple mediation model, in which destination loyalty intention is jointly influenced by the interplay among destination image, tourist satisfaction, and perceived value.
Hsu, Oh, and Assaf [92] stress that brand loyalty for upscale hotels is a composite outcome variable of the three variables of brand awareness, perceived quality and brand image. Brand value is also a predictor of brand loyalty in tourism destinations [3]. Seo [93] showed that perceived quality affects brand image and customer satisfaction in the aviation industry. Chen and Tseng [37] show that brand awareness influences brand perception quality and again, brand perception quality affects brand loyalty. According to Choi’s study [94] on tourism destination brand equity formation targeting Japanese tourists visiting Korea, brand awareness and brand image affect brand loyalty. In addition, brand image and brand awareness have influence over brand loyalty [17,95]. Song and colleagues [46] confirmed that destination image’s effect on destination loyalty intention is only partially mediated by perceived value and satisfaction. They substantiated all possible single and multiple effects within their research model. However, none of these studies investigated strategic brand loyalty with a focus on the international Chinese tourist market. Accordingly, this study was conducted with brand loyalty as a result variable, not as a component of brand equity and, based on the research of Cobb-Walgren and colleagues [42], the components of brand equity were seen as being perceived quality, brand awareness, and brand image.
3. Research Methodology
3.1. Research Models and Hypotheses
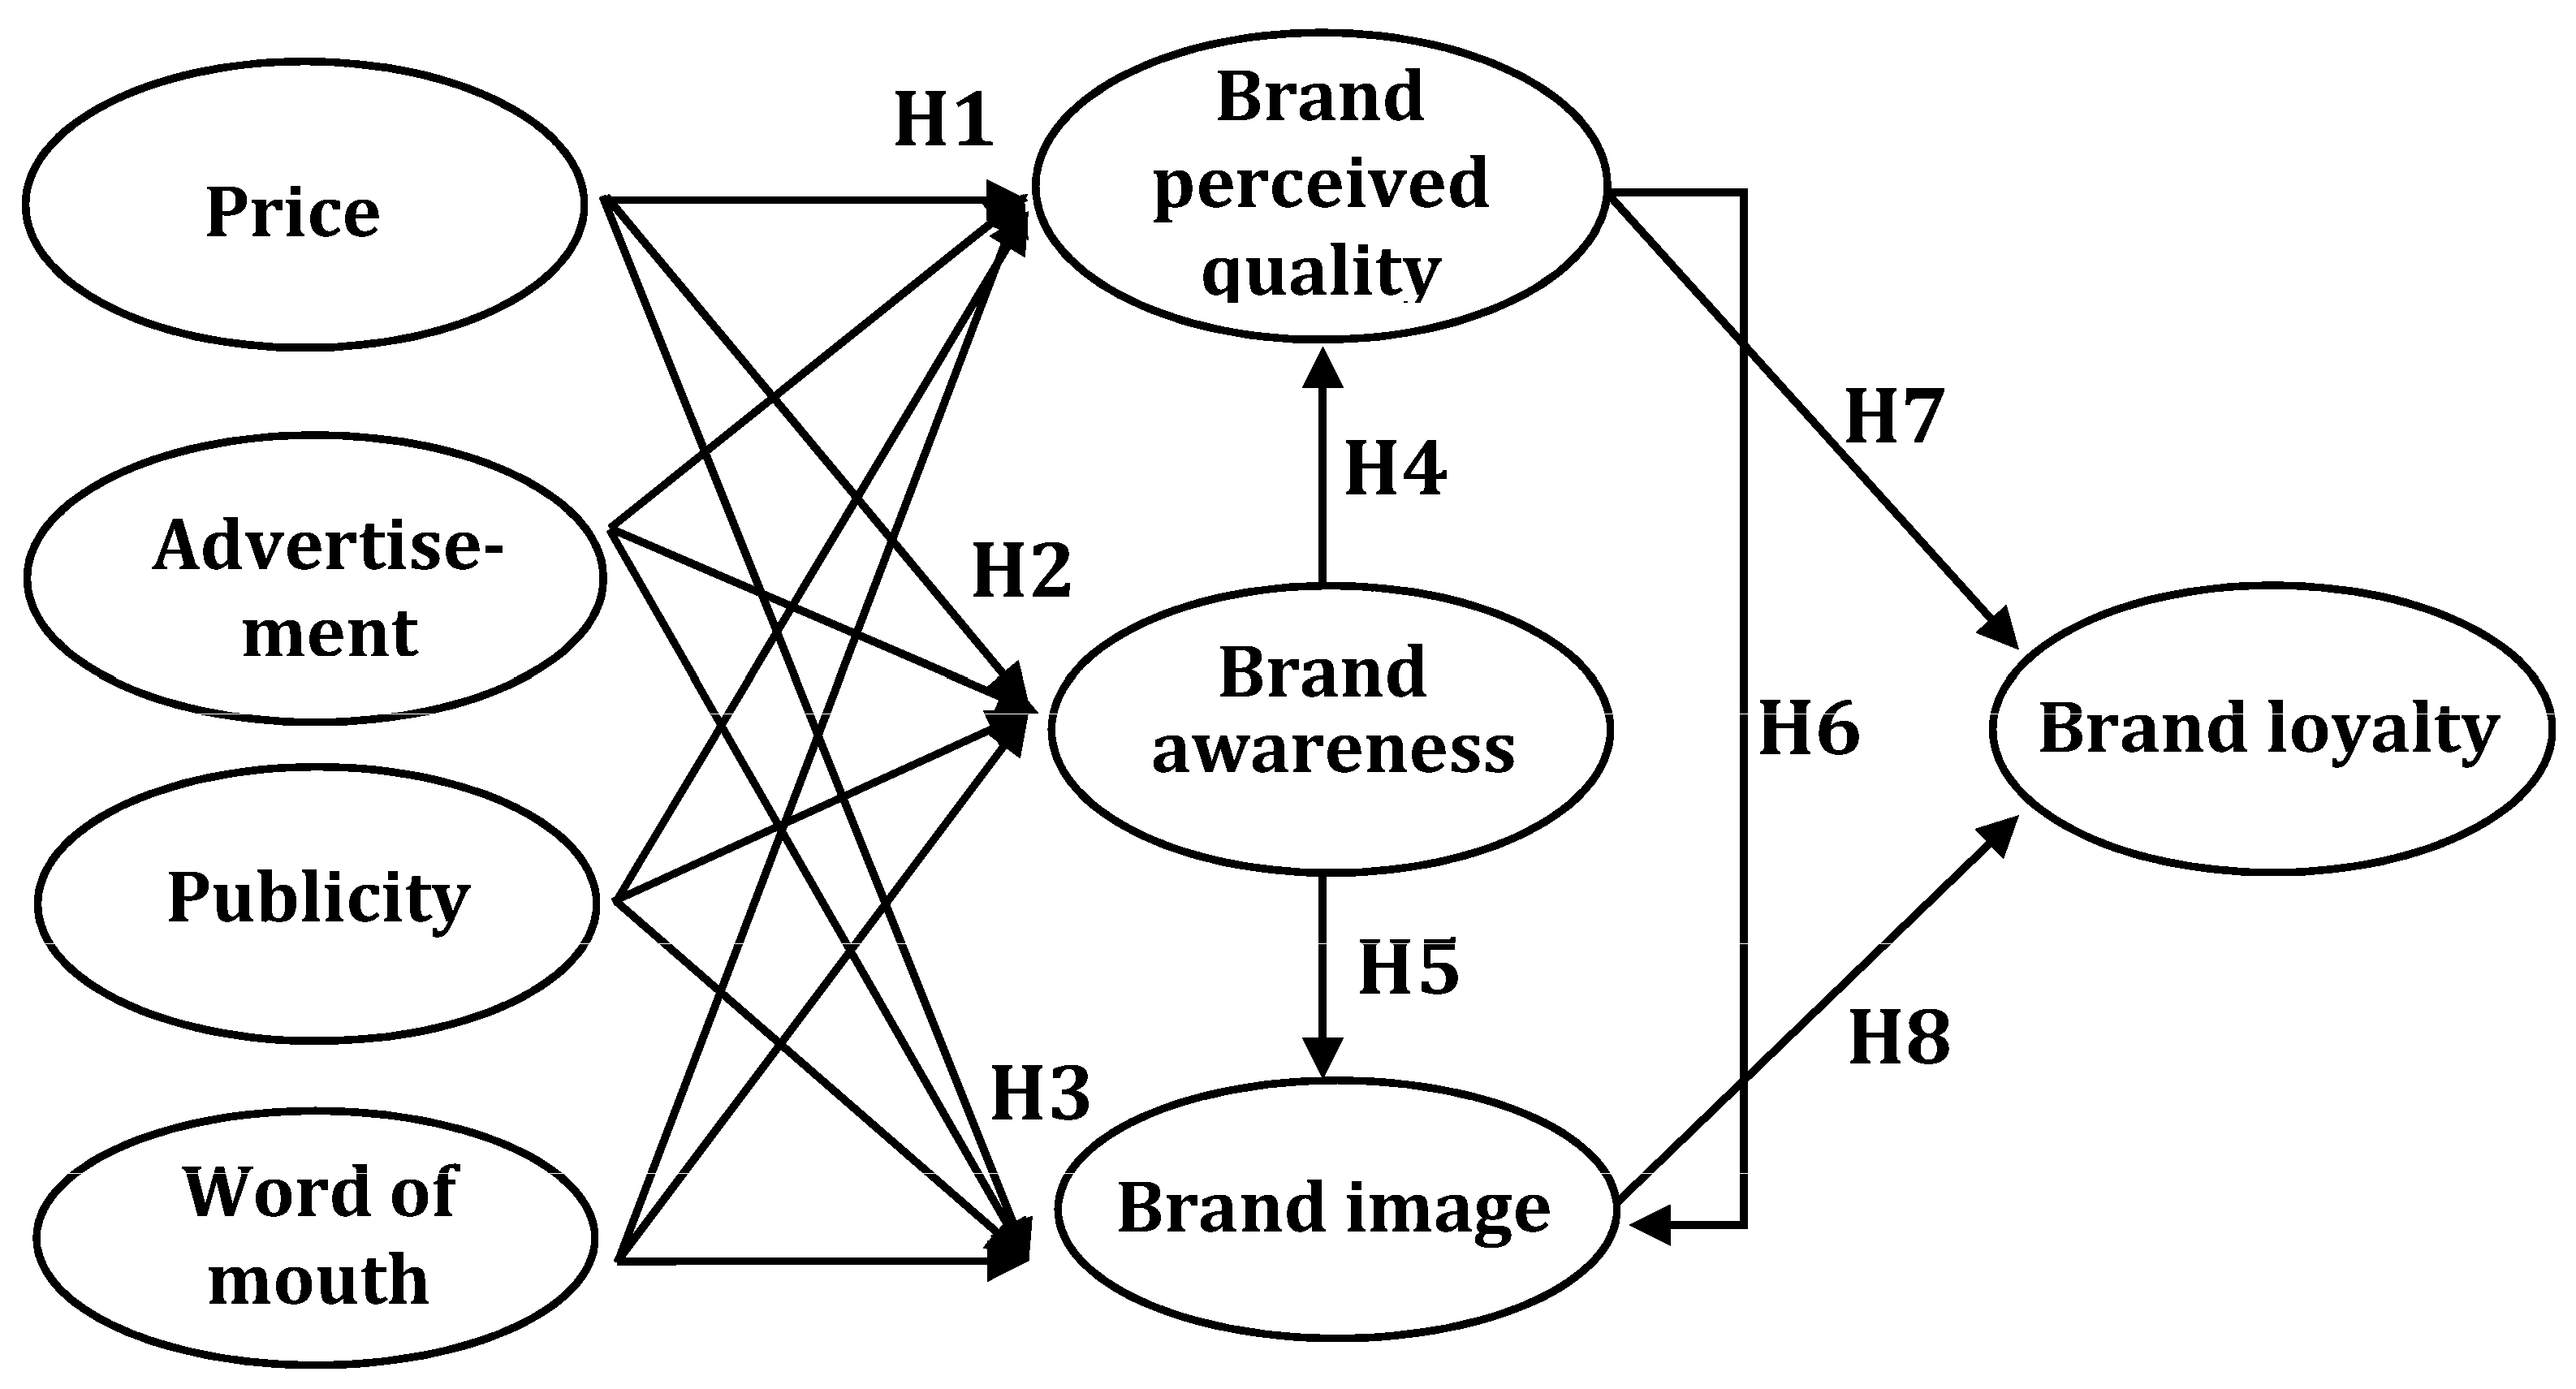
After considering the results of earlier research that found a causal relationship between tourism destination brand equity influencing factors and brand perceived quality [43,78,96], a significant cause and effect relationship between tourism destination brand equity influencing factors and brand awareness [51,97], and a relationship between tourism destination brand equity influencing factors and brand image [38,68,69,77], it is concluded that there is an influencing relationship between each variable. Second, as a result of considering related previous studies which present the existence of a relationship between tourism destination brand awareness and brand perceived quality [46,70], causation between brand awareness and brand image [47,74], and the existence of causation between brand perceived quality and brand awareness [76,93], it is inferred that there is an important relationship between these variables also. Third, considering previous studies that show the presence of a relationship between tourism destination brand perceived quality and brand loyalty [37,84], and causation among brand image and brand loyalty [3,46], it is inferred that there is an important relationship between these variables as follows:
Hypothesis 1 (H1).
Tourism destination influencing factors will positively affect brand perceived quality.
Hypothesis 2 (H2).
Tourism destination influencing factors will positively affect brand awareness.
Hypothesis 3 (H3).
Tourism destination influencing factors will positively affect brand image.
Hypothesis 4 (H4).
Tourism destination brand awareness will positively affect brand perceived quality.
Hypothesis 5 (H5).
Tourism destination brand awareness will positively affect brand image.
Hypothesis 6 (H6).
Tourism destination brand perceived quality will positively affect brand image.
Hypothesis 7 (H7).
Tourism destination brand perceived quality will positively affect brand loyalty.
Hypothesis 8 (H8).
Tourism destination brand image will positively affect brand loyalty.
Figure 1 illustrates the research model with these eight hypotheses.
3.2. Survey Activities for Data Collection
Data collection for the current study was conducted among tourists visiting Seoul from the Greater China region, including Mainland China, Hong Kong, Macao, Taiwan, and the Chinese living in Southeast Asia, such as Thailand, Malaysia, Indonesia, and Singapore. The current study was conducted for 15 days in May 2016, one of the most popular months for sightseeing in Korea due to the comfortable weather and more shopping opportunities in the country at that time (see Appendix A). The survey was conducted in popular sightseeing spots such as Gyeongbokgung Palace, the Dongdaemun Gate, the Myeongdong shopping district, four and five-star hotels in the Seoul Metropolitan Area, and the Incheon International Airport. Since Chinese tourists were to be targeted, the survey was conducted by four bi-lingual interviewers fluent in Chinese, who were taking tourism-related courses as their major at Korean universities, and who had academic survey experience. In addition, they were trained to communicate the reason for the research and answer any questions from the survey respondents. The survey responses were voluntary and remained anonymous.
Approximately 20 to 35 responses were collected each day from individual and group package tourists. The respondents were selected objectively and randomly, with effort expended to secure avoiding any potential bias or sample error in the composition of the respondents such as gender, age, the number of accompany, and city of residence (in the case of group tourists). A small present was given to the respondents as a sign of appreciation for their participation. There was no quota of collected questionnaires per day or location. Out of a total of 385 distributed questionnaires, 350 (China 191, Hong Kong 71, Taiwan 68, others 20) were selected as valid and finally used in the analysis.
3.3. Method of Data Analysis
The collected data for this current study were analyzed using the Statistical Package for the Social Sciences (SPSS) 17.0 program and the AMOS 7.0 program. First, a frequency analysis was conducted to examine the demographic characteristics and the visitation patterns of those visiting Seoul. Next, Cronbach’s alpha values were calculated to verify the reliability of the measured variables, and exploratory factor analyses and confirmatory factor analyses were conducted to verify validity. To examine the impact of the component factors that influence brand equity on the perceived quality of a brand and brand awareness, including brand image and the impact the components have on brand loyalty, a multiple regression analysis was performed through observation and parameterization of these variables. In addition, the research hypotheses were tested by using a theoretical causal relation model analysis of brand equity influencing factors and brand equity components through structural equation modeling. The coefficient estimation of the structural equation model for the verification of the research hypotheses used the maximum likelihood method. Table 2 summarizes the questionnaire composition of previous research and the measurement scale applied for the current study. The substantial outcome of the analyzed data is presented in the later part of this paper.
4. Results
Of the survey participants, 56.6% were females, and were married. The largest age group was in their twenties (35.1%), and office workers were the largest group in occupation terms (20.6%). Almost two-thirds were college/university graduates, and 31.4% had individual monthly incomes of over US$4000. Residents from mainland China were slightly more than half of the total respondents. Table 3 provides the demographic outline for the respondents.
Tourists visiting Seoul for the first time were in the majority at 59.1%, followed by visitors who had been there two to three times at 31.1%. Purpose of travel showed simple sightseeing “tourist attractions” as the largest set at 60.3%, and “shopping” as 33.7%. The motivation to visit Seoul was 28.9% for the statement “because I wanted to know Seoul”, and 21.7% for “because it is geographically close”. Independent travelers and package tour travelers accounted for 25.7% and 74.3% respectively of the total. The travel companion question showed that 53.1% of tourists were with their family, and 35.7% were with friends/colleagues. According to the question on sources of information, 52% used “travel agency”, followed by 15.1% the “Internet”. In answer to questions about the inconvenience of traveling to Seoul, the majority (69.7% of tourists) picked out the “problem of a language barrier”. More than two-thirds of the respondents were satisfied with their Seoul visit. Table 4 details the information of the visit to Seoul.
4.1. Validity and Reliability of Measurement
Reliability test of categories to measure Seoul’s brand equity influencing factors including price, publicity, advertisement, oral tradition and so on, gave a Cronbach’s alpha coefficient of 0.735 for the price related variable. The Cronbach’s alpha for advertisement related variables was 0.701, for publicity 0.698, and word of mouth (WoM) related variables 0.701; thus overall, it is possible to conclude that these measures had relatively high internal consistency. Therefore, the reliability of the measurement instrument was secured. Reliability tests for the categories used to measure the component factors of Seoul’s brand equity included brand perceived quality, brand awareness and brand image, provided a Cronbach’s alpha for brand perceived related variables of 0.729. Brand awareness had a Cronbach’s alpha coefficient of 0.699, and brand image related variables 0.752. Therefore, these variables had a relatively high internal consistency, and the reliability of the measurement instruments was secured. The outcome of reliability tests on the categories used to measure Seoul’s brand loyalty gave a Cronbach’s alpha coefficient of 0.746. Once again it is possible to conclude that the items composing this measure have a relatively high internal consistency.
The results of the exploratory factor analysis on influencing factors of Seoul’s brand equity included price, publicity, advertisements and oral tradition, and had a Kaiser Meyer Olkin (KMO) scale of 0.809, and a Bartlett’s sphericity test of χ2 equaling 1231.444 (df = 78, p < 0.001), which means that it was suitable for analysis on primary factors. The total variance explanation ratio was 61.644%. The analysis showed that: the variance explanation ratio of variables related to oral traditions was 31.186%, and the variance explanation ratio of variables related to publicity was 7.056%. KMO scales of 0.846 and an χ2 value of 1018.194 (df = 45, p < 0.001) resulted from the exploratory factor analysis on Seoul’s brand equity component factors, and the Bartlett’s sphericity test; meaning that this procedure was appropriate for the analysis of primary factors. The total variance explanation ratio was 61.694%.
The analysis of the collected data shows that the variance explanation ratio of brand perceived quality was 39.82% and the variance explanation ratio of brand image related variables was 8.32%. The exploratory factor analysis on brand loyalty of Seoul gave 66.75% as the variance explanation ratio. χ2 = 480.872 (df = 428, p < 0.001), χ2/df (Q) = 1.774, The Root mean square residential (RMR) = 0.033, Goodness-of-fit index (GFI) = 0.904, Incremental fit index (IFI) = 0.929, Tucker–Lewis index (TLI) = 0.913, Confirmatory fit index (CFI) = 0.927, and the root mean square error of approximation (RMSEA) = 0.047 were the results for the goodness-of-fit of the model. This was based on a confirmatory factor analysis using a covariance correlation matrix of the variables from the validity test and the reliability test, plus the exploratory factor analysis on brand equity influencing and component factors. Except for the χ2 statistics, all goodness of fit indices were greater than the general standard. Since χ2 statistics are sensitive to sample size, it is essential to consider these along with other goodness of fit results; therefore, measured variables’ goodness of fit of the model appeared to be acceptable. Table 5 shows the result of the confirmatory factor analysis on brand equity influencing factors.
Table 6 provides the results of the confirmatory factor analysis on the components of brand equity and brand loyalty.
4.2. Verification of Research Hypotheses
(1) The impact of tourism destination brand equity influencing factors and brand equity components.
The results of the covariance structure model analysis confirmed that, among the factors of tourism destination price, advertisement, publicity (promotion), and oral tradition, the factors of price (t = 1.992, p < 0.05) and oral tradition (t = 4.449, p < 0.001) have a positive influential impact on brand perceived quality. In contrast, there was no positive influential relation between the factors of advertisement (t = 0.676, p > 0.05) and publicity (t = 0.430, p > 0.05). Thus, Hypothesis H1a and H1d were supported, and Hypothesis H1b and H1c were rejected. Additionally, among the brand equity influencing factors, the factors of price, publicity and oral tradition have a positive influential impact on the brand awareness of Seoul City. However, the advertisement factor did not; therefore, Hypothesis H2a, H2c and H2d were selected, but H2b was dismissed. Amidst brand equity influencing factors, advertisement factor’s (t = 2.216, p < 0.05) positive influential relation on the brand image of Seoul city was observed but no observation was made on factors of price (t = −1.134, p > 0.05), publicity and oral tradition. Therefore, Hypothesis H3b was supported, but H3a and H3c were rejected.
(2) Influential relation among tourism destination brand equity components.
Hypothesis H4, which anticipated that tourism destination brand awareness would have a positive effect on brand perceived quality, was rejected due to the verification result that presented a standardized path coefficient of −0.034 (t = −0.235, p > 0.05). Hypothesis H5, predicting that tourism destination brand awareness would have a positive effect on brand image, was supported as a verification result of a standardized path coefficient of 0.864 (t = 4.445, p < 0.001) was achieved. Moreover, Hypothesis H5, which assumes that tourism destination brand perceived quality would have a positive effect on brand image, was also supported due to the verification result that presented a standardized path coefficient of 0.302 (t = 2.197, p < 0.001).
(3) Influential relation of components of tourism destination brand equity and brand loyalty.
First, the verification result of research Hypothesis H7, that predicted that tourism destination brand perceived quality would positively affect brand loyalty, showed a standardized path coefficient of 0.408 (t = 4.899, p < 0.001), which indicates a significant positive influential relationship. Thus, Hypothesis H7 was supported. Hypothesis H8, the anticipation that brand image would have a positive influence over brand loyalty, was selected as well, due to the verification result with a standardized path coefficient of 0.554 (t = 6.609, p < 0.001). Table 7 presents the impact analysis on brand equity’s influencing factors and components.
5. Discussion and Conclusions
In general, tourists tend to rely on the brand of a destination they wish to visit. The lack of originality and difference among most Korean tourism commodities has led to a deepening competition, resulting in the recognition of the importance of branding as an effective method to win consumers [30,77,81]. Tourists treat tourism destinations as products, perceive them as brands, and make a final selection based on influential brand equity. However, there is a paucity of research on specific brand equity in the tourism literature. With the current race among worldwide cities to become tourism destinations, research on the brand equity of Seoul, the most visited city by international tourists in Korea, was investigated in this study. The enhancement of Seoul’s effective brand equity will be a source of competitive advantage, and should attract larger numbers of tourists. Furthermore, considering China’s current huge influence on global tourism markets, the significance of this study is supported in terms of ensuring a systematic and strategic approach that induces Chinese tourists to visit Korea, and specifically Seoul.
This study attempted to understand the important branding features of a tourism destination. To accomplish this, it established a model of brand equity with relationships and four influencing factors (price, advertising, promotion, and word of mouth). The study therefore provides fundamental data that could be used for establishing a strategic branding position for attracting Chinese tourists. The result of this research can be summarized as follows. First, it can be seen that tourists from the Greater China region had a relatively high sensitivity towards the price of tourist products in Seoul. Thus, price is a major factor for tourists from the Greater China region to prefer or visit Seoul. The results suggest that tourists from the region prefer cheap group package deals. However, promotions and advertisement were discovered to have no impact on perceived brand quality.
Second, the impact of Seoul brand equity influencing factors on tourism destination brand awareness shows that price, promotion, and word of mouth (WoM) have an important influence. Thus, the promotion factor can be seen as a major variable that makes tourists recognize Seoul as a safe and relaxed tourism destination following positive or negative news regarding the city. Meanwhile, advertisement was found not to have an impact on brand awareness, however, advertisement is the most important factor in reminding people that Seoul is a tourism destination. Since China is a key market, by spending over 40% of its marketing activity budget in that market, Seoul has made an intense investment in Chinese outbound tourism in the last several years. Nevertheless, Seoul’s branding efforts still seem to need more time to achieve significant outcomes. Meanwhile, the oral tradition factor affects brand quality perception and brand image. Its significantly higher leverage compared to the factors of price, publicity and advertisement is notable. This high leverage in the oral tradition suggests that Chinese tourists purchase products in response to word of mouth from others. Chinese tourists rely heavily on on-line communication, and the on-line community of Seoul’s tour products, such as message boards, reviews, and comments, to minimize the risk of their tours. This emphasizes the need for interactive communication and word of mouth to increase the number of Chinese outbound tourists to Seoul.
Third, the results of analyzing the relationship of the Seoul brand equity influencing factor on tourism destination brand awareness revealed that the advertisement factor does have an impact. This means advertising is the most important factor when reminding potential visitors about Seoul as a tourist destination, therefore conducting proactive advertising activities can play a crucial role in Seoul being selected as a tourism destination. Fourth, word of mouth (WoM) has an influence on perceived brand quality and brand awareness, and its influence is noticeably higher than price, promotion, and advertising. This shows that aggressive recommendation by people, or the manner in which a tourist who has visited Seoul positively expresses opinions using WoM can have a strong impact on improving the competitiveness of that city. Thus, in the selection of tourism products as intangible goods, the effect of other people’s WoM is important. Therefore, as WoM becomes diversified to include not only direct face-to-face deliverance, but also through the Internet such as in online communities, effective utilization is necessary to increase the attraction of tourists from the Greater China region. Lastly, the perception of Chinese tourists having a high regard for quality means that differentiating the brand image of Seoul from competing tourism destinations is important, and should improve emotional and intangible attachments toward the city. To cultivate Seoul’s brand loyalty as a tourism destination, efforts should be made to improve tourism destination perceived quality and brand image.
The main point of this conclusion is (a) tourists from the Greater China region are sensitive to price, and (b) although Seoul promoted and advertised itself using much of its budget, WoM was more influential. The study contributes by providing an in-depth brand equity study of a global tourist destination, especially with a focus on Chinese outbound tourists, who are gaining increasing attention all over the world in the international tourism industry. It also makes strategic suggestions to practitioners in the tourism industry, regional marketing, government sector, and urban planning. However, despite such findings, this study has certain limitations. It investigated the perceived brand equity of the Seoul Metropolitan Area only, and solely with respect to Chinese tourists, and did not include the overall marketing strategies designed to enhance the brand equity of Seoul. This approach creates concerns in terms of objectivity and generalization. As the study included Chinese descendent respondents from Mainland China, Hong Kong, Macao, Taiwan, Singapore, and other Asian countries, individual studies on the four brand influencing factors (price, advertising, promotion, and word of mouth) with other populations should be investigated in the future. Additionally, comparative studies with other metropolitan cities in Korea could be another option to effectively expand this type of study.
Acknowledgments
This study was supported by the research grant of Jeju International University in 2015.
Author Contributions
Hwa-Kyung Kim decided the main topic of the study, designed the original research idea, collected and analyzed literature review both from Korean and overseas sources, planned and conducted the fieldwork survey activities, and also coded the collected questionnaires; Timothy J. Lee analyzed the collected data, completed conclusion, finalized the references, and edited the whole manuscript.
Conflicts of Interest
The authors declare no conflict of interest.
Appendix A
| QUESTIONNAIRE |
| Dear Respondent Many thanks for your kind participation in this survey. This is about brand equity of Seoul city as a tourist destination perceived by inbound tourists from the greater Chinese region. Your answers will be useful as valuable data to have Seoul improve its attraction for Chinese tourists. Thank you very much. Researcher: Dr. XXXXXX at XXX XXXXX University. Email: XXXXXXXXXX |
- The followings are questions on the influencing factors of brand equity of Seoul as a tourist destination (price, advertisement, publicity, and word of mouth). Please tick (√) the most appropriate box that represents your opinion.(1 = Strongly agree & 5 = Strongly disagree)
Variable Strongly Agree Agree Neutral Disagree Strongly Disagree 1 The price of tourism products (in Seoul) is higher than the country I came from. ① ② ③ ④ ⑤ 2 The price of tourism products is higher than other competing countries. ① ② ③ ④ ⑤ 3 Living cost is expensive. ① ② ③ ④ ⑤ 4 There is frequent price-cutting promotion on tourism products (accommodation, transportation, shopping, etc.) ① ② ③ ④ ⑤ 5 Proactive and intensive advertising activities are carried out. ① ② ③ ④ ⑤ 6 Advertisements are seen very often. ① ② ③ ④ ⑤ 7 Advertisements are produced with higher quality than other cities. ① ② ③ ④ ⑤ 8 I frequently encounter news reports or newspaper articles about Seoul. ① ② ③ ④ ⑤ 9 News reports and newspaper articles on Seoul are positive and favorable. ① ② ③ ④ ⑤ 10 Social evaluation about Seoul seems positive. ① ② ③ ④ ⑤ 11 People around me think highly of Seoul. ① ② ③ ④ ⑤ 12 There is recommendation from other persons about Seoul City’s tourism. ① ② ③ ④ ⑤ 13 Seoul is positively described on the Internet. ① ② ③ ④ ⑤ 14 People on the SNS speak well of Seoul. ① ② ③ ④ ⑤ - The following are questions about the components of brand equity of Seoul as a tourist destination (Brand perceived quality, brand awareness, and brand image).Please tick (√) the most appropriate box that represents your opinion.(1 = Strongly agree & 5 = Strongly disagree)
Variable Strongly Agree Agree Neutral Disagree Strongly Disagree 1 The quality of tourism products (accommodation, transportation, shopping, etc.) of Seoul is outstanding. ① ② ③ ④ ⑤ 2 Seoul continuously provides a high quality of tourism products and services. ① ② ③ ④ ⑤ 3 Tourism products in Seoul are reliable and trustworthy. ① ② ③ ④ ⑤ 4 Seoul better performs as a tourist destination than its competitors. ① ② ③ ④ ⑤ 5 I am well aware of Seoul. ① ② ③ ④ ⑤ 6 I can quickly recall Seoul as a tourist destination. ① ② ③ ④ ⑤ 7 Seoul is easily compared and differentiated from other cities. ① ② ③ ④ ⑤ 8 The Logo and symbol of Seoul easily comes to me. ① ② ③ ④ ⑤ 9 There is a distinctive image on tourism products of Seoul. ① ② ③ ④ ⑤ 10 Seoul is more special than other cities. ① ② ③ ④ ⑤ 11 Seoul has a high level of popular reputation. ① ② ③ ④ ⑤ - The following are questions on the brand loyalty of Seoul as a tourist destination.Please tick (√) the most appropriate box that represents your opinion.(1 = Strongly agree & 5 = Strongly disagree)
Variable Strongly Agree Agree Neutral Disagree Strongly Disagree 1 I will put Seoul as the most prioritized destination when selecting travel destination in the future. ① ② ③ ④ ⑤ 2 I will recommend other people to visit Seoul. ① ② ③ ④ ⑤ 3 I will visit Seoul even if costs increase. ① ② ③ ④ ⑤ - The following are information on your visit to Seoul.
Number of Visits ① First Time ② Two–Three Times ③ Four–Five times ④ Six Times or More Purpose of Visiting Korea ① Tourist attraction② Shopping ③ Beauty and treatment ④ Gambling
⑤ Business trip ⑥ Gourmet tour ⑦ Festival and performanceSource of Information ① Travel agency ② Acquaintance ③ Internet ④ Tour Guide book ⑤ Mass Media ⑥ Airline, Hotel ⑦ Tourism organizations of Korea (i.e., Korea Tourism Organization) Motivation of Visit (Multiple Response) ① Want to know Seoul ② Close distance ③ Cheap travel cost ④ Shopping
⑤ Recommendation of friends ⑥ Visit filming scene location
⑦ AdvertisementInconvenience ① Communication/Language ② Signage and sign post for direction
③ Traffic congestion ④ Immigration procedures
⑤ Obtaining travel visa ⑥ Unfriendly tour guide ⑦ Food ⑧ Expensive cost
⑨ Being forced to shopType of Travel ① Individual
② Group PackageAccompany ① Alone ② With Families
③ With Friends/ColleaguesDegree of Satisfaction ① Very satisfied ② Satisfied ③ Neutral ④ Dissatisfied ⑤ Very dissatisfied - The following provides information about you that will help us to interpret the answers to the other questions. None of this data will be made public.
Gender ① Male ② Female Marital Status ① Married ② Single Age ① 20–29 ② 30–39 ③ 40–49 ④ 50 or older Occupation ① Public official ② Office worker ③ Professional ④ Production worker ⑤ Sales/Service ⑥ Self-employed ⑦ Student ⑧ Housewife ⑨ Others Education ① Up to high school ② College/University ③ Graduate school Individual Monthly Income (US Dollar) ① Up to 1000 ② 1001–2000 ③ 2001–3000 ④ 3001–4000 ⑤ More than 4000 Region of Residence ① Mainland China ② Hong Kong ③ Taiwan ④ Others
References
- Aaker, D.A. Managing Brand Equity; The Free Press: New York, NY, USA, 1991. [Google Scholar]
- Bianchi, C.; Pike, S.; Lings, I. Investigating attitudes towards three South American destinations in an emerging long-haul market using a model of consumer-based brand equity (CBBE). Tour. Manag. 2014, 42, 215–223. [Google Scholar] [CrossRef]
- Boo, S.; Busser, J.; Baloglu, S. A model of customer-based brand equity and its application to multiple destinations. Tour. Manag. 2009, 30, 219–231. [Google Scholar] [CrossRef]
- Cai, L.A. Cooperative branding for rural destination. Ann. Tour. Res. 2002, 29, 720–742. [Google Scholar] [CrossRef]
- Choi, H.L. The Effect of Brand Extrinsic Cues on Perceived Quality, Perceived Risk and Purchase Intention. Ph.D. Thesis, Kyung Hee University, Seoul, Korea, 2009. [Google Scholar]
- Huang, C.; Oh, K.; Zhang, Q.; Choi, Y.J. Understanding the city brand in the regional tourism market among college students. J. Travel Tour. Mark. 2013, 30, 662–671. [Google Scholar] [CrossRef]
- Jacoby, J.; Mazursky, D. Linking brand and retail image: Do the potential risks outweigh the potential benefits? J. Retail. 1984, 60, 105–122. [Google Scholar]
- Joshi, R.; Yadav, R. Evaluating the feedback effects of brand extension on parent brand equity: A study on Indian FMCG industry. J. Vacat. Mark. 2017, 21, 305–313. [Google Scholar] [CrossRef]
- Konecnik, M.; Gartner, W.C. Customer-based brand equity for a destination. Ann. Tour. Res. 2007, 34, 400–421. [Google Scholar] [CrossRef]
- Mitchell, M.A.; Orwig, R.A. Consumer experience tourism and brand bonding. J. Prod. Brand Manag. 2002, 11, 30–41. [Google Scholar] [CrossRef]
- Kim, S.S.; Moon, J.; Choe, J. Comparison of destination brand equity models of competitive convention cities in East Asia. J. Conv. Event Tour. 2016, 17, 318–342. [Google Scholar] [CrossRef]
- Zenker, S.; Martin, N. Measuring success in place marketing and branding. Place Brand. Public Dipl. 2011, 7, 32–41. [Google Scholar] [CrossRef]
- Kang, S.J. Research on the influence factors on brand equity. Mark. Sci. Res. 2001, 8, 1–35. [Google Scholar]
- Keller, K.L. Building customer-based equity. Mark. Manag. 2001, 10, 14–19. [Google Scholar]
- Kim, T.H.; Son, E.Y.; Kim, J.S. Research on the effectiveness of communication activities in brand equity, focused on family restaurant. Hotel Manag. Res. 2007, 16, 155–168. [Google Scholar]
- Morgan, R. A consumer-oriented framework of brand equity and loyalty. J. Mark. Res. Soc. 2000, 42, 65–78. [Google Scholar] [CrossRef]
- O’Cass, A.; Grace, D. An exploratory perspective of service brand associations. J. Serv. Mark. 2003, 17, 452–475. [Google Scholar] [CrossRef]
- United Nations World Tourism Organization (UNWTO). UNWTO Tourism Highlights; UNWTO Press: Madrid, Spain, 2014. [Google Scholar]
- Korea Tourism Organization. South Korea Marks 17 Million Tourists in 2016. Available online: http://english.visitkorea.or.kr/enu/AKR/FU_EN_15.jsp?cid=2470063 (accessed on 28 December 2016).
- Sparks, B.; Pan, G. Chinese outbound tourists: Understanding their attitudes, constraints and use of information sources. Tour. Manag. 2009, 30, 483–494. [Google Scholar] [CrossRef]
- Wu, M.Y.; Pearce, P.L. Chinese recreational vehicle users in Australia: A netnographic study of tourist motivation. Tour. Manag. 2014, 43, 22–35. [Google Scholar] [CrossRef]
- Breakey, N.; Ding, P.; Lee, T.J. Impact of Chinese outbound tourism to Australia: Reviewing the past; implications for the future. Curr. Issues Tour. 2008, 11, 587–603. [Google Scholar] [CrossRef]
- Dai, B.; Jiang, Y.Y.; Yang, L.Q.; Ma, Y.L. Stage characteristics and policy choices of China’s outbound tourism development. Tour. Trib. 2013, 28, 39–45. [Google Scholar]
- Marine-Roig, E. Measuring destination image through travel reviews in search engines. Sustainability 2017, 9, 1425. [Google Scholar] [CrossRef]
- Wang, Y.; Davidson, M. Pre-and post-trip perceptions: An insight into Chinese package holiday market to Australia. J. Vacat. Mark. 2010, 16, 111–123. [Google Scholar] [CrossRef]
- Kladou, S.; Kavaratzis, M.; Rigopoulou, I.; Salonika, E. The role of brand elements in destination branding. J. Destin. Mark. Manag. 2017, 6, 426–435. [Google Scholar] [CrossRef]
- Moutinho, L.; Huarng, K.; Yu, T.; Chen, C. Modeling and forecasting tourism demand: The case of flows from mainland China to Taiwan. Serv. Bus. 2008, 2, 219–232. [Google Scholar] [CrossRef]
- Zhang, G.; Pine, R.; Zhang, H. China’s international tourism development: Present and future. Int. J. Contemp. Hosp. Manag. 2000, 12, 282–290. [Google Scholar] [CrossRef]
- Jeong, S.E. Analysis of Chinese overseas investment. Small Medium Enterp. Res. 2006, 30, 119–153. [Google Scholar]
- Yoon, T.H.; Kim, Y.P. Comparing city brand personality of ‘Hi Seoul’ and ‘Dynamic Busan’. J. Tour. Leis. Res. 2010, 22, 327–341. [Google Scholar]
- Park, C.S. Estimation and Prediction of Brand Equities through Survey Measurement of Consumer Preference Structures. Ph.D. Thesis, Stanford University, Stanford, CA, USA, 1992. [Google Scholar]
- Pike, S.; Ryan, C. Destination positioning analysis through a comparison of cognitive, affective, and conative perceptions. J. Travel Res. 2004, 42, 333–342. [Google Scholar] [CrossRef] [Green Version]
- Ahn, J.; Back, K.-J. Influence of brand relationship on customer attitude toward integrated resort brands: A cognitive, affective, and conative perspective. J. Travel Tour. Mark. 2017. [Google Scholar] [CrossRef]
- Keller, K.L. Strategic Brand Management: Building, Measuring, and Managing Brand Equity, 3rd ed.; Prentice Hall: Upper Saddle River, NJ, USA, 2008. [Google Scholar]
- Ooi, C.S. The poetics and politics of destination branding: Denmark. Scand. J. Hosp. Tour. 2004, 3, 107–128. [Google Scholar] [CrossRef]
- Swaminathan, V.; Fox, R.J.; Reddy, S.K. The impact of brand extension introduction on choice. J. Mark. 2001, 65, 1–15. [Google Scholar] [CrossRef]
- Chen, C.F.; Tseng, W.S. Exploring customer-based airline brand equity: Evidence from Taiwan. Transp. J. 2010, 49, 24–34. [Google Scholar]
- Im, H.H.; Kim, S.S.; Elliot, S.; Han, H. Conceptualizing destination brand equity dimensions from a consumer-based brand equity perspective. J. Travel Tour. Mark. 2012, 29, 385–403. [Google Scholar] [CrossRef]
- Wu, C.; Funck, C.; Hayashi, Y. The impact of host community on destination (re)branding: A case study of Hiroshima. Int. J. Tour. Res. 2013, 16, 546–555. [Google Scholar] [CrossRef]
- Ekinci, Y.; Hosany, S. Destination personality: An application of brand personality to tourism destinations. J. Travel Res. 2006, 45, 127–139. [Google Scholar] [CrossRef]
- Morgan, N.; Pritchard, A.; Piggott, R. New Zealand, 100% pure: The creation of a powerful niche destination brand. J. Brand Manag. 2002, 9, 335–354. [Google Scholar] [CrossRef]
- Cobb-Walgren, C.J.; Ruble, C.A.; Donthu, N. Brand equity, brand preference, and purchase intent. J. Adv. 1995, 24, 25–41. [Google Scholar] [CrossRef]
- Simon, C.J.; Sullivan, M.W. The measurement and determinations of brand equity: A financial approach. Mark. Sci. 1993, 12, 28–52. [Google Scholar] [CrossRef]
- Chaudhuri, A.; Holbrook, M.B. The chain of effects from brand trust and brand affect to brand performance: The role of brand loyalty. J. Mark. 2001, 65, 81–93. [Google Scholar] [CrossRef]
- Seo, Y.G.; Lim, S.H. Research on retail brand value elements and the relationship with the customer preference, satisfaction, and repurchase intention. Distrib. Study 2005, 11, 71–96. [Google Scholar]
- Song, Z.; Su, X.; Li, L. The indirect effects of destination image on destination loyalty intention through tourist satisfaction and perceived value: The boot strap approach. J. Travel Tour. Mark. 2013, 30, 386–409. [Google Scholar] [CrossRef]
- Trembath, R.; Romaniuk, J.; Lockshin, L. Building the destination brand: An empirical comparison of two approaches. J. Travel Tour. Mark. 2011, 28, 804–816. [Google Scholar] [CrossRef]
- Lim, Y.; Weaver, P.A. Customer-based brand equity for a destination: The effect of destination image on preference for products associated with a destination brand. Int. J. Tour. Res. 2014, 16, 223–231. [Google Scholar] [CrossRef]
- Keller, K.L. Conceptualizing, measuring, and managing customer-based brand equity. J. Mark. 1993, 57, 1–22. [Google Scholar] [CrossRef]
- Axelrod, J. The definition measurement of brand equity. In Proceedings of the ARF Brand Equity Research Day, New York, NY, USA, 27 October 1993. [Google Scholar]
- Yoo, B.H.; Donthu, N.; Lee, S.H. An examination of selected marketing mix elements and brand equity. J. Acad. Mark. Sci. 2000, 28, 195–211. [Google Scholar] [CrossRef]
- Park, M.K. Research on Measuring Value of Enterprise Brand Equity. Ph.D. Thesis, Chungang University, Seoul, Korea, 2001. [Google Scholar]
- Baldauf, A.; Cravens, K.C.; Binder, G. Performance consequences of brand equity management: Evidence from organizations in the value chain. J. Prod. Brand Manag. 2003, 12, 220–236. [Google Scholar] [CrossRef]
- Han, S.H.; Nguyen, B.; Lee, T.J. Consumer-based chain restaurant brand equity, brand reputation, and brand trust. Int. J. Hosp. Manag. 2015, 50, 84–93. [Google Scholar] [CrossRef]
- Farquhar, P.H. Managing brand equity. Mark. Res. 1989, 1, 24–33. [Google Scholar]
- Baldinger, A.L. Defining and applying the brand equity concept: Why the researcher should care. J. Adv. Res. 1932, 30, RC2–RC5. [Google Scholar]
- MacLachlan, D.L.; Mulhern, M.G. Measuring brand equity with conjoint analysis. In Proceedings of the 4th Sawtooth Software Conference, Sun Valley, ID, USA, January 1991; pp. 127–140. [Google Scholar]
- Zeithaml, V.A. Consumer perceptions of price, quality, and value: A means-end model and synthesis of evidence. J. Mark. 1988, 52, 2–22. [Google Scholar] [CrossRef]
- Dodds, W.B.; Monroe, K.B.; Grewal, D. Effects of price, brand and store information on buyers’ product evaluations. J. Mark. Res. 1991, 28, 307–319. [Google Scholar] [CrossRef]
- Ha, Y.S. Influence That Sports Marketing Factors Make to Brand Equity and Consumer Behaviors. Ph.D. Thesis, Dankook University, Cheonan, Korea, 2005. [Google Scholar]
- Lee, N.R. Effects of Cultural Tourism Marketing Mix on Tourism Destination Brand Equity. Ph.D. Thesis, Hanyang University, Seoul, Korea, 2008. [Google Scholar]
- Tasci, A.D.A.; Gartner, W.C.; Cavusgil, S.T. Conceptualization and operationalization of destination image. J. Hosp. Tour. Res. 2007, 31, 194–223. [Google Scholar] [CrossRef]
- Gartner, W.C.; Konecnik Ruzzier, M. Tourism destination brand equity dimensions: Renewal versus repeat market. J. Travel Res. 2011, 50, 471–481. [Google Scholar] [CrossRef]
- Gnoth, J. Leveraging export brands through a tourism destination brand. Brand Manag. 2002, 9, 262–280. [Google Scholar] [CrossRef]
- Qu, H.; Kim, L.; Im, H. A model of destination branding: Integrating the concepts of the branding and destination image. Tour. Manag. 2011, 32, 465–476. [Google Scholar] [CrossRef]
- Kim, Y. Measuring the economic value of public relations. J. Public Relat. Res. 2001, 13, 3–26. [Google Scholar] [CrossRef]
- Ha, O.S. Apparel Brand Appraisal: Focused on Sports Apparel. Ph.D. Thesis, Dongguk University, Seoul, Korea, 2004. [Google Scholar]
- Tsai, H.; Lo, A.; Cheung, C. Measuring customer-based casino brand equity and its consequences. J. Travel Tour. Mark. 2013, 30, 806–824. [Google Scholar] [CrossRef]
- Camarero, C.; Garrido, M.J.; Vicente, E. Components of art exhibition brand equity for internal and external visitors. Tour. Manag. 2010, 31, 495–504. [Google Scholar] [CrossRef]
- Liu, C.R.; Liu, H.K.; Lin, W.R. Constructing customer-based museums brand equity model: The mediating role of brand value. Int. J. Tour. Res. 2015, 17, 229–238. [Google Scholar] [CrossRef]
- Washburn, J.H.; Plank, R.E. Measuring brand equity: An evaluation of a consumer-based brand equity scale. J. Mark. Theory Pract. 2002, 10, 46–62. [Google Scholar] [CrossRef]
- Abubakar, A.M.; Ilkan, M. Impact of online WOM on destination trust and intention to travel: A medical tourism perspective. J. Destin. Mark. Manag. 2016, 5, 192–201. [Google Scholar] [CrossRef]
- Byon, K.K.; Zhang, J. Development of a scale measuring destination image. Mark. Intell. Plan. 2010, 28, 508–532. [Google Scholar] [CrossRef]
- Cervera-Taulet, A.; Schlesinger, M.W.; Yagüe-Guillen, M.J. Influence of advertizing on brand personality in the airline sector: The case of Spain. J. Travel Tour. Mark. 2013, 30, 445–454. [Google Scholar] [CrossRef]
- Chekalina, T.; Fuchs, M.; Lexhagen, M. Customer-based destination brand equity modeling: The role of destination resources, value for money, and value in use. J. Travel Res. 2018, 57, 31–51. [Google Scholar] [CrossRef]
- Lim, S.H.; Kim, T.H. Influence of customers’ on/off-line oral transmission on their evaluation of brand equity and revisit intention: Focused on family restaurants. J. Tour. Sci. 2010, 34, 61–83. [Google Scholar]
- Ryu, J.S. Structural Relationship between Tourism Marketing Communication and Elements of Brand Equity for Tourism Destination. Ph.D. Thesis, Kyung Hee University, Seoul, Korea, 2009. [Google Scholar]
- Brucks, M.; Zeithaml, V.; Naylor, G. Price and brand name as indicators of quality dimensions for consumer durables. J. Acad. Mark. Sci. 2000, 28, 359–374. [Google Scholar] [CrossRef]
- Smith, D.C.; Park, C.W. The effects of brand extensions on market share and advertising efficiency. J. Mark. Res. 1992, 29, 296–313. [Google Scholar] [CrossRef]
- Kirmani, A.; Wright, P. Money talks: Perceived advertizing expense and expected product quality. J. Consum. Res. 1989, 16, 344–353. [Google Scholar] [CrossRef]
- Yoo, J.H. Study of Components of Brand Equity: Focused on Emotional Relationship between Consumers and Brands. Ph.D. Thesis, Sungkyunkwan University, Suwon, Korea, 2004. [Google Scholar]
- Marine-Roig, E. Identity and authenticity in destination image construction. Anatolia 2015, 26, 574–587. [Google Scholar] [CrossRef]
- Marine-Roig, E.; Anton Clavé, S. Perceived image specialisation in multiscalar tourism destinations. J. Destin. Mark. Manag. 2016, 5, 202–213. [Google Scholar] [CrossRef]
- Kim, D.K. Influence of the Marketing Communication and Service Factor on the Service Brand Equity: Focusing on Automobile Insurance Brand. Ph.D. Thesis, Cheongju University, Cheongju, Korea, 2007. [Google Scholar]
- Oliver, R.L.; Swan, J.E. Equity and disconfirmation perceptions as influences on merchant and product satisfaction. J. Consum. Res. 1989, 16, 372–383. [Google Scholar] [CrossRef]
- Chi, C.G.; Qu, H. Examining the structural relationships of destination image, tourist satisfaction and destination loyalty: An integrated approach. Tour. Manag. 2008, 29, 624–636. [Google Scholar] [CrossRef]
- Lee, T.H. A structural model to examine how destination image, attitude, and motivation affect the future behavior of tourists. Leis. Sci. 2009, 31, 215–236. [Google Scholar] [CrossRef]
- Danaher, P.J.; Wilson, I.W.; Davis, R.A. A comparison of online and offline consumer brand loyalty. Mark. Sci. 2003, 22, 461–476. [Google Scholar] [CrossRef]
- Henderson, J.C. Selling places: The New Asia—Singapore brand. J. Tour. Stud. 2000, 11, 36–44. [Google Scholar]
- Jones, T.O.; Sasser, W.E., Jr. Why satisfied customers defect. Harv. Bus. Rev. 1995, 73, 88–99. [Google Scholar] [CrossRef]
- Day, G.S. A two-dimensional concept of brand loyalty. J. Adv. Res. 1969, 9, 29–35. [Google Scholar]
- Hsu, C.H.C.; Oh, H.; Assaf, A.G. A customer-based brand equity model for upscale hotels. J. Travel Res. 2011, 51, 81–93. [Google Scholar] [CrossRef]
- Seo, I.G. Influence of Values and Image Perceived by the Nation’s Airlines’ Customers on Customers’ Satisfaction. Ph.D. Thesis, Daegu University, Daegu, Korea, 2003. [Google Scholar]
- Choi, S.M. Research on Shopping Tourists’ Emotional Consumption Tendencies, Loyal Brand Benefit, and Attachment. Ph.D. Thesis, Dong-A University, Busan, Korea, 2008. [Google Scholar]
- Kim, J.H. Relationship between marketing communication and service brand equity. Korea Contents Res. 2008, 8, 152–153. [Google Scholar]
- Rao, A.R.; Monroe, K.B. The effect of price, brand name, and store name on buyers’ perceptions of product quality: An integrated review. J. Mark. Res. 1988, 26, 351–357. [Google Scholar] [CrossRef]
- Krishnan, H.S.; Chakravart, D. Varieties of brand memory induced by advertising: Determinants, measures and relationships. In Brand Equity and Advertising; Aaker, D.A., Biel, A.L., Eds.; Lawrence Erlbaum: Hillsdale, NJ, USA, 1993; pp. 213–234. [Google Scholar]
- Taylor, S.A.; Celuch, K.; Goodwin, S. The importance of brand equity to customer loyalty. J. Prod. Brand Manag. 2004, 13, 217–227. [Google Scholar] [CrossRef]
Figure 1.
Research model of the study.


Table 1.
Classic studies on the definition of brand equity.
| Author | Definition of Brand Equity |
|---|---|
| Farguhar [55] | Brand equity is the added value of a product endowed by the brand name it carries when consumers have a good impression of that specific brand. |
| Baldinger [56] | From the perspective of consumers, distribution channels, participants, and enterprises, brand equity, compared to non-branded products, ensures higher revenues and margins and is an aggregate that provides more sustainable and differentiated advantages compared to competitors. |
| MacLachlan and Mulhern [57] | The increase in cash flows derived from using a brand (company perspective). Utility or value that cannot be explained by the properties of a particular product, the source of brand loyalty (customer perspective). |
| Aaker [1] | As a combination of reliability, brand equity associated with the symbol, and brand name which is added to a product or service, brand equity adds to or subtracts from the value provided by a product or service to a firm and to that firm’s customers. |
| Keller [49] | Brand equity is the differential effect of brand knowledge on consumer response to the marketing activities of the brand. |
| Simon and Sullivan [43] | Brand equity is the increased cash flows on branded products due to investment in the brand as compared to non-branded products. |
| Yoo, Donthu and Lee [50] | Brand equity is the differences in the consumers’ choices which is claimed to be the difference between branded and non-branded products. |
| Kang [13] | Brand equity ensures higher revenues and margins compared to non-branded products, and are an aggregate that provides stronger, sustainable, and differentiated advantages compared to competitors. |
Table 2.
Questionnaire composition and measurement scale.
| Variables | Researchers | Scales | |
|---|---|---|---|
| Brand equity influencing factors | Price (3), Advertisement (3), Promotion (3), Word of mouth (4) | Cobb-Walgren, Ruble and Donthu [42], Keller [34], Kirmani and Wright [78], Oliver and Swan [85], Smith and Park [79], Yoo, Donthu, and Lee [51]. | Interval scale |
| Brand equity components | Perceived quality (4), Brand awareness (3), Brand image (3) | Choi [94], Dodds, Monroe, and Grewal [59], Ha [67], Konecnik and Gartner [9], Taylor, Celuch, and Goodwin [98], Yoo, Donthu, and Lee [51], Zeithaml [58]. | |
| Brand loyalty | Brand loyalty (3) | Aaker [1], Ha [67], Keller [34], Konecnik and Gartner [9]. | |
| Demographic variable | Gender, Age, Marital status, Occupation, Education, Income, Location of residence. | Pretext | |
| Visit type | Number of visits, Purpose of visit, Source of information, Type of travel, Accompany, Motivation for visit, Inconvenience, Degree of satisfaction. | Pretext | |
Table 3.
Demographic features.
| Feature | Variable | Number of People | Percentage (%) |
|---|---|---|---|
| Gender | Male | 152 | 43.4 |
| Female | 198 | 56.6 | |
| Marital status | Married | 198 | 56.6 |
| Single | 152 | 43.4 | |
| Education | Up to high school | 99 | 28.3 |
| College/University | 224 | 64 | |
| Graduate school | 27 | 7.7 | |
| Occupation | Public official | 13 | 3.7 |
| Office worker | 72 | 20.6 | |
| Professional | 65 | 18.6 | |
| Production (factory) worker | 30 | 8.6 | |
| Sales/Service | 35 | 10 | |
| Self-employed | 37 | 10.6 | |
| Student | 44 | 12.6 | |
| Housewife | 17 | 4.9 | |
| Others | 37 | 10.6 | |
| Age | 20–29 | 123 | 35.1 |
| 30–39 | 109 | 31.1 | |
| 40–49 | 87 | 24.9 | |
| 50 or older | 31 | 8.9 | |
| Region of residence | China | 191 | 54.6 |
| Hong Kong | 71 | 20.3 | |
| Taiwan | 68 | 19.4 | |
| Others | 20 | 5.7 | |
| Individual monthly income (U.S. Dollar) | Up to 1000 | 27 | 7.7 |
| 1001–2000 | 84 | 24 | |
| 2001–3000 | 76 | 21.7 | |
| 3001–4000 | 53 | 15.1 | |
| More than 4000 | 110 | 31.4 | |
| Total | 350 | 100 | |
Table 4.
Information about visits to Seoul.
| Classification | Frequency | Percentage (%) | |
|---|---|---|---|
| Number of visits | First time | 207 | 59.1 |
| Two to three times | 109 | 31.1 | |
| Four to five times | 20 | 5.7 | |
| Six times or more | 14 | 4 | |
| Purpose of visiting Korea (Multiple responses) | Tourist attractions | 211 | 60.3 |
| Shopping | 118 | 33.7 | |
| Beauty and treatment | 15 | 4.3 | |
| Gambling | 10 | 2.9 | |
| Business trip | 48 | 13.7 | |
| Gourmet tour | 23 | 6.6 | |
| Festivals and performances | 21 | 6 | |
| Source of information | Travel agency | 182 | 52 |
| Acquaintance | 44 | 12.6 | |
| Internet | 53 | 15.1 | |
| Tour guide book | 9 | 2.6 | |
| Mass media | 36 | 10.3 | |
| Airline, Hotel | 12 | 3.4 | |
| Tourism organizations of Korea | 14 | 4 | |
| Type of travel | Individual | 90 | 25.7 |
| Group package | 260 | 74.3 | |
| Accompany | Alone | 39 | 11.1 |
| With families | 186 | 53.1 | |
| With friends/colleagues | 125 | 35.7 | |
| Motivation of visit (Multiple Responses) | Want to know Seoul | 101 | 28.9 |
| Close distance | 76 | 21.7 | |
| Cheap travel cost | 67 | 19.1 | |
| Shopping | 53 | 15.1 | |
| Recommendation of friends | 72 | 20.6 | |
| Visit filming scene location | 38 | 10.9 | |
| Advertisement | 38 | 10.9 | |
| Inconvenience (Multiple Responses) | Communication/Language | 244 | 69.7 |
| Signage and sign post for direction | 79 | 22.6 | |
| Traffic congestion | 26 | 7.4 | |
| Immigration procedures | 6 | 1.7 | |
| Obtaining travel visa | 3 | 0.9 | |
| Unfriendly tour guide | 13 | 3.7 | |
| Food | 37 | 10.6 | |
| Expensive cost | 52 | 14.9 | |
| Being forced to shop | 9 | 2.6 | |
| Degree of satisfaction | Very satisfied | 35 | 10 |
| Satisfied | 201 | 57.4 | |
| Neutral | 98 | 28 | |
| Dissatisfied | 15 | 4.3 | |
| Very dissatisfied | 1 | 0.3 | |
| Total | 350 | 100 | |
Table 5.
Result of confirmatory factor analysis (CFA) on brand equity influencing factor.
| Factor | Coefficient Estimate | Estimated Error | Standardized Coefficient Estimate | t | Concept Credibility | Dispersion Extraction Index |
|---|---|---|---|---|---|---|
| Price | 1.000 | 0.853 | 0.809 | 0.595 | ||
| 0.708 | 0.092 | 0.582 | 7.719 *** | |||
| 0.717 | 0.094 | 0.565 | 7.621 *** | |||
| Advertisement | 1.000 | 0.711 | 0.767 | 0.526 | ||
| 1.119 | 0.110 | 0.712 | 10.157 *** | |||
| 0.736 | 0.085 | 0.567 | 8.689 *** | |||
| Promotion | 1.000 | 0.696 | 0.791 | 0.558 | ||
| 0.832 | 0.079 | 0.697 | 10.528 *** | |||
| 0.717 | 0.075 | 0.614 | 9.550 *** | |||
| Word of mouth | 1.000 | 0.59 | 0.812 | 0.520 | ||
| 1.150 | 0.137 | 0.59 | 8.391 *** | |||
| 1.064 | 0.124 | 0.61 | 8.582 *** | |||
| 1.182 | 0.132 | 0.653 | 8.978 *** |
*** p < 0.001.
Table 6.
Result of confirmatory factor analysis (CFA) on components of brand equity and brand loyalty.
Table 6.
Result of confirmatory factor analysis (CFA) on components of brand equity and brand loyalty.
| Factor | Coefficient Estimate | Estimated Error | Standardized Coefficient Estimate | t | Concept Credibility | Dispersion Extraction Index |
|---|---|---|---|---|---|---|
| Brand perceived quality | 1.000 | 0.638 | 0.812 | 0.519 | ||
| 1.083 | 0.107 | 0.709 | 10.134 *** | |||
| 0.814 | 0.089 | 0.612 | 9.129 *** | |||
| 0.903 | 0.100 | 0.6 | 8.999 *** | |||
| Brand awareness | 1.000 | 0.562 | 0.704 | 0.548 | ||
| 1.193 | 0.126 | 0.754 | 9.474 *** | |||
| 0.828 | 0.107 | 0.536 | 7.710 *** | |||
| Brand image | 1.000 | 0.723 | 0.834 | 0.626 | ||
| 1.193 | 0.084 | 0.733 | 12.099 *** | |||
| 0.828 | 0.078 | 0.678 | 11.299 *** | |||
| Brand loyalty | 1.000 | 0.78 | 0.813 | 0.593 | ||
| 0.823 | 0.066 | 0.709 | 12.533 *** | |||
| 1.884 | 0.078 | 0.639 | 11.285 *** |
*** p < 0.001.
Table 7.
Relation analysis on brand equity’s influencing factors and components.
| Hypothesis | Path Coefficient | Estimated Error | Standardization of Path Coefficient | t (C. R.) | Verification of Hypothesis |
|---|---|---|---|---|---|
| H1a Price → Brand perceived quality | 0.111 | 0.056 | 0.134 | 1.992 * | Supported |
| H1b Advertisement → Brand perceived quality | 0.073 | 0.107 | 0.808 | 0.676 | Rejected |
| H1c Promotion → Brand perceived quality | 0.057 | 0.133 | 0.066 | 0.430 | Rejected |
| H1d Oral tradition → Brand perceived quality | 0.899 | 0.200 | 0.673 | 4.449 *** | Supported |
| H2a Price → Brand awareness | 0.143 | 0.053 | 0.175 | 2.677 ** | Supported |
| H2b Advertisement → Brand awareness | −0.025 | 0.111 | −0.028 | −0.226 | Rejected |
| H2c Promotion → Brand awareness | 0.330 | 0.129 | 0.386 | 2.561 * | Supported |
| H2d Oral tradition → Brand awareness | 0.578 | 0.158 | 0.443 | 3.666 *** | Supported |
| H3a Price → Brand image | −0.074 | 0.065 | −0.085 | −1.134 | Rejected |
| H3b Advertisement → Brand image | 0.263 | 0.119 | 0.277 | 2.216 * | Supported |
| H3c Promotion → Brand image | −0.207 | 0.152 | −0.228 | −1.360 | Rejected |
| H3d Oral tradition → Brand image | −0.291 | 0.265 | −0.211 | −1.098 | Rejected |
| H4 Brand awareness → Brand perceived quality | −0.034 | 0.145 | −0.034 | −0.235 | Rejected |
| H5 Brand awareness → Brand image | 0.915 | 0.206 | 0.864 | 4.445 *** | Supported |
| H6 Brand perceived quality → Brand image | 0.316 | 0.144 | 0.302 | 2.197 * | Supported |
| H7 Brand perceived quality → Brand loyalty | 0.491 | 0.100 | 0.408 | 4.899 *** | Supported |
| H8 Brand image → Brand loyalty | 0.637 | 0.096 | 0.554 | 6.609 *** | Supported |
* p < 0.05, ** p < 0.01, *** p < 0.001.
© 2018 by the authors. Licensee MDPI, Basel, Switzerland. This article is an open access article distributed under the terms and conditions of the Creative Commons Attribution (CC BY) license (http://creativecommons.org/licenses/by/4.0/).
Share and Cite
MDPI and ACS Style
Kim, H.-K.; Lee, T.J. Brand Equity of a Tourist Destination. Sustainability 2018, 10, 431. https://doi.org/10.3390/su10020431
AMA Style
Kim H-K, Lee TJ. Brand Equity of a Tourist Destination. Sustainability. 2018; 10(2):431. https://doi.org/10.3390/su10020431
Chicago/Turabian StyleKim, Hwa-Kyung, and Timothy J. Lee. 2018. "Brand Equity of a Tourist Destination" Sustainability 10, no. 2: 431. https://doi.org/10.3390/su10020431
Note that from the first issue of 2016, this journal uses article numbers instead of page numbers. See further details here.