1. Introduction
Effective air traffic operations depend on the performance of all the actors involved in this process, such as the airport, the airline, the network manager, and the air navigation service provider [
1]. Even though the airline companies are implementing a time-buffer scheme to compensate for the deviations from the operational level, delays in air transportation are a reality. Eurocontrol (2018) indicates an average delay of 12.4 min per flight, in Europe, in 2017, an increase of 1.1 min per flight, as compared to 2016. As for punctuality, only 80% of the flights, in 2017, arrived on time, with a slight difference compared to 2016, when 81% of the flights arrived on time.
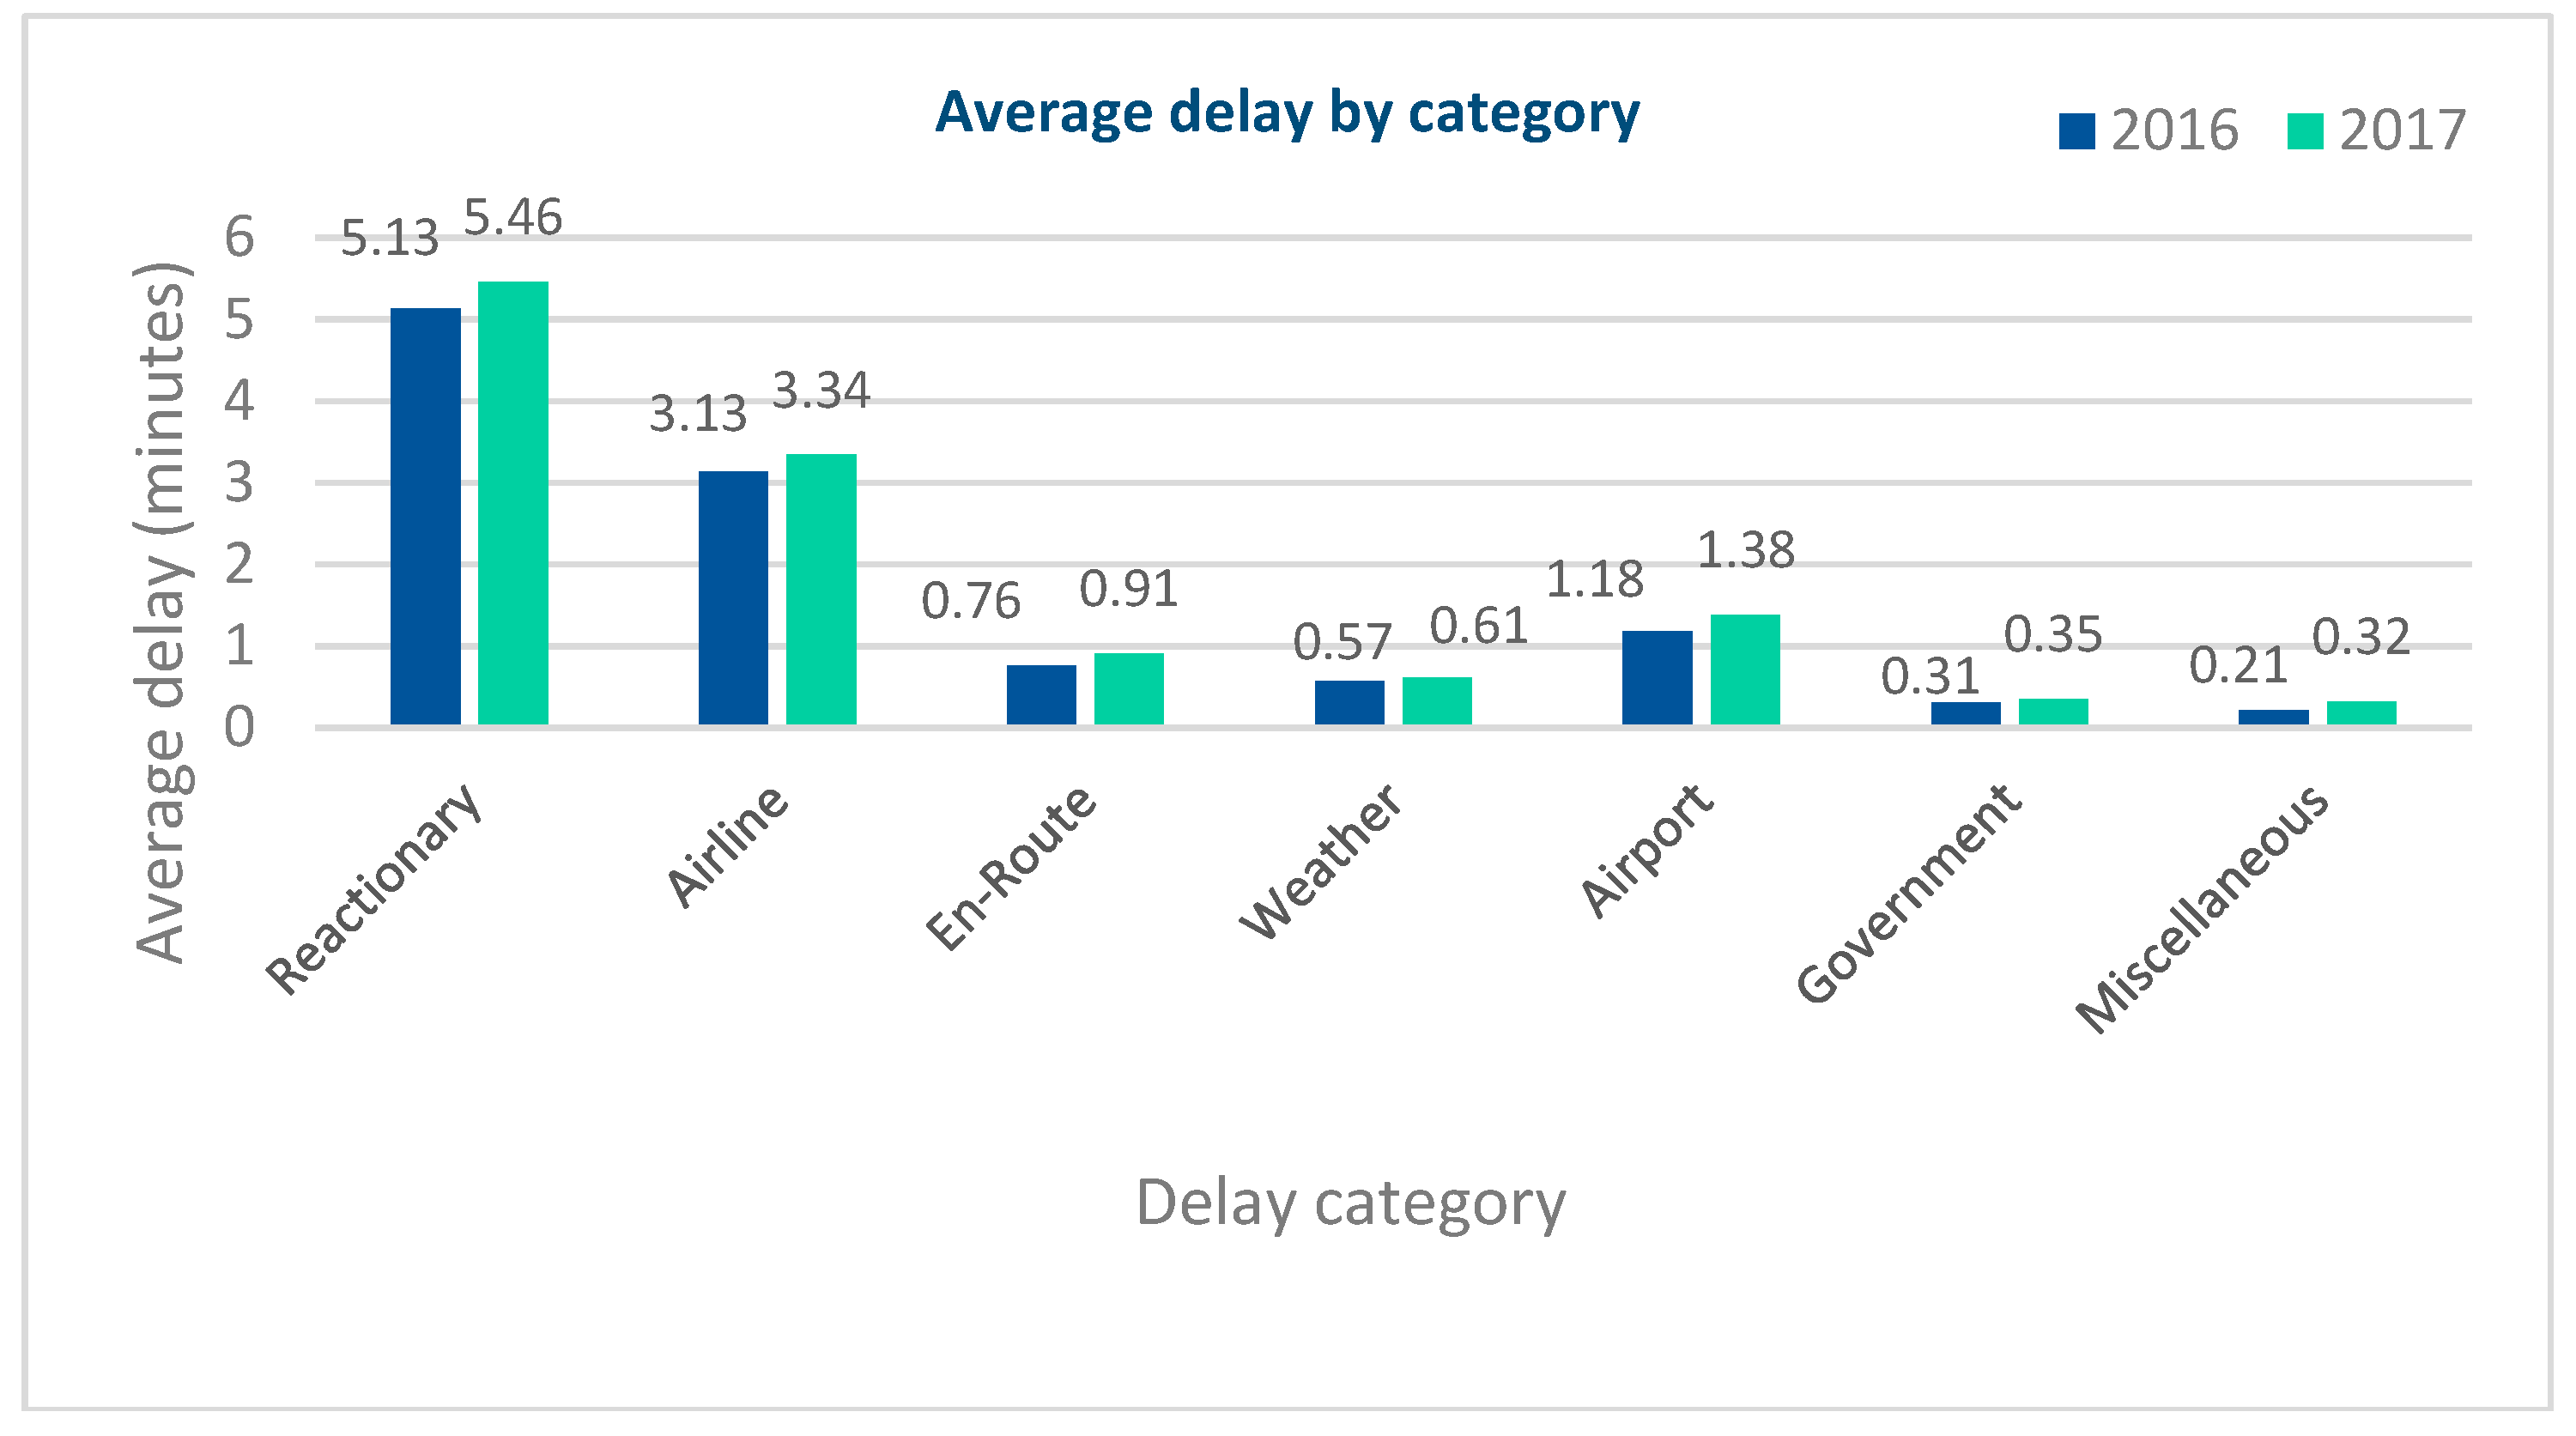
Considering the standard delay codes defined by the Airport Handling Manual [
2], the departure delays can be segregated into seven major categories, depending on their cause—airline (starting with delays due to passenger and luggage and ending with flight operations and crewing, codes 11–69), airport (air traffic flow management due to restrictions at the destination airport and restrictions at the airport of departure, codes 83–89), en-route (air traffic flow management due to en-route demand/capacity/staff/equipment, codes 81 and 82), governmental (security and immigration, codes 85 and 86), weather (weather other than air traffic flow management and air traffic flow management due to weather of the destination, codes 71–77 and 84), miscellaneous (code 98–99), and reactionary (late arrival of aircraft, crew, passengers or load, code 91–96). Analyzing the average values of each of these categories, we observe that the greatest contribution is brought by the reactionary delays (5.46 min per flight in 2017, with 0.33 min per flight more than that in 2016), followed by airline delays (3.34 min per flight, with an increase of 0.21 min per flight, compared to 2016), as illustrated in
Figure 1.
Reviewing the most recent reports, we found five categories to have the most significant effects on airplanes delay—reactionary, airline, en-route, weather, and airport.
Figure 2 provides the share of the most significant causes of delay, considering each hour of the day [
3].
For the reactionary delay, Cook and Tanner [
4] determined that across all European flights, in 2014, for each minute of primary delay, on average, another 0.8 min of reactionary delay were generated in the network, thus, a delay from a single flight can generate costs, not only for the company, but also for other flights within the network.
Eurocontrol report (2018) showed that the departure turnaround delays, due to airline and airport causes, were as much as 38% of the total delay time encountered within each flight, which demand a higher attention to sustainable improvement of the turnaround efficiency [
3]. Among the elements contributing to the turnaround time, the boarding procedure plays an important role as its efficiency has a direct impact on reducing the passengers boarding time [
5,
6]. Steffen (2008) determined that the overall passenger boarding time takes longer than refueling and restocking, while both activities are part of the turnaround time and could be conducted in parallel with the boarding procedure [
7]. Thus, we believe that the boarding time reduction can constitute a significant cost savings to a particular airline, especially for airplanes making several flights a day. Additionally, Ferrari and Nagel (2005) stated that passenger boarding is the element that takes the longest time and it is the most important factor for reducing the turnaround time and its associated cost [
8]. Nyquist and McFadden (2009) estimated that the delay cost is as much as
$30 per minute for an airplane [
9,
10]. This cost is associated with any active airplane waiting for the boarding process to complete.
As a result, a series of boarding strategies have been developed in the literature. Among them, only few have been actually used in practice and opinions regarding which is the best boarding method have not reached consensus. Furthermore, there are studies conducted by researchers, such as Steffen (2008) who argues that the free-for-all model, also known as random boarding without assigned seats, achieves nearly the same boarding time as some of the best boarding strategies with assigned seats, such as WilMA ((window-middle-aisle) which requires boarding the window seats first, then the middle seats, and then the aisle seats) [
7,
11].
As for the modeling approaches, a series of papers deal with the use of discrete event simulation [
12,
13] and agent-based modeling [
14]. A comprehensive review of the well-known papers written in this domain, is available in Jaehn and Neumann’s paper [
5] and in that by Hutter et al. [
15].
The purpose of this paper is to meticulously model passenger behavior, especially in random boarding without assigned seats, with other common boarding methods. In particular, we aim to test the efficiency of the random boarding without assigned seats method when used as the primary boarding method employed by airlines, in comparison with the other commonly-adopted methods (random boarding with assigned seats, WilMA, back-to-front, reverse pyramid, etc.). For our purpose, we have created an agent-based model that simulates both the boarding process and passengers’ behavior for each of the methods. We used the NetLogo, originally developed by Wilensky and Rand, to implement the agent-rules and behaviors [
16].
As most of the boarding methods, except for the random without assigned seats method, have strict rules for agent behavior, they are relatively easy to implement in the NetLogo. For random boarding without assigned seats, however, we faced the void of rules for passenger seating selection related to choosing a seat. Furthermore, the reasoning process passengers use while selecting their seats is the main determinant of boarding, when the random method without assigned seats is used. As a result, the main challenge was the identification of the human passengers’ way of reasoning, when selecting their seats and creating a model in which agents possess preferences and make decisions, as close to that of the human subjects, as possible. Thus, we created a questionnaire to extract passengers’ preferences and properly modeled them in the NetLogo, using agents.
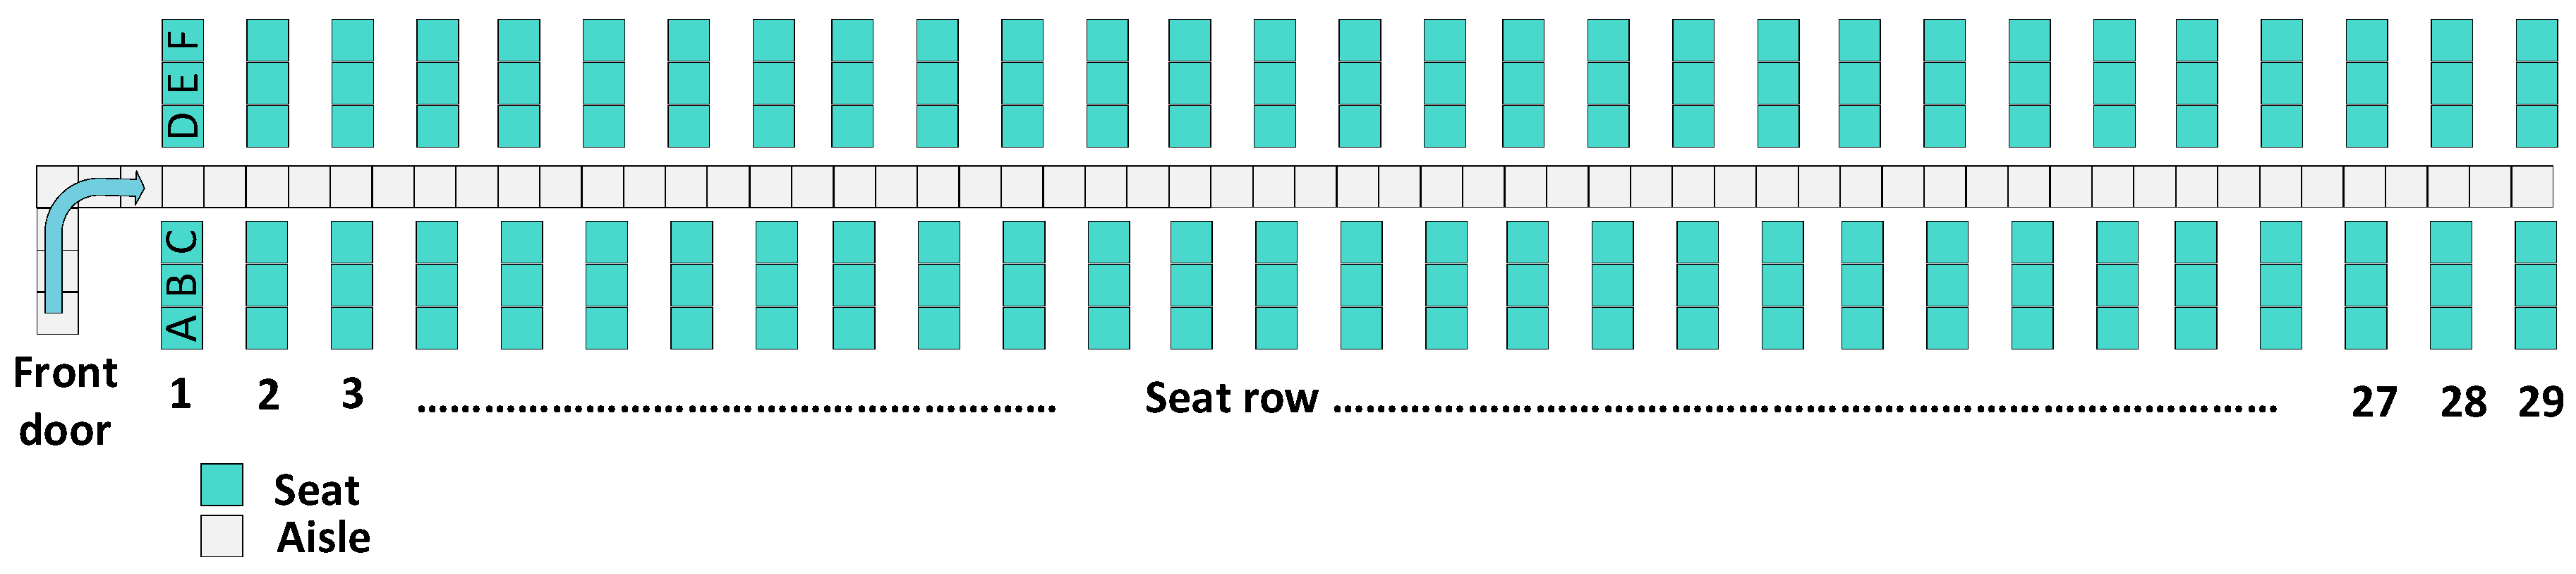
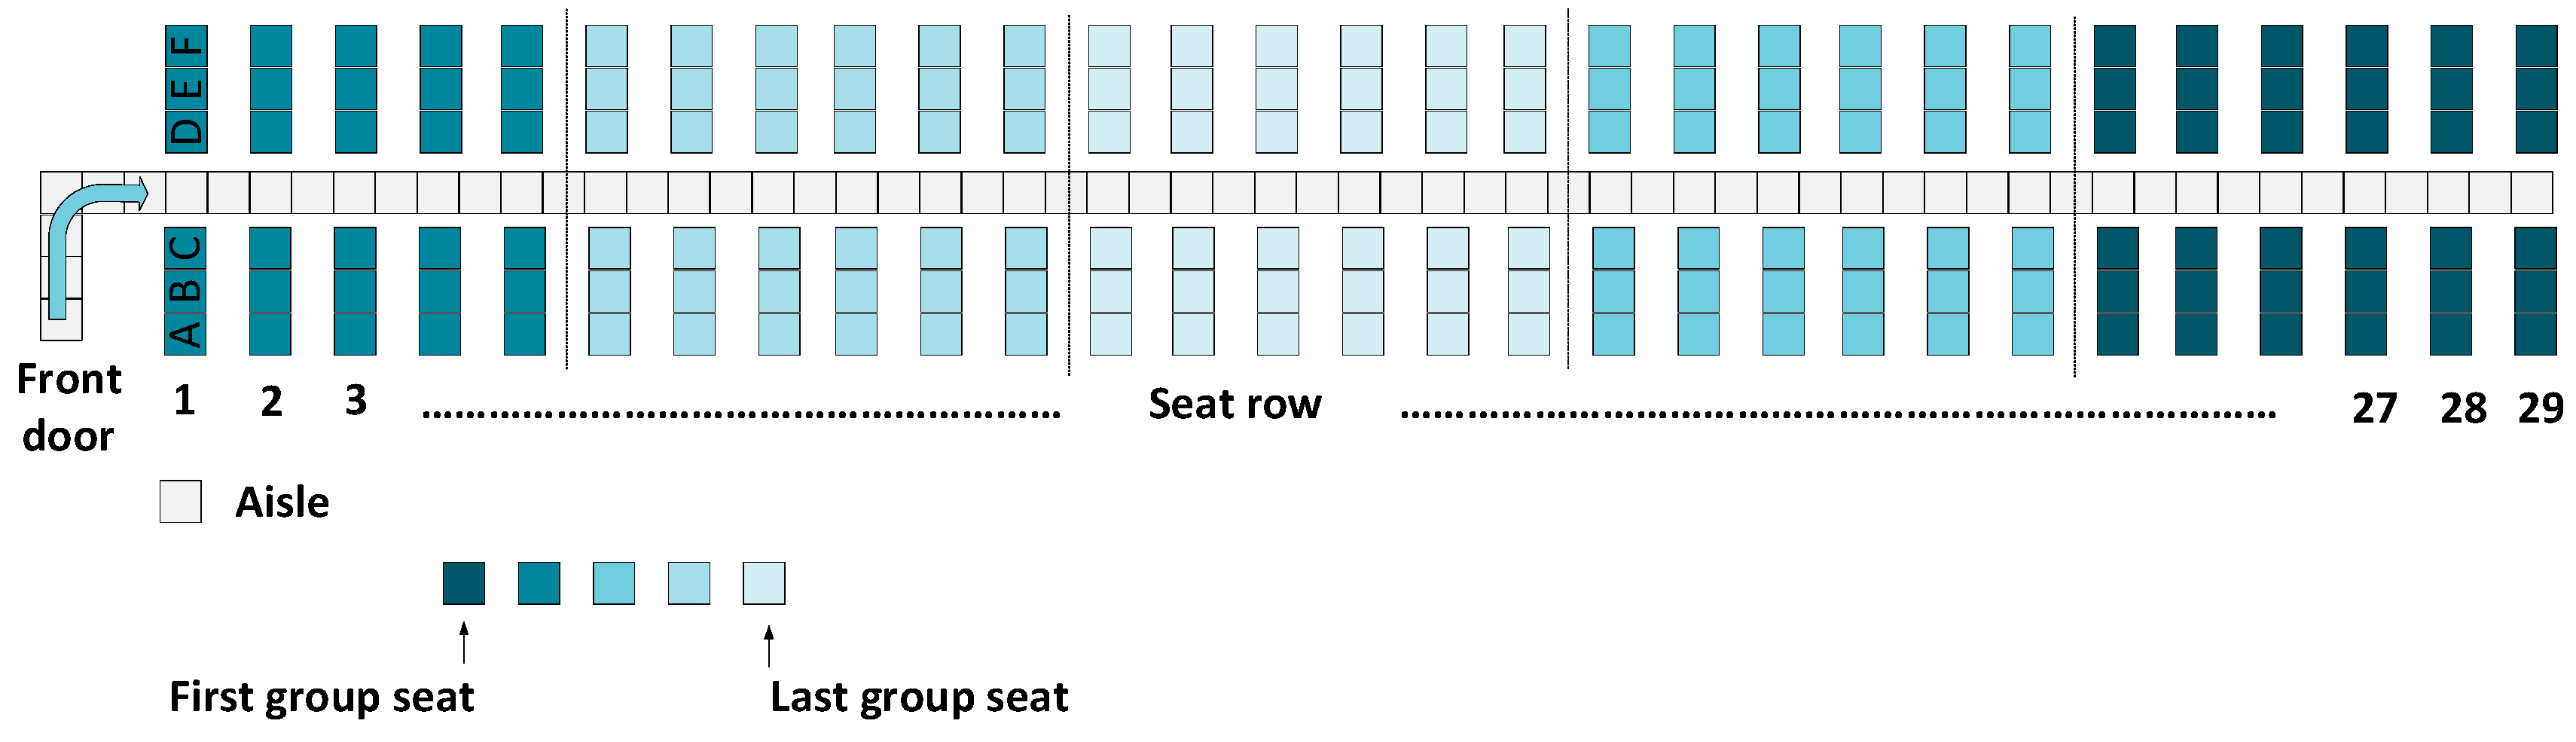
We used the Airbus A320 seat configuration to compare the boarding time of the methods we studied in this work, as shown in
Figure 3 [
17]. We selected this model of airplane as because Ferrari and Nagel (2005) suggested that one should be interested in the short-haul flights optimization, as their percentage of turnaround time is much bigger than those of the long, intercontinental flights [
8]. Additionally, the authors believe that when trying to compare different boarding strategies, one should consider an airplane with standard dimensions, even though the authors acknowledge that some of the strategies might depend on the aircraft model, and therefore, these strategies may perform different in different airplane configurations. As, in reality, the airline companies have the same boarding strategy for all the flights and do not changing it depending on the aircraft type, we think that a single configuration for testing all identified boarding strategies could provide the necessary knowledge. Nevertheless, according to the literature, a common airplane model to use, when simulating boarding methods, is the A320 [
8,
12,
13,
17,
18,
19].
Even though the airline companies have the information related to the average boarding time for each type of flight and aircraft, it is hard to compare them by using only this information, due to the limited access to information, the different seat configuration each company has for the same aircraft model, and the different number of passengers boarding each flight. As a way of illustration, the Airbus A320 can have from twenty-three seat rows in the United or the China Southern airplanes (excluding the first class row seats) to thirty-one seat rows in the EasyJet or the AirAsia airplanes. Thus, a simulation on the basis of a single type of aircraft, seems wise.
Creating a model based on agents and simulating the real-life boarding methods, in the same environment, can bring insight into the analysis of boarding methods. In addition, considering the passengers’ behavior could help us discover that some methods, which are not common in today’s applications, are more effective than what may have been previously assumed.
2. Classification of the Boarding Methods
While the research area related to creating new and improved boarding methods has faced a continuous advancement, in recent years, the practices of airline companies have not advanced as much; most of them have remained committed to the traditional boarding methods. One of the most used methods for boarding is still the random method and it is frequently used by almost all airline companies in Europe. The only change for the European companies has been the switch made in the last few years from using a random boarding without assigned seats, especially in the case of low-cost companies, such as Wizz Air, Ryanair, etc., to random boarding with assigned seats. Considering other boarding strategies, in 2013 the European airline company KLM conducted a pilot study on a reduced number of flights in which they combined, in a particular way, two of the most well-known methods in the literature—WilMA (window-middle-aisle) and back-to-front. As for the airline companies located outside Europe, it can be observed that most of them have embraced other boarding methods, such as back-to-front, WilMA, or the modified reverse pyramid. Even in this case, there are still companies who remain loyal to the random boarding method, but their number is decreasing.
In what follows, some key characteristics related to each of the boarding methods are presented, along with a short classification, based on the seating rules.
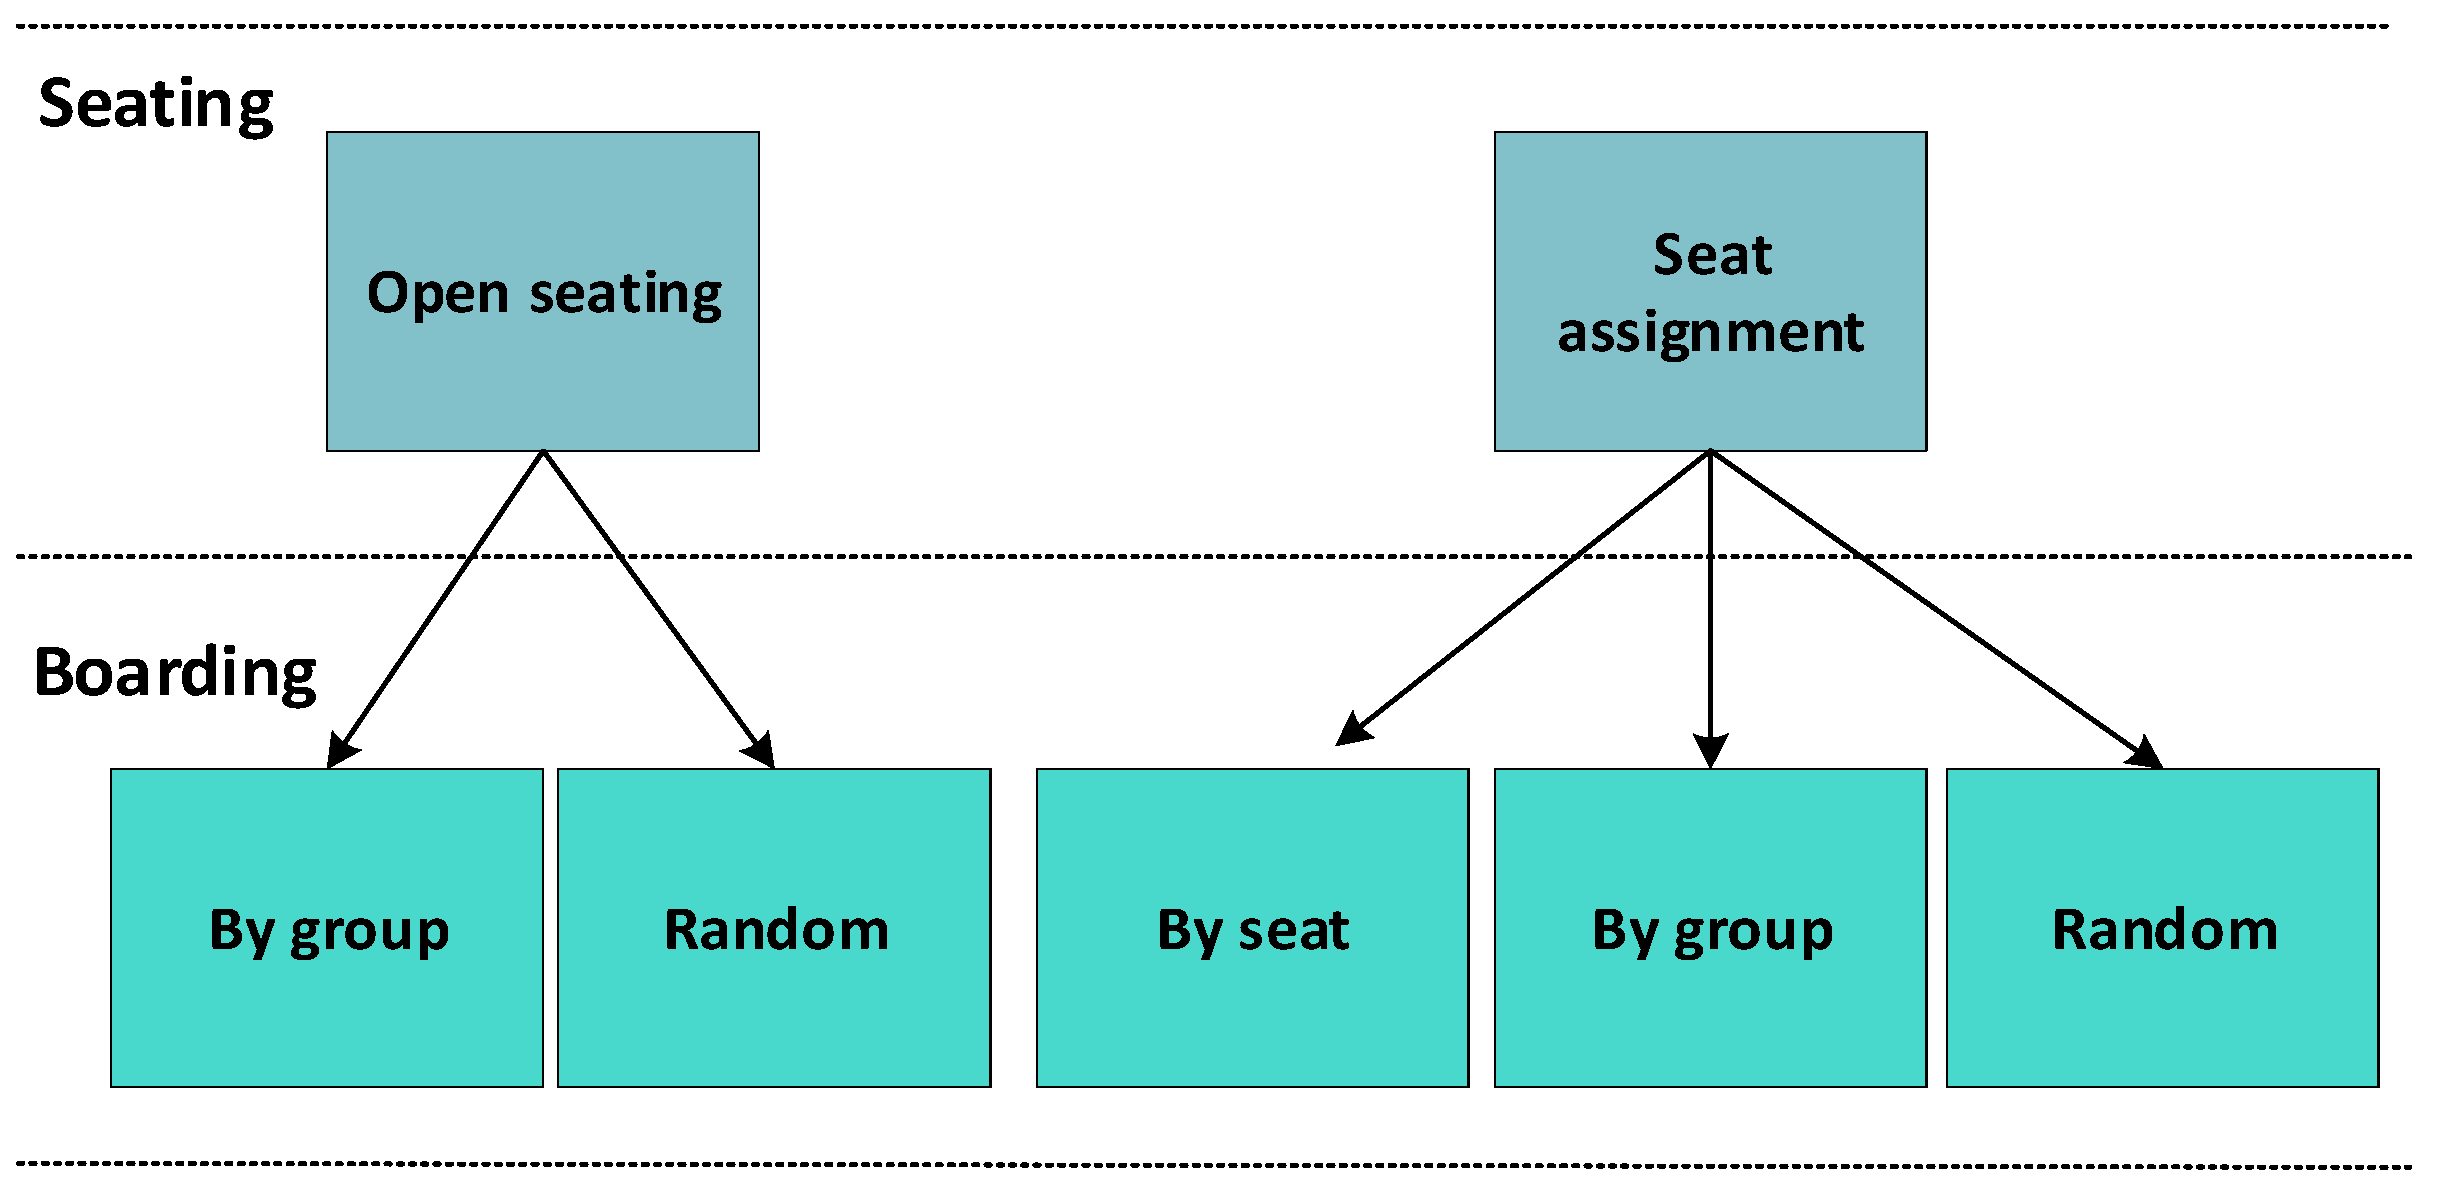
Based on the existence of a seat assignment or not, the boarding methods can be divided into two main categories—without an assigned seat, also called open seating, and with an assigned seat as illustrated in
Figure 4.
Among the open seating boarding methods category, two types of boarding methods are well-known—random boarding without assigned seats and open seating by group. Whereas, the boarding methods based on seat assignment can be divided into three major categories—random, by group, and by seat.
Considering the methods developed in the research area related to airplane boarding, most of them are in the seat assignment by group category—outside-in, window-to-aisle half-block, window-to-aisle alternate, reverse pyramid, reverse pyramid half-zone, back-to-front, back-to-front-mix, front-to-back, half-block back-to-front, by row front-to-back, by row back-to-front, by half-row front-to-back, rotating zone, modified optimal method, and the non-traditional method, etc. [
20,
21,
22,
23,
24]. Fewer methods have been developed with a consideration of the seat boarding—back-to-front by the seating order, descending order, the Steffen method, variations of the Steffen method, etc. [
7,
11,
25,
26,
27].
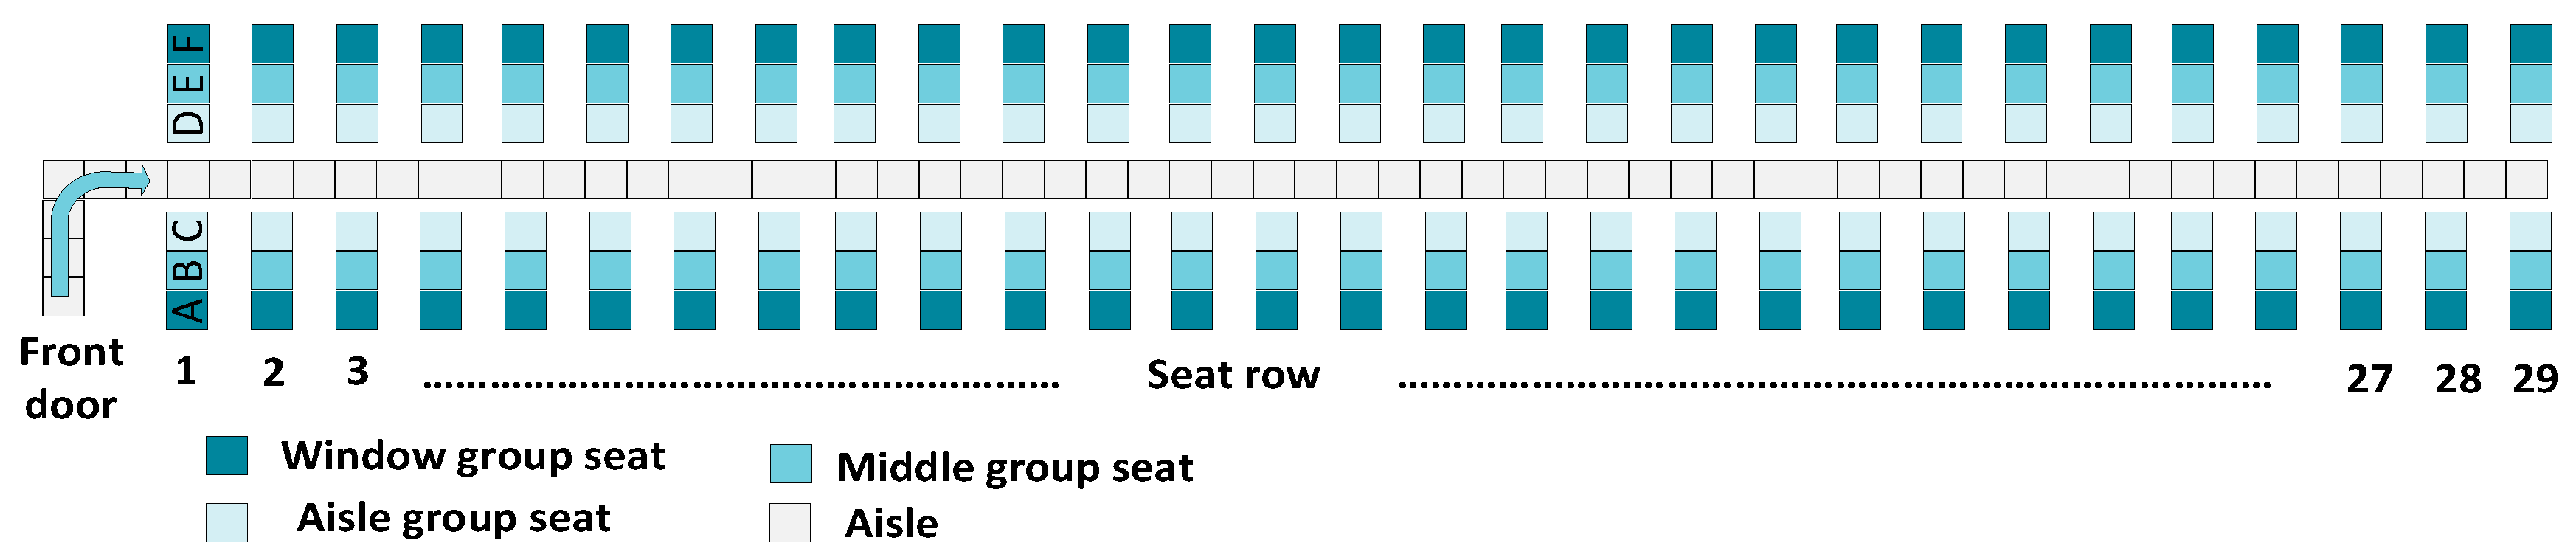
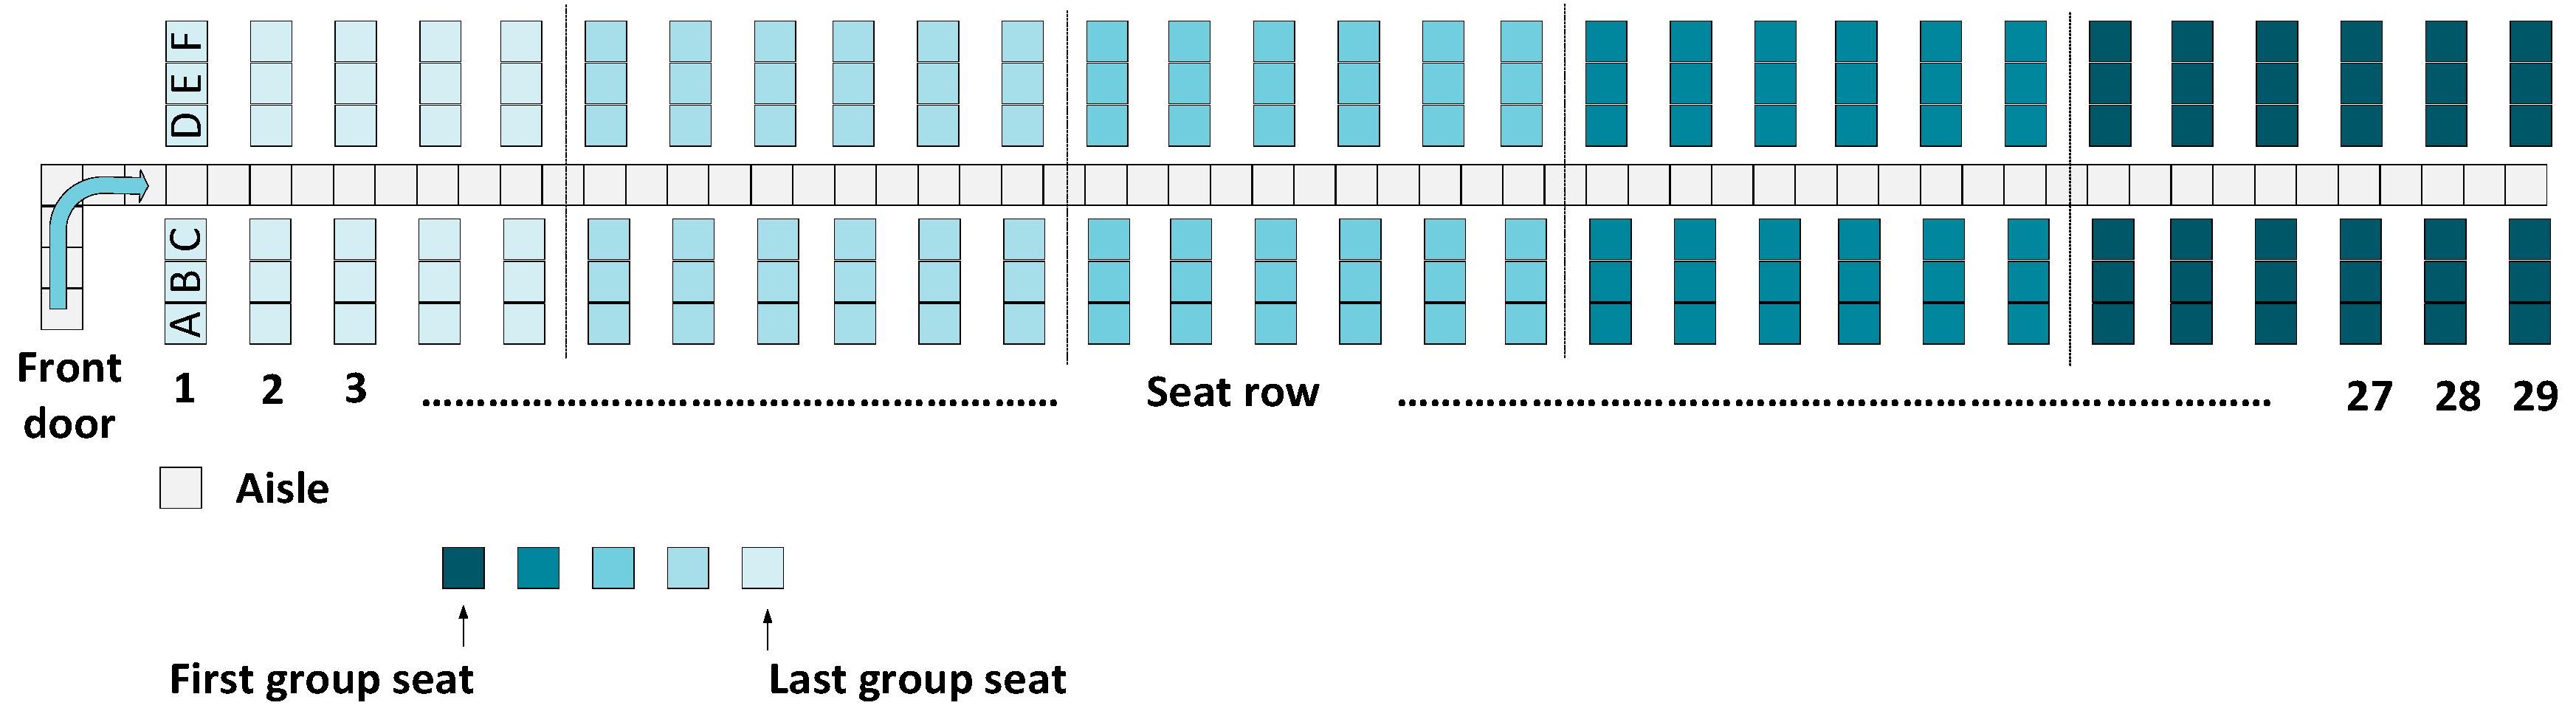
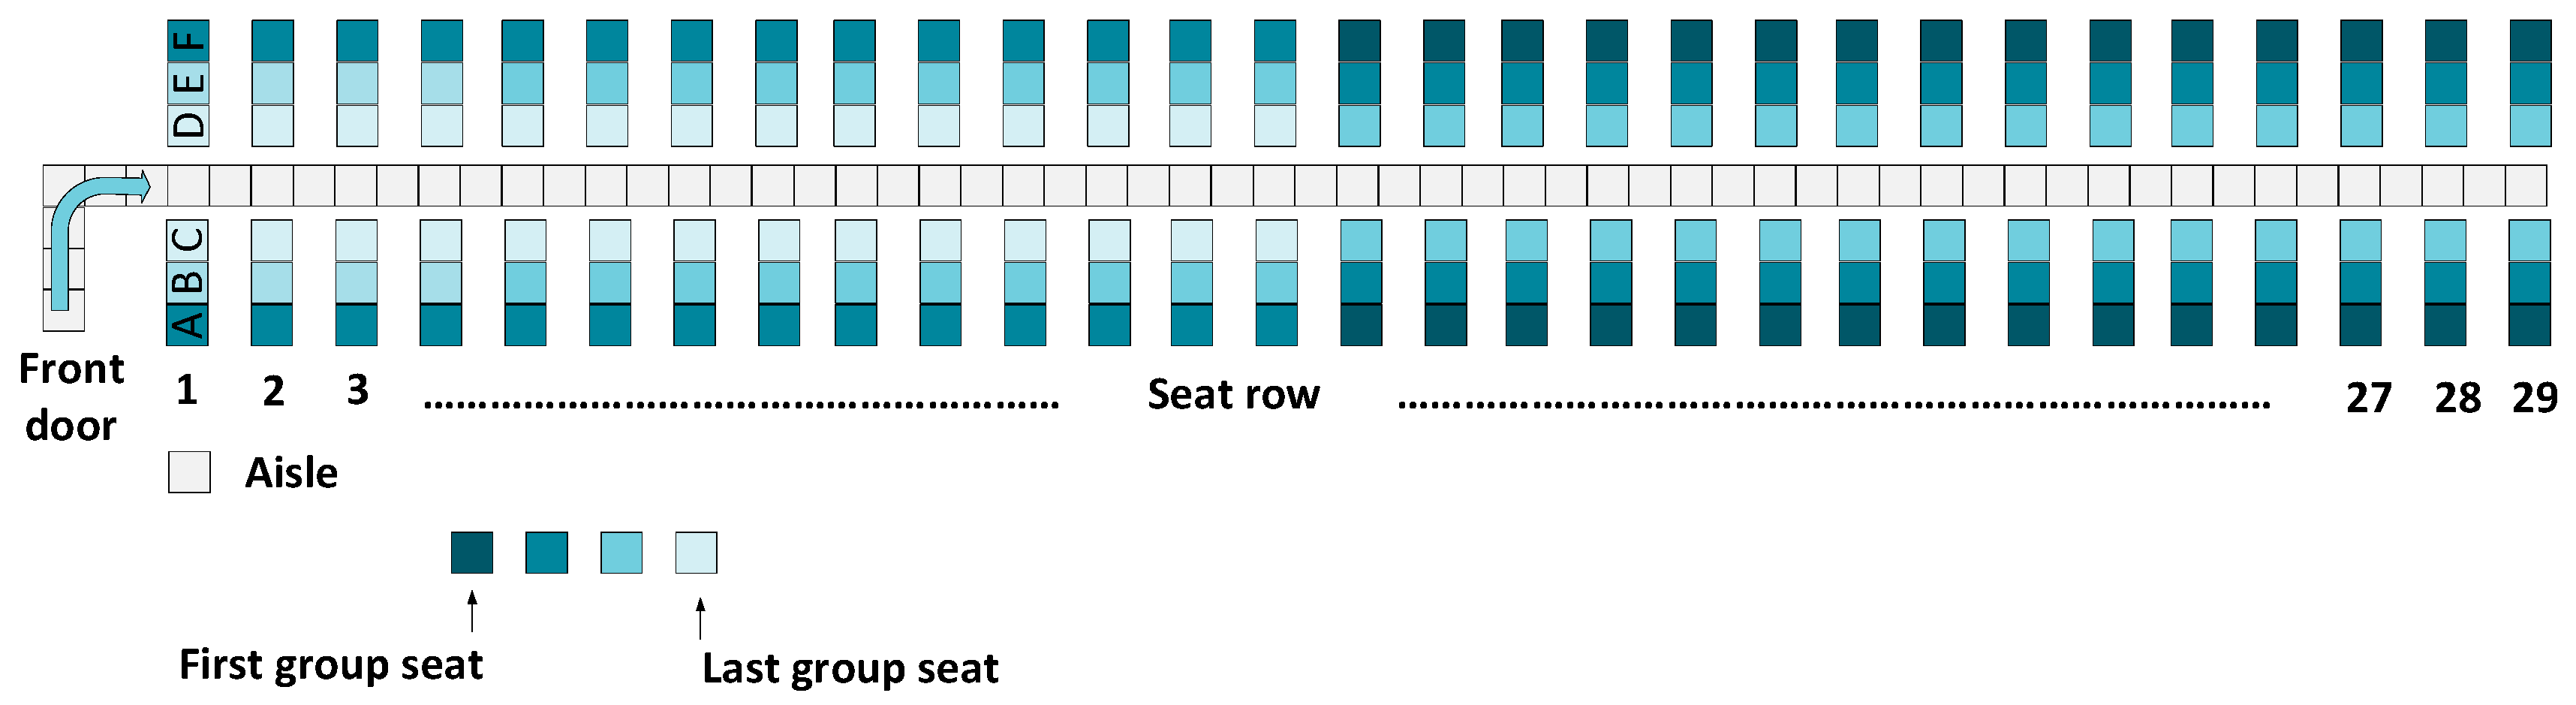
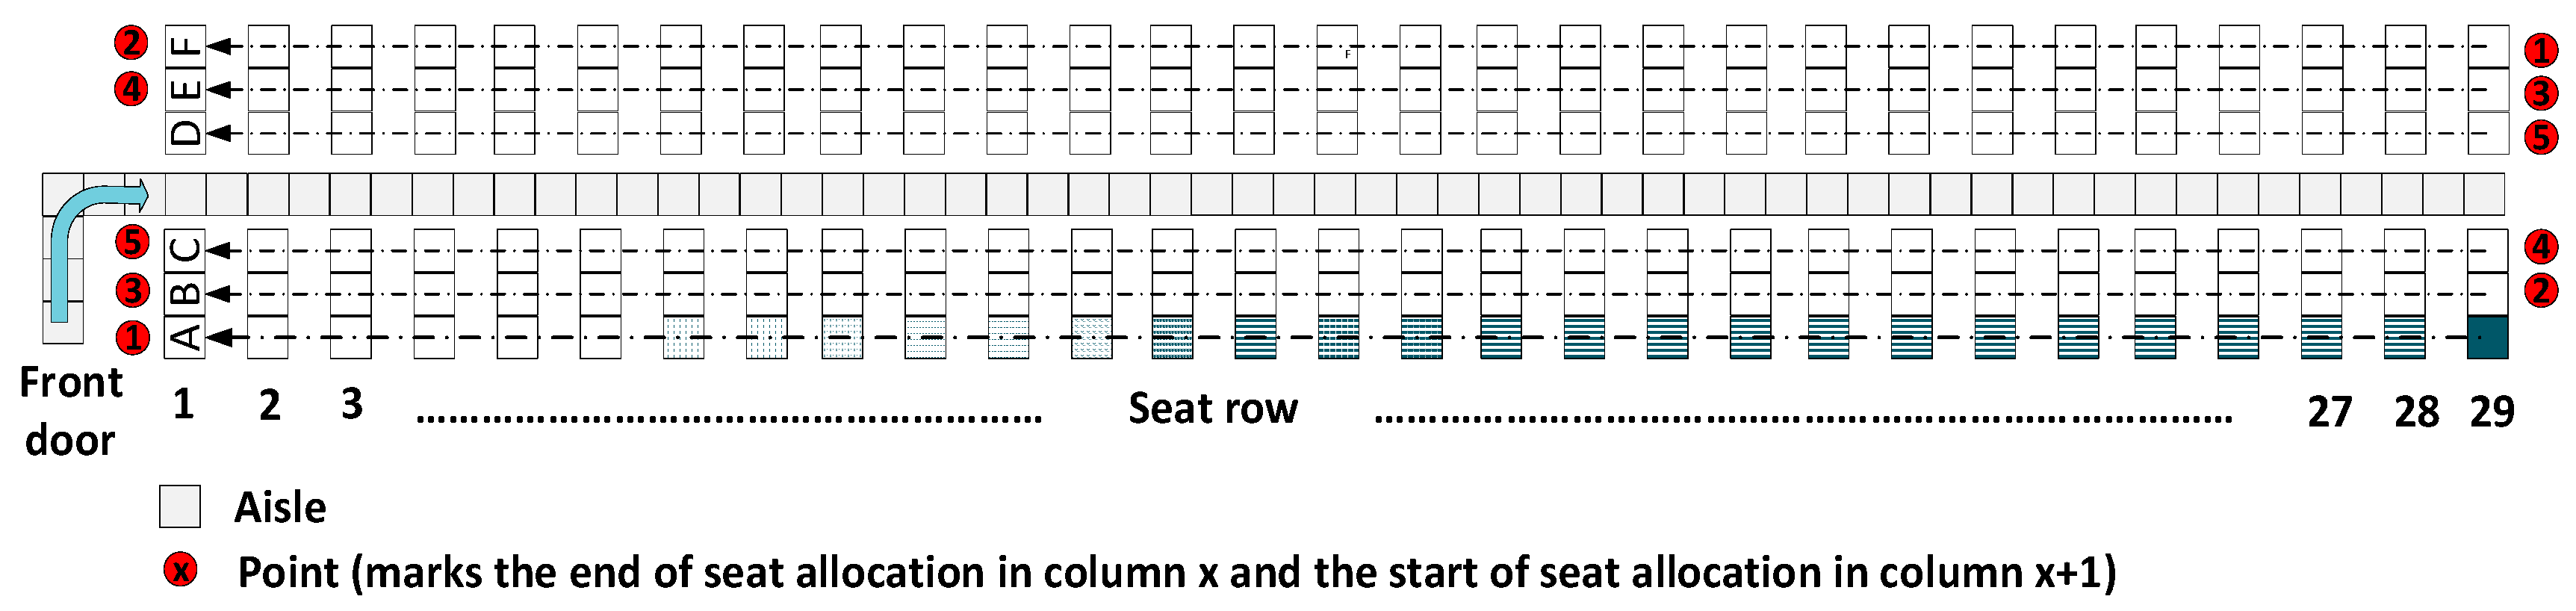
Considering seat assignment by group and seat assignment by seat categories, it should be mentioned that the main difference is in how the passengers are invited to board the plane. In the first situation, a series of groups are created, based on certain rules (for example, all the passengers with seats located near the windows form a group, those with middle seats form a second group, and those with aisle seats form a third one), and all the passengers that have seats within a selected group, board together, in a random manner. On the other hand, in the case of seat assignment by seat, the passengers are invited one-by-one, while also following some seating rules (such as—the first boarding person has the window seat, in the last row, on the left side of the aisle, the second passenger has the middle seat, in the last row, on the left side of the aisle, etc.) to occupy their assigned seats.
2.1. Random without Assigned Seats
Ferrari and Nagel (2005) say that open seats choice models are more difficult to simulate than the models with fixed seats as, in such a simulation, one should also consider that some human beings act differently than others, even in a same situation [
8]. For example, one passenger may prefer a window seat when another passenger prefers an aisle seat—even when both seats are available. Therefore, the authors believed that the following assumptions should be made when conducting such research—window and aisle seats are the passengers’ favorite places; empty rows will be preferred; just before sitting down, the passengers will ensure that there are no better places in the next few rows; it may happen that if passengers are in a queue for long, they lose their patience and accept more unsuitable seats than when the queue is shorter; if a passenger passes through the whole airplane and finds no open seat in the rear, he or she will probably sit down there to avoid changing walking directions to find a better seat.
Considering the literature, Steffen (2008) implemented a statistical mechanics model for this type of boarding by associating an energy with each seat in the aircraft [
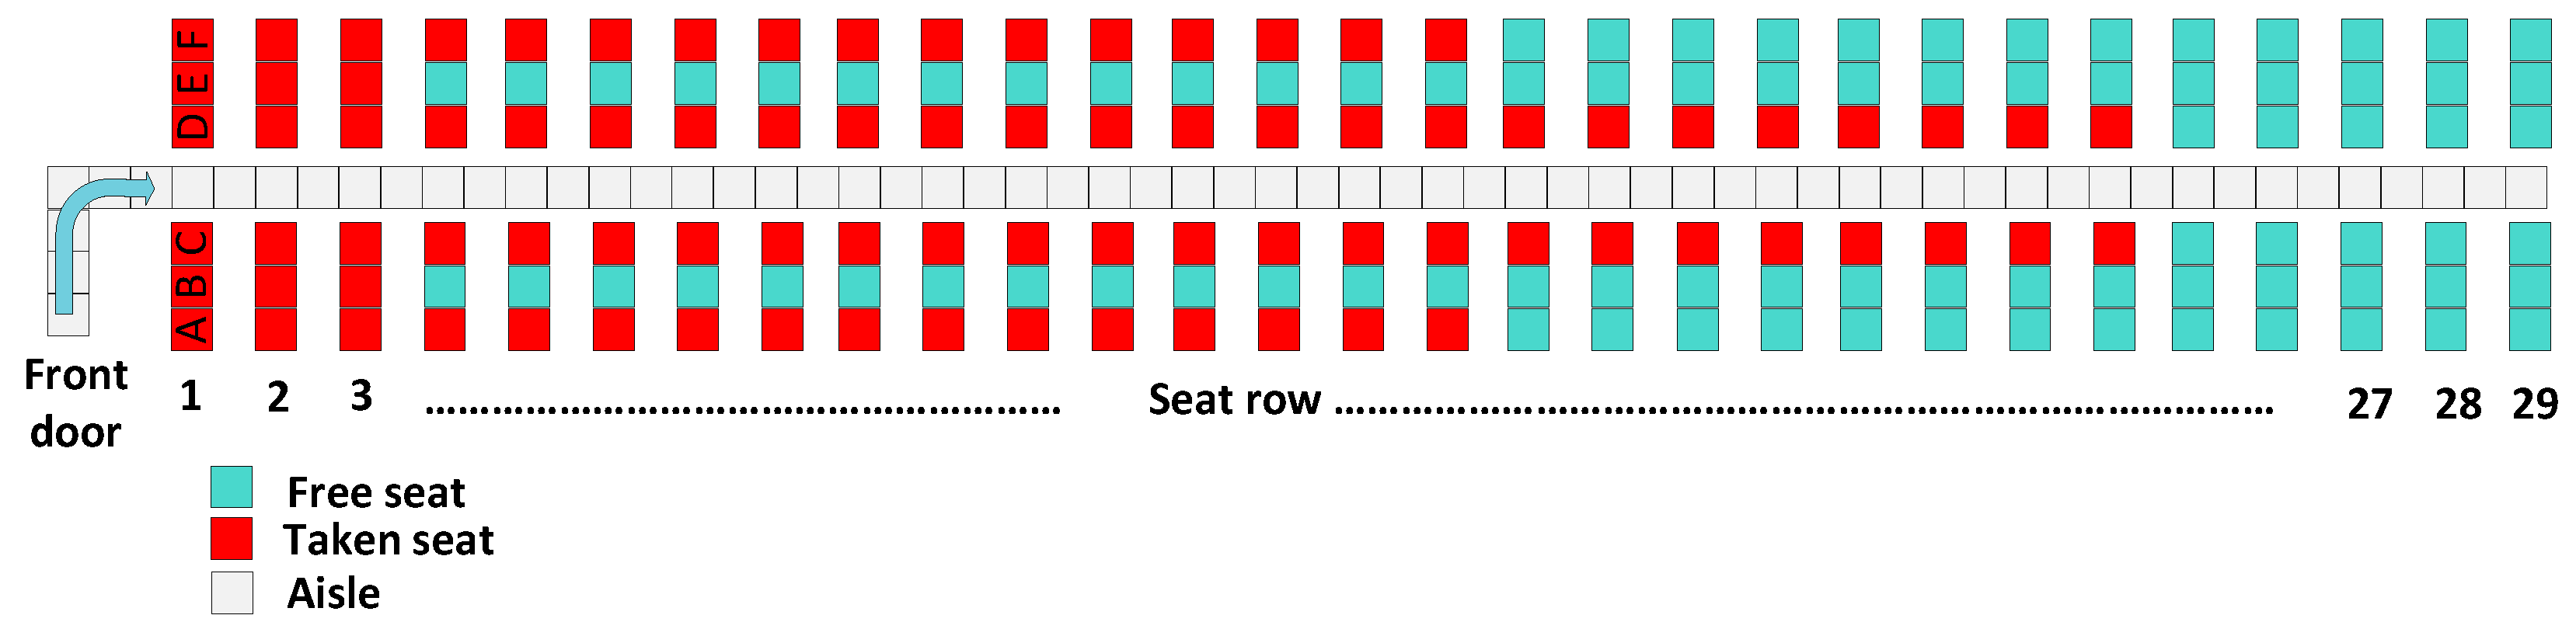
11]. Once a passenger enters the aircraft and finds his/her place, the energy associated with the remaining seats is modified. Even though his research is among the few studying this type of boarding and brings insight into this matter, he makes a series of assumptions that might differ from reality, such as:
Passengers prefer the aisle seats to the window ones, while the seats in the middle are less preferred than both the aisle and the window—the author states that the aisle seats are chosen 70% of the time, window seats 26% of the time, and the middle seats 4% of the time.
The front seats are more desirable than the back ones, for all passengers—the author considered linear increases in energies from the front to the rear of the aircraft, which corresponds to a 1% probability of the first passenger selecting a seat in the back row.
None of the model’s parameters have been compared empirically to passenger data.
Row interference is not considered;
Passengers’ apathy in seat selection is the same for the entire population—one can only select a higher or a lower value for this parameter, which would be applied to all the agents. When the values for apathy are high, all the seats are essentially equal, while when they are low, for example when equal to zero, the situation in
Figure 5 can be encountered all the time for a half-full airplane.
2.2. Boarding Methods Used by Airline Companies
As mentioned above, only few of the methods developed in the literature are actually used in practice.
Table 1 summarizes the boarding methods that are the most used, by some of the most well-known airline companies, around the world. The table shows their boarding policies for a given fare class. For instance, most airlines allow first class passengers to board before others, favor passengers with particular credit cards, with the basic economy passengers boarding last. Depending on the company, the number of boarding groups can be different. For example, the Alaska has five boarding groups (first class and four other groups, named using the letters A to D), while the American has no less than nine groups (starting with four groups in first or business class and ending with the ninth group formed by the basic economy passengers). The Delta has six boarding groups, which was increased from three groups, in 2018.
2.3. Other Boarding Methods Used by Airline Companies
Apart from the methods presented in
Table 1, reverse pyramid and rotating zones has been used by the America West and the AirTran, but were abandoned, following their mergers into larger airlines.
Reverse pyramid is a boarding method that was developed by a team from the Arizona State University and America West Airline’s personnel, and was implemented by America West, in its flights, starting from September 2003, until their mergers. The method is based on the traditional back-to-front boarding and the WilMA boarding used by the other companies, and it had the advantages of minimizing the expected passenger interference, in the airplane [
19]. Even though the scheme for reverse pyramid may seem confusing, the basic idea is represented in
Figure 10. Thus, it can be observed that the middle-back window seats are loaded first, followed by a part of the front window seats and the back middle seats, ending with the aisle seats. Some of this boarding method’s rules can be encountered in the modified-reverse-pyramid half zone boarding method, which is now used by JetBlue.
As for the rotating zone, the passengers sitting in the middle of the aircraft are boarded last, while the other passengers are divided, based on their sitting zones, and boarded first in the back, then in the front, in the back again, then the front, and so on, as illustrated in
Figure 11. The AirTran Airways, which ceased operations in 2014, following its acquisition by Southwest Airlines, used a rotating zone system [
28].
Knowing the rules that govern each of the boarding methods used in practice, we have implemented an agent-based model, which considers each method and we have simulated it over all these boarding methods, with the same initial conditions in terms of the number of passengers, the number of hand luggage, storing time, etc.
3. Agent-Based Modeling Implementation
Agent-based modeling is an alternative method to system analysis. This effective method provides the necessary tools for solving real-life situations, which makes it much easier to deal with complex behavior of different economic factors, compared to the classical equation-based modeling [
31]. It is based on computational modeling and incorporates different agent characteristics and interactions, which are hard to model using the equations-based modeling.
Moreover, in the models developed, the agent-based approach considers that some human beings act differently than the others, even in a same situation. This approach also employs if-then rules, the agent’s memory and path-dependence, the capacity of learning, and adaptation. As a result, self-organization and emergence behaviour is often encountered in such simulations which make their models to relatively closely represent the real-economic-world we face, which consists of humans and economic entities with complex behavior [
32].
For the boarding methods modeling in the NetLogo, a series of agents have been created that represent the passengers boarding the airplane, while for the aisle and the seats representations, agents called “patches” are used. The patches agents represent a small part of the ground, for which, one can define specific characteristics. These characteristics are useful in order to create the if-then rules for each agent, which will enable them to pick their appropriate position in the boarding line.
As mentioned before, all of the selected boarding methods, except for the random without assigned seats, provide a clear set of rules related to how each agent should pick its seat and behave in the aircraft. Thus, their implementation is straightforward. For the random without assigned seats, each passenger’s preferences for a seat should be considered, which enables the use of the advantages brought by the agent-based modeling (see
Section 3.2).
In the agent-based model we consider only one fare class of passengers; thus, we assume that all passengers are treated identically, in terms of fare class, for all seats on the simulated situations.
3.1. General Modeling Aspects
Considering the boarding methods in
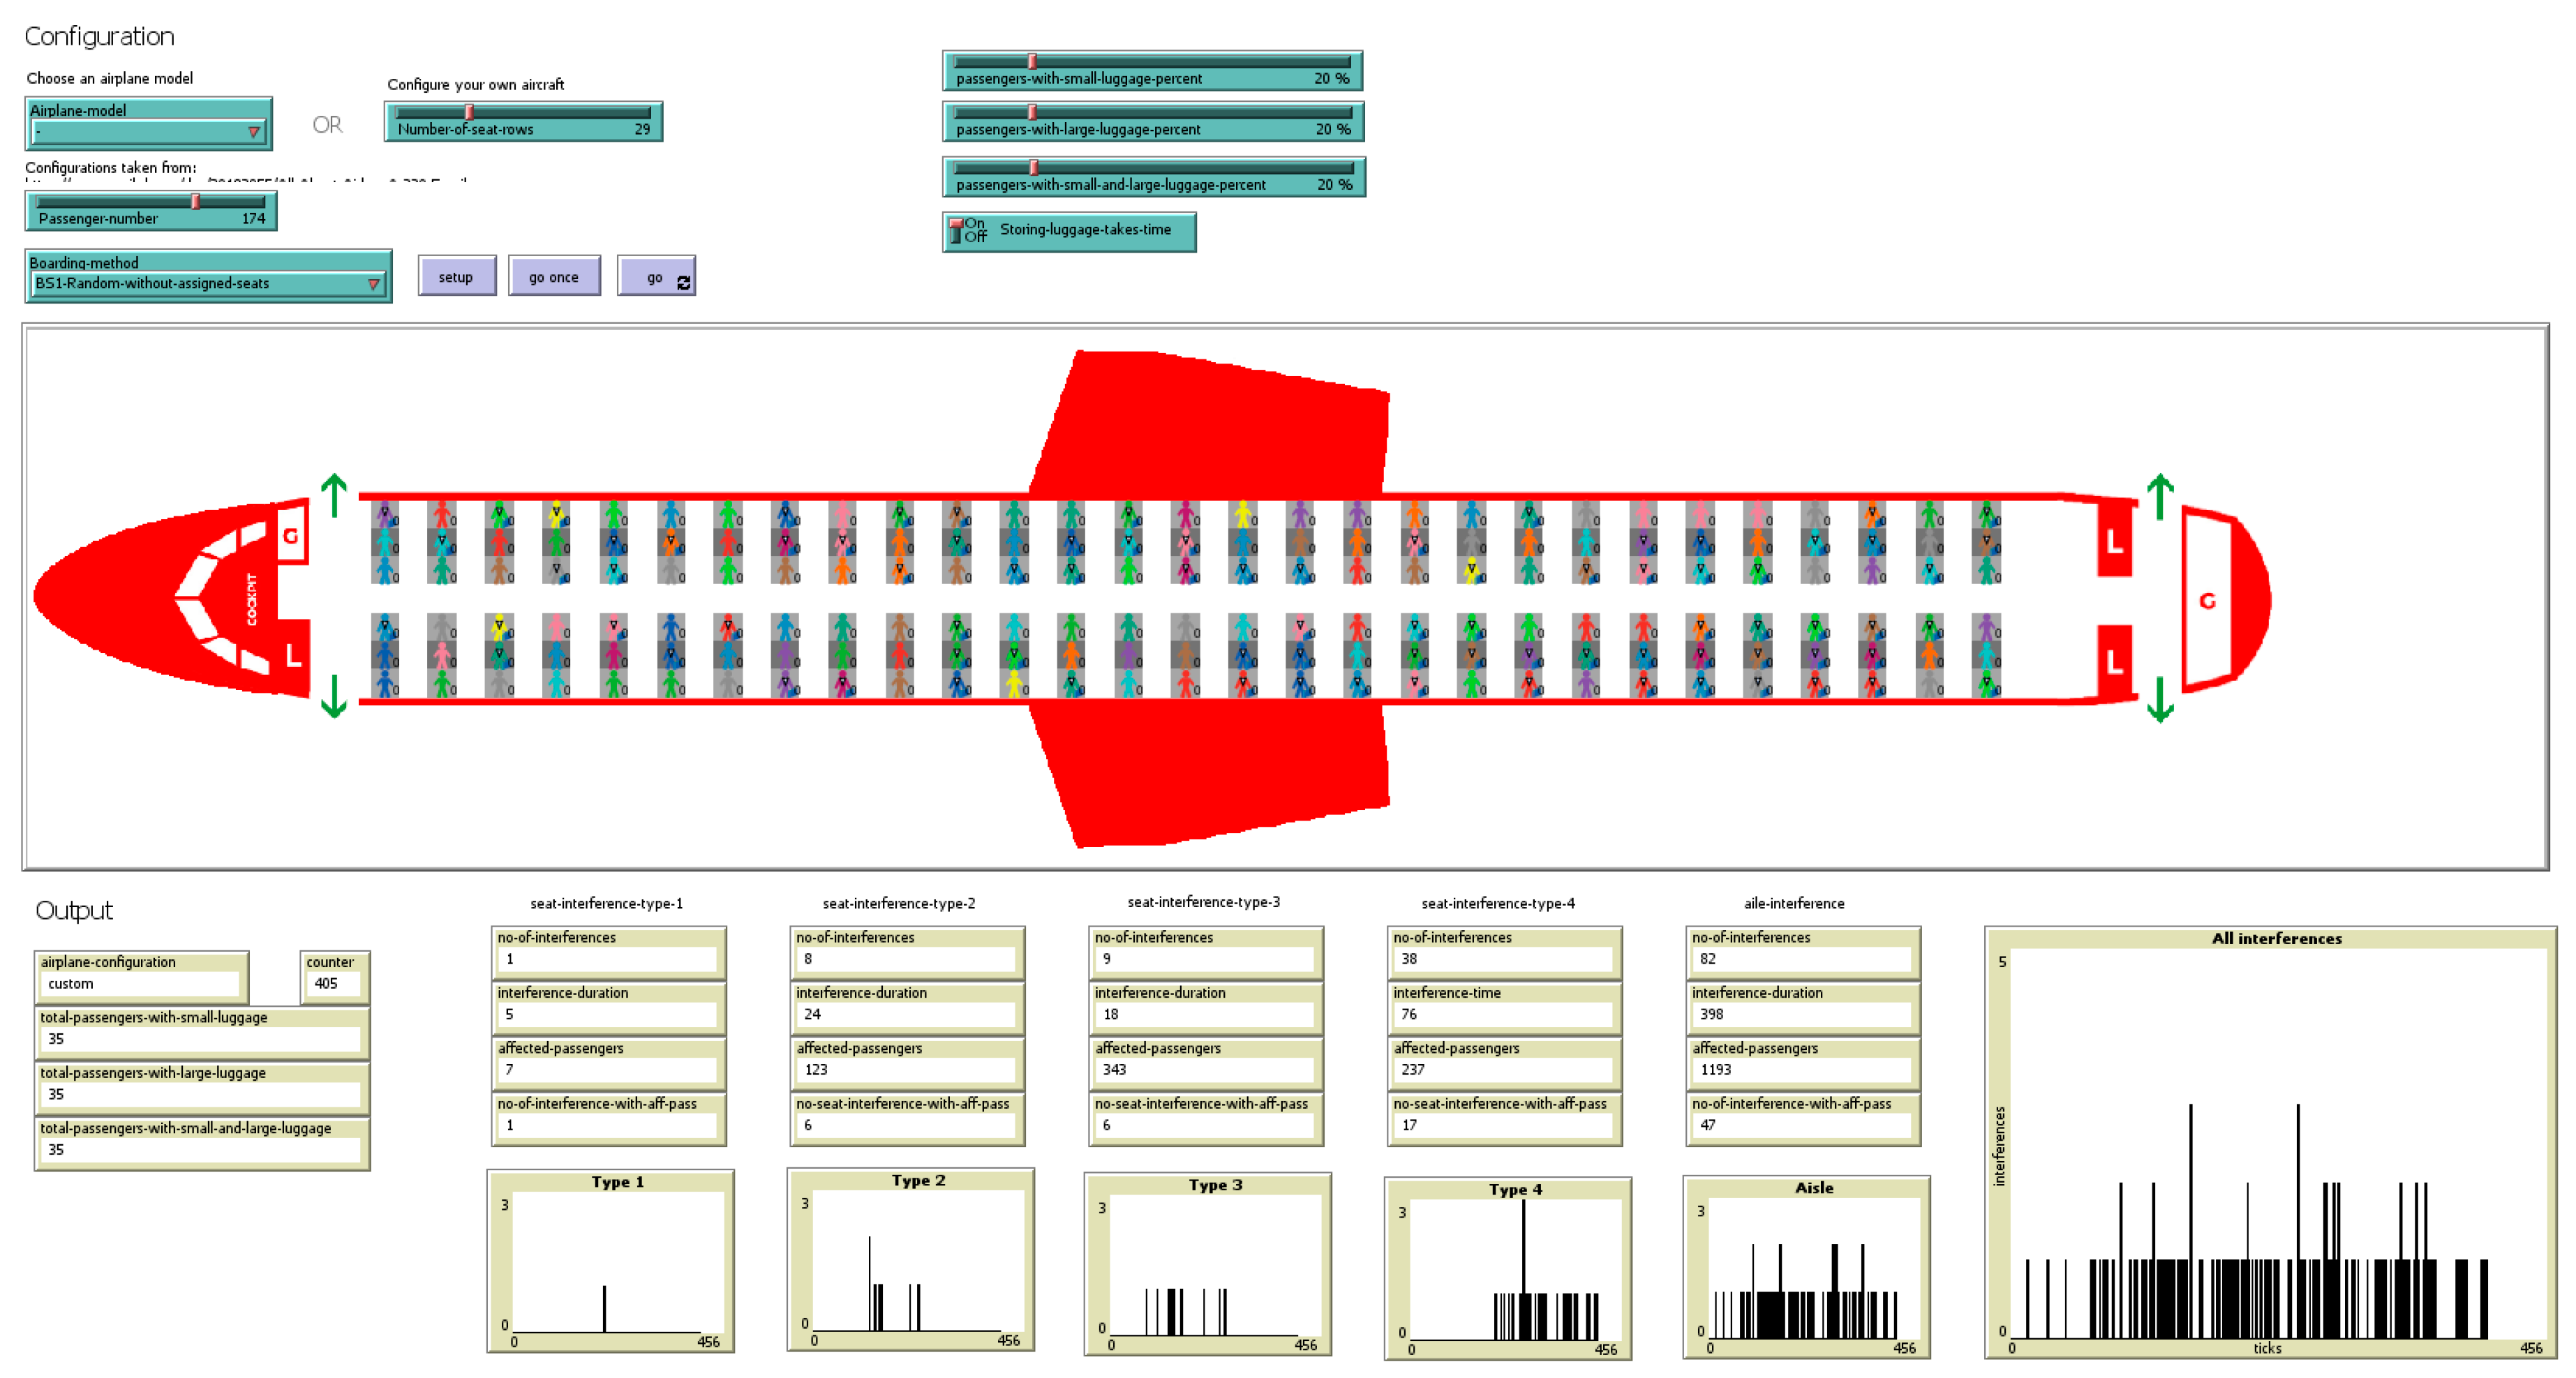
Table 1, two types of agents have been used in the NetLogo—turtles and patches. Turtles represent the passengers to be boarded and, at the beginning of the simulation, they are located inside the aircraft, in the front part, near the cockpit. Patches are, in this case, small pieces of “ground” which can either be free passing areas, such as the aisle or the space between the seats, or the seats. For a good visualization, the patches representing the seats have been colored in grey tones, as illustrated by the model’s graphical user interface (GUI), in
Figure 12.
In order to characterize each agent, a series of variables have been created, considering the literature (
Table 2), which are common for all the boarding methods implemented in the NetLogo.
The agent-based model in the NetLogo is configurable. For example, as hand luggage is thought to have a major impact on the overall boarding time [
11,
25,
33], in the model, one can easily select how many passengers are carrying with them a hand luggage in the cabin, by using the sliders: “passenger-with-small-luggage-percent”, “passengers-with-large-luggage-percent”, and “passengers-with-small-and-large-luggage-percent”. Additionally, through the use of the “storing-luggage-takes-time” switch, one can decide whether or not the agents need time for storing the luggage in the overhead compartment, which could delay some of the passengers standing in the aisle, behind it.
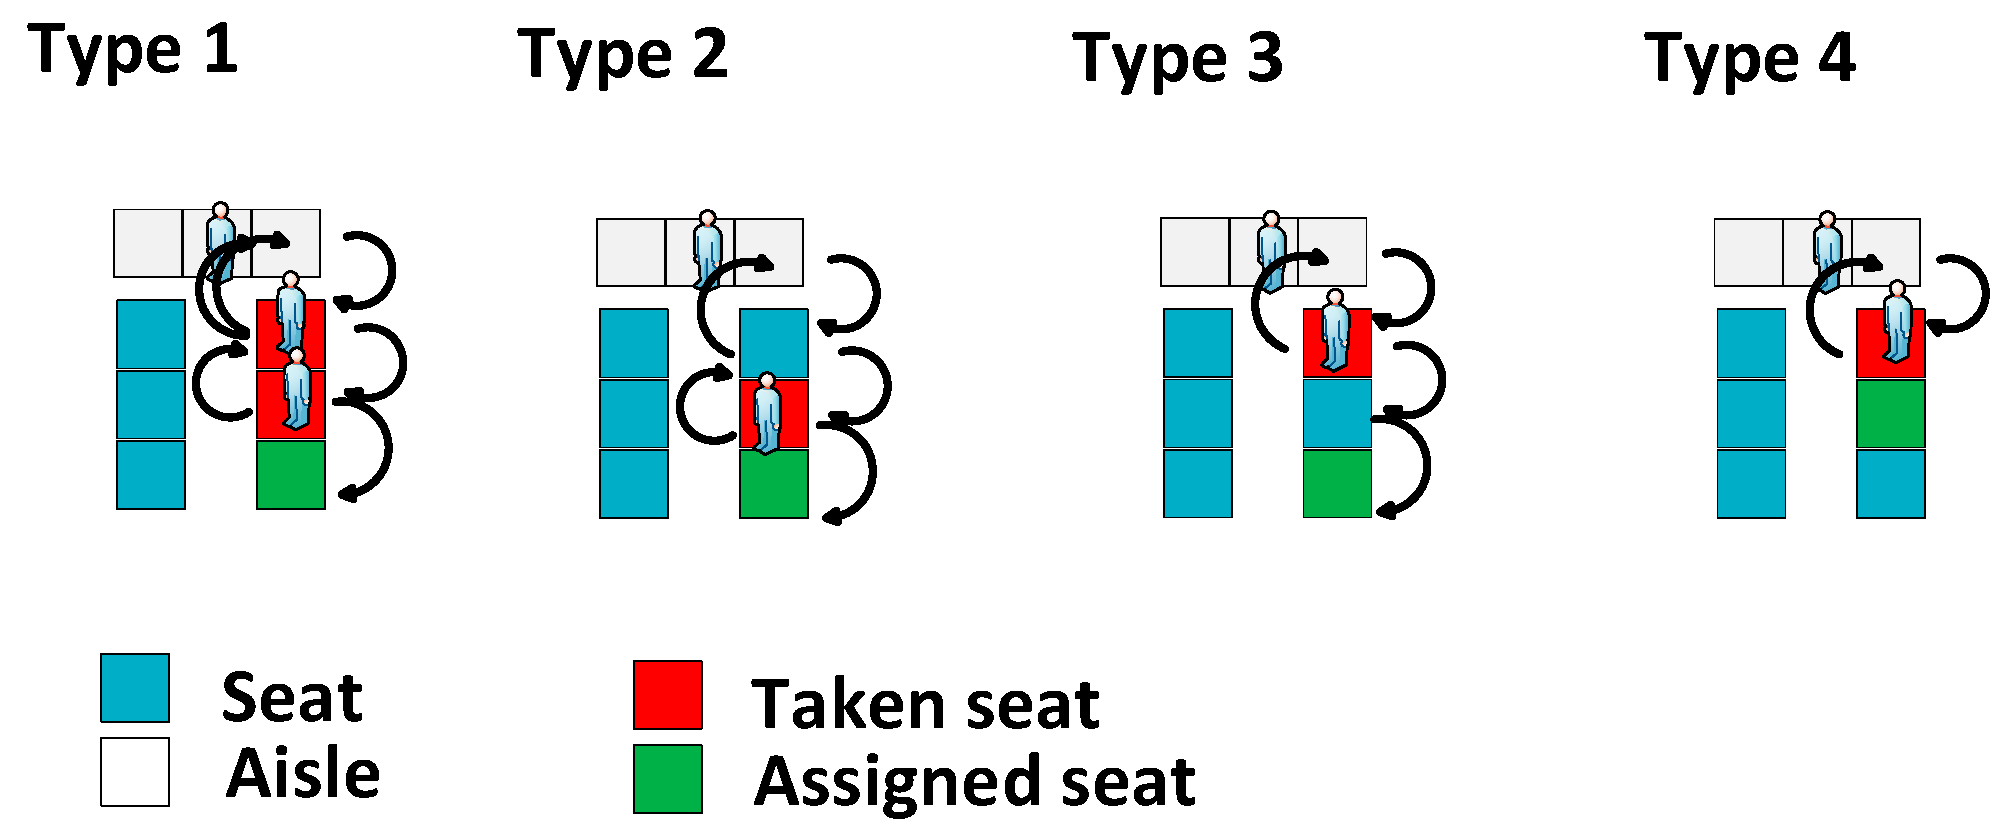
We also considered passengers’ interference while boarding, as it is believed that, as the passengers interference increases, the boarding time becomes longer [
5,
12,
17,
19]. Depending on the occupied seats and the position of the seat to be taken, we considered four types of seat interferences in the agent-based model, as is illustrated in
Figure 13.
In type 1 seat interference, the seats located in the middle and the aisle area are occupied, and a passenger needs to take a seat near the window. Thus, the seated passengers need to exit the row and wait in the aisle until the passenger with a seat near the window enters the row. As each passenger is moving one patch per tick (and passengers move simultaneously when not blocked), five ticks will be needed in this case for having all three passengers in their assigned seats. In the type 2 seat interference, just one seated passenger is in the row, located in the middle seat. In this case, the number of needed ticks for having both passengers seated, is four ticks. Types 3 and 4 seat interference produce a potential delay time of three ticks, as the seated passenger is located near the aisle and needs just a tick to exit the row; the passenger occupying the seat in the middle or aisle needs one tick to enter the row and another tick is needed for the first passenger to return to his/her place. Additionally, a minimum distance characteristic is included here that provides the passengers the needed space to walk down the aisle, in normal conditions, and may affect the overall performance of the methods [
35]. The time measured in ticks is consistent with the field trials made by the authors of Reference [
36]. The delay time from seat interferences is a potential delay of the overall boarding time but the total time to board is not going to increase with the exact sum of all seat-interference delay times. This is due to the fact that, in some cases, no other passenger is in the aisle behind the passenger who encounters seat interference, or it might happen that the passenger behind, faces his/her own seat interference while trying to occupy his/her assigned seat and, thus, the seat interference delays can happen in parallel. Consequently, adding the total of seat-interference delays to the total time to complete boarding would be inappropriate.
3.2. Random without Assigned Seats
Some of the ideas expressed by Steffen [
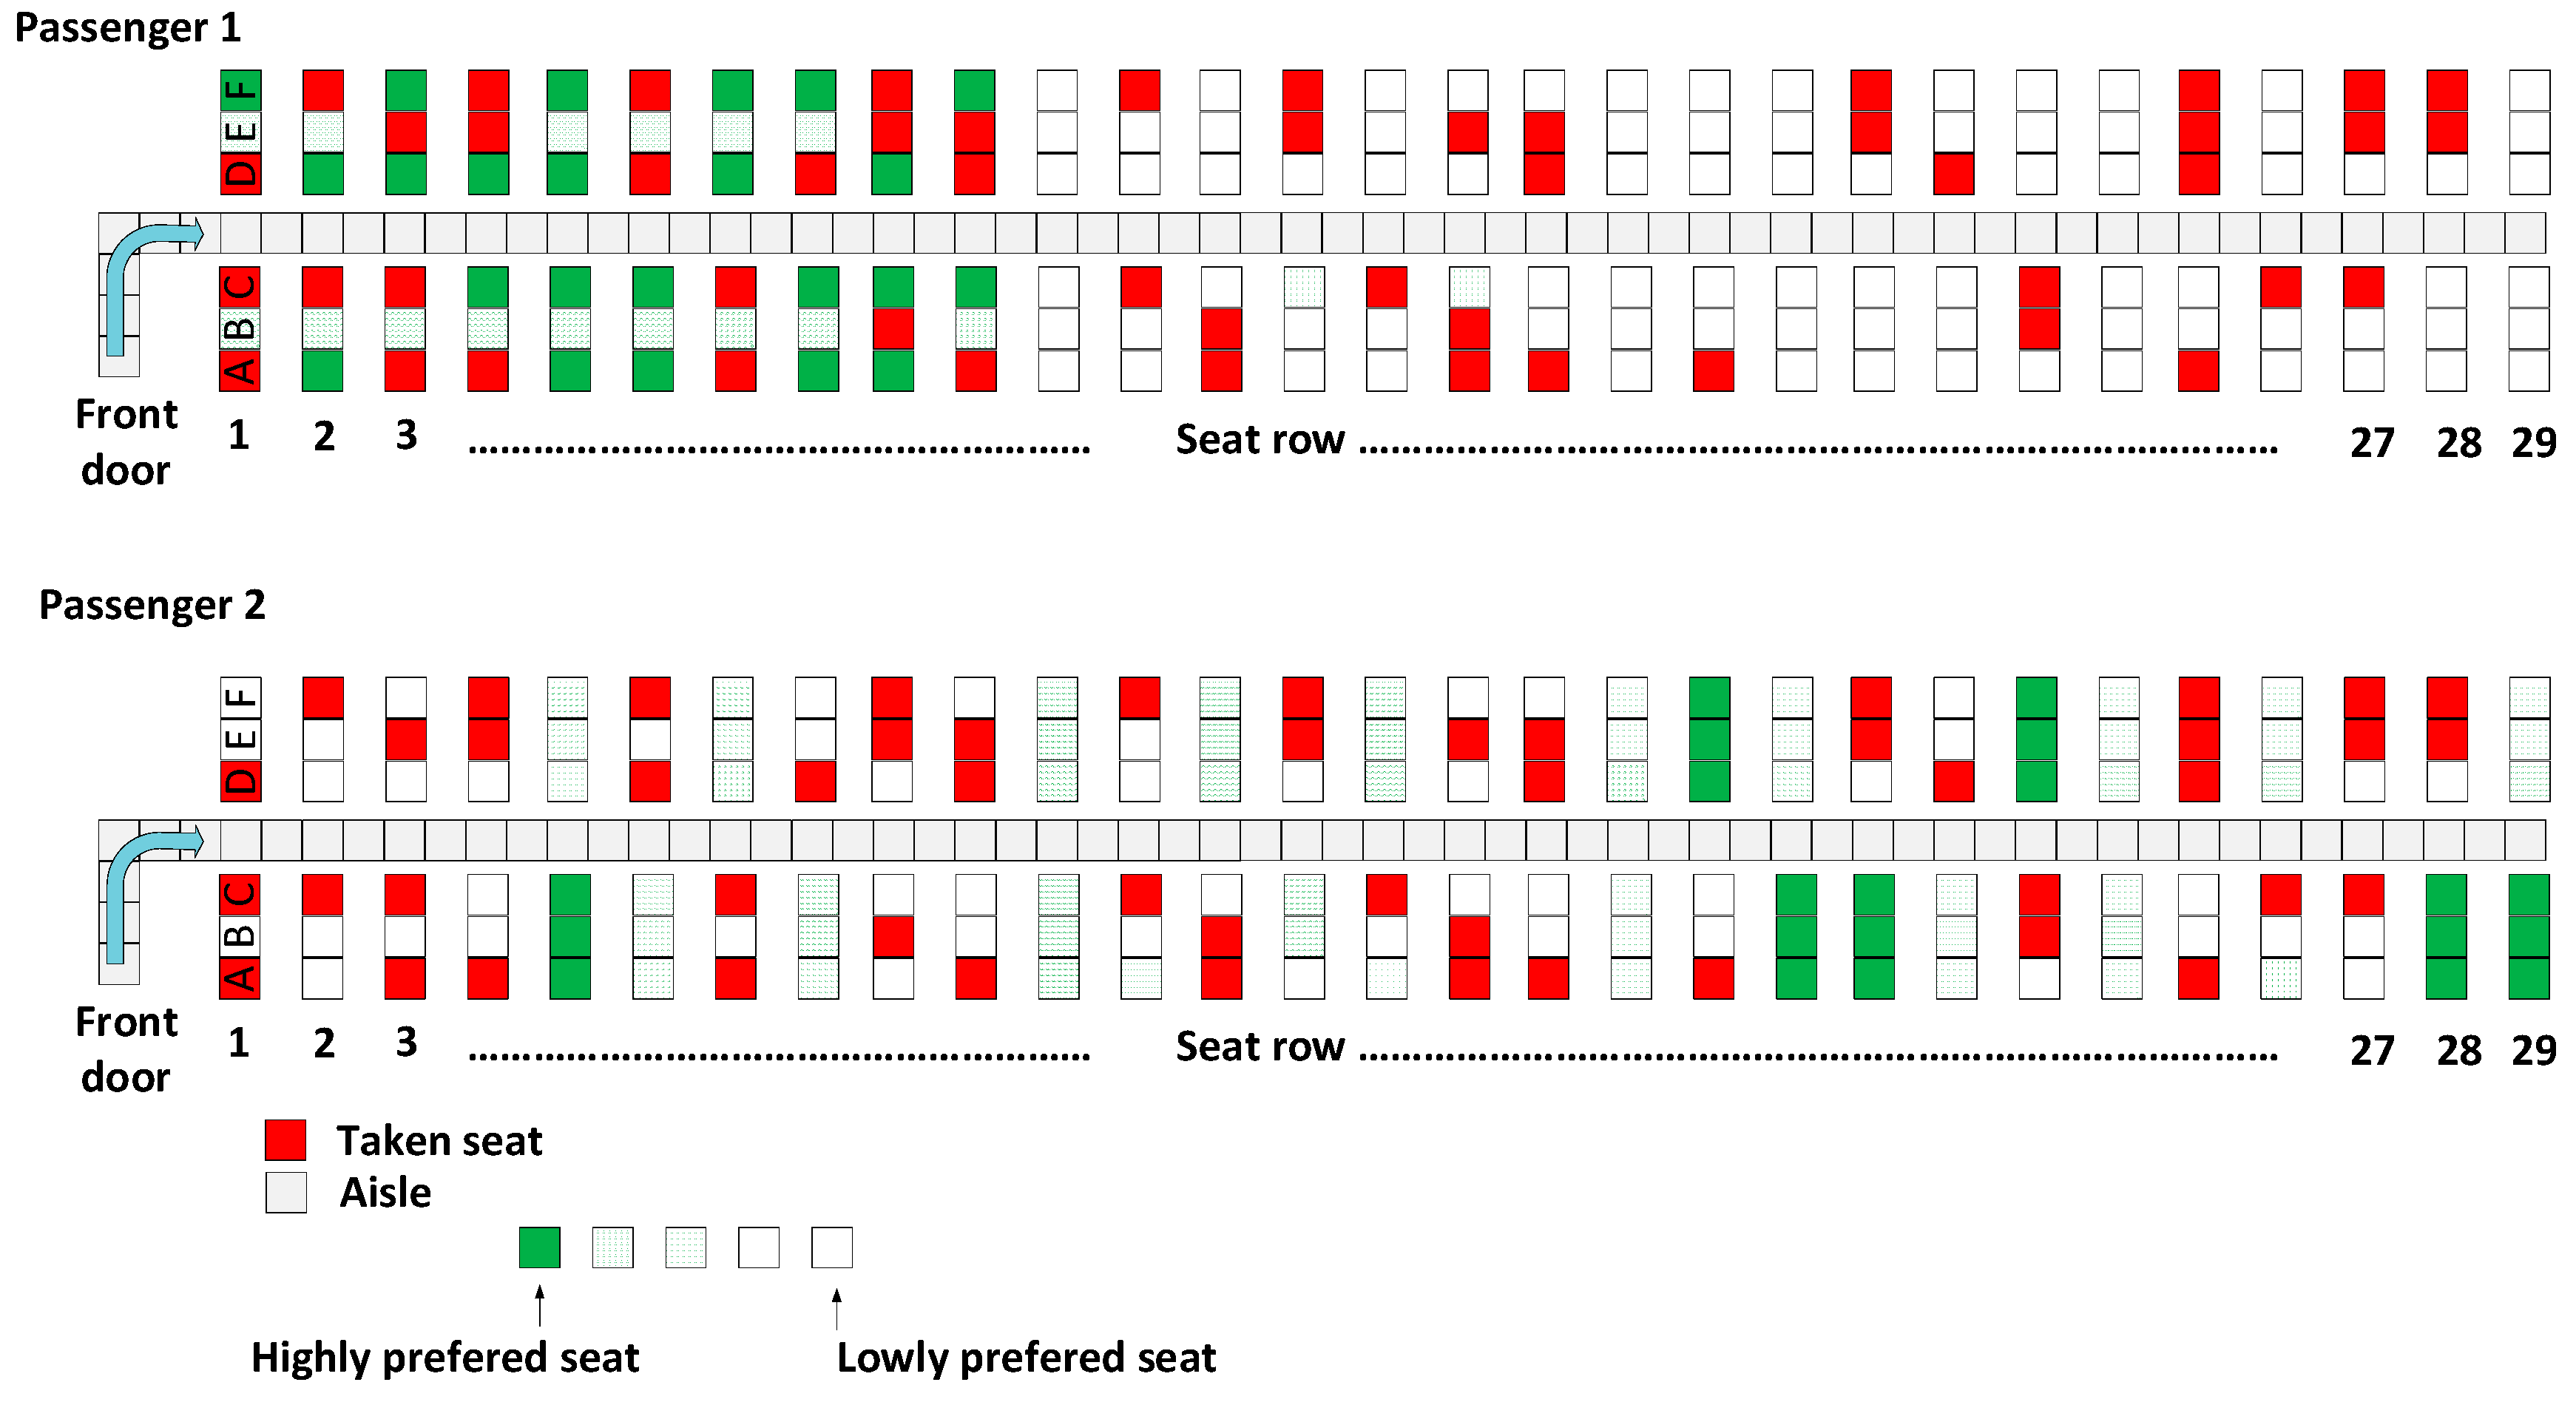
7], associating a certain energy to each seat, will be used in our approach, with the difference being that each of the airplane’s open seats will have different energy for each agent, which we shall call the “fitness values” in the following. Therefore, each agent entering the airplane will have his own map of the open seats and will act according to the agent’s preferences.
Figure 14 illustrates an example of Passenger 1 having a different map of the open seats, than Passenger 2. Furthermore, two passengers may have different seat preferences, based on the most important issues for each of them, in terms of preferring the front/middle/back of the airplane, having the seats near the window/middle/aisle, or having a preference/indifference/apathy to the crowded areas. Additionally, as the author of Reference [
7] considers in his model, and we consider in our implementation, the preference for a given seat located in the left side of the aisle is the same as the preference for a given seat located in the right side of the aisle, thus, the seats’ preference is symmetric, across the aisle.
For collecting the needed information related to the passengers’ preferences, a questionnaire has been created and validated using SPSS AMOS 22.0, as required by the authors of Reference [
37]. The following validations were tested and iterated—construct validity, unidimensionality, feasibility and convergent validity, and similitude validity [
38]. After the validations were complete, the final form of the questionnaire was uploaded online, using google forms and was available for completion from 6 March–9 April 2018, being distributed over several online social networks.
The respondents answered the questionnaire using a ten-point Likert scale, indicating their preference for a particular place within the airplane, in terms of the front/middle/back of the airplane, the window/middle/aisle seat, and preference/indifference/antagonism to crowded areas.
For validating the received answers, some additional questions were added, containing hypothetical situations presented as text. The respondents could choose from multiple options describing how they would behave in that situation. For example, the following situation was depicted: “Let us assume that you have a preference for a window, middle, or aisle seat, but as you arrive inside of the airplane, you observe that your preferred seat is available only in a very crowded area of the airplane. How do you proceed in this case?” The answer options were: “(a) I choose a seat in the preferred location, without considering the crowd around it; (b) I sit in different section of the airplane, even though this will make me stay in a seat I do not prefer so much”.
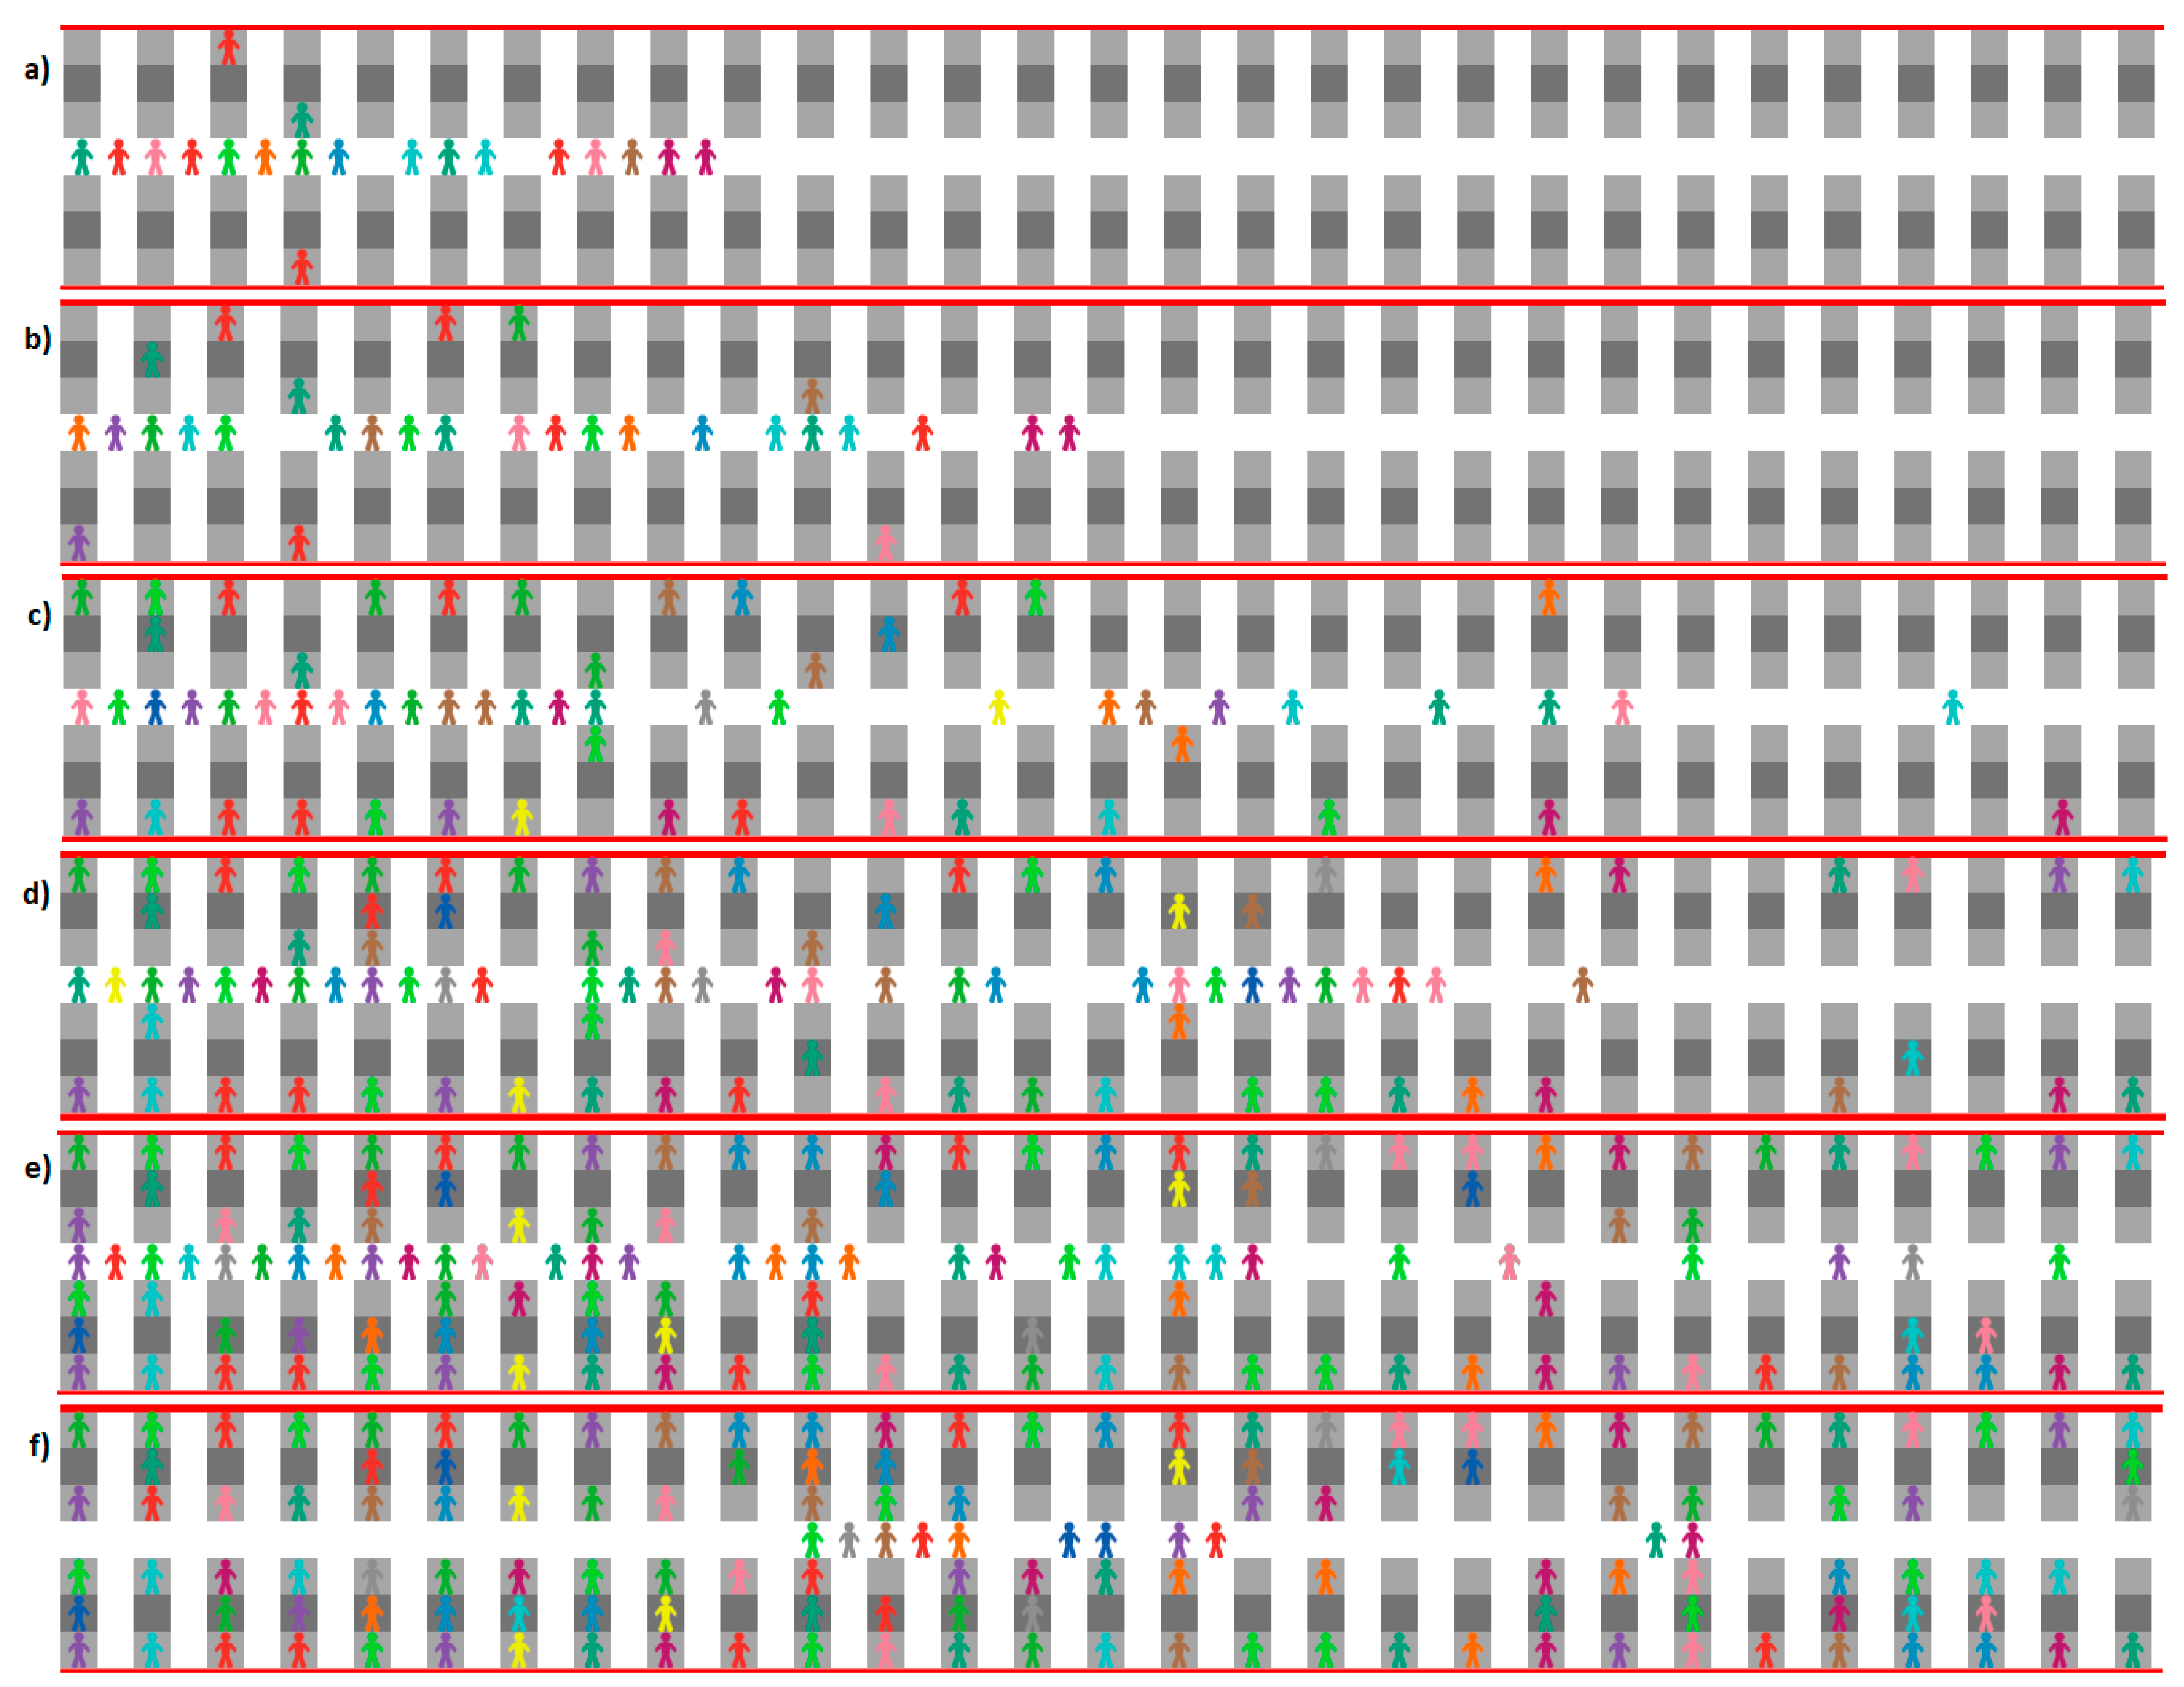
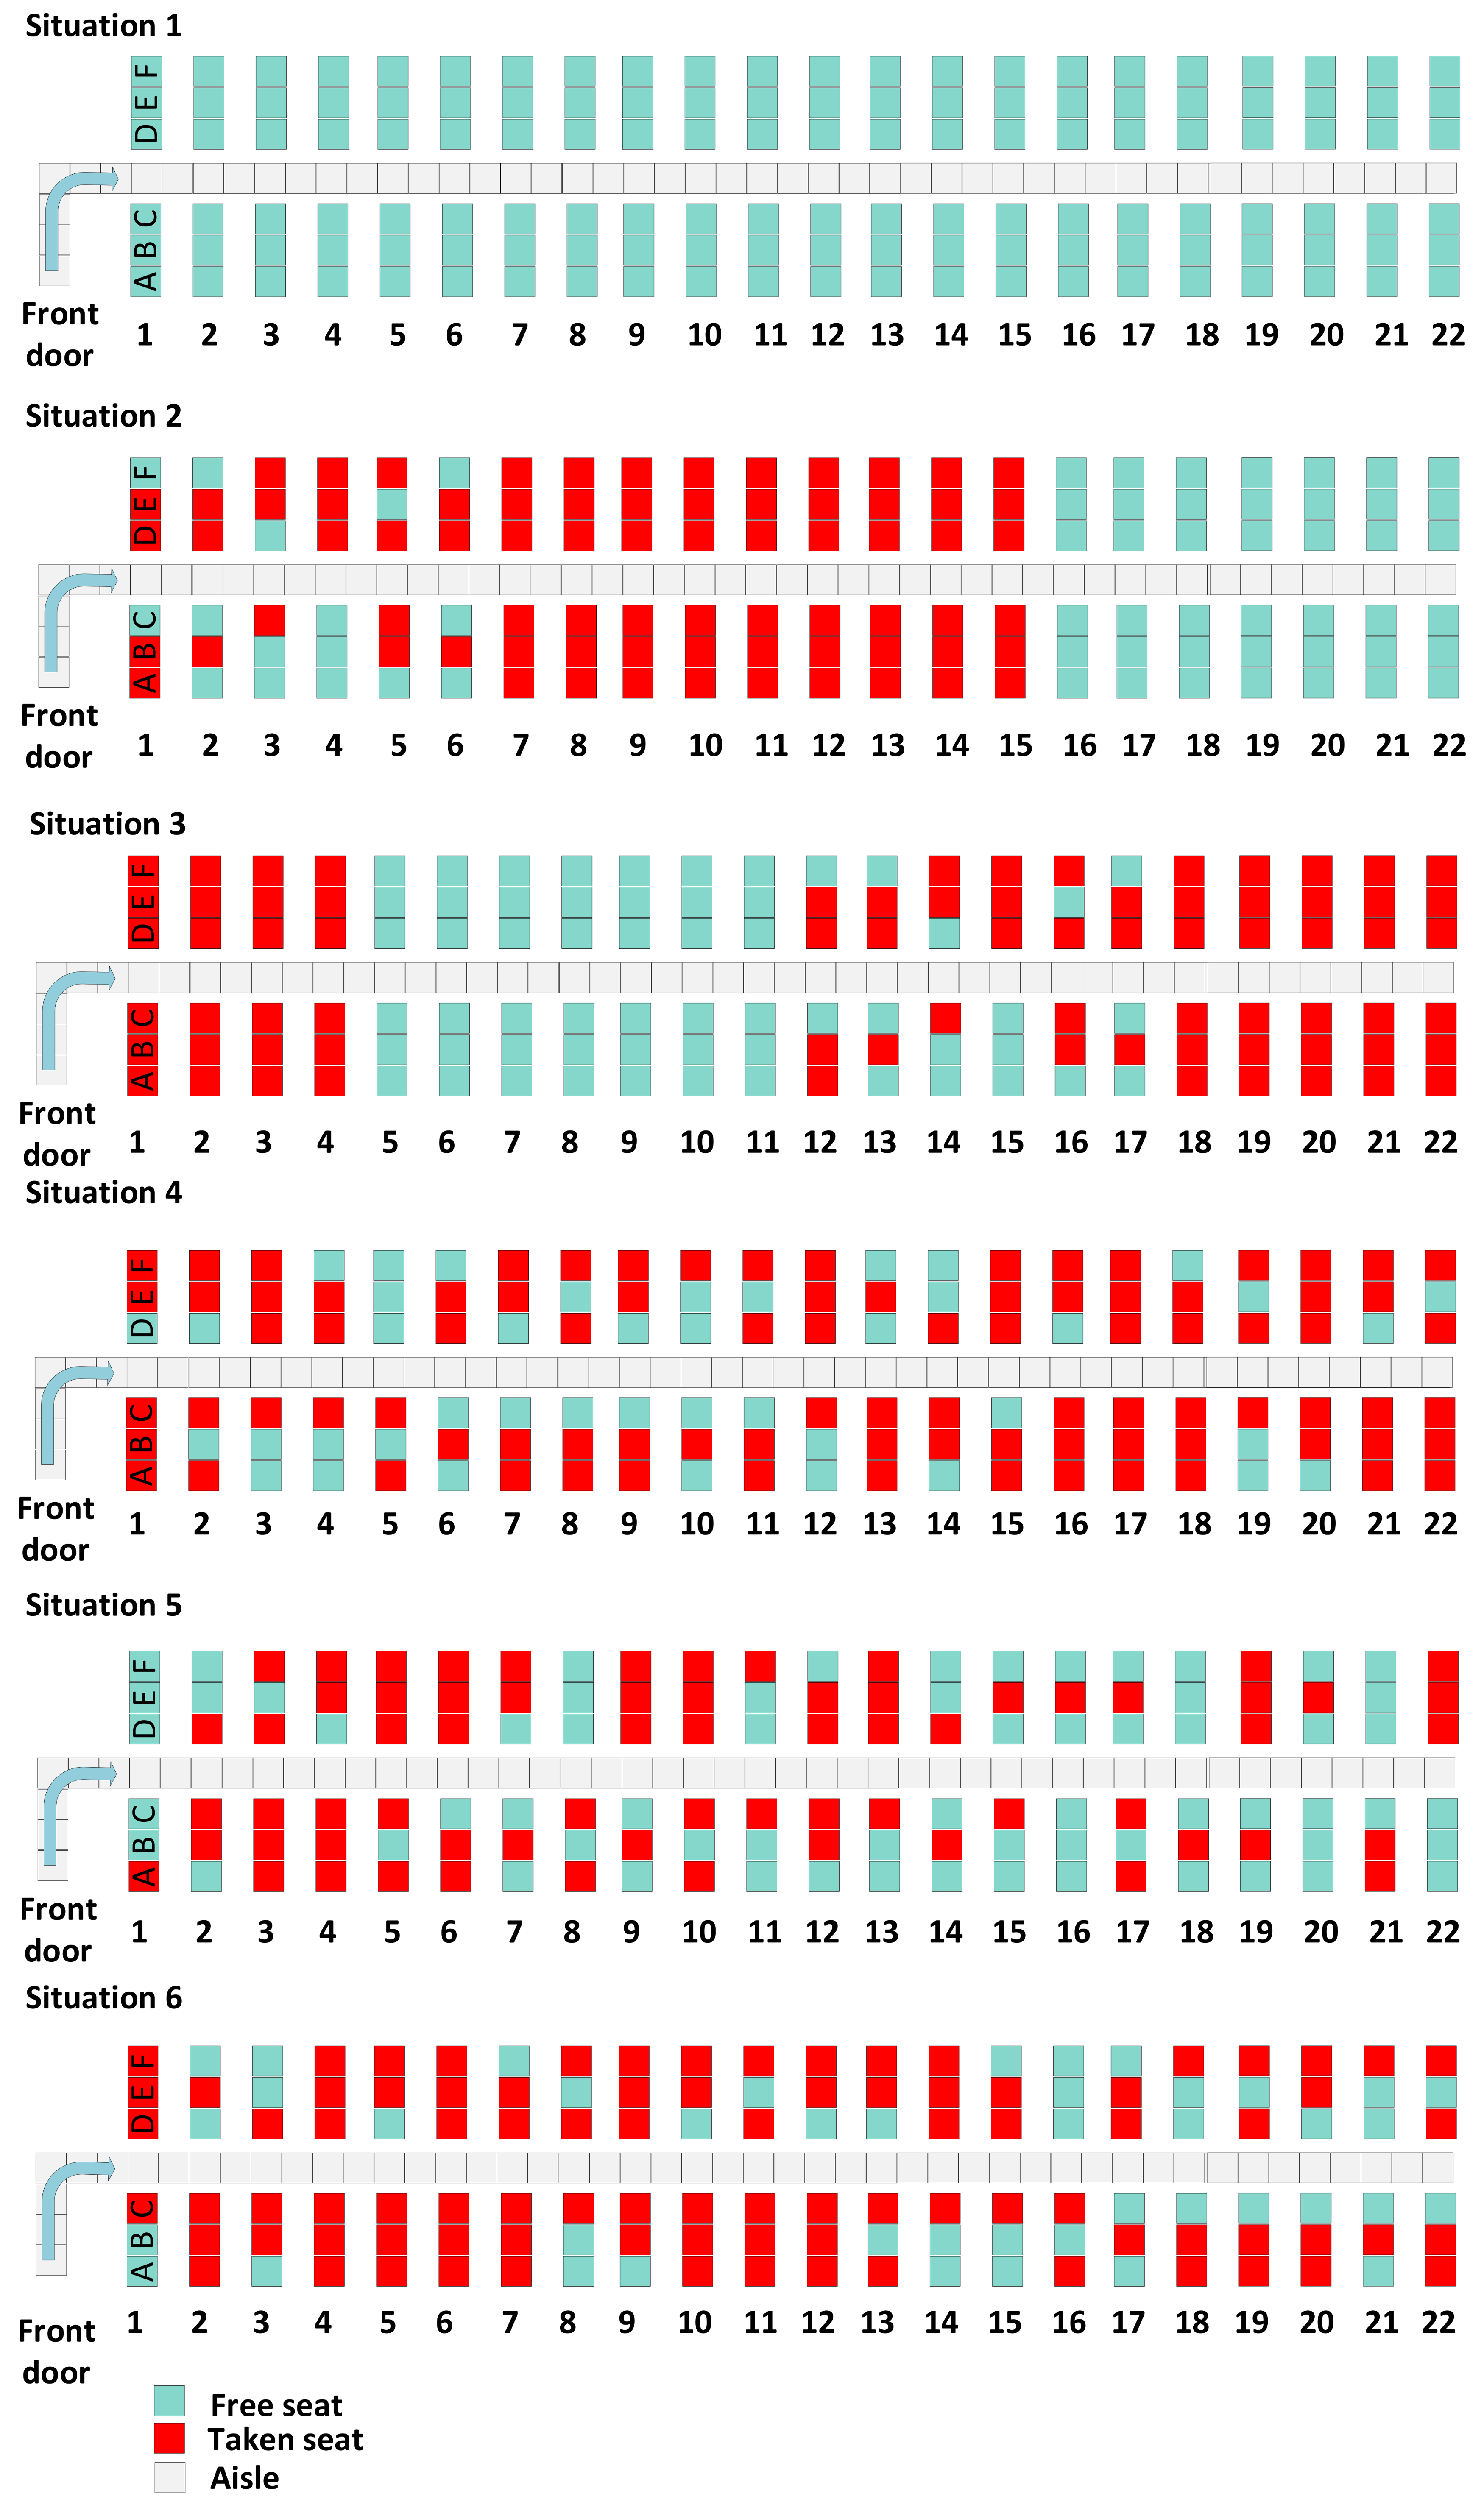
To confirm that the answers received in the Likert scale are in accordance with the actual way of behaving while selecting the seats, some hypothetical drawings with empty and partially-full airplanes were presented to the respondents and they had the option to name the seats they will prefer for each situation, by writing down the seat number in a box provided in the questionnaire (for example, 23A, 21C, etc.). The hypothetical situations have been presented in the
Appendix A.
Three hundred and eighty-seven questionnaires were entirely filled-in and passed the validations mentioned above. As for the respondents, 26.36% of them were men and 73.64% were women, thirty-seven were in 18–20 years-old category for age, ninety-four were in the 21–25 years-old category, one hundred and five were in the 26–35 years-old category, eighty were in the 36–45 years-old category, sixty-one were in the 46–55 years-old category, and ten were above the age of fifty-five.
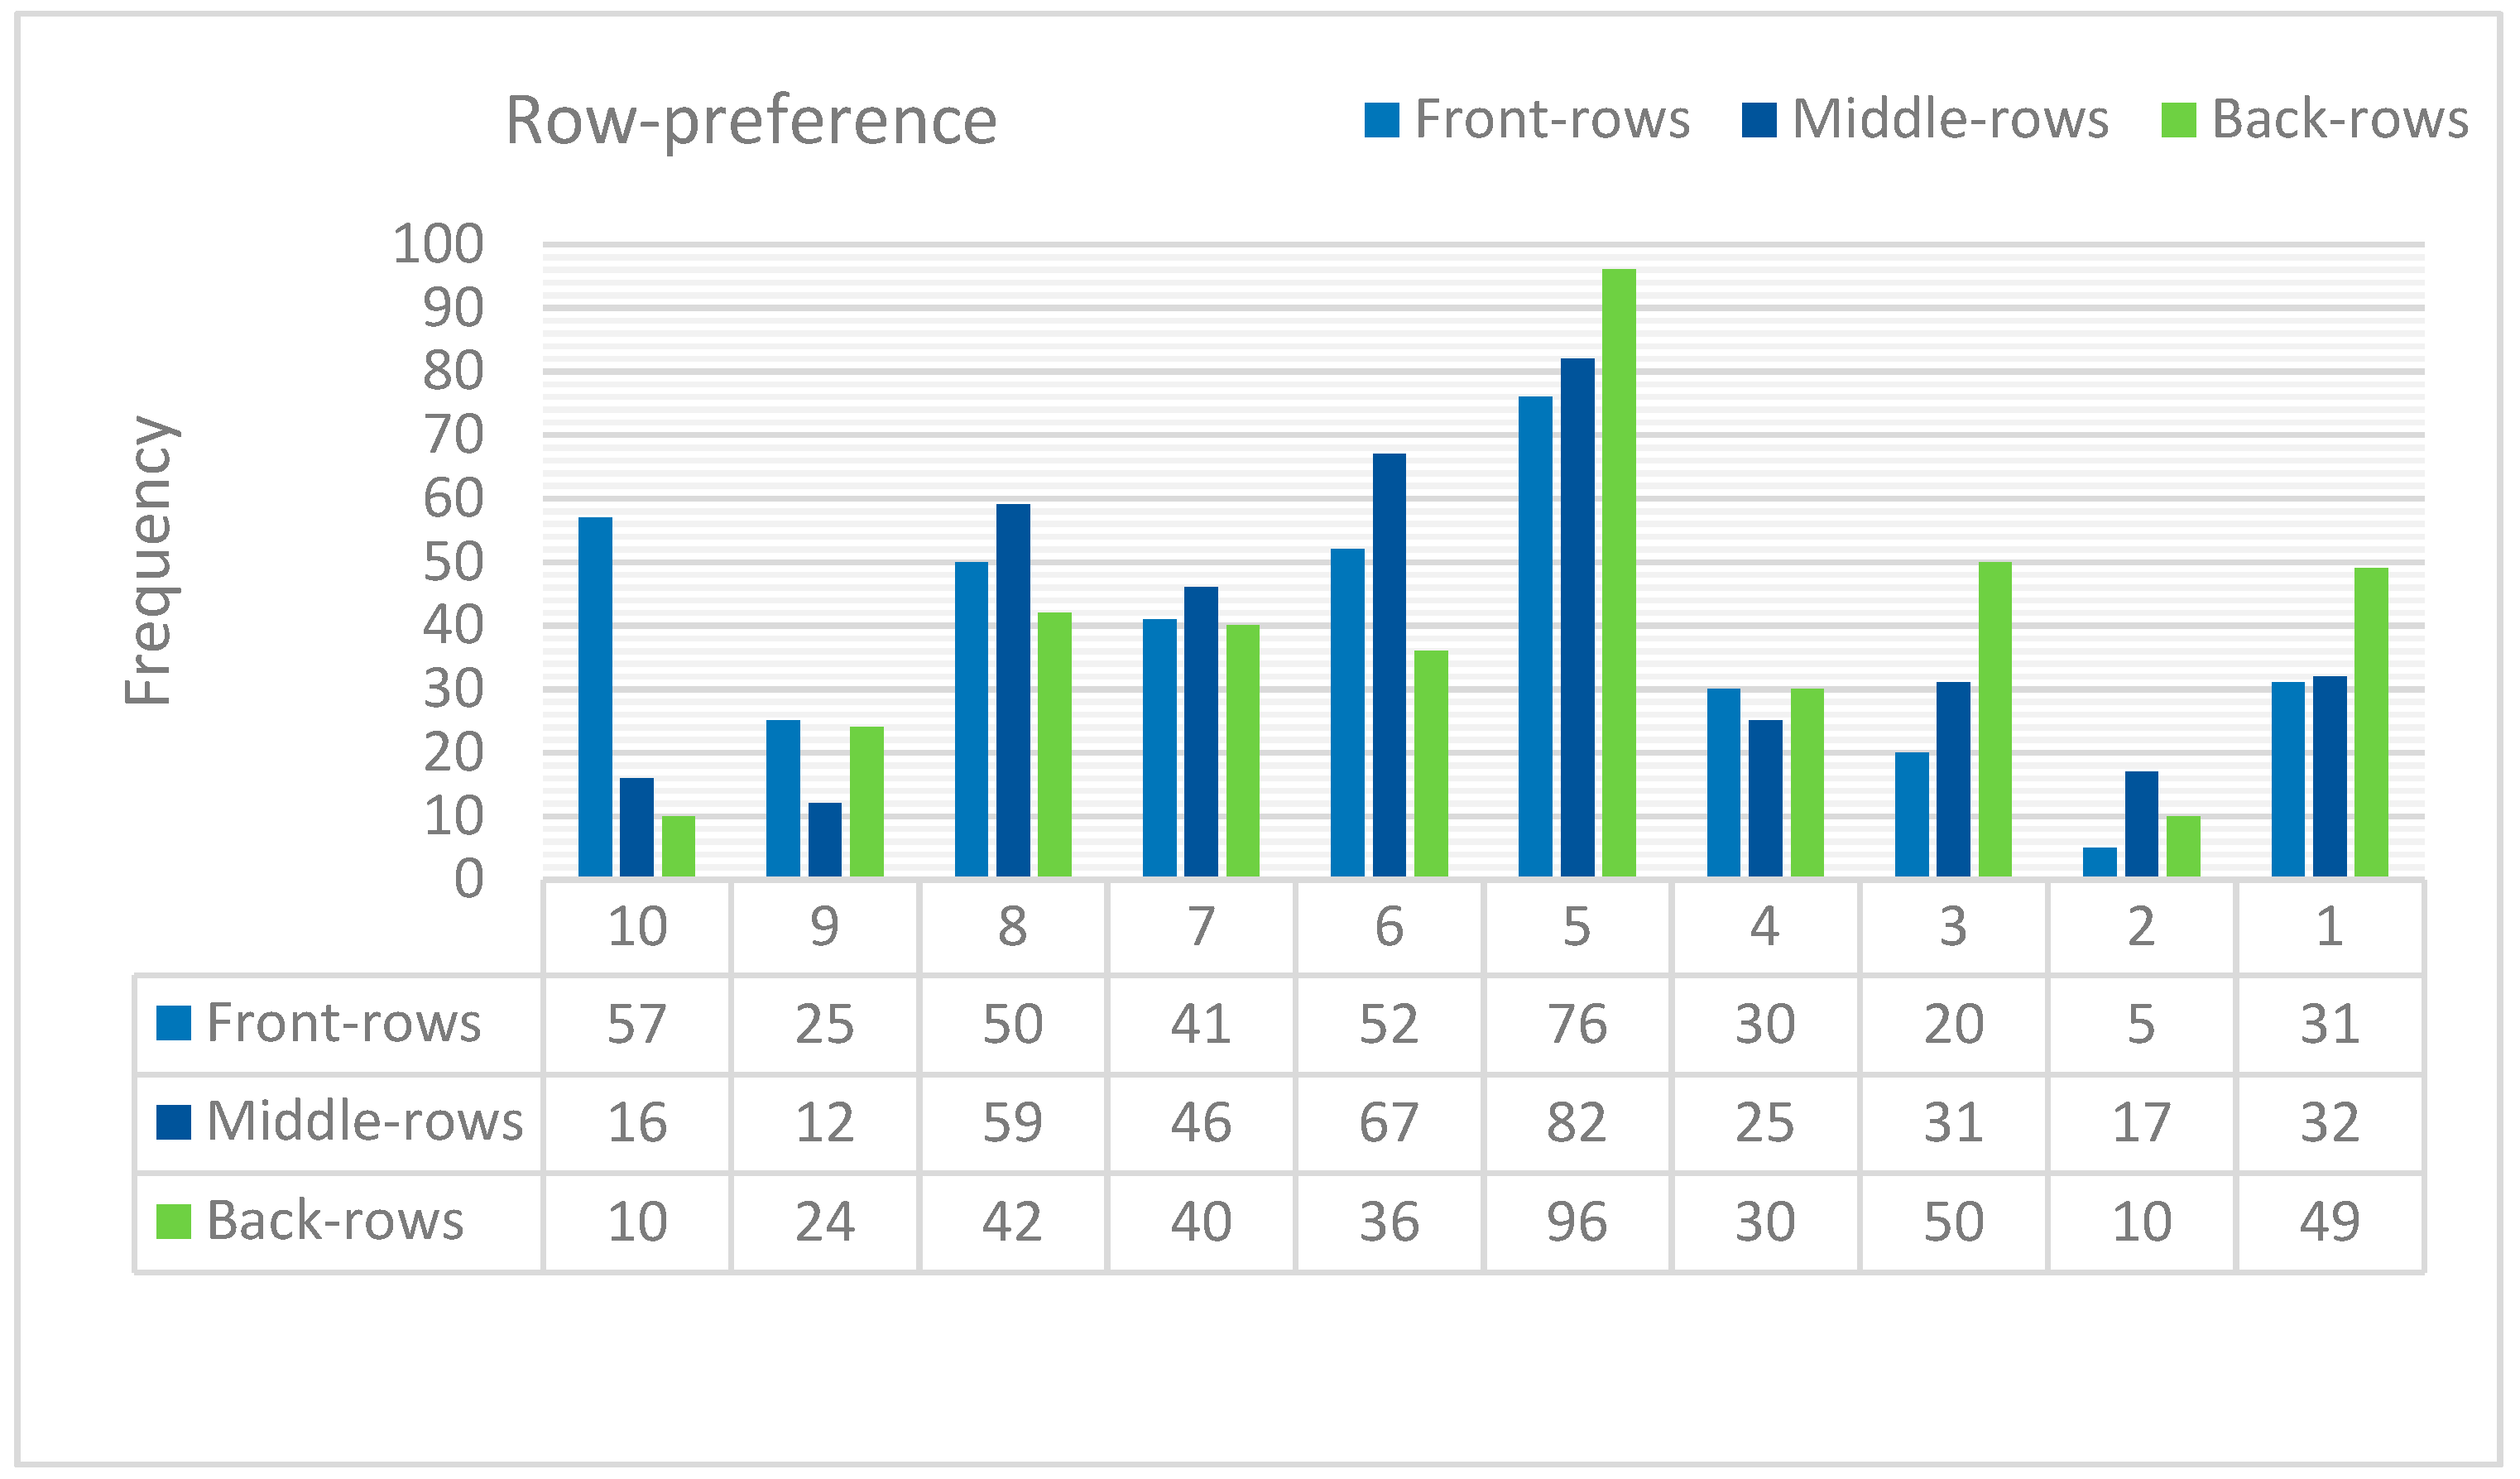
For modeling the agents’ behavior, as close as possible to reality, three main categories were taken into account for the seat selection from the available open seats: (1) Row preference (front/middle/back rows) and importance; (2) column preference (window/middle/aisle) and importance; and (3) agglomeration importance (indicating the agent’s preference for or avoidance of crowded areas on the plane).
The row preference was measured on three dimensions—front-row preference, middle-row preference, and back-row preference. For each of these dimensions, the respondents were asked to give a score, using a ten-point Likert scale, with ‘10’ being ‘highly desirable’ and ‘1’ being ‘highly undesirable’. A summary of the received answers regarding the row-preference categories, is given in
Figure 15. One should keep in mind that there were situations in which a person could have given 10 points for the front-row preference and 5 for a middle-row and back-row preference. In this case, we could say that the respondent has a high-preference for a row in the front of the airplane and is indifferent towards a row in the middle or the back of the airplane. Thus, analyzing the answers by simply comparing the values in
Figure 15 was not enough; more insight could be attained by following each agent’s individual preference, for each of the three categories, within the row-preference. This is one of the main reasons for which, when building the agent-based model in the NetLogo, we have started from the idea that each open seat has a “fitness value” for each passenger, based on his or her preferences. Therefore, instead of using the absolute values, considering a cumulative percentage for the preferences is more appropriate—as we explain later in this section.
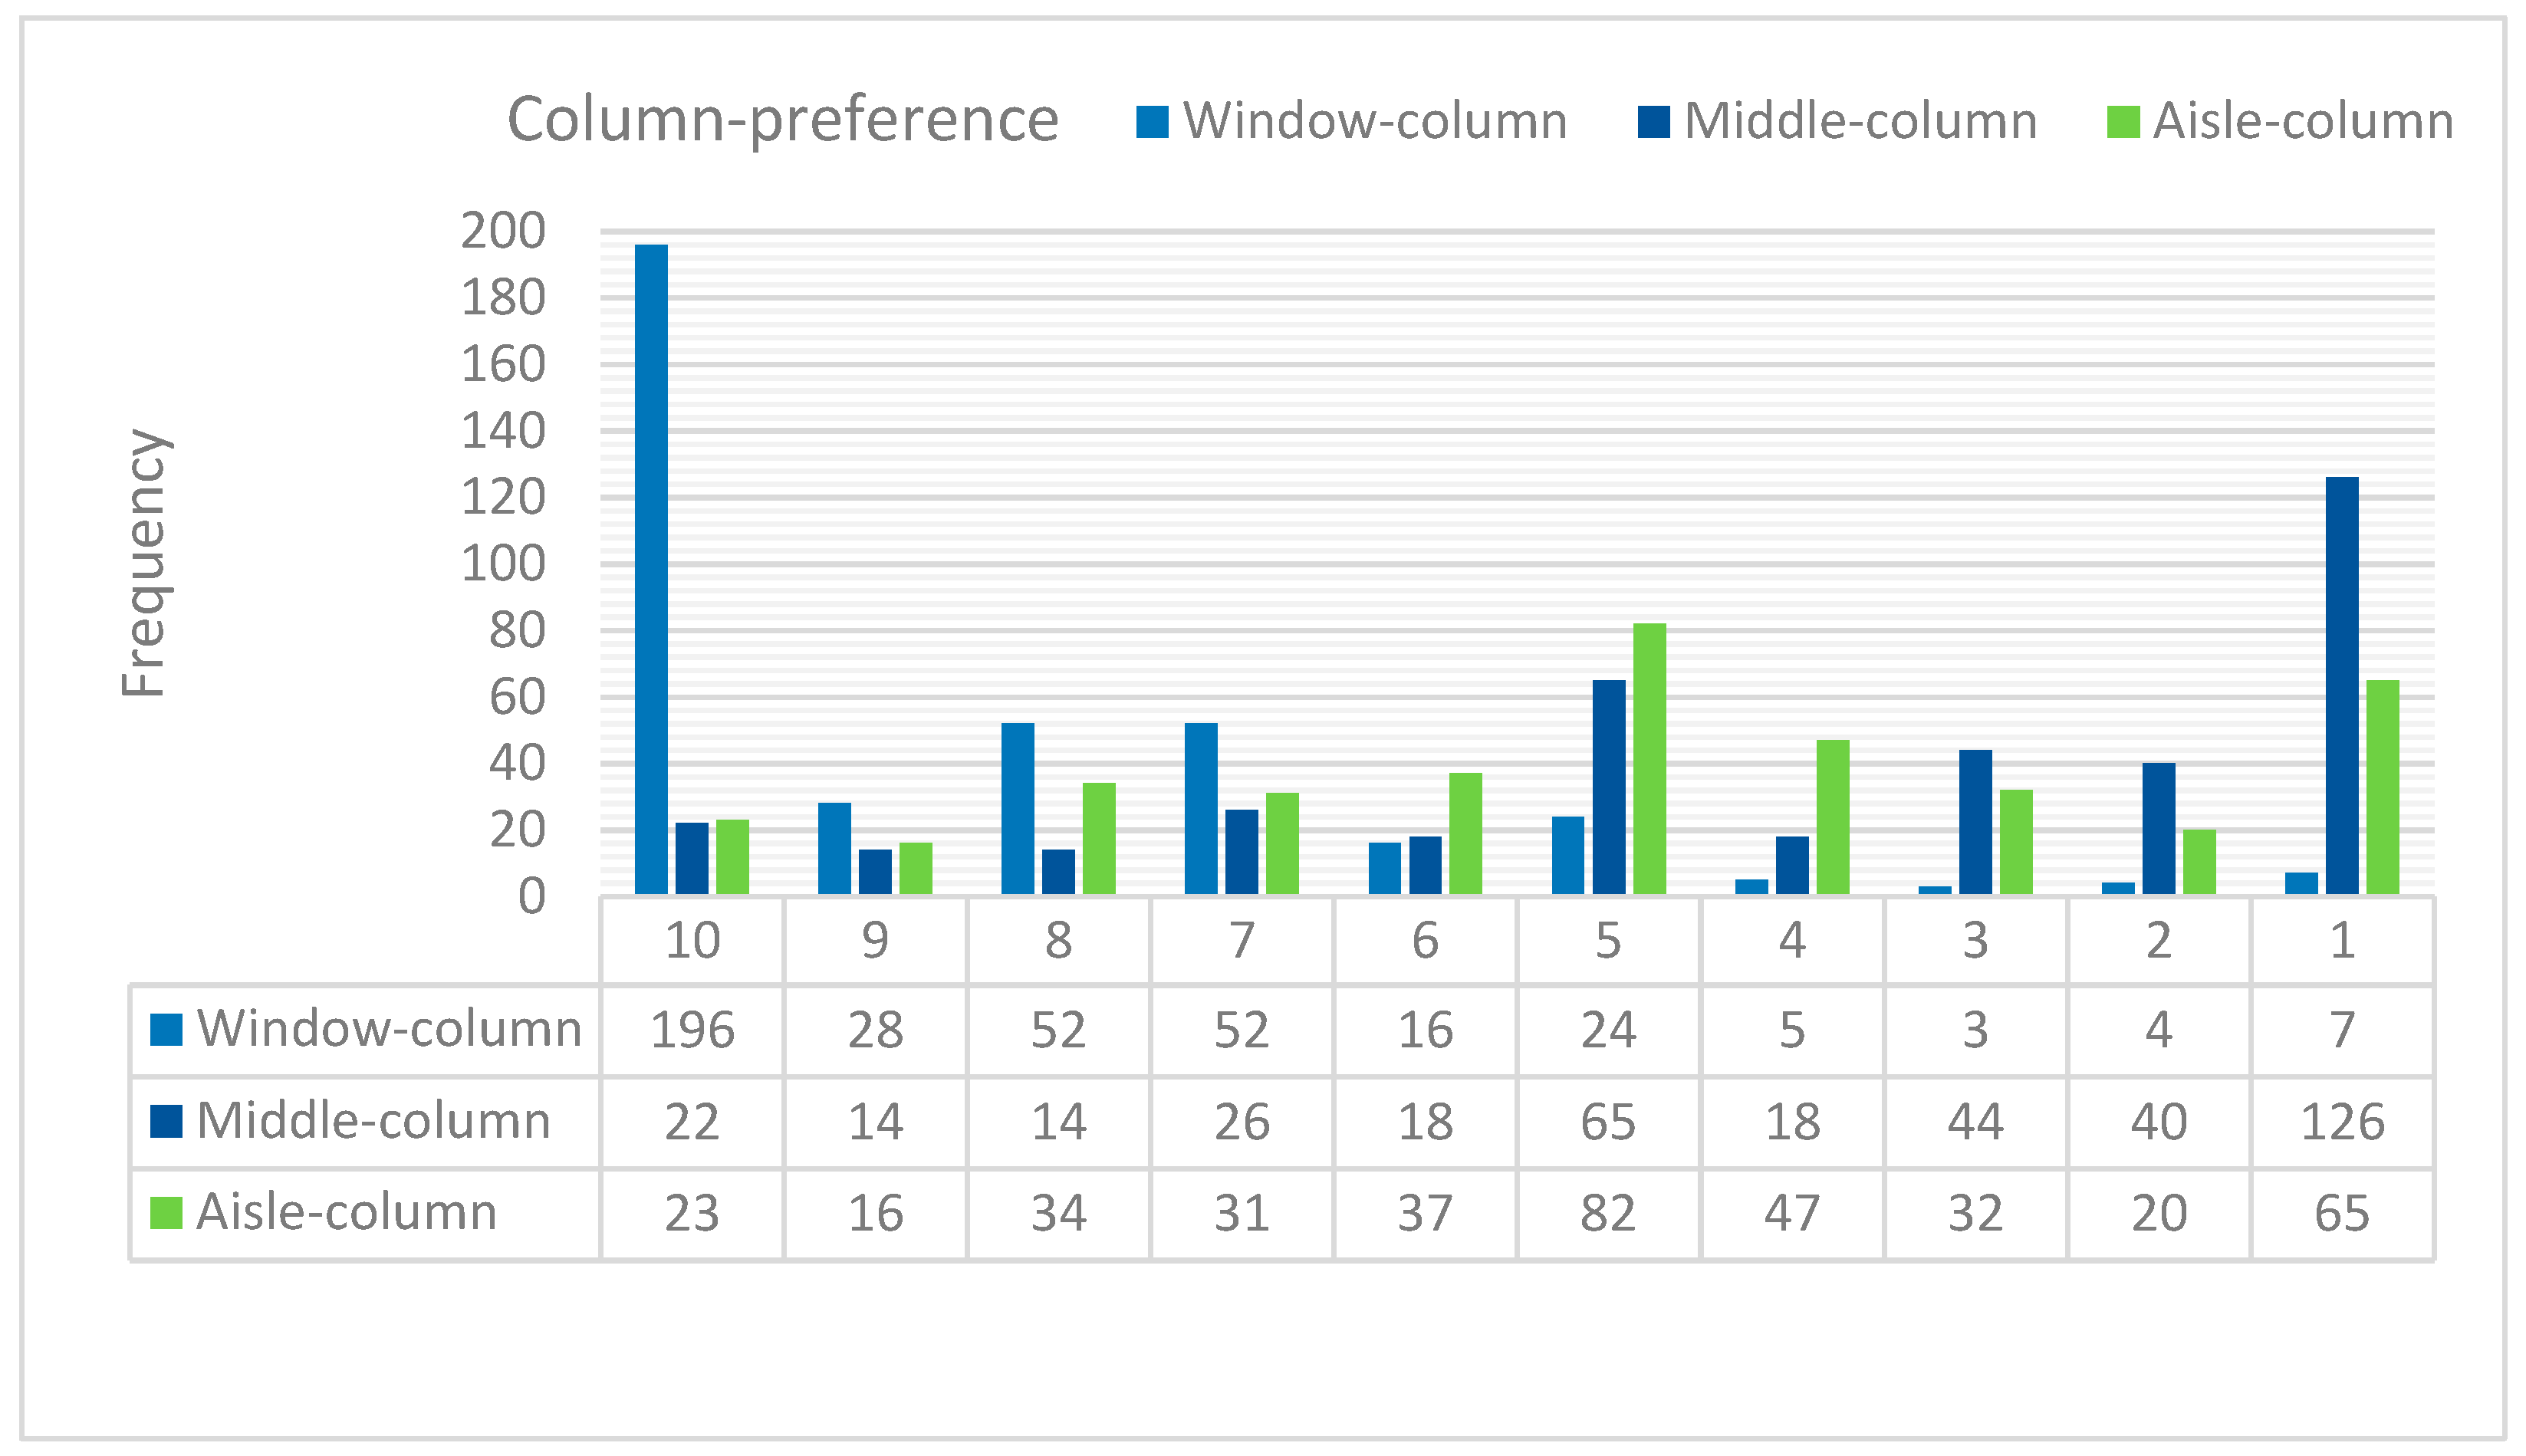
In the same way, the respondents have given marks for each of the categories within the column-preference section—the window-column, the middle-column, and the aisle-column, as illustrated in
Figure 16. It could be observed that a large number of respondents (one hundred and ninety-six respondents) gave 10 points to the seats located near the window, while one hundred and twenty-six persons highly-dislike the seats located in the middle column (scoring this preference with 1).
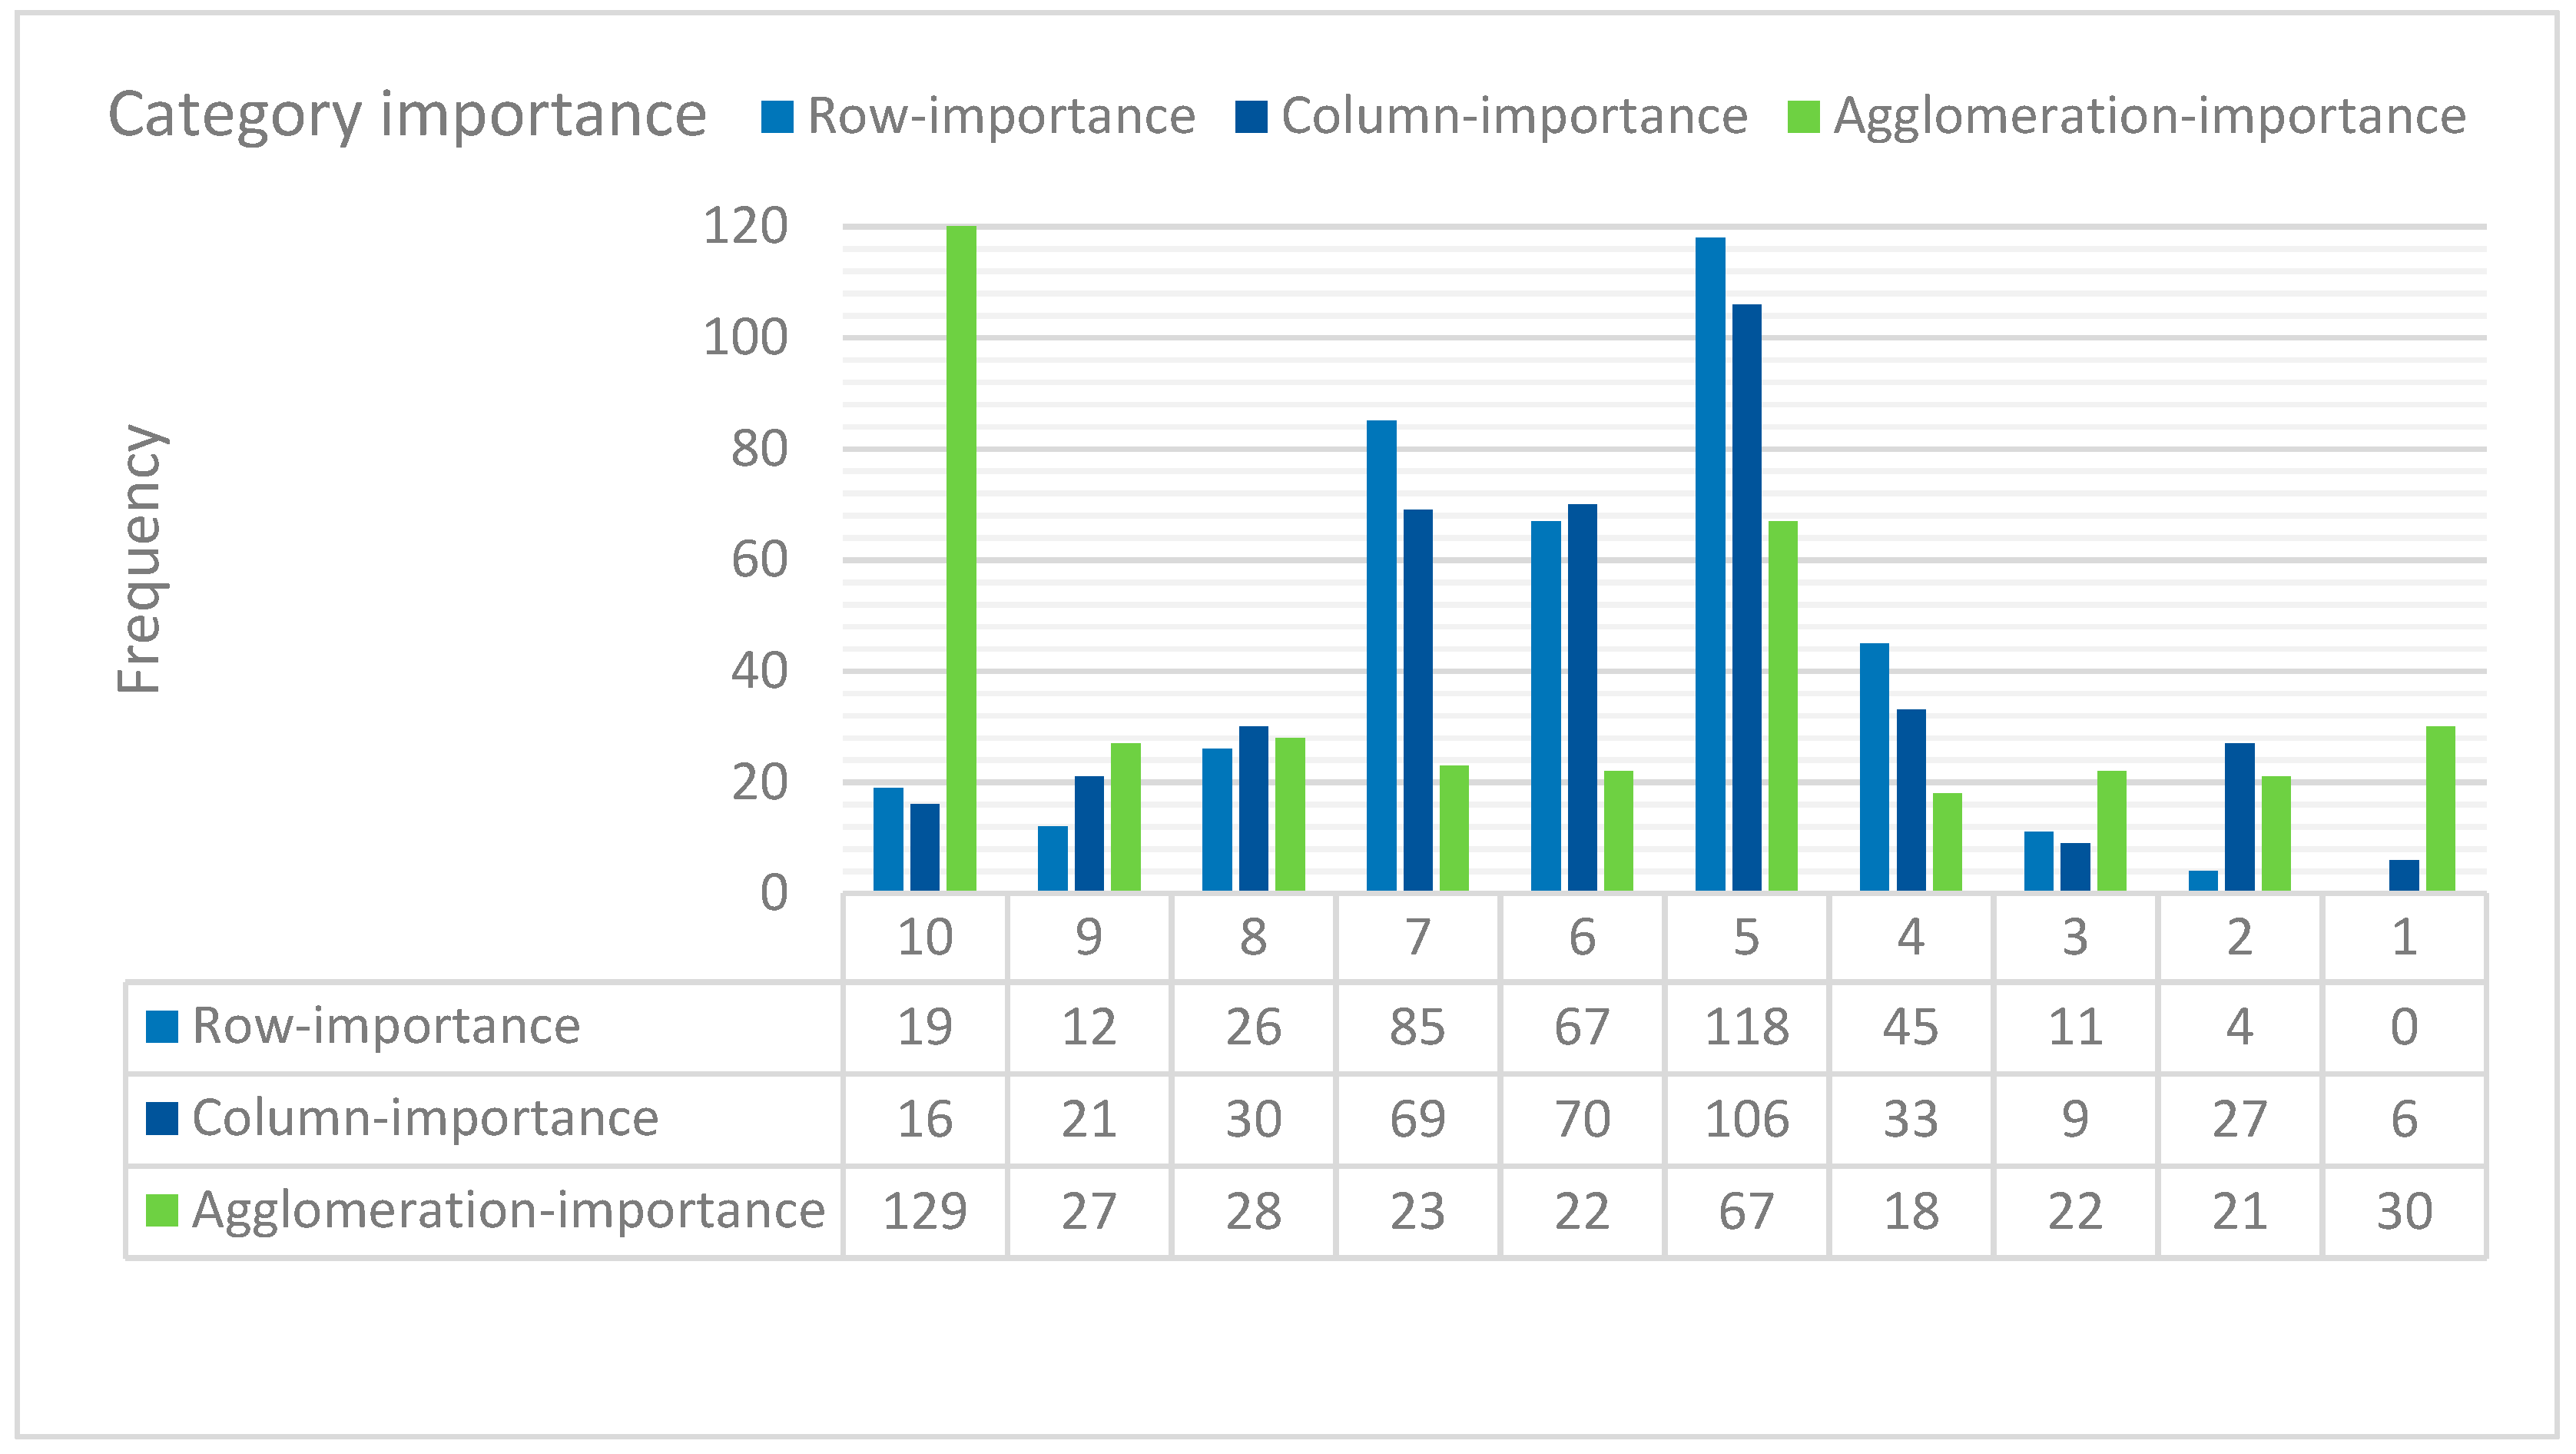
As for the importance of the in-between-categories, the respondents were asked to rate the importance they attach to each category, when making their seat selection decision. The results are presented in
Figure 17. Agglomeration scored most on the 10 points values, with a hundred and twenty-nine respondents, which affirmed that they preferred seats located in the (less-crowded) non-agglomerated areas. As for the average score for row-importance, it can be seen that it was just slightly greater than the scores on the column-importance (5.98 and 5.79, respectively).
After acquiring all the information related to the preferences within a category and knowing the relative importance of the categories, we used the cumulative percentage of each category for determining the fitness value of each seat.
Thus, when a new agent is ready to begin boarding, the agent looks over all the open seats in the airplane and, based on the calculated fitness value of each seat, chooses the seat with the highest fitness value. When two or more seats have the same fitness value, the method randomly picks one of these seats.
As a general formula, the fitness value determined for each seat is:
where
and . are the passenger preference indicators, with values between 1 and 10;
and are the passenger importance indicators, with values between 1 and 10;
is a variable taking 0 or 10, as its values.
The values for each of the mentioned variables in the above formula (except for Agglomeration State, which can only take a value of 0 or 10) were between 1 and 10. In order to determine a specific value for them, a uniform random number was generated in the agent-based model, for each variable, in (0, 100). Then, the randomly generated number was compared to the cumulative percentages presented in
Table 4, determined on the basis of the answers received on the questionnaire. If the uniform random number was smaller than the value in the line of the 10 Likert-points, then the variable would receive a value 10. If not, the program compared it to the next value located on the 9 Likert-points line and if it was smaller, the variable received 9 as an input. If not, it continued, until the randomly generated value was smaller than one of the 10 Likert-points. As mentioned before, the values in
Table 4 are the cumulative percentages determined for each category, based on the answers received (see
Figure 15,
Figure 16 and
Figure 17). The random number generation has been used in this model to ensure that each agent has its own row and column preference and the agents respect the structure of the answers and preferences extracted through the questionnaire. Thus, for example, we expected that by generating a random number smaller than 100, there was a 15% chance for it to be smaller than 15, 21% chance for it to be smaller than 21, and so on, and by attributing the corresponding Likert-points, to the variable, in each case, the agents had almost the same preferences as the questionnaire respondents.
We proceeded, in the same way, to determining the importance for the iRow, the iColumn, and the iAgglomeration variables. The data have been presented in
Table 5.
AgglomerationState was the only variable independent of the questionnaire, as it was determined directly on the basis of the location of the other passengers already seated in the aircraft. To get the values for this variable, the model checked (for each seat) if the two other seats located on the same half-row were occupied. If all of them were open, the seat was considered to be in a non-agglomerated zone; thus, the AgglomerationState received a value of 10. If at least one seat was occupied, then the variable got a value of 0.
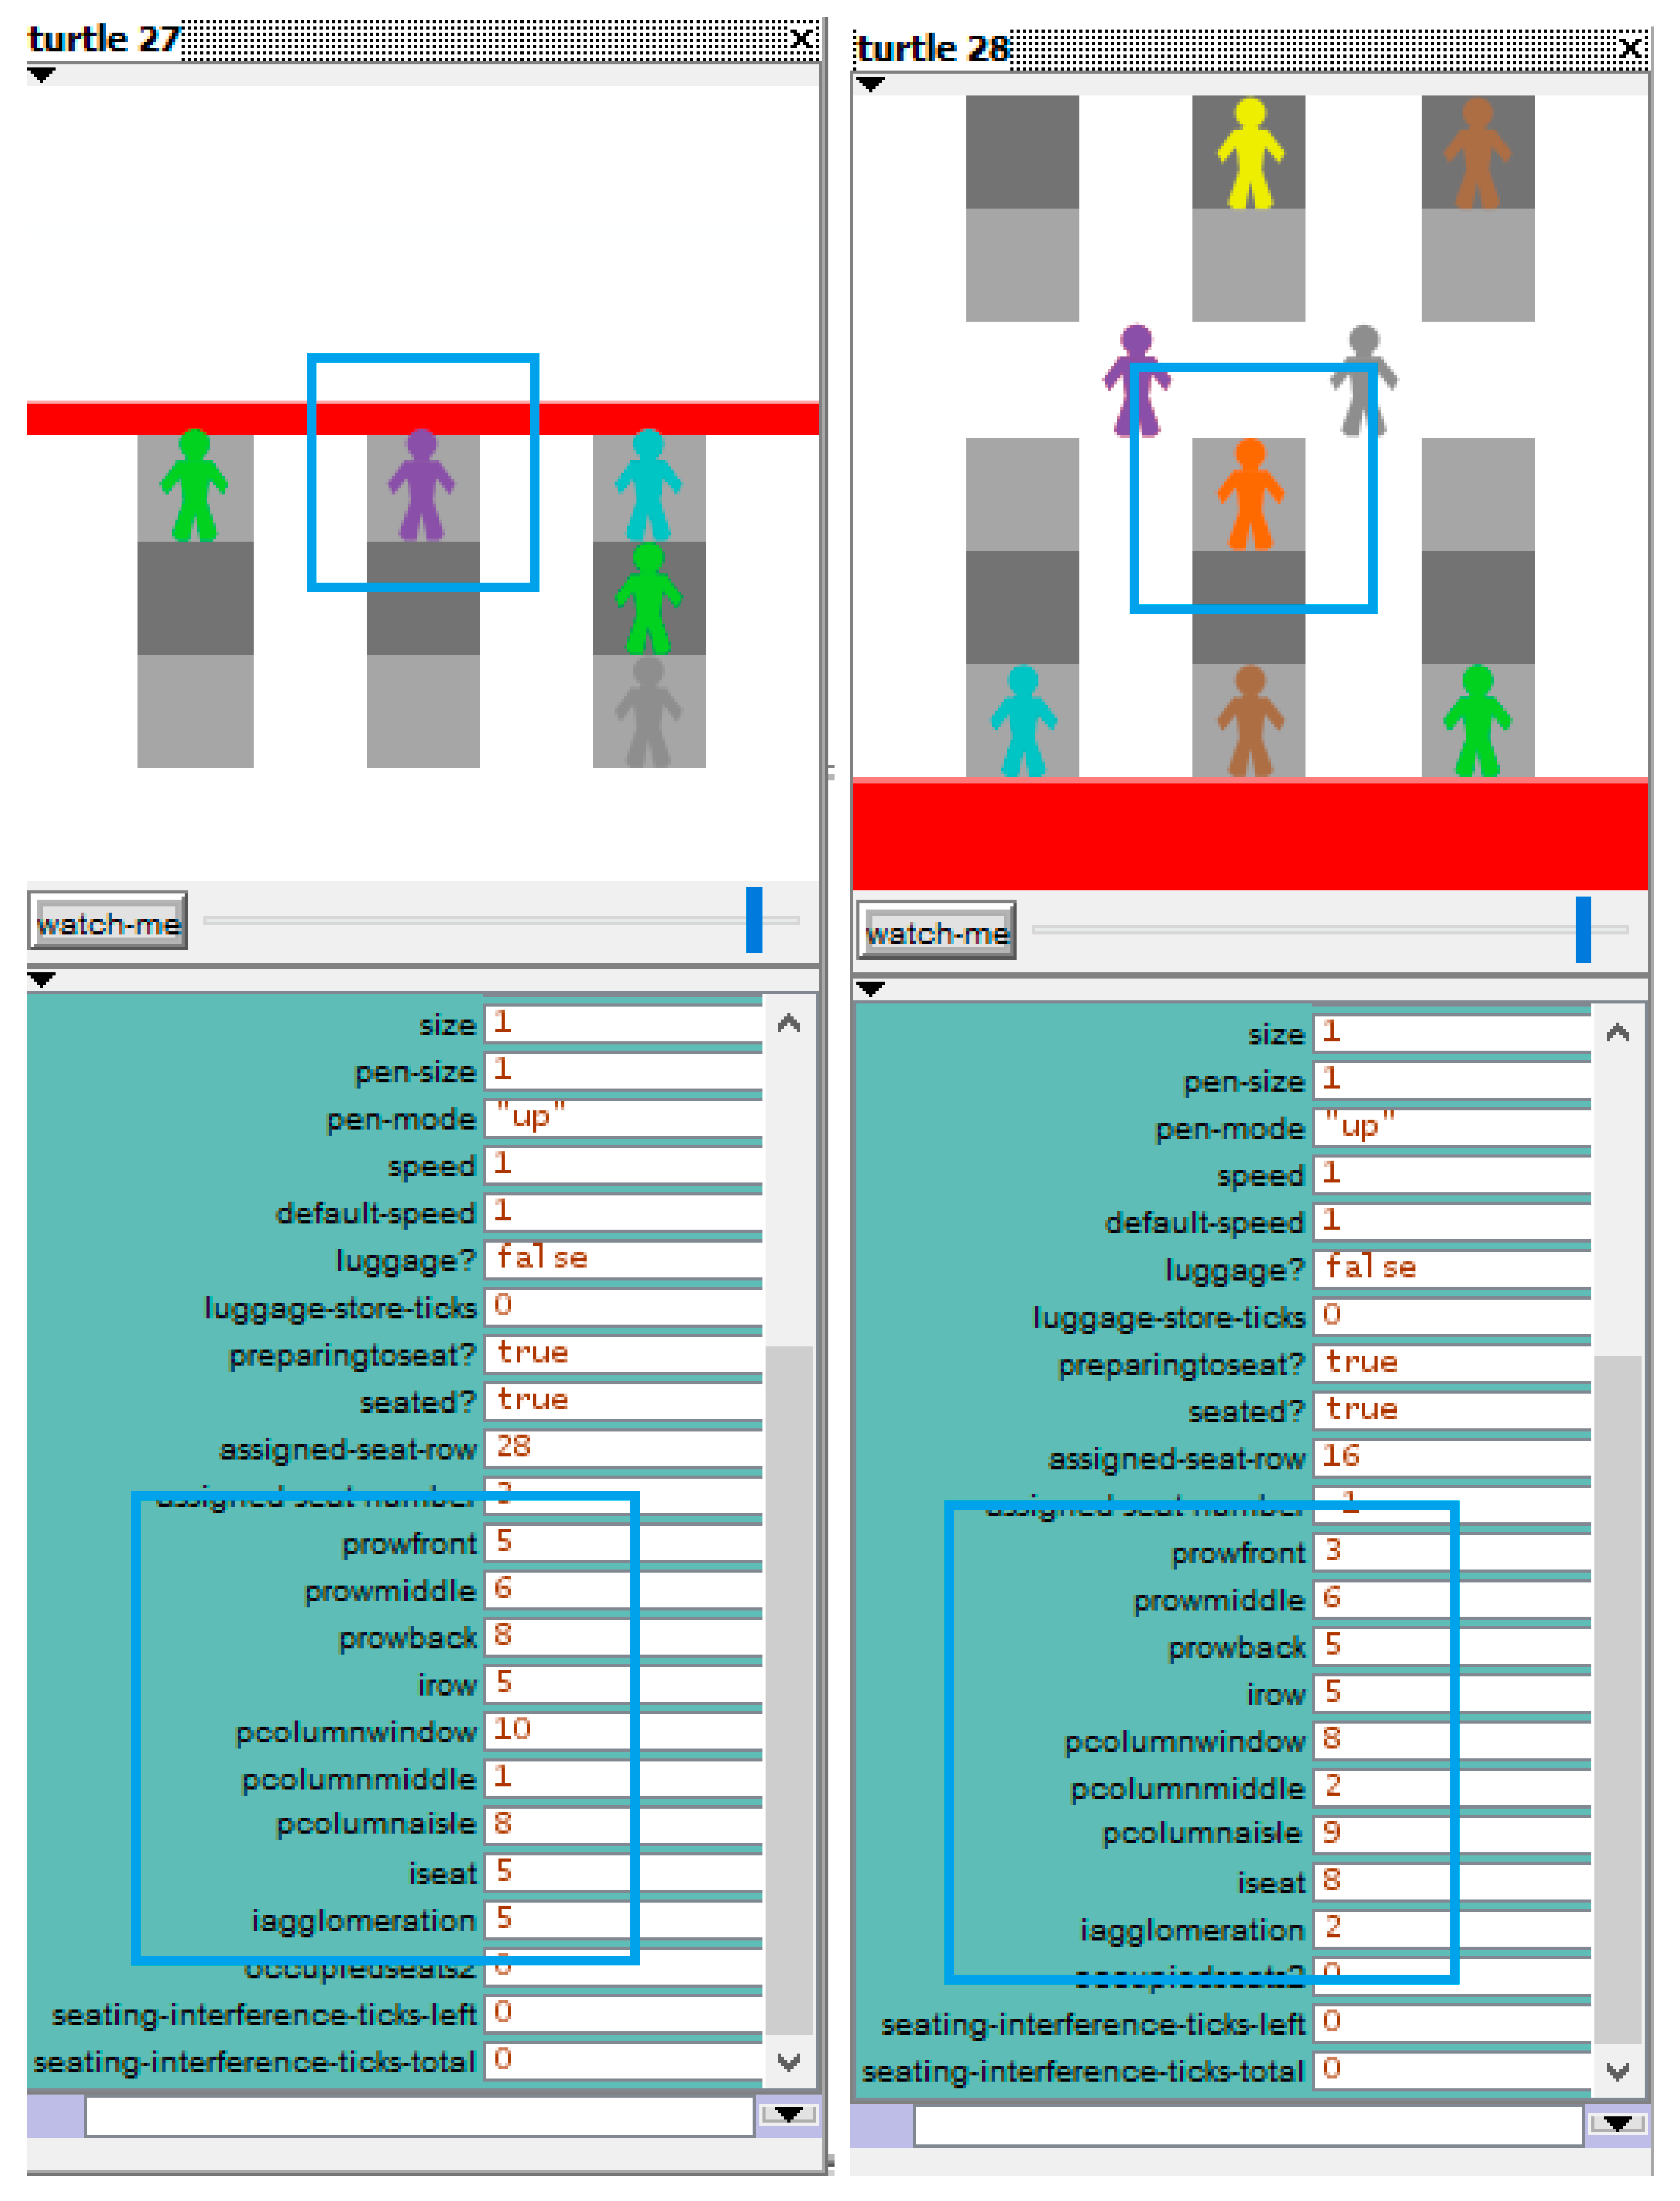
In terms of an agent, the same variables, as in
Table 2, were used in this case. Along with them, the specific variables for the current boarding method was added, such as the iRow, iColumn, iAgglomeration, pRowFront, pRowMiddle, pRowBack, pColumnWindow, pColumnMiddle, pColumnAisle, and the AgglomerationState, as explained above. In
Figure 18, the monitors for two different agents were presented and one could observe the different values for the seat preferences and the importance given to the three considered categories (row, column, and agglomeration). The monitor was a specific screen window that could be opened for each agent, at any moment of time in the model, in which one could easily observe the characteristics of that agent, such as the position, preference for agglomeration, preference for a certain row, preference for a seat located in the front of the aircraft, etc. With time, one could also observe, on the monitor, how the values of the different variables changed.
4. Results
Ferrari and Nagel (2005) asserted that the efficiency of the boarding strategies may depend on the aircraft occupancy and that different strategies may produce better results than others, on the same aircraft model, depending on the occupancy percentage [
8]. Thus, in the current study we have chosen to simulate different aircraft occupancy levels—60%, 80%, and full-flight (100%).
Additionally, seven situations have been considered, depending on the number of pieces of luggage that the passengers carry with them, into the cabin; extracted from the authors of Reference [
26]. See
Table 6.
The simulations were made using the BehaviourSearch 1.10 tool [
16]. This tool is included in the NetLogo suite and it is specifically used for creating and conducting experiments or simulations. Each boarding method was simulated four hundred times for each situation and for the different aircraft occupancy levels.
Figure 19 illustrates a few screens containing a view of the NetLogo model’s interface, as it can be visualized while simulating a particular situation—in this case, an 80% occupancy level, without luggage, through the random without assigned seats method.
Based on the simulated data, the smallest average boarding time was obtained by using the WilMA-back-to-front by-seat method, in almost all situations, including hand luggage (small, big, or both) and a passenger loading percentage of 60% or more. The only exception was encountered in the case of no luggage and a full flight, where a modified-reverse-pyramid half-zone provided slightly better results than the above-mentioned method.
Good boarding times were also produced by the modified-reverse-pyramid half-zone and the WilMA. No matter the aircraft occupancy level, the sequence of relative performance of these methods stayed the same. Among the two methods, it could be observed that the modified-reverse-pyramid half-zone produced better boarding times than the WilMA.
The least effective methods, in terms of boarding times, were the random methods, with and without assigned seats, and the back-to-front method. The time differences among them were relatively small, compared to the overall boarding time. It could be observed that on the full-flights, the back-to-front method produced better results, in terms of boarding time, than both random methods, while, as the number of passengers decreased, the random without assigned seats method started to produce better results, than the back-to-front did.
Table 10 summarizes the hierarchy of the boarding methods by dividing them into three categories, based on the obtained boarding time (in ticks). Thus, the best performing method has been assigned to a category called “best”, while the next best performing methods were added to a category called “good”. As a result, the three methods producing worse results, in terms of boarding time (namely, the random without assigned seats, the back-to-front, and the random with assigned seats) were placed into a group called “worst”. The obtained hierarchy for the best and good methods were in line with results of other researches, such [
33].
As it was observed that in some cases, the values for the method listed as being “best” (namely, WilMA-back-to-front by-seat) were closer to the method listed first on the “good” category (modified-reverse-pyramid half-zone or Outside-in/WilMA), an ANOVA analysis was conducted. For this, we considered the situation of a full aircraft and the luggage situation presented in S7 (no luggage), as this situation was the one in which the values for the boarding times showed only a little difference (of only 4 ticks) between the WilMA-back-to-front by-seat and the modified-reverse-pyramid half zone.
A first ANOVA analysis was done by considering all six methods, with the null hypothesis (H
0) stating that the mean average of the times obtained for the six considered methods is the same [
39,
40]. The values in
Table 11 were determined. The recorded
p-value of 2.1E-304 was less than the significance level of 0.05, thus, we could reject the null hypothesis and safely assume that at least one of the means was different. F (1167.026) was greater than F crit (2.229193), which led to the same conclusion that we could reject the null hypothesis.
As mentioned above, between the WilMA-back-to-front by-seat and the modified-reverse-pyramid half-zone, in case of a full-flight with no luggage (see also
Table 7, column S7), there was only a small difference among the two methods, of only 4 ticks, on average. Thus, we decided to re-run the one-way ANOVA test with only these boarding methods and we discovered that there was a statistically significant difference between the two means [
39,
40]. The results are presented in
Table 12. It can be observed that the
p-value was 0.001932, which is smaller than the significance level of 0.05, and also that F (9.875806) was greater than the F crit (3.888853).
Additionally, a
t-test [
41] was performed, in order to compare the two means of the WilMA-back-to-front by-seat and the modified-reverse-pyramid half-zone. This test was done to check the null hypothesis that the mean of the two data series are equal. The results are shown in
Table 13. In order to decide whether the null hypothesis should be rejected, we have to compare the obtained t Stat value with the two-tailed t Critical value. If the t Stat < −t Critical two-tailed value or the t Stat > t Critical two-tailed value, then, we reject the null hypothesis. This was also our case as, −3.142579543 < −1.97246199. Thus, the null hypothesis was rejected.
Comparing the random without assigned seats for a full aircraft with the WilMA-back-to-front by-seat in situations S1–S3, characterized by an increased level of cabin luggage, it could be observed that the boarding time was longer in the random without assigned seats situation, by almost 11 min. Translated into costs, almost
$330 were saved, on each flight, in which the back-to-front boarding method was used, instead of the random without assigned seats (the cost of
$30/min determined by the authors of Reference [
20] was used). As for the situations S4–S6 where the percentage of hand luggage was smaller, a time reduction of 6 min and 21 s was determined, when the back-to-front method was used, instead of a random without assigned seats, with a cost reduction of almost
$190.5 per flight.
For an 80% occupancy level, the boarding time was longer, on average, in the random without assigned seats than in the WilMA-back-to-front by-seat, by approximatively 7 min and 20 s, for S1–S3, and by 3 min and 8 s, for S4–S6. For a 60% occupancy level, the boarding time took longer when the random without assigned seats was used, instead of the back-to-front, by almost 5 min and 16 s in the S1–S3, and by 1 min and 36 s, in the S4–S6.
Considering both of the random methods, with and without assigned seats, the differences in boarding time were small, among them.
With the NetLogo model, several GUI views are available, that allowed the user to see the number of seat interferences in each simulation, for each type of seat interference, the number of aisle interferences, the interference duration, the number of affected passengers, and the number of interferences with affected passengers; we thought it might be interesting to analyze whether there were any significant differences among the boarding methods producing lower boarding times, and the methods producing higher boarding times.
Thus, we have used situation S1, as it had the highest number of passengers carrying luggage, on a full-flight, and the results in terms of average number of aisle and seat interferences, are presented in
Table 14.
For the average number of aisle interferences, it could be observed that the random without assigned seats was in line with most of the considered methods, except for the WilMA-back-to-front by-seat, which yielded the smallest number of aisle interferences with affected passengers, namely nine interferences.
As for the seat interferences, it was expected, based on their boarding rules, that for the three methods listed as the “good” boarding methods, for a full-flight (the WilMA-back-to-front by-seat, the modified-reverse-pyramid half-zone, and the WilMA), the number of seat interferences would be zero.
On the other hand, when comparing the random without assigned seats with the back-to-front, it could be observed that the average number of seat interferences was smaller in the random without assigned seats case, than in the back-to-front case for the type 1 and 2 interferences. These two types of seat interferences were also the interferences with the longest time. Furthermore, as for type 3 and type 4, which produced the same interference time, the results were—twenty-four interferences in the back-to-front and thirty-six in the random without assigned seats. Additionally, as shown in Reference [
35] the number of aisle and seat interferences did not tell the whole story, as, in most of the cases, the number of these interferences that happened in parallel, in different parts of the aircraft, also mattered.
The following two types of limitations exist in the current study. (a) Limitations to the agent-based modeling implementation: Relatively few questionnaire answers received compared to the actual number of travelers across the world, not considering other aspects related to traveling, such as, group-travel, or the presence of noisy people when selecting a seat without having an assigned seat. (b) Limitations related to the considered approach: Passenger comfort or preference for a more coordinated boarding has not been addressed in this paper.
5. Discussion
The current research considers all the boarding strategies that are used in real-life by airline companies, with an accent on random without assigned seat, and proposes an agent-based model in the NetLogo, for creating a common ground in which these methods could be tested. The main challenge in implementing an agent-based model featuring the random without assigned seats method was the creation of agents that could behave as humans, when facing a partially-filled aircraft. For this, a questionnaire was used to extract the importance and preference for row, column, and agglomeration, when selecting a seat in the free-for-all situation. A specific fitness value has been determined, using the agent-based model, for each seat, depending on each passenger’s preferences. Each agent had the possibility to choose his or her seat in a human manner.
Five other boarding methods have been identified and simulated using the agent-based model, along with the random without assigned seat on an Airbus A320 aircraft with twenty-nine rows, in seven possible situations, depending on the amount of luggage carried in the cabin, and considering the different passenger loading percentages. The results have shown, that no matter the luggage situation nor the passenger loading percentage, the best performing method was the WilMA-back-to-front by-seat, while the worst methods were the random methods, with and without an assigned seat, and the back-to-front. The other two methods (the modified-reverse-pyramid half-zone and the WilMA) produced good results, in terms of boarding time.
Even though the random without assigned seats produced comparable results, in terms of time, with the back-to-front and the random with assigned seats, when selecting the best method, one should also consider some other aspects, such as the passengers’ comfort during the boarding process.
6. Conclusions
There are a series of factors which should be taken into account when selecting a boarding strategy. The actual boarding time can be one of them and companies can decide whether it is the most important factor, and whether the passenger inconveniences, resulting from using a certain boarding method, are less important than passengers’ comfort. The airline companies should find the optimal combination of minimizing the boarding time and offering the best traveling experience to their customers. Often, a long boarding process is perceived as stressful, thus, the boarding strategies should also be evaluated when considering the emotional stresses on the passengers [
5]. Regarding the amount of stress the passengers face while boarding, authors of Reference [
42] acknowledges the presence of stress and determines that music has a statistically significant importance for reducing the perceived boarding time. The ease of implementation is also a factor in selecting a boarding method.
Seat interference has often been seen as a problem in the boarding process; most of the methods try to minimize it. In our study, we observed that the methods that have rules for eliminating seat interference performed well, in terms of boarding times.
Additionally, the aisle interference seems to have a role in the overall boarding time, as the methods with an increased number of passengers affected by aisle interferences, result in higher boarding times.
Considering random without assigned seat, it could be said that the overall boarding time was higher in this case, than in the other methods, due to the presence of both seat and aisle interferences. As there were many interferences that did not happen in parallel, the overall number of passengers was high, resulting in not only an increased boarding time but also contributing to passengers’ discomfort, while boarding.
Last, we mentioned that the minimal boarding time was only one factor that should be considered, in addition to other customer-related aspects. For this, we aim to conduct a further study to integrate passengers’ opinions related to a boarding process that they have recently completed and compare the boarding methods by considering both the time for boarding and the passengers’ satisfaction.


