Correlation between Transit-Oriented Development (TOD), Land Use Catchment Areas, and Local Environmental Transformation


1
School of Architecture, Harbin Institute of Technology, Shen Zhen 518000, China
2
Department of Building and Real Estate and Research Institute of Sustainable Urban Development, The Hong Kong Polytechnic University, Hung Hom, Kowloon 999077, Hong Kong, China
*
Authors to whom correspondence should be addressed.
Sustainability 2018, 10(12), 4622; https://doi.org/10.3390/su10124622
Submission received: 26 October 2018
/
Revised: 24 November 2018
/
Accepted: 3 December 2018
/
Published: 5 December 2018
(This article belongs to the Special Issue Sustainable Urban Land Use and Transportation)
Abstract
:Transit-oriented development (TOD) has been recognised as a sustainable planning approach and that is typically designed for a whole city. Individual land use characteristics and the causations have often been ignored. Therefore, the primary objective of this study was to explore the factors that influence the land use catchment area (LCA) characteristics at a station neighborhood level. First, it contributes a methodology to measure the LCA by introducing a new concept. The density gradient was introduced to generate the scale and compactness degree of each station. Second, it provides a theoretical framework for understanding the causes of different LCAs. The partial least squares (PLS) regression model was employed to explore the accessibility effects. By analysing density gradient curves, it reveals that stations grew to fit the negative exponential function. Regarding the scale and form degree of LCAs, the impact of accessibility before and after a station construction have been corroborated. Moreover, the effects of facilities function before construction, distance from main roads, and elevated stations have been emphasized. The results provide support for a more sophisticated concept of catchment area relating to land use at the level of an individual TOD station, while shedding light on the benefits of those engaged in the future design of TOD with due consideration of the local physical environments.
1. Introduction
Transit-oriented development (TOD) is an important approach for cities that are aiming for sustainability and smart growth. It involves networks and that are designed for a whole city. Therefore, the catchment areas are usually considered at city scale rather than at the level of an individual station. In practice, each catchment area experiences a unique transformation, even for stations that follow the similar station construction. Detailed changes of land use as they relate to local environmental factors should not be ignored. It is important to have a comprehensive understanding of land use formation and the causative factors.
In previous studies, TOD catchment areas (CA) have been discussed mainly by walking distance [1,2], ridership prediction [3,4], and in relation to land value [5,6]. Because of the different understandings and interpretations of the TOD concept, a one-size-fits-all approach is counterproductive [7]. The concept of LCA is an extensive understanding of CA by focusing on the land use features due to a station construction, like the PCA (pedestrian catchment area) concept focusing on the pedestrian walking character near a station. The physical feature of land use is a crucial factor for understanding the demand of travel and the extent of trip mode decision making [8]. Changes of land use cannot be fully identified or defined through the analysis of a pedestrian catchment area or a land value scope. Understanding of land use characteristics and their causes can help planners to effectively guide and improve traffic feedbacks, even expanding the scope of TOD [9].
Unfortunately, only a few studies have measured and explained the detailed land use features of TOD. Much of this is due to a lack of sufficient data to track slow dynamic transformation. In addition, it is difficult to describe the precise characteristics of land use by using traditional data, for example, lot coverage or floor area ratio (FAR). However, recently, as a result of governmental attention and of the emergence of new data sources (for example, point-of-interest and OpenStreetMap, etc.), the land use data is becoming both more precise and more readily available to academics and members of the public. Moreover, areas surrounding early examples have begun to mature as functional regions.
Therefore, as interest in TODs persists, it is now a promising time to undertaken further analyses. The particular LCA analysis of TOD should receive research attention. To fill this gap, this research focuses on exploring the factors that influence the LCA characteristics at the level of the individual station. More specifically, this paper aims to address the following issues: (1) why the LCA around TOD stations needs to be reanalysed; (2) how the characteristics of LCAs can be evaluated; (3) why different LCAs are formed; and (4) how designers can be helped to effectively consider the local environments in the future.
In order to achieve these goals, this paper is organised as follows. Section 2 reviews the existing literature and identifies theoretical gaps relating to catchment area (CA) measurement before summarising the typical land use features, density gradient measurement, and its influencing factors in TODs. Section 3 describes the study’s methodologies and presents the investigation of 86 TOD stations in the mega-city area of Shenzhen. Section 4 discusses the results of the density gradient measurement and a partial least squares (PLS) regression model used to attribute causes to land use development. This is followed by some planning recommendations and conclusions in Section 5.
2. Background
2.1. Research Related to Catchment Areas
Acceptable walking distance, widely known as the pedestrian catchment area (PCA), is often regarded as the key determinant of CA. Thus, TOD planning commonly addresses a distance from 400 m to 800 m (10 min walking time) as a de facto standard. Quarter-mile (400 m), one-third mile (500 m), 2000 feet (600 m) and one-half mile (800 m) standards have all been proposed as acceptable thresholds [1,2,10,11]. Many studies have built upon the idea of PCA, discussing acceptable walking times and speeds in different build environments and transit trips [12,13,14]. For predicting travel demand such as ridership, variables including land use pattern, transit accessibility, and demographic background are often regarded as robust predictors [15,16,17]. However, even in the same city, significant differences of CA results exist because of predictor selection, analysis method and model specification [3,4,18].
Consideration of real estate markets and property values allows CA to be addressed in a different way. An extensive body of literature has confirmed that TOD-based development plays an important and positive role in urban land markets [19]. The change features within different distances have been discussed [5,6]. Petheram et al. [20] reported that, in the Salt Lake City metropolitan area, the minimum market-driven catchment area of a light rail station can extend to 1.25 miles, which is clearly far beyond normal walking distance.
As with land use catchment areas, some studies have explored the spatial demarcation of TOD areas in terms of shape [21]. Little work has been done to recognize the land changing boundaries because of station construction. More research attention has been focused on the land use distribution and transformation, including intensity degree and composition as seen in the reviews below.
2.2. Land use and Density Characteristics of TOD
Land use features are often analysed by density, diversity, and design characteristics in TOD studies [22]. In a number of development policies, high diversity was encouraged throughout the whole areas, while a density index was set out more explicitly with the change in distance.
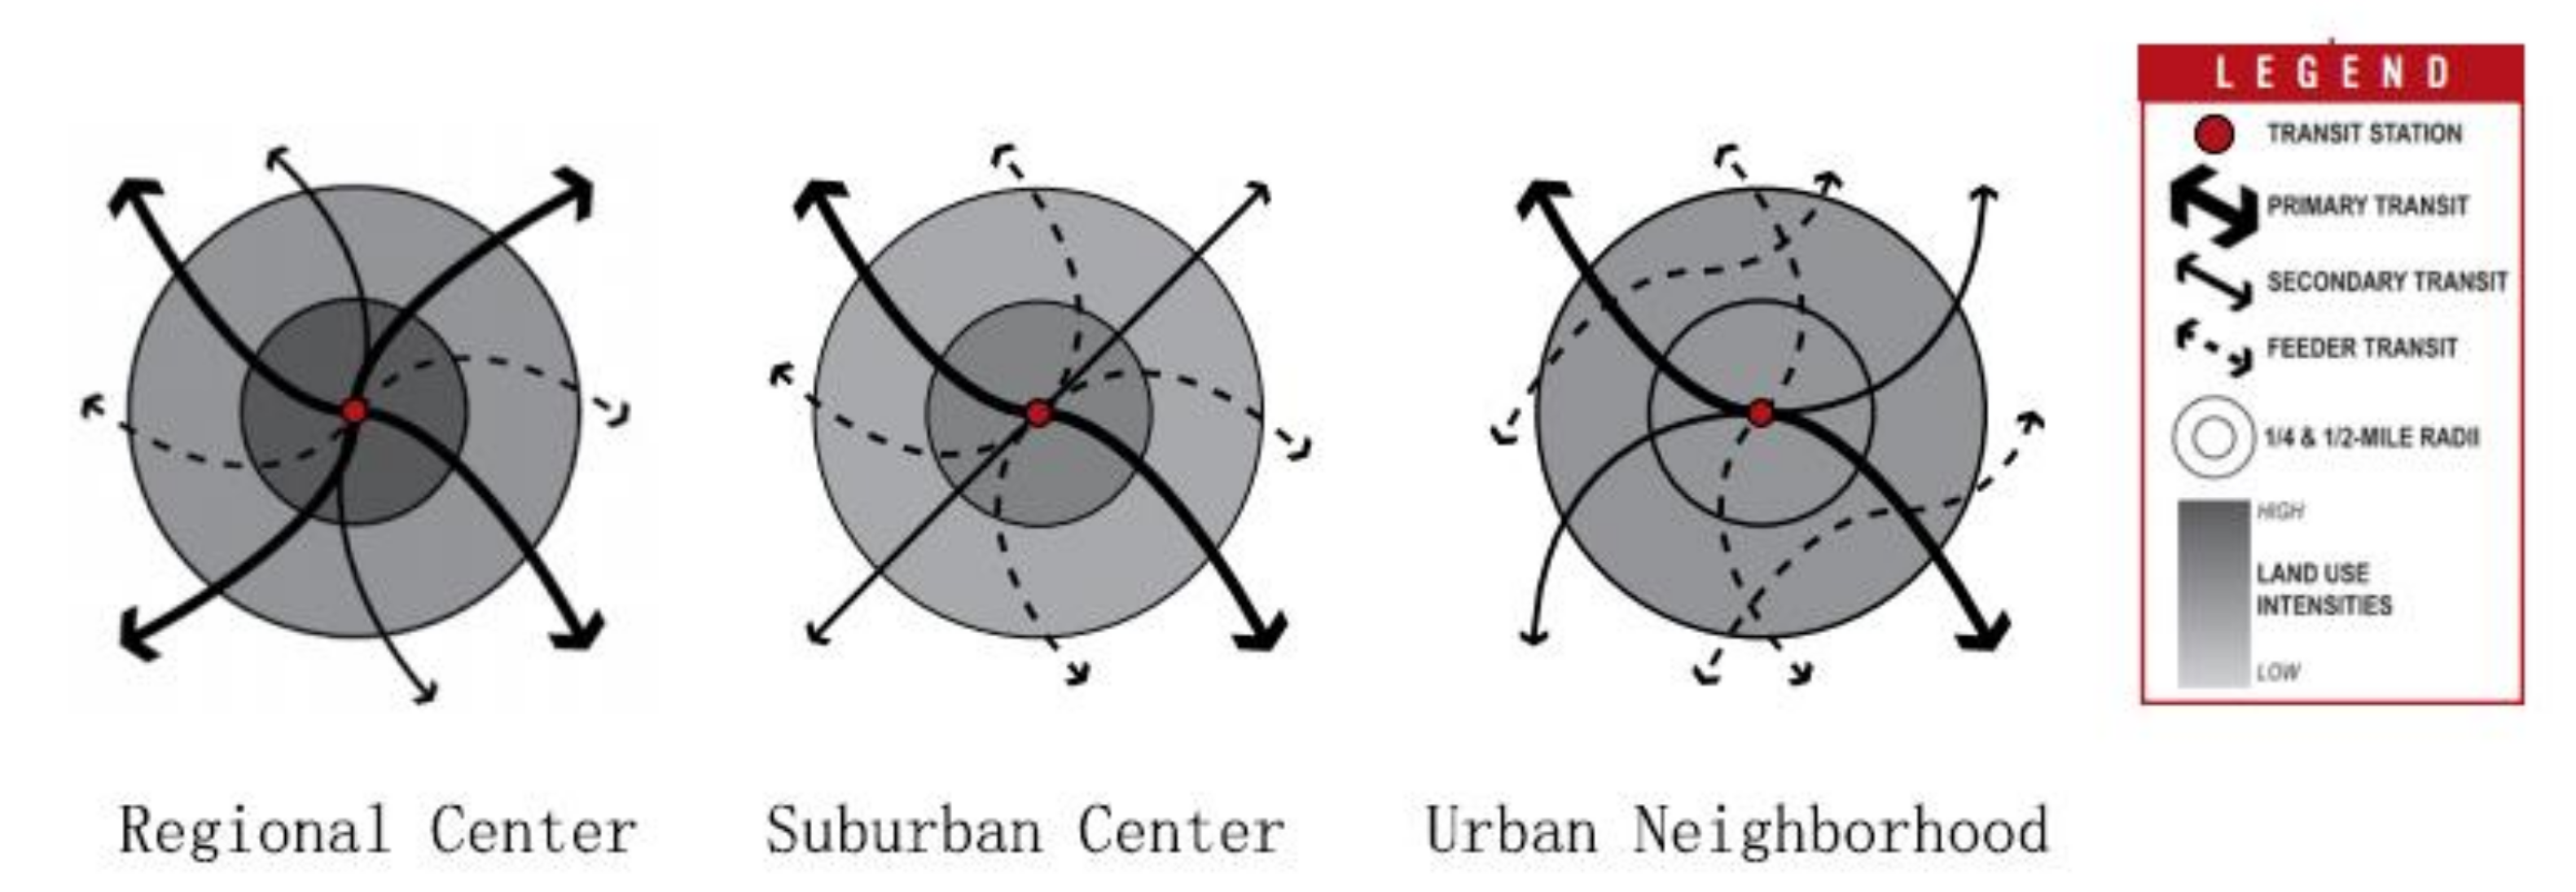
TOD density and its spatial range are valuable characteristics within the station areas. Theoretically, the density decreased as the distance from the station increases [1]. Growth Management Queensland [23] and Shenzhen Urban Transport Planning Center [24] have both encouraged developers to consolidate density in the precinct core and to taper it towards the outer areas. Alongside the increase in the prominence of a TOD location, the density of the core area should increase. The Reconnecting America’s Center for TOD [25] also elaborated land use intensity and suggested that density requirements of stations should differ depending on the locations (Figure 1).
Core densities in regional centres should usually be higher than those in suburban areas, and in both cases, the intensity within a quarter-mile should greatly exceed that observed in the half-mile radius around stations. However, in neighbourhood areas developed as suburbs, TOD densities could spread more evenly throughout the half-mile radius.
From these guidances, the TOD projects display different features and hierarchies based on density distribution. The core density and its declining trend around stations can be a key factor to identifying TOD typology. As Cervero [26] mentioned, tapering of densities with distance from a station could like a wedding cake. In the urban economic and cultural centres, the density of TOD core areas should be higher than that of the neighbourhoods. In neighbourhoods, the densities may not be as concentrated as in the “centre” regions. However, whether the actual density could meet these requirements has not been determined.
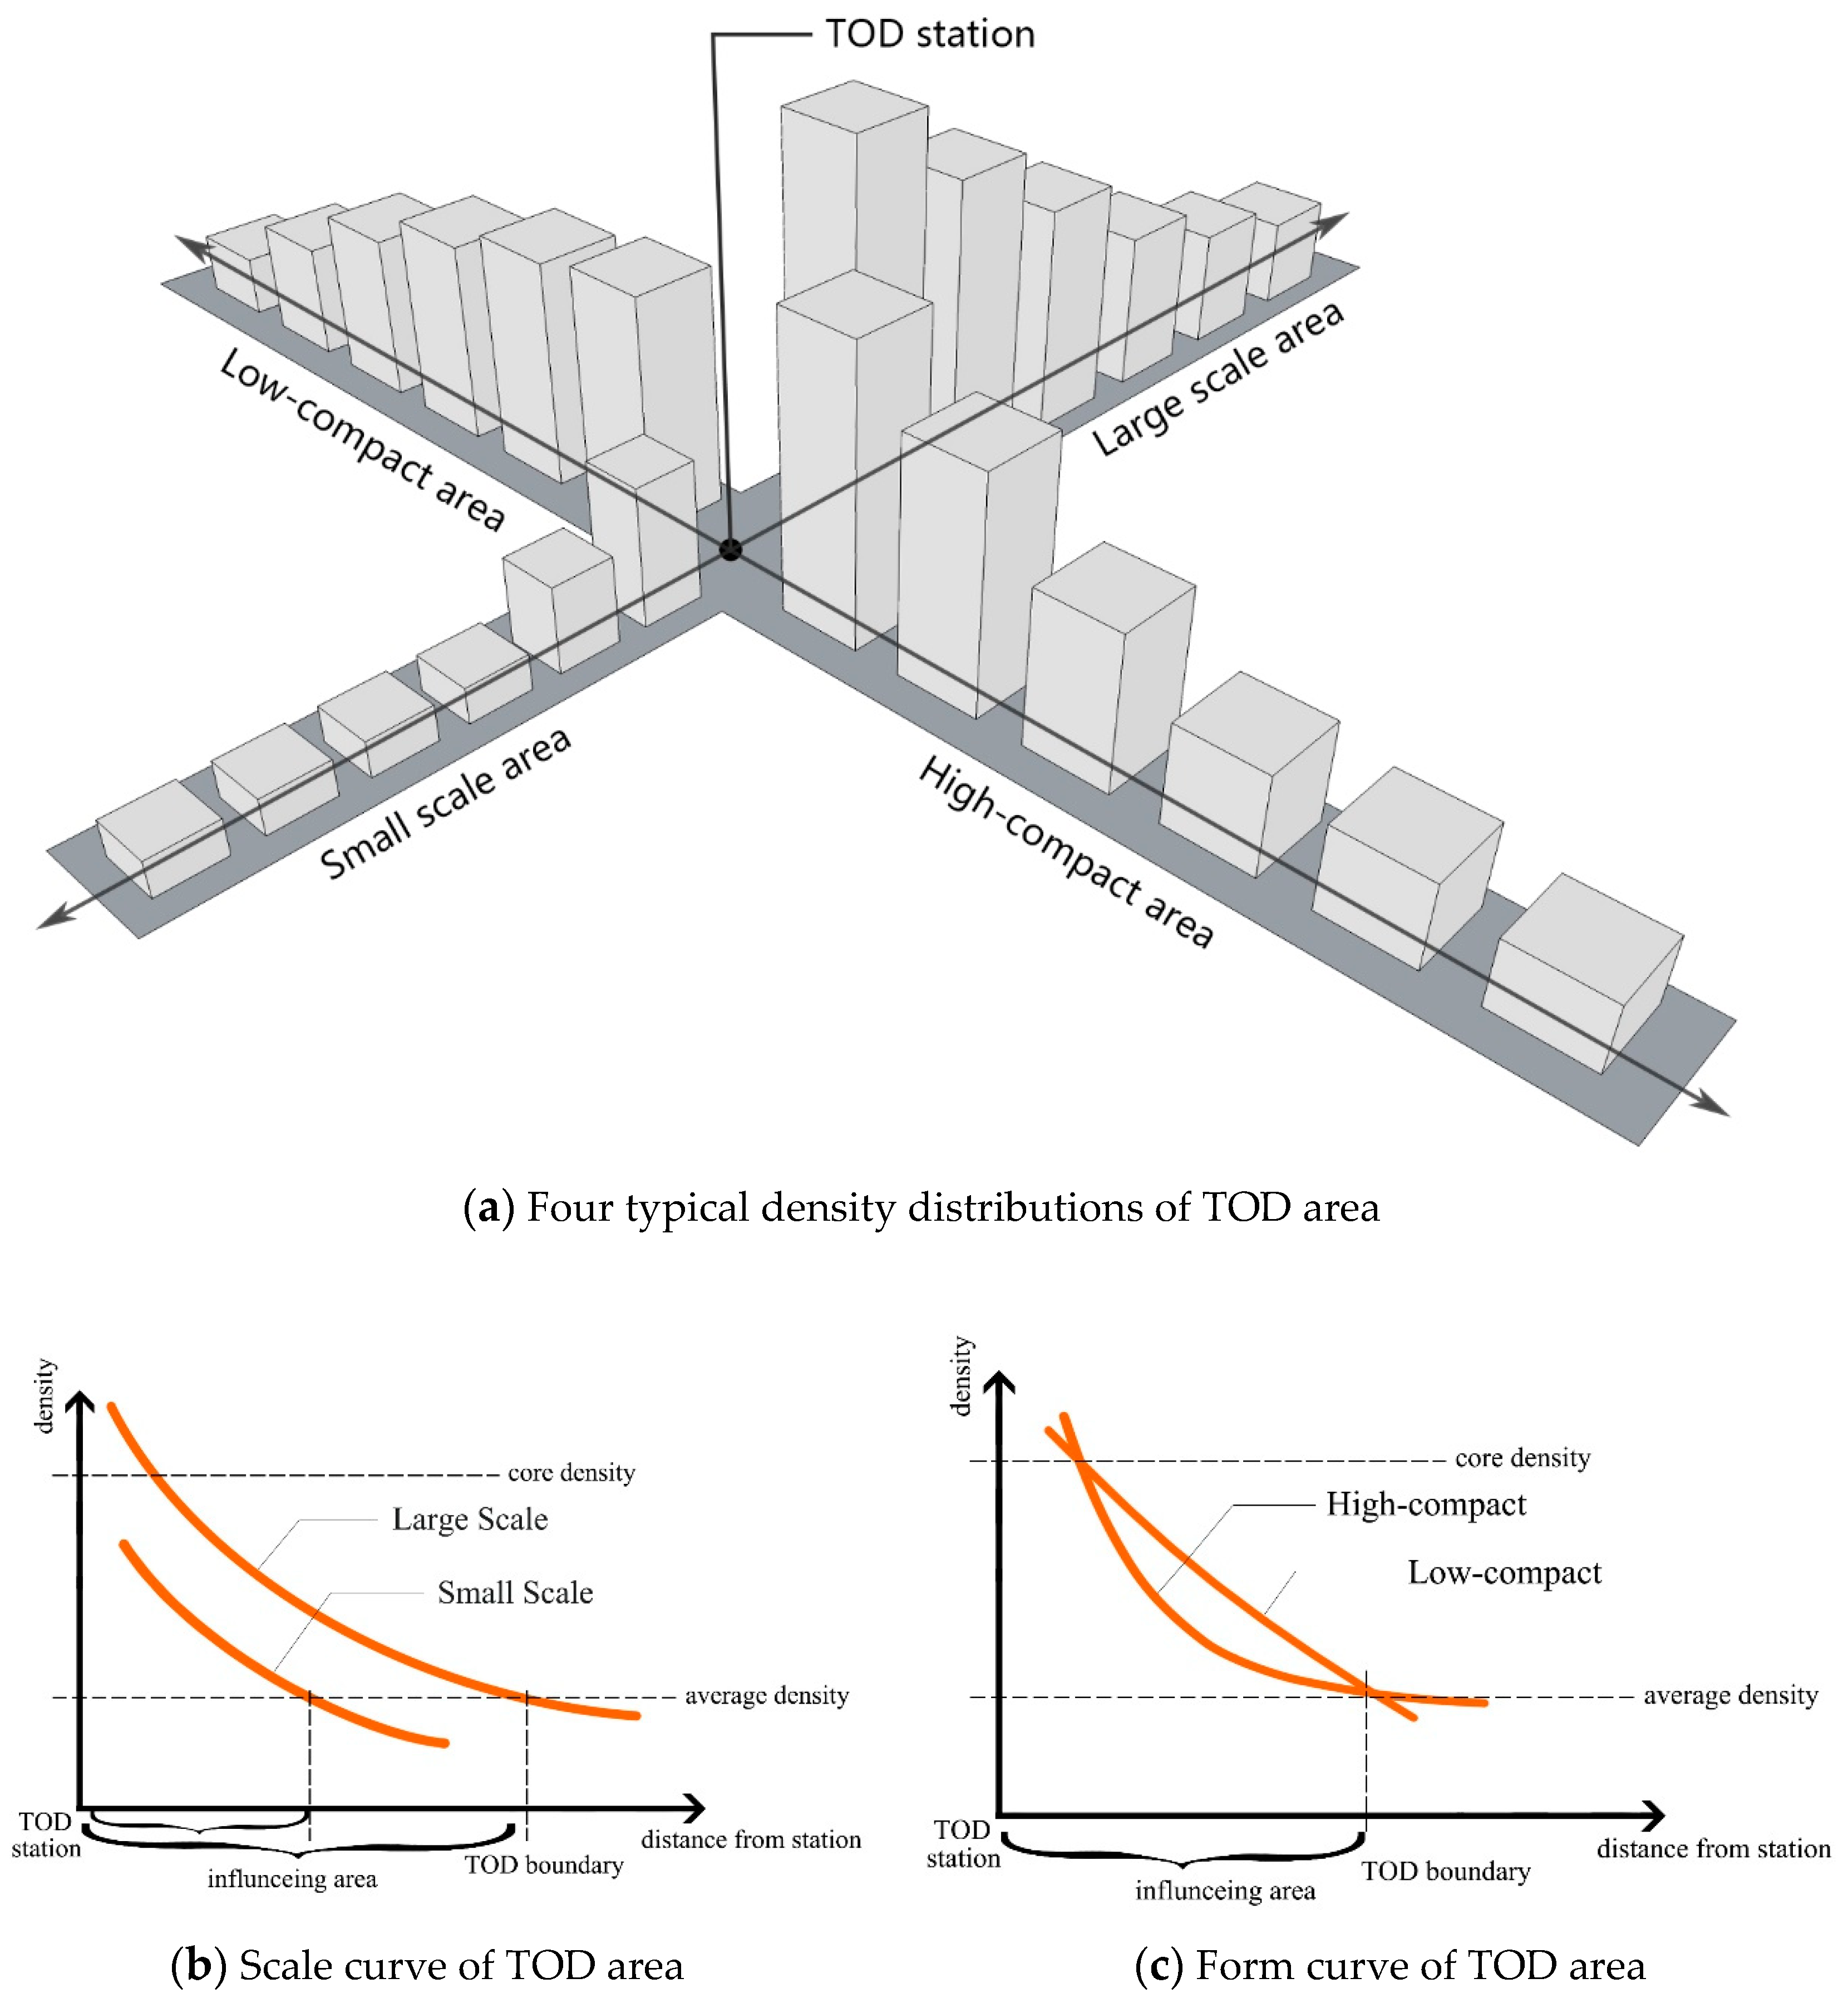
Therefore, the land use density could be considered as a key feature for comparing the difference between each set of two stations and between in the theory and reality. The evaluation of TOD land use pattern includes two main characteristics, namely the scale and form of the TOD. The scale of the TOD refers to the intensity level in the core area of each station. In general, large-scale and prominent stations contain more facilities and daily activities. Thus, the influencing area of such stations might be more intense and larger than that of the forane ones. The form of the TOD refers to the decreasing trend of its surrounding amenities, in other words, the compactness of the area. The centres of compact stations usually served as commuter hubs with multiple functional areas. In the unconcentrated and sprawling areas, the station is often less of a focal point for activities. Therefore, the densities are usually spread more evenly throughout the station areas.
Conceptual land use patterns can be observed in Figure 2a with block size representing the density changes. In Figure 2b, the scale of the TOD represents the impact scope and density of the core area, commonly understood as the important level and the size (large or small area) of the TOD area. In Figure 2c, the form of the TOD shows the compactness of the land use pattern.
Based on the aforementioned planning guidelines, stations with a dense core and compact pattern could be recognised as the important regional stations. Those with a lower density in the core area or a less compact area could be the sub-urban or neighbourhood stations. In the urban central area, unsuccessful stations could be those with low-density cores and that spread evenly, failing to meet the TOD target of high density and compactness.
2.3. Density Gradient
By using the density gradient equations, the density distributions can be evaluated accurately. A widely used geographical density gradient model has been derived from Thünen and Alonso’s theory [27]. In order to account for intra-urban variations in land use, the model supposes that a city has a single, defined centre. Urban densities decline with distance from the centre of the city in accordance with a function curve. This method is usually applied to a city scale and has been fully verified in empirical studies. It is typically used to describe population density [28,29], industrial employment density [30,31], land price [32,33] and urban spatial patterns [34,35]. Compared with other calculation methods, such as those derived from land use proportions and rates of land use change, the advantage of the density gradient model is that it is not dependent on the pre-establishment of the spatial fringe. Moreover, it is easier to compare between different areas or factors.
Thus, in this study, the density gradient is proposed as a proxy for scale and compactness characteristics of TOD catchment areas. The advantage of this new methodology is that it allows researchers to calculate and compare individual LCA characteristics. By focusing on scale and form characteristics, each TOD area could be accurately estimated using the curve that consists of the facility density per 100 m circular area. The point of interest (POI) data was collected to refer to the urban facilities, which will be elaborated in Section 3.3.
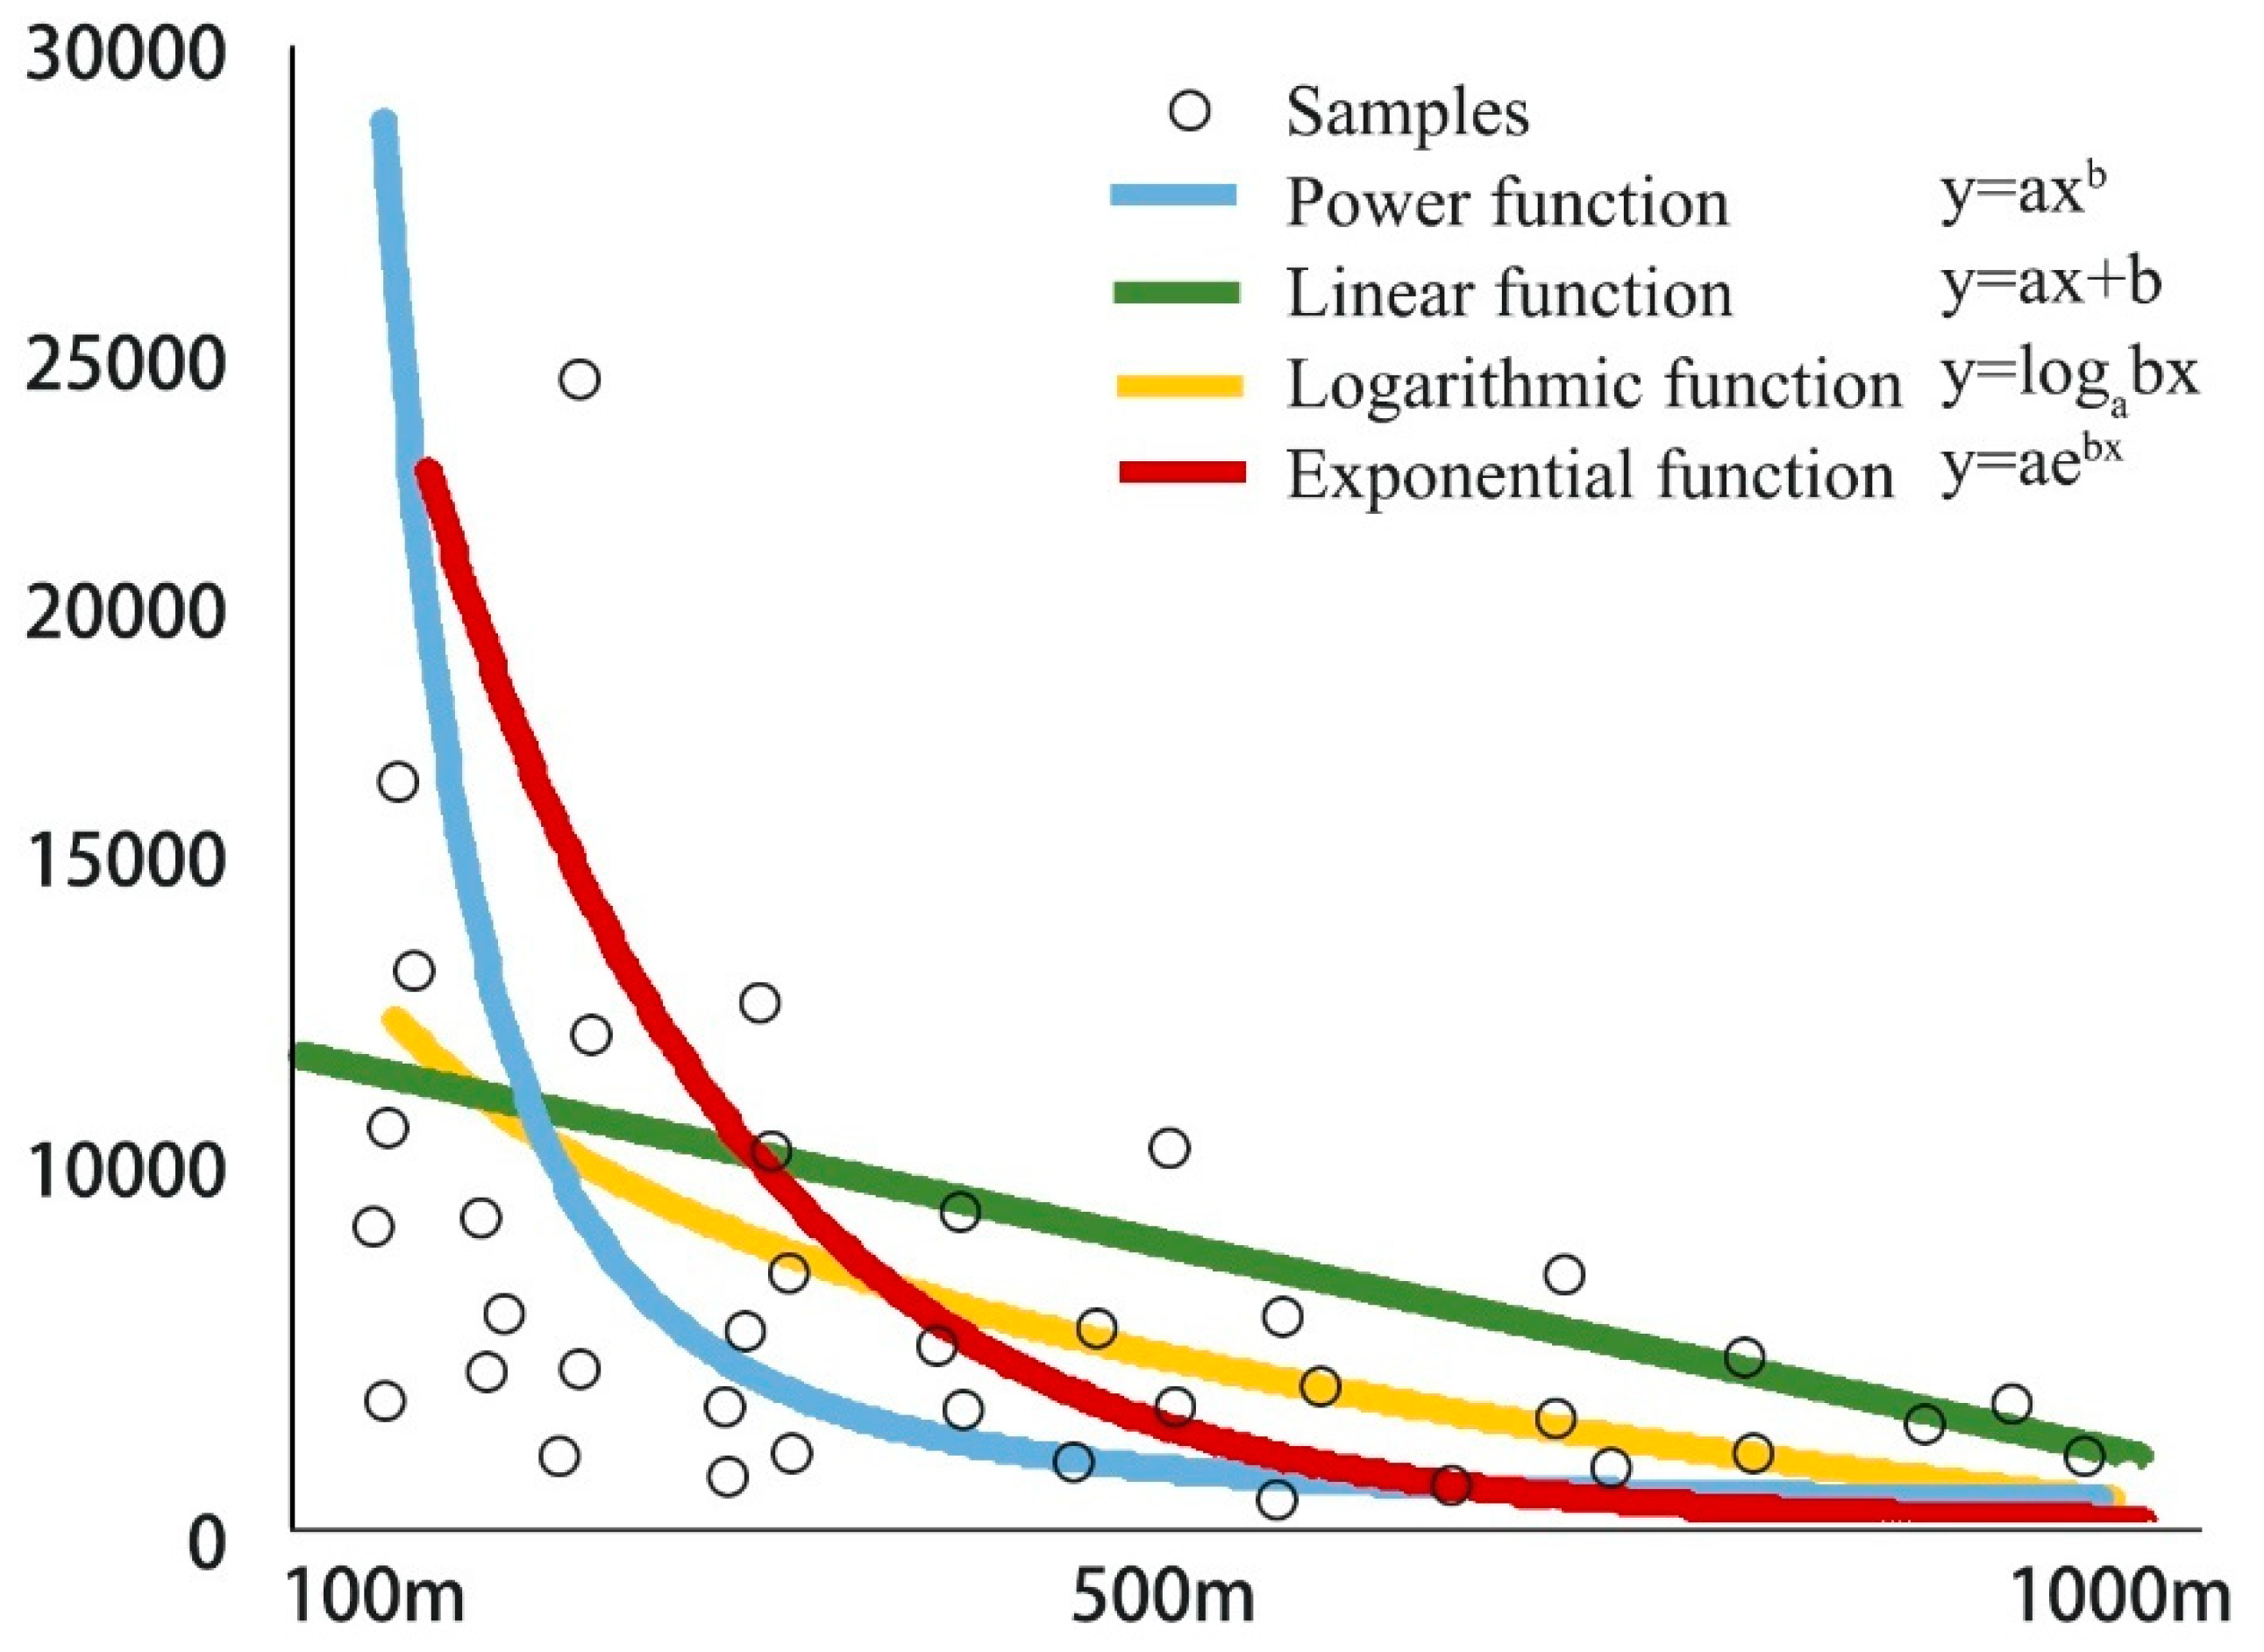
In order to apply this method, a functional curve needed to be set first, normally as power, linear, logarithmic and exponential functions (Figure 3). The fitting goodness of each function can be calculated by the R2. After comparing the value of R2, the best fitting equation was chosen as the density gradient curve. For delineating this equation, the intercept (value ‘a’) and slope (value ‘b’) of each equation can be mathematically calculated. Value ‘a’ and Value ‘b’ can represent the spatial scale and level of spatial compactness of each station, respectively
For example, in Shenzhen, the exponential curve has the highest fitting degree, which can be found by comparing the fitting goodness of each function (Table 1). This means that the POI density drops exponentially as the distance from the station increases.
Based on the curve-fitting function of the Origin 8.0 software (OriginLab Corporation, Northampton, U.S.A.) [36], the equation of each site could be calculated. The final exponential equation is as follows:
where r is the distance from a facility to the spatial centre (in most research, this is the Central Business District, but in this study, it is the TOD station). D (r) is the facilities density. The value of ‘a’ is the theoretical core density of the area, which represents the scale degree. The higher the ‘a’ value, the higher the density of the area centre and the higher the level of the station. Similarly, ‘b’ is the compact value, representing the form of the facilities distribution. The higher the ‘b’ value, the more compact the station area.
D(r) = a exp−br
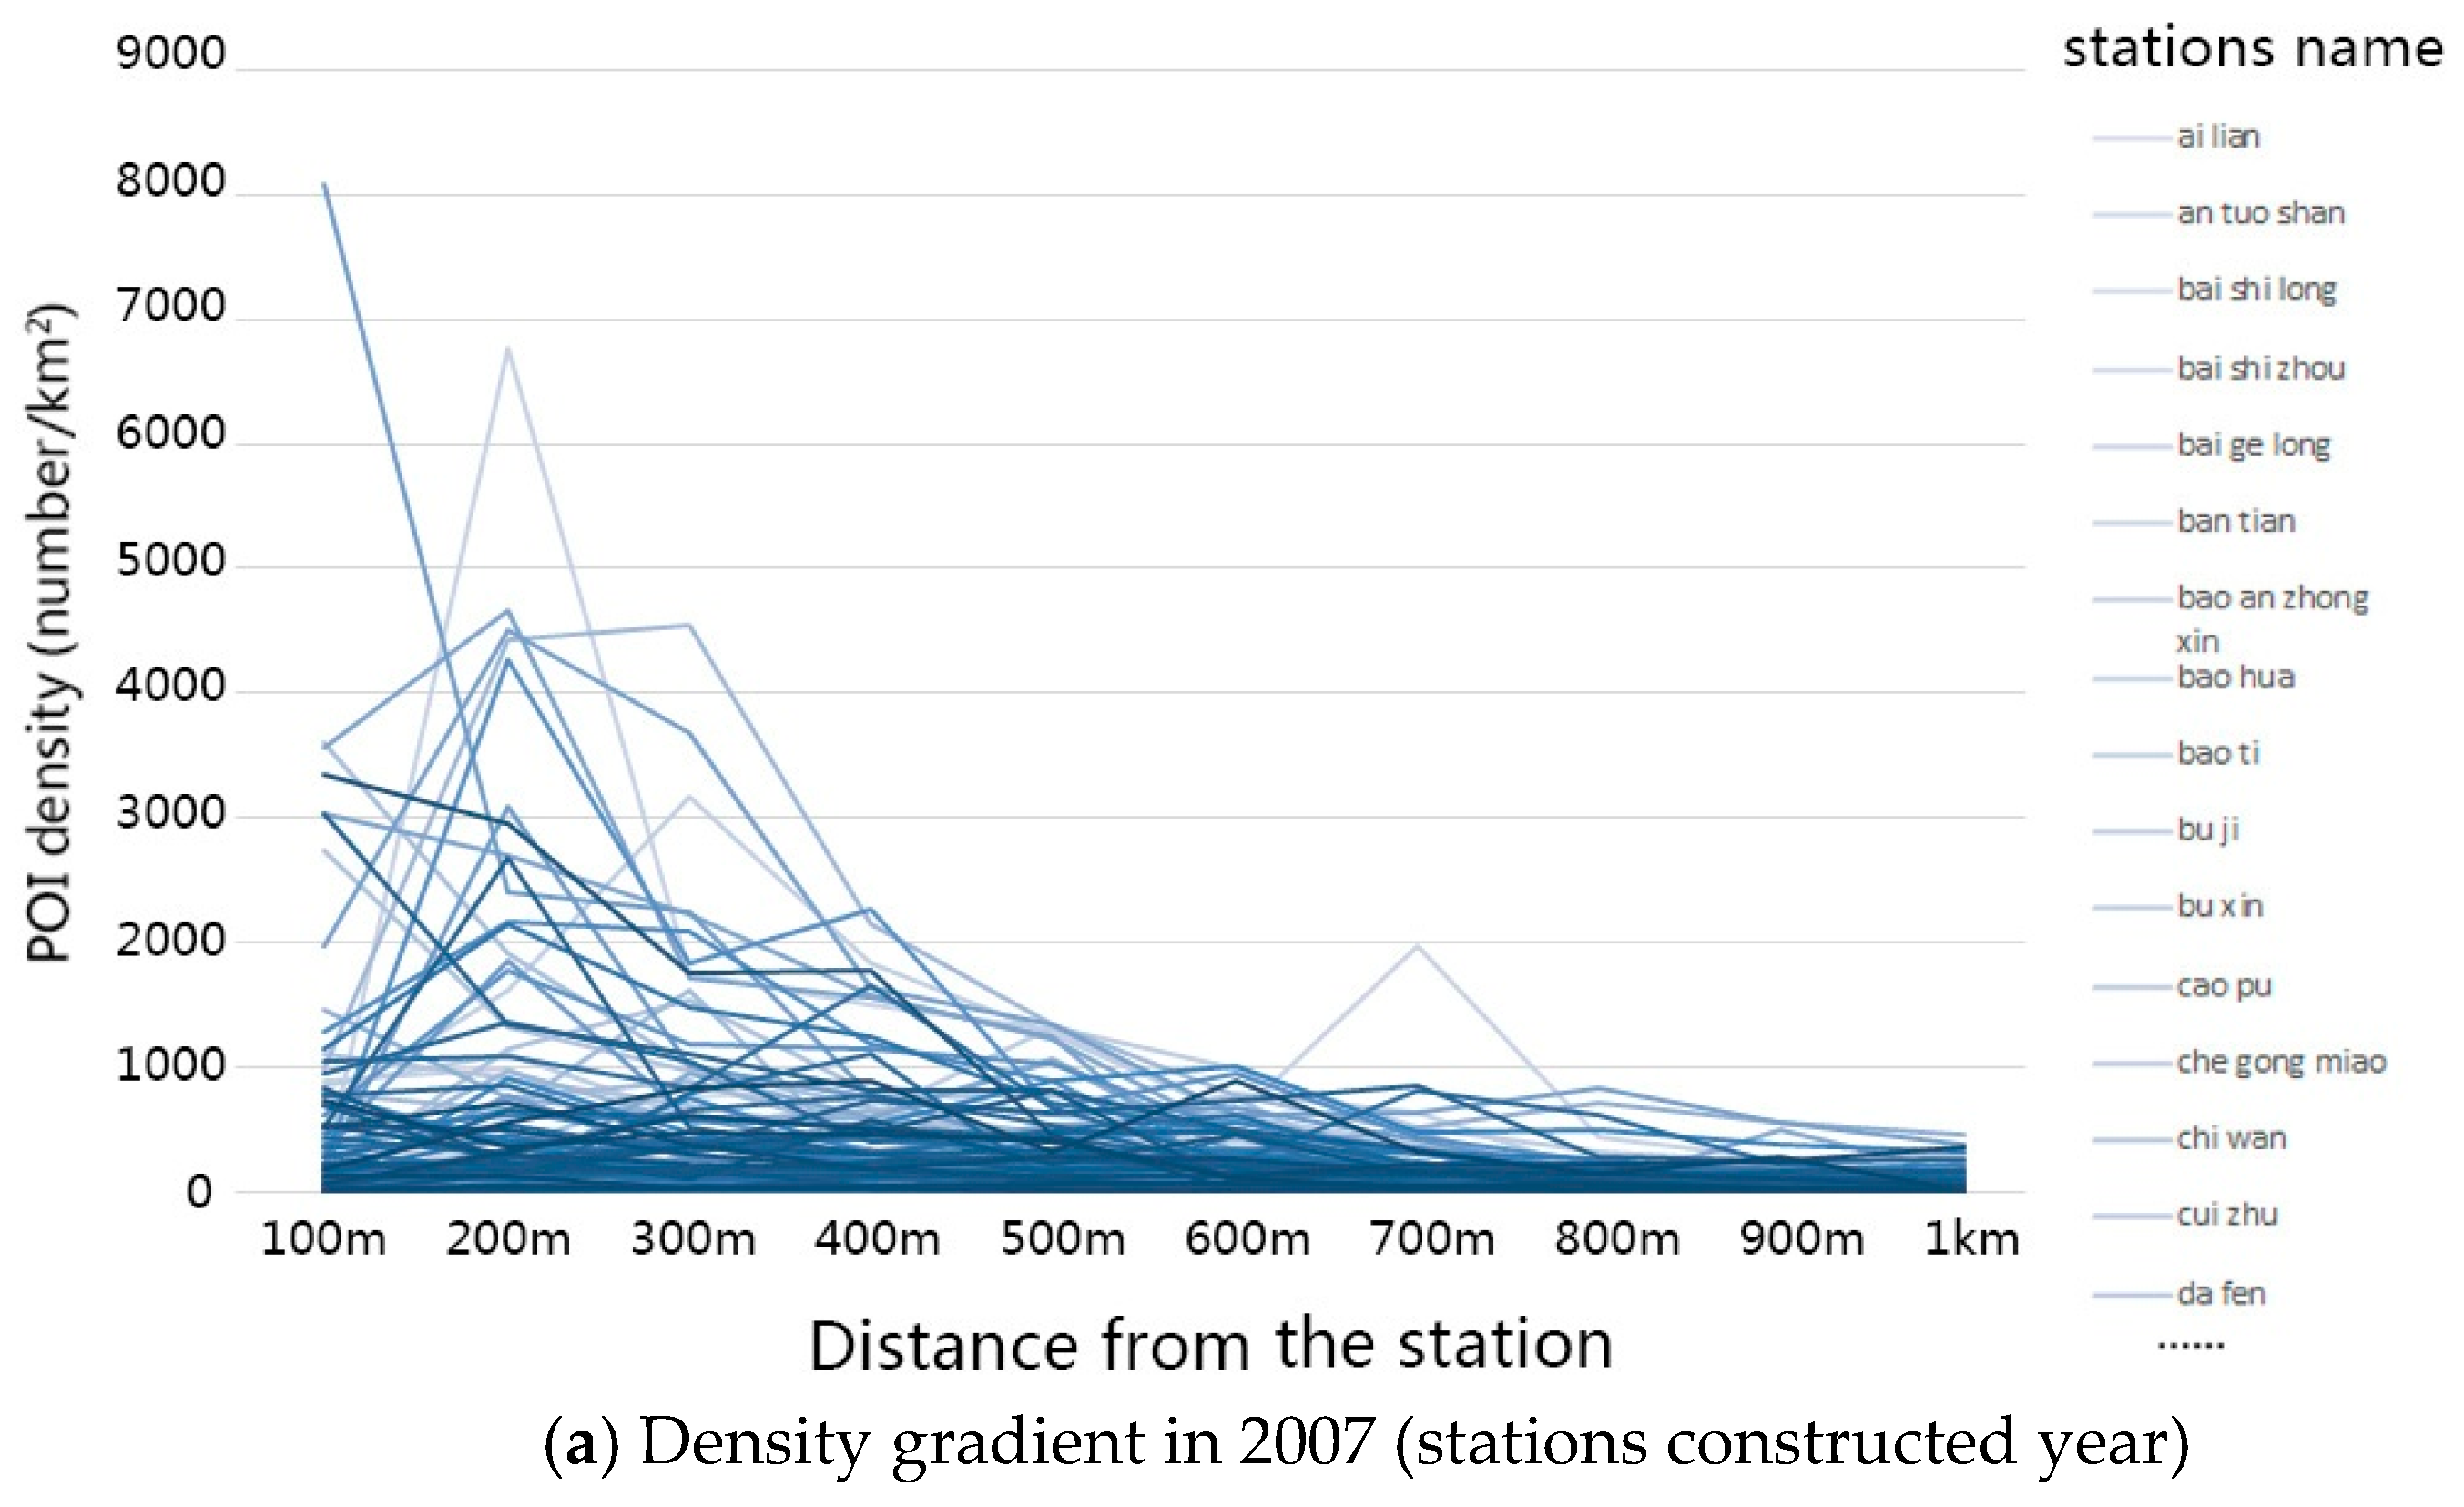
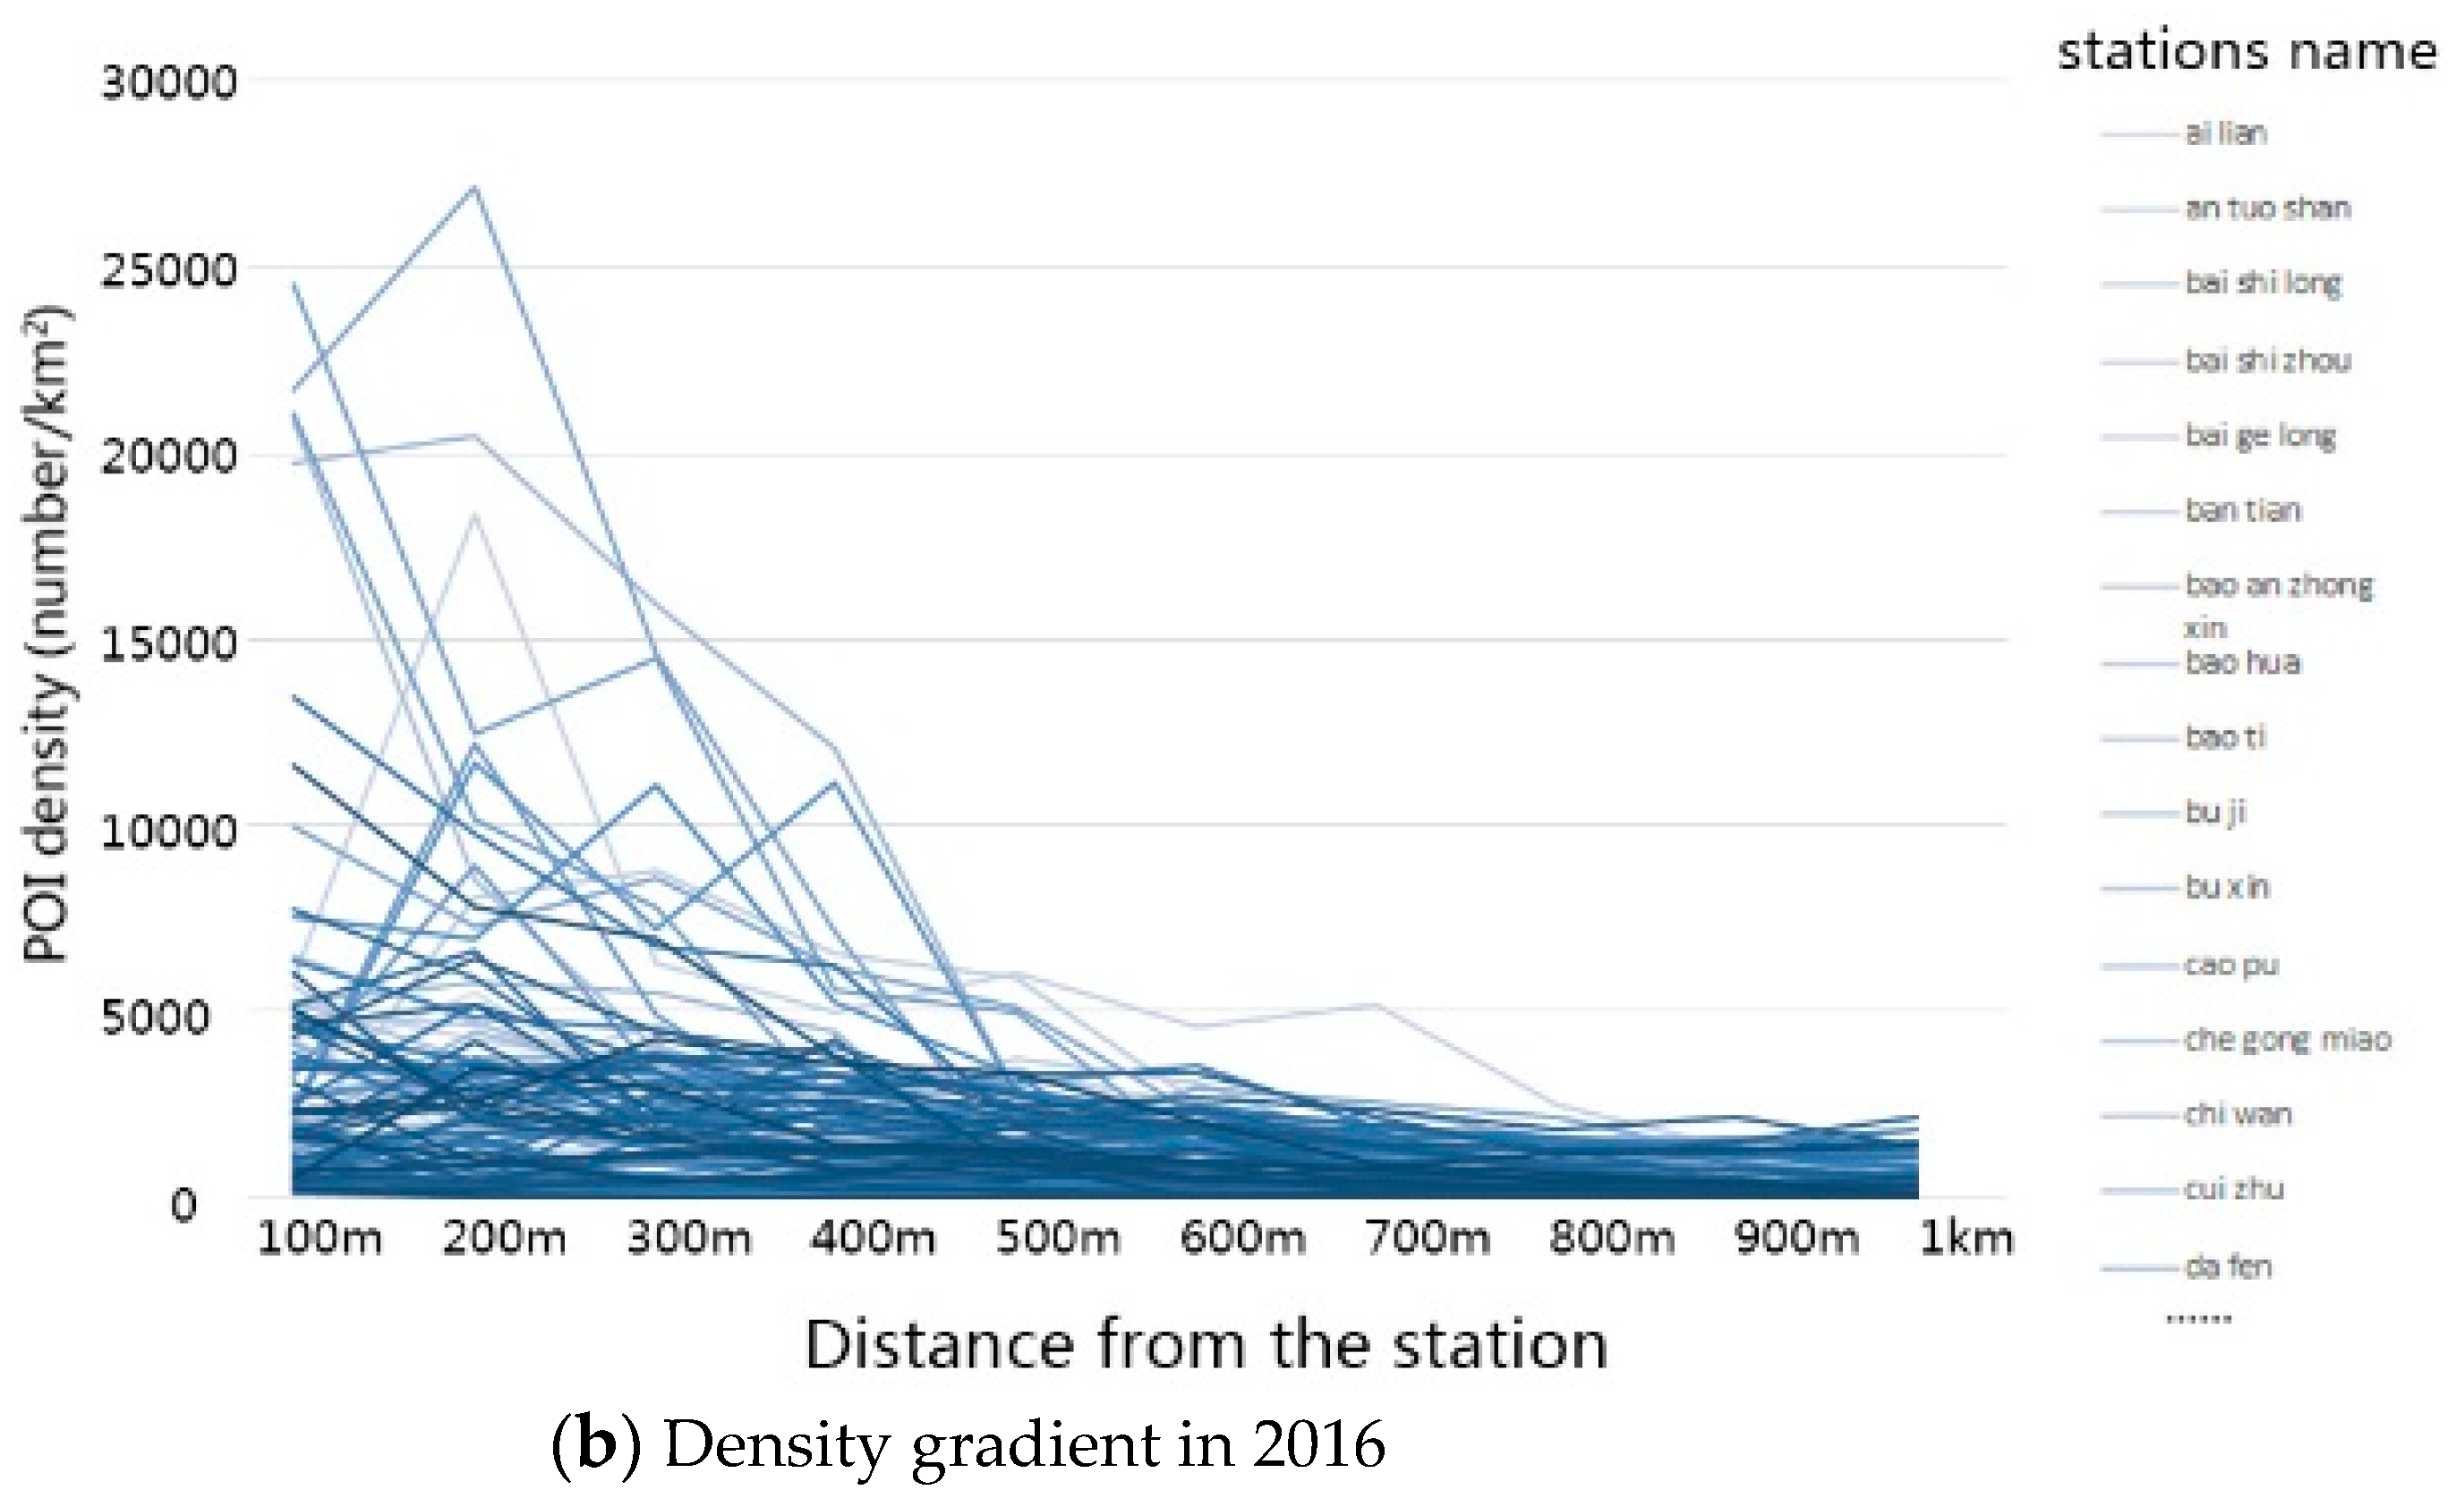
It conducted an analysis for the two select years of 2007 and 2016 in Shenzhen (Figure 4). The fitting results between the two given years are shown in Table 2. In 2007, the POI distribution around six stations did not fit the exponential function, but in 2016 the POI distribution around all the stations could be successfully fitted to the curve, meaning that facilities distribution became more like the exponential trend after the construction of a TOD station. The average value of ‘a’ in 2016 is higher than that in 2007, which means that the core density is greater after a station has been constructed. The average ‘b’ value changed from a positive number to a negative number, which means that the density variation showed an upward trend in 2007 and a downward one in 2016. The adjusted R2 increased, which means that the exponential equation fitted better in 2016. Therefore, it indicates a conclusion that the TOD strategy has the potential to shape urban form and to guide land use patterns. The density distribution eventually grew to fit the exponential trend over time.
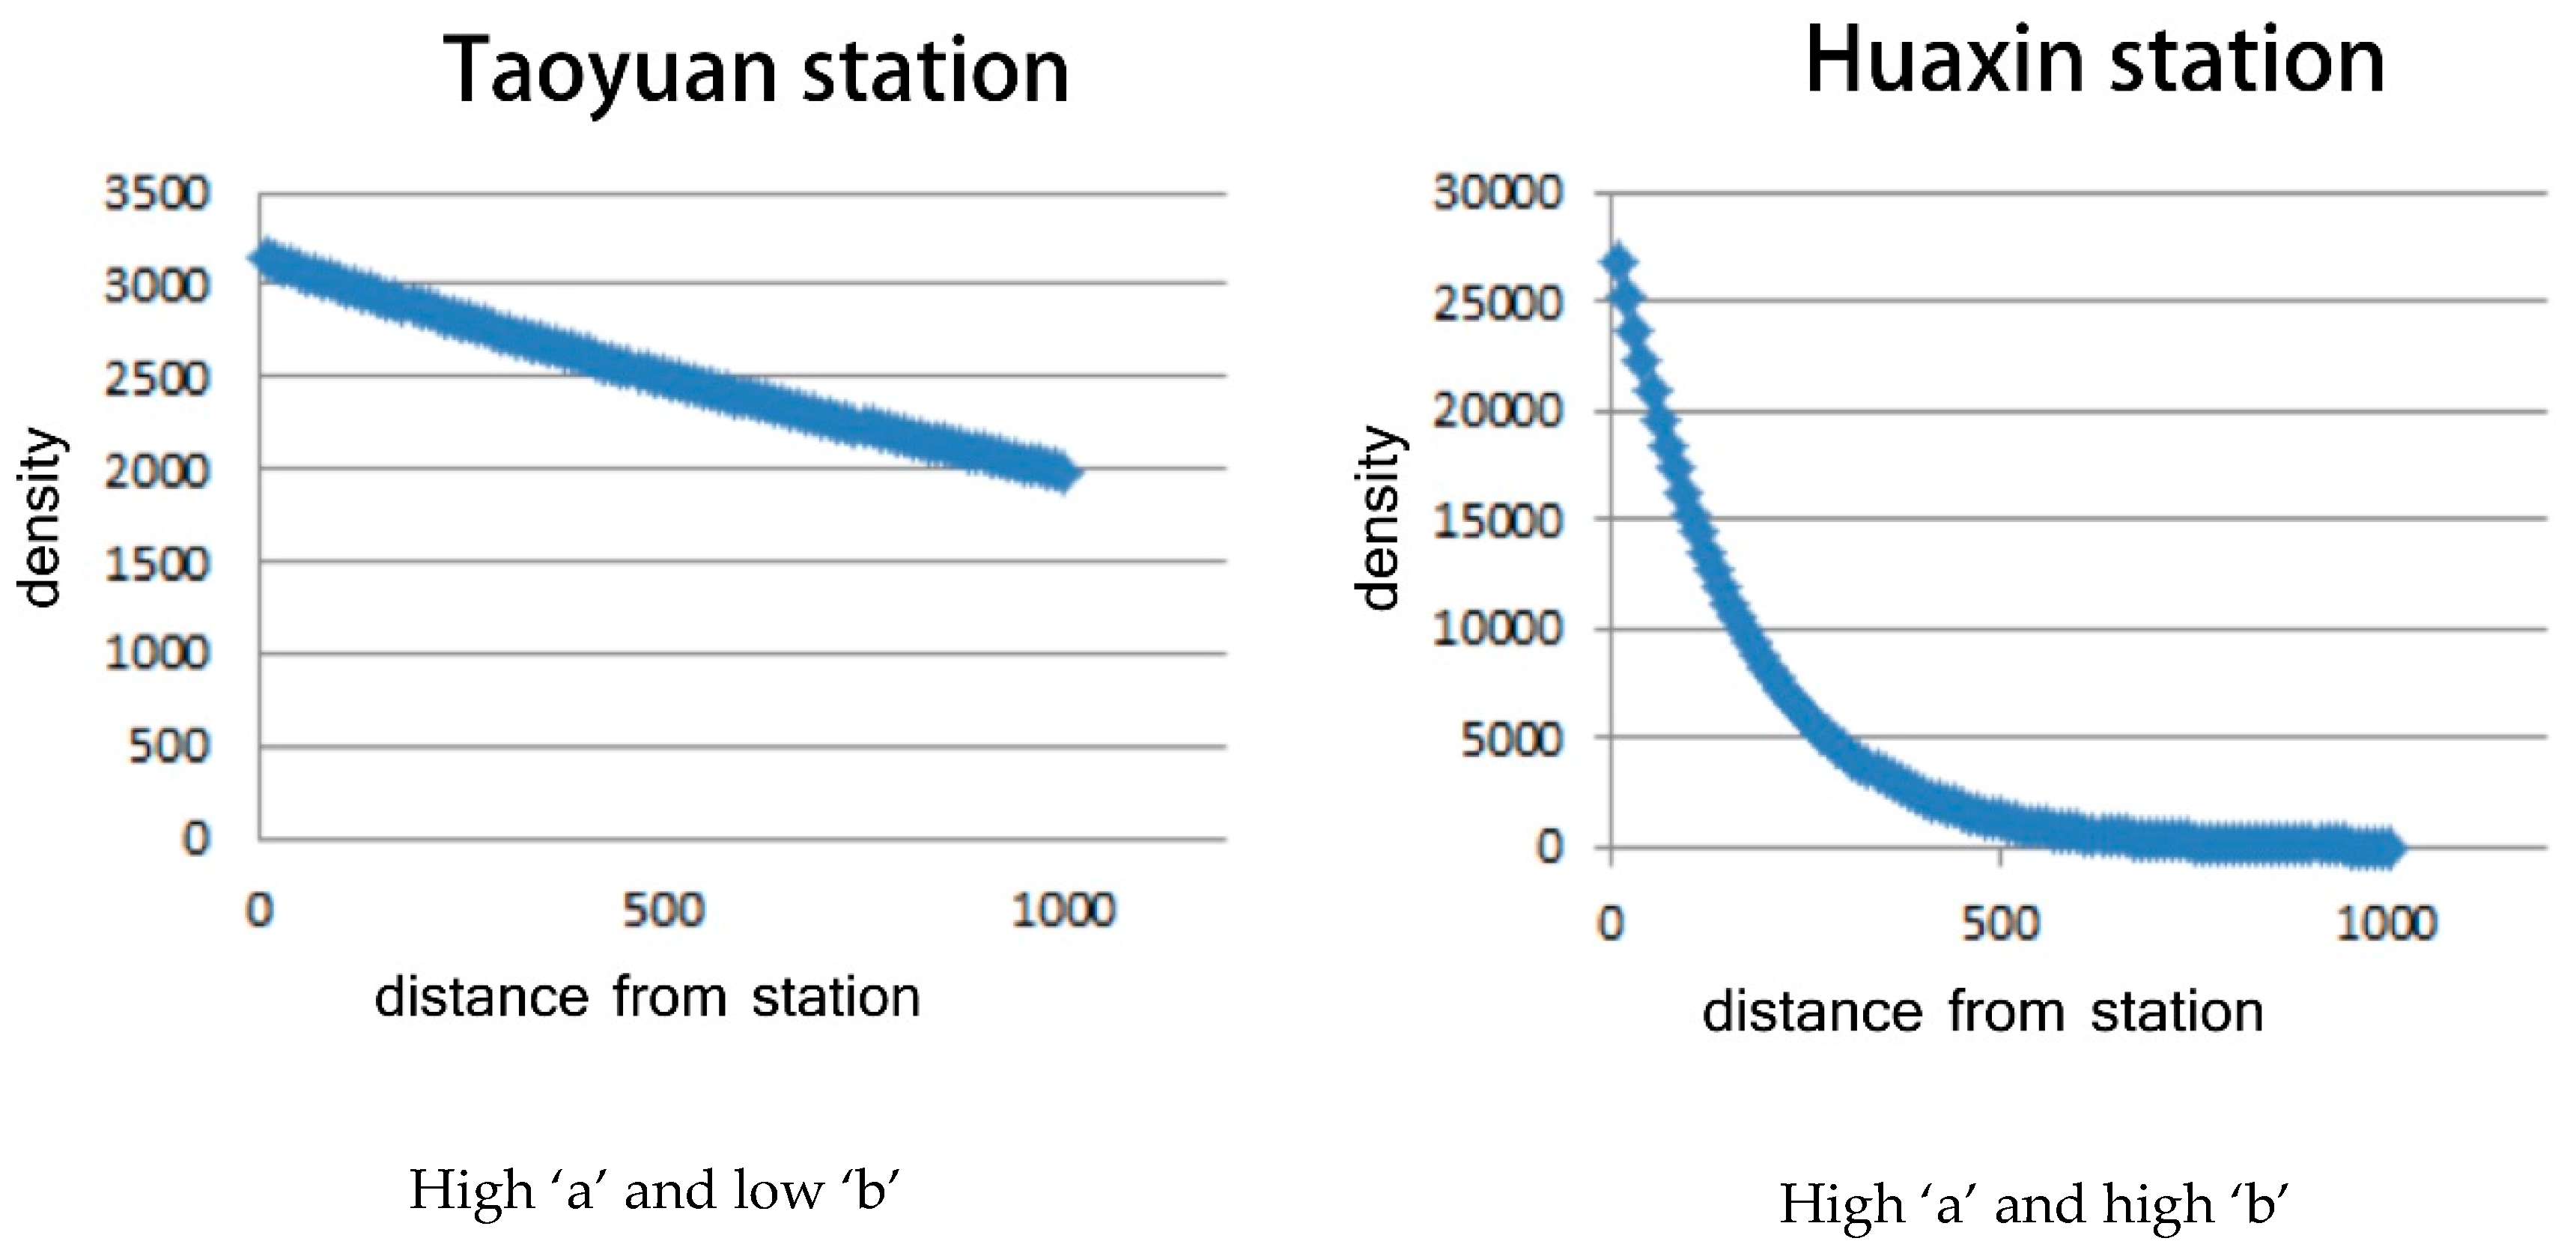
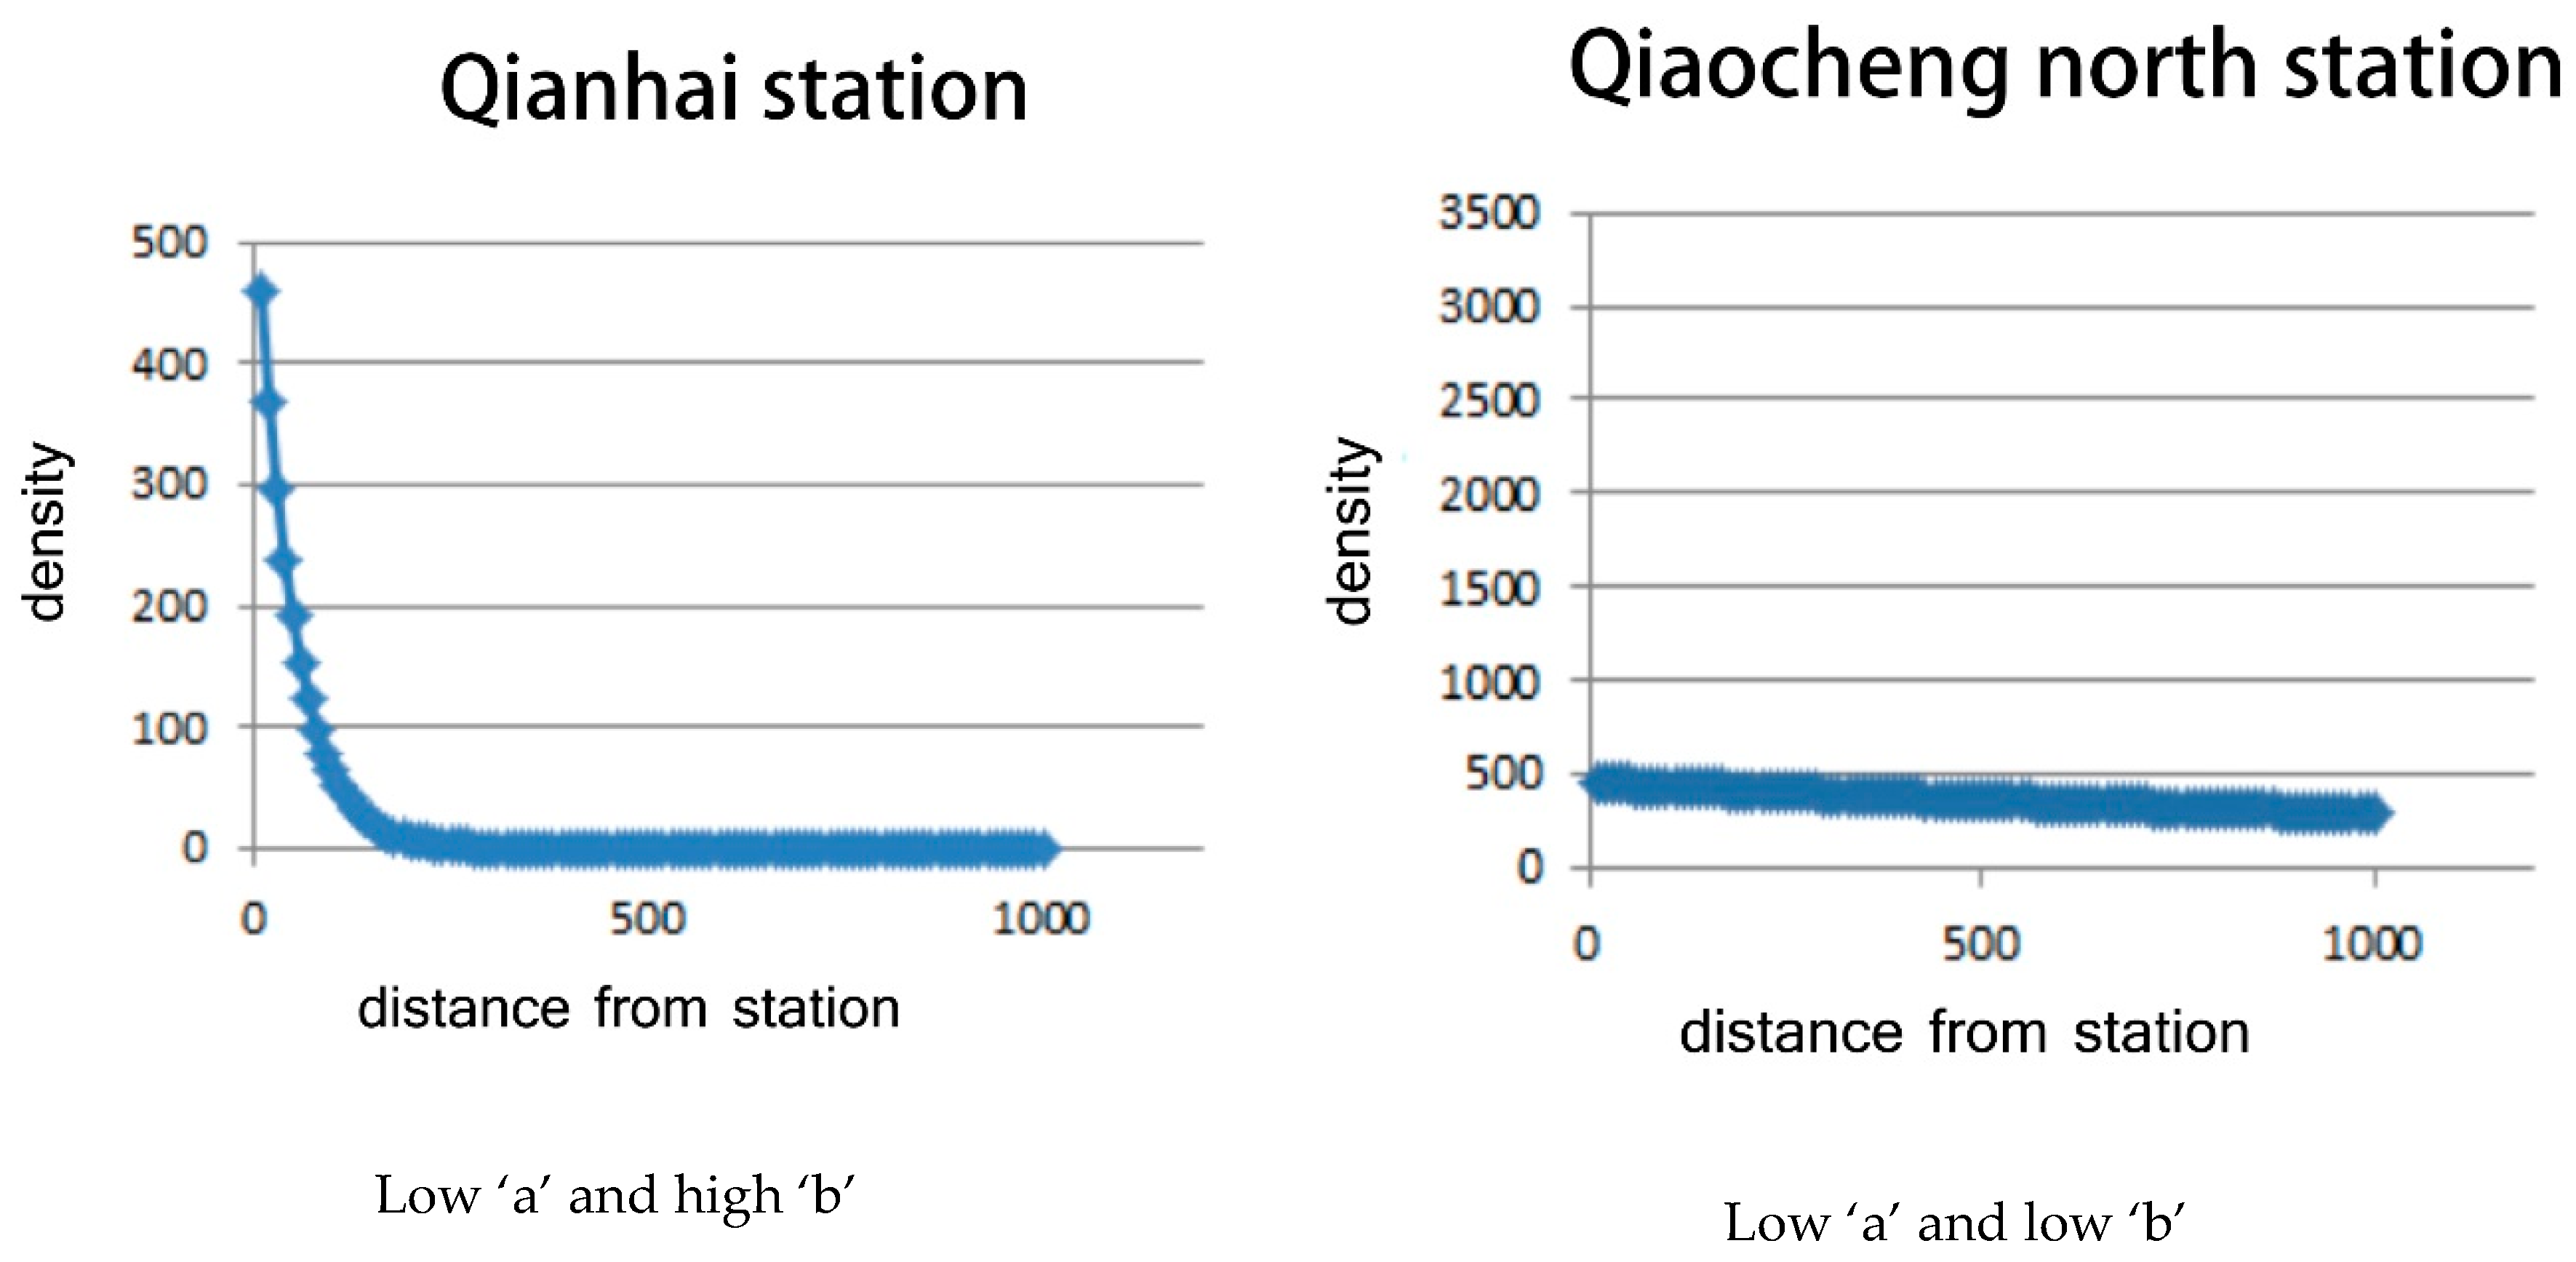
Figure 5 shows four typical stations. With the calculated values of ‘a’ and ‘b’, differences in density distribution can be identified. High ‘a’ values mean stations have a wide scope of influence. Higher ‘b’ values represent a more compact station area. Based on the TOD concept, a LCA in terms of both high compactness and relative extensiveness is recommended. Therefore, the policies should be aimed at both high ‘a’ and ‘b’ values.
2.4. Factors Influencing TOD Land Use
Under the similar construction of transit stations, the land use of each station transformed differently. Higgins et al. [37] summarised six factors affecting land use with rapid transit, which including accessibility, complementary planning, growth demand, available land, and social and physical conditions. Among those factors, the improvement of accessibility brought by transit stations lies at the heart of urban areas.
The interaction between accessibility and land use has attracted the most considerable attention. Previous studies have confirmed that the transport planning affects land use development, and the land use condition affect transit accessibility, people’s ability to reach desired services and travel activity [38,39]. More specifically, changes of accessibility and transportation infrastructure are likely to influence the attractiveness of a location, and further impact land use, human activities, property value, then converse impact the provision of transportation infrastructure [40]. However, accessibility is often illustrated differently because of multiple study dimensions, such as destinations, travel distance and transit services. Thus, a comprehensive measurement of accessibility is required.
Land use is a significant aspect of accessibility measurement and also the key to urban environment design [41]. It is both a result and cause that could impact accessibility. Enrica et al. [42] explored the facility-based accessibility by jobs and inhabitants and conducted a comparison study in urban areas. Other studies have mentioned the supportive land use features rather than accessibility. Some research has ascertained that the TOD construction can stimulate the spatial development near the stations. Tan et al. [43] found a significant land use growth rate in the suburban city area within 1km of metro station areas in Guangzhou, China. Distance to CBD, vacant land around the station, and the transit facilities have significant effects. Ratner et al. [44] investigated the floorage around 0.5 mile areas of Denver Regional railway stations from 1997 to 2012. They claimed that all development in transit-served locations had a dense effect on land use. Areas close to downtown, especially those in the central corridor, had the most TOD activity.
Conventional wisdom argues that there is no significant impact of railway station on land use. Cervero et al. [45] and Hurst [46] asserted that the railway transit system has not been able to induce large-scale land use change within the corridor. The land use change has largely been localised limited to urban downtown and a few suburban stations far from the CBD. Bhattacharjee et al. [47], also in Denver, compared the change trends of total square footage of different buildings and land use density around the rail transit system within and outside of 0.5 mile corridors. By using statistical significance tests on data from 2000 to 2010, they showed that the land use growth rate between internal and external corridors was not significantly different. Only commercial and multifamily residential land uses had grown rapidly. Pacheco-Raguz [40] deemed that the limited impacts may be a consequence of good accessibility before TOD.
Based on this, the research focus has been updated and restricted on the various types of accessibility, especially from before stations construction. Table 3 summarises the explanatory variables involved in these studies. It shows that the most frequently recurring variables are facilities-based and proximity-based accessibility.
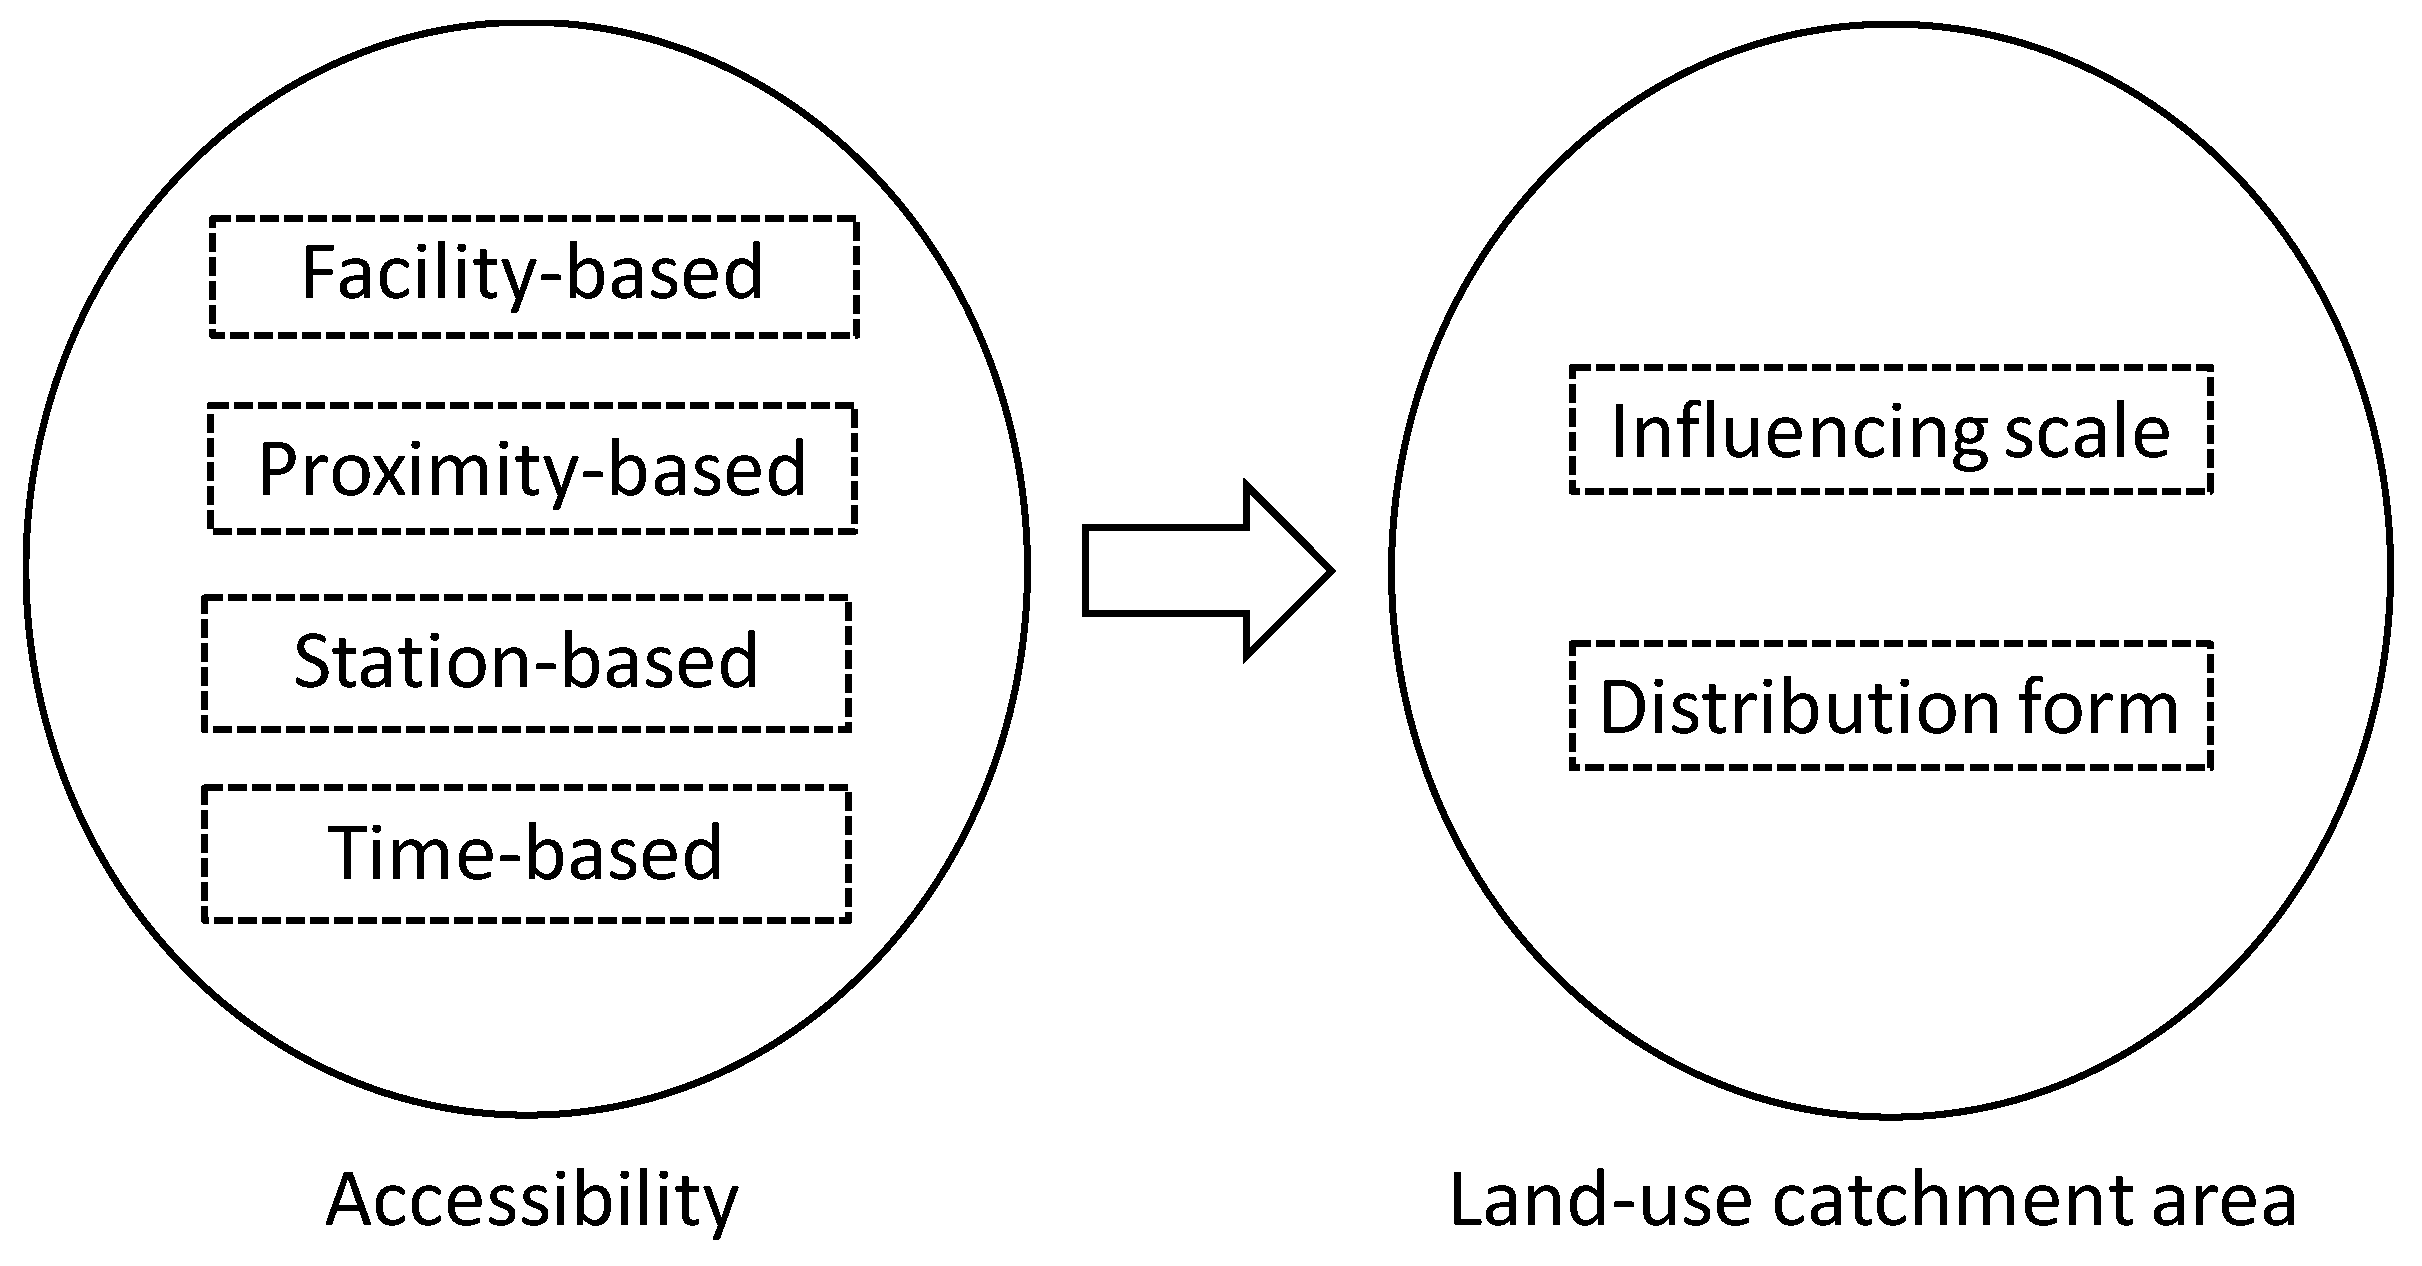
According to the research focus which is physical environments, the human-based variables have been excluded and the variables relating to the station-based accessibility have been augmented. According to Zhao [48] and Sung [3,49], station-based factors such as the station type (elevated/underground stations), the number of entrances/exits and the station hierarchy level (downtown/regional stations) could determine the land use pattern and the railway service coverage. Therefore, these indicators have been examined in a new category. Figure 6 provides a conceptual framework based on the above discussion.
3. Method and Data Preprocessing
3.1. Technical Route
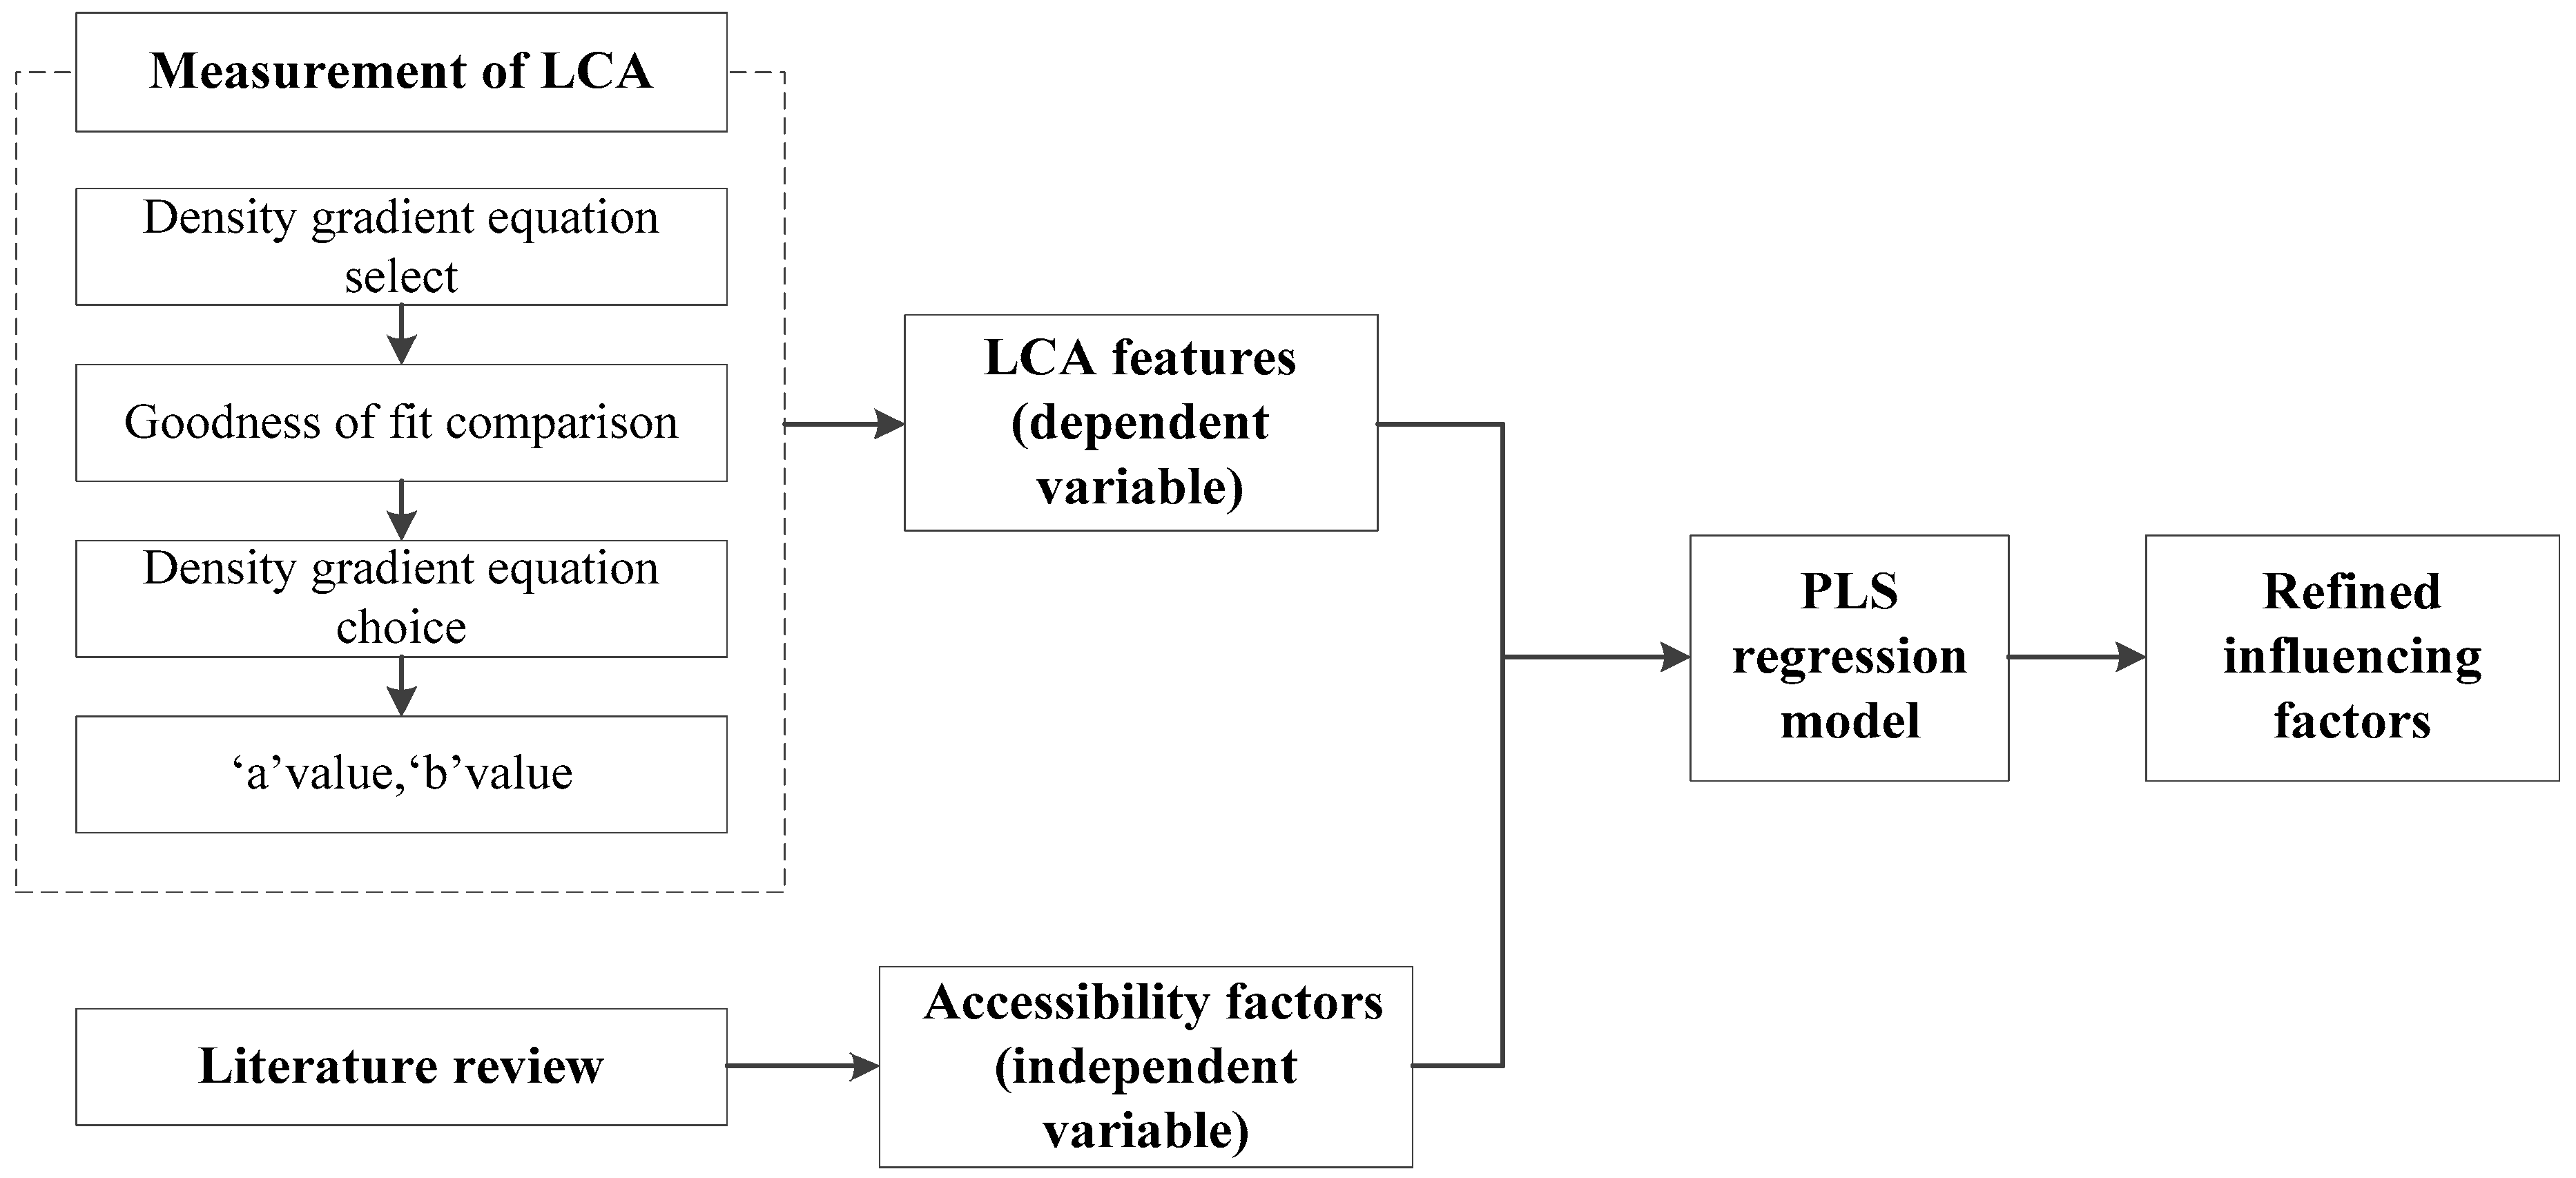
The overall research design and technical processes of this study, has been shown in Figure 7 as follows. (1) TOD LCA features are calculated using the density gradient equation. (2) A literature review was conducted in relation to the selected potential transformation impact factors. (3) Using a PLS regression model, the significance and signs (plus or minus) of these factors are identified and discussed.
3.2. Study Area
To explain this proposed concept, the TOD stations of Shenzhen, China were studied. The reason Shenzhen was selected as the case study is that its environment underwent an enormous transformation over the course of Reform and Open-up boom. During this period, the city has almost been fully developed. The population surged from 332,900 in 1980 to 11.9 million in 2016 [52]. The TOD strategy was introduced as the main approach in 2000, guiding the city from “car-based development” to “metrorail-based development”, leading to the rapid expansion of the inner city. Shenzhen’s metro system has been one of the fastest growing railway systems in China over the last decade. By June 2016, its overall track length was 178 km and its total investment was equivalent to US$13.1 billion. The guidelines and design factors used to shape the urban railway all came from the TOD concept of western countries. The extensive application of TOD has guided the urban transformation over a very short period.
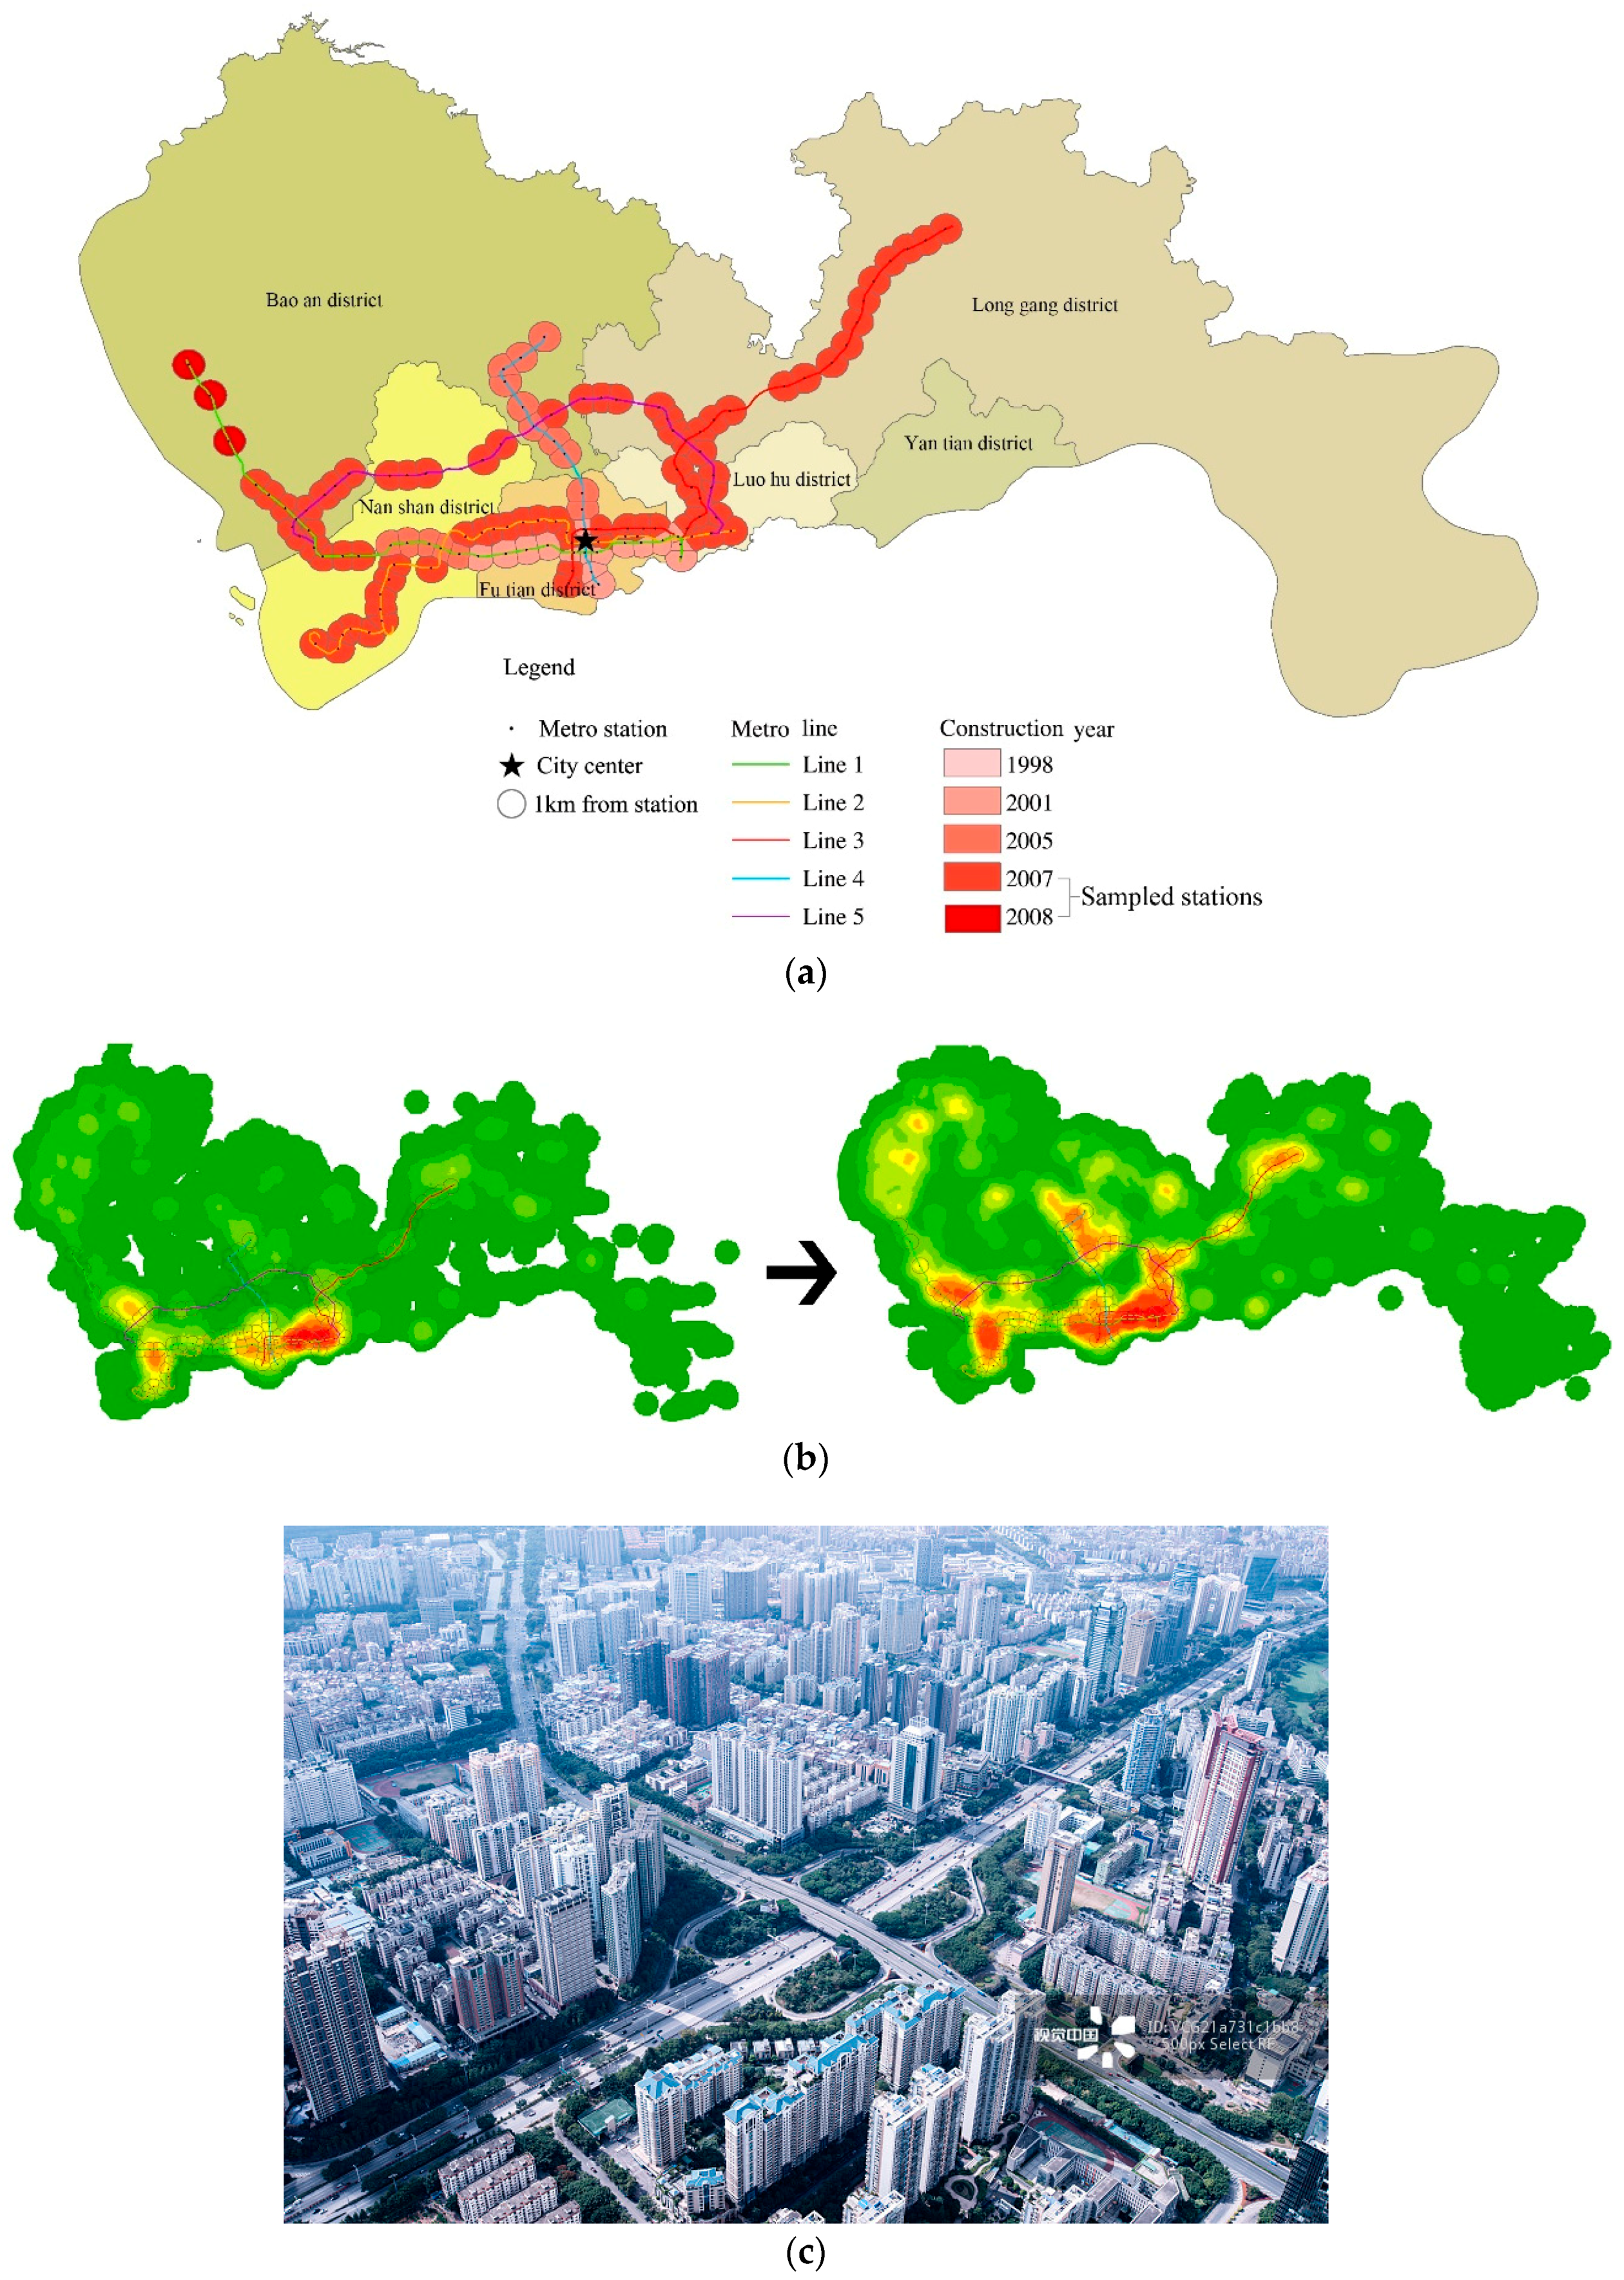
Figure 8 shows Shenzhen TOD circumstance. All the metro lines in 2016 and facilities’ (POI) densities in 2007 and 2016 in Shenzhen. The target group included 86 stations across four of these lines. The stations in line 4 have been excluded because they were constructed before 2005. The comparison to the right of the figure uses POI density to show land use before and after TOD construction. There has been a significant amount of new construction along the railway lines—from 95,481 to 504,254 POIs within a 1km area. The visual representation divides POI densities into nine categories, using the Jenks natural breaks classification method. After ten years of transformation, now the land areas and populations around the stations can now be considered relatively stable and mature.
3.3. Data Preprocessing
The interpretation of TOD land use catchment area is more localised, focusing on the single station characteristics. Accordingly, the point-of-interest (POI) data has been used to describe the land use. Although existing studies on land use factors often choose variables such as land area, building area and plot ratios—factors that might be labelled as ‘traditional’—these factors are not the real reasons that people are attracted to an area or encouraged to stay. A high proportion of business or commercial land use area does not necessarily mean that an urban area has a good level of facilities and activities (for example, economically depressed business areas and incomplete construction zones are unattractive features). POI data can accurately describe the changing use of space over time because they are updated more frequently than are official surveying and mapping data. Hence, in this paper, the basic data relating to land use characteristics are from the open-source platforms namely Gaode map (http://ditu.amap.com/) and street network data mined from OpenStreetMap (https://www.openstreetmap.org/), which are considered as two the highest coverage map databases. For avoiding the data scarcity, POI data in 2007 has been validated by comparing with Shenzhen Land Use Survey (2009).
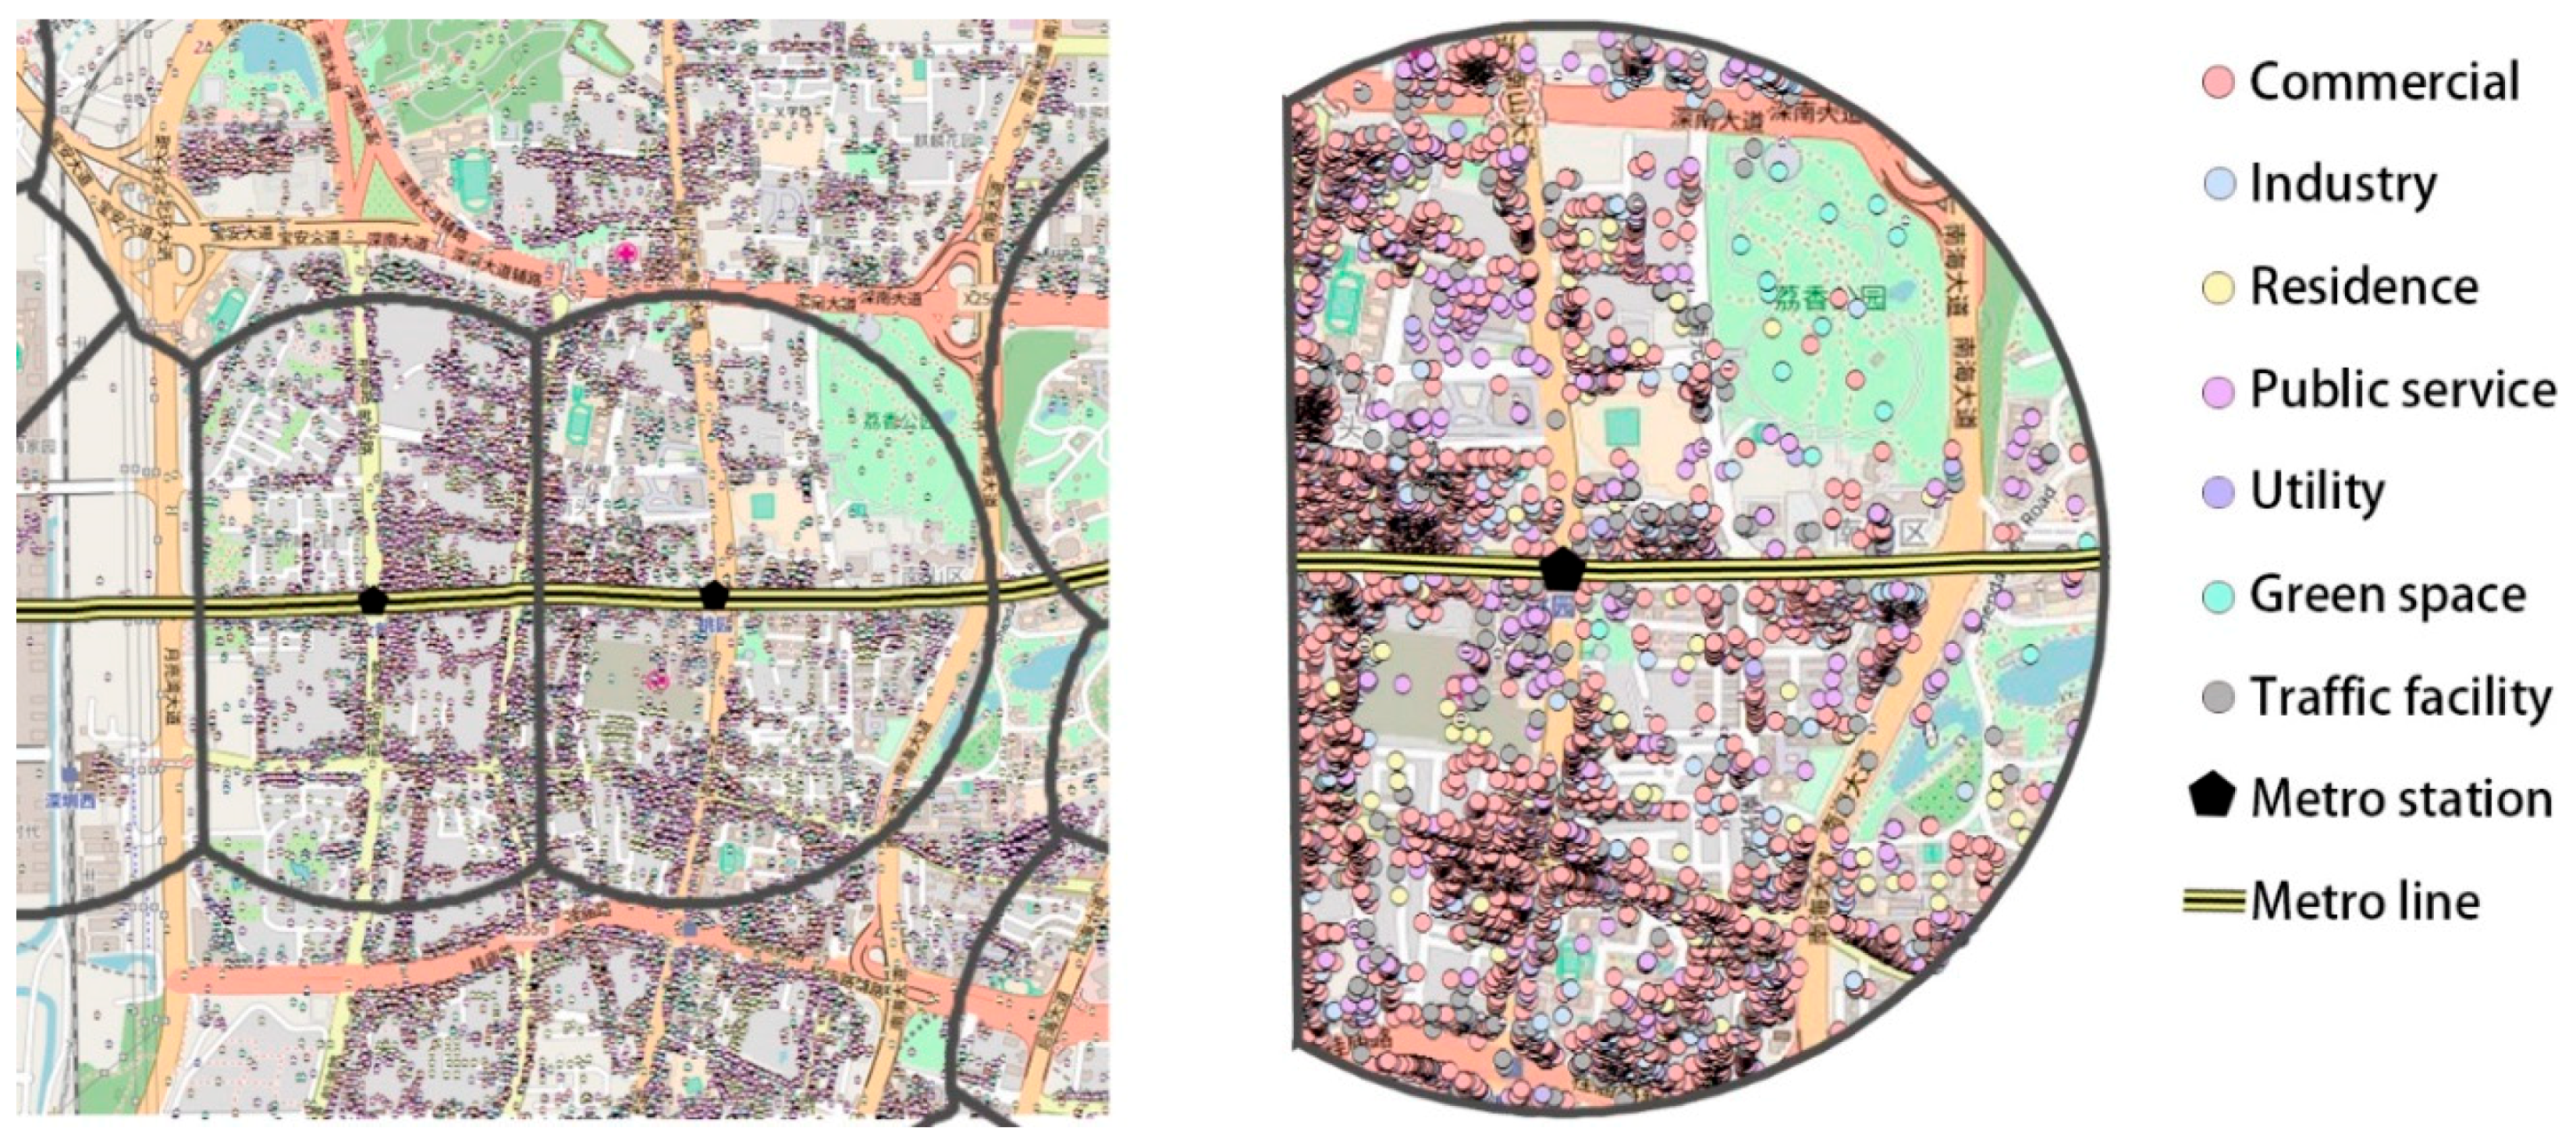
In the Gaode map database, there are 219 subcategories of 22 primary categories. These data have been reclassified following the Chinese Standard of Urban Land Classification for Construction and Urban Planning (Table 4). A sample of POI distribution can be found in Figure 9. To regulate the size of POI data, the large-scale facilities have been cleaned up. For example, the shopping mall may have many stores that are all tagged in the data. So the large facility that labeled shopping mall has been cleaned up and the small facilities that labeled brand stores have been reserved. Therefore, the number of POI is a major consideration. To determine when the main impact of railway line construction could be expected to occur [54], the station’s construction year, 2007, has been selected as the beginning of the timeline. The data in 2007 and 2016 have been examined in order to gauge the TOD project’s impact.
3.4. Methodology
In this step, the paper aims to explore the reason that different areas show different responses to TOD construction, and, consequently, to determine how accessibility impacts on land use. In a pilot study, the correlation analysis between independent variables has been performed. It is assumed that facilities factors have multicollinearity between them because the hardly change of land functions [43]. Thus, the partial least squares (PLS) regression model has been chosen to avoid collinearity. The PLS model is a predictive technique that provides an alternative to ordinary least squares (OLS) regression, canonical correlation, and structural equation modeling. It can accommodate multiple dependent and independent variables simultaneously and is particularly useful when predictor variables are highly correlated.
In Model 1, it established ‘a’ value—the scale of the TOD—as the dependent variable. Meanwhile, the dependent variable in Model 2 was the ‘b’ value, which represents the compactness of the form. The independent variables considered were the same in Models 1 and 2 and are shown in Table 5 below. It anticipates that change, both in terms of scale (the ‘a’ value) and the level of compactness (the ‘b’ value), will be influenced by the independent variables listed below. The null hypothesis, therefore, was that explanation variables have no effect on land use features around stations.
The block size in the Shenzhen metropolitan area is 200 m (Shenzhen Urban Planning Guidelines, 2014); therefore, this study established 200 m as a key unit, separating the area surrounding TOD stations into five zones: 0–200 m, 200–400 m, 400–600 m, 600–800 m, and 800 m-1 km areas. By using the number of POIs within a certain range around each station, land use indices can be calculated.
3.5. Results
3.5.1. Results of the Density Gradient Measurement
Table 6 shows the statistical description of the LCA characteristics and goodness of fit results. It can be seen that the maximum and minimum values differ greatly. This means that, although the recommended CA is around 10 min’ walking time (800 m), the actual extent of LCAs around individual stations varies significantly. Because of the different hierarchical positions of the station and land use characteristics, the setting of unified standards is not appropriate.
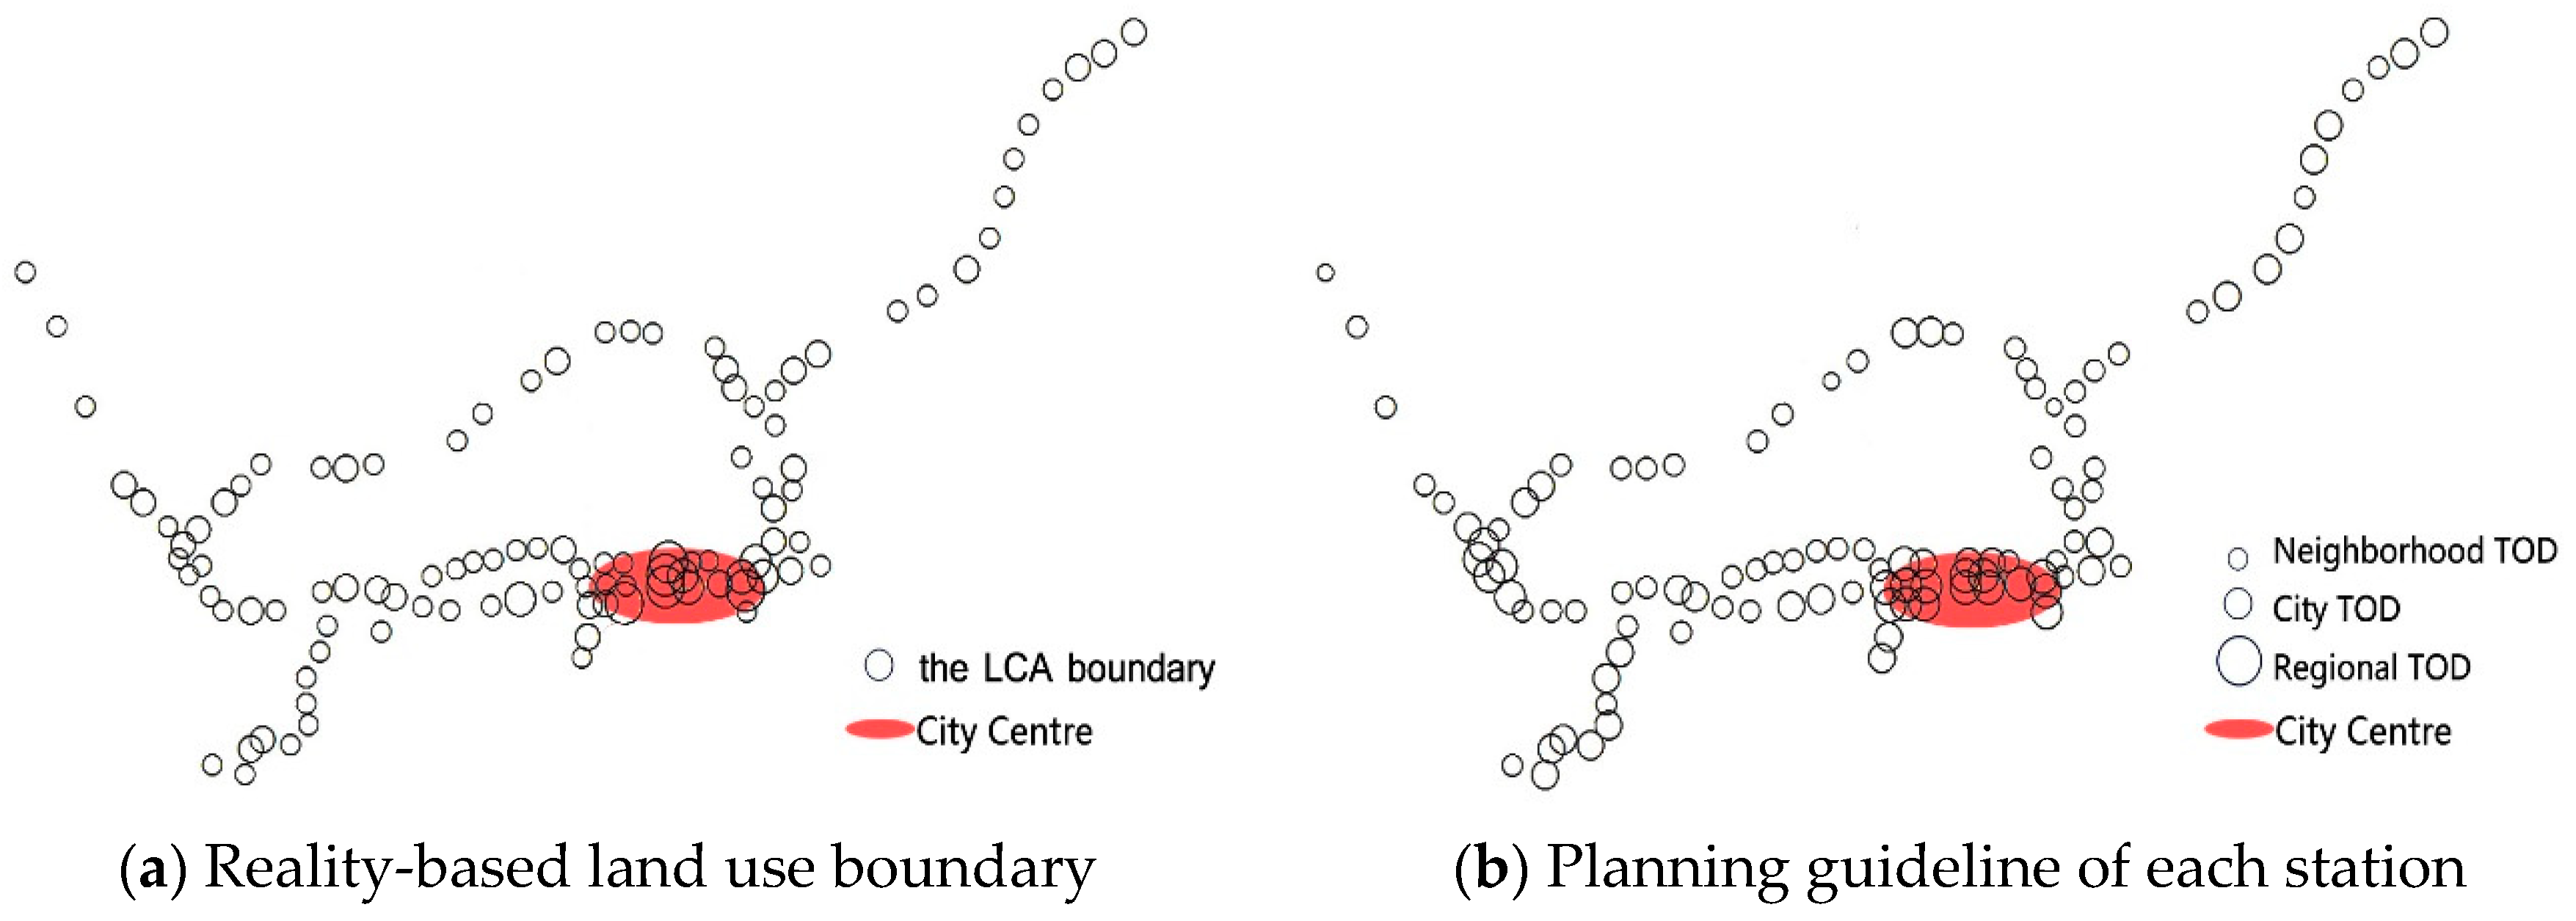
The Shenzhen planning guideline has been compared to verify the results. Based on the first derivative value of each exponential equation, the inflection scope of each station can be calculated. The derivative value that equal to minus one (the slope of a curve is 45 degrees) was used as the demarcation line and considered as the LCA boundary. After displaying the boundary value in GIS, it can be seen in Figure 10 that the location of the city centre from this method can match with the planning guideline. The bigger the circle, the higher the hierarchical level of the station. The overall results are very similar with the planning guideline of Shenzhen government.
A statistical analysis of adjusted R2 reveals a mean value of around 0.5, which means that half of the density coordinates lie on the theoretical curve. The adjusted R2 values in more than 40% of stations are over 0.7 (n = 38/86) and in more than 50% of stations they are over 0.5 (n = 48/86). This shows that the degree of fit is high among half of the stations examined.
There were two main reasons for a lower degree of fitness. The first reason is that the station was located in an old settlement in which has a mature activities centre before the TOD construction. For example, at Taoyuan Station, the nearby Shenzhen University had already been established as a regional centre before the TOD station was constructed. Thus, after construction, it was difficult to transform and integrate it with the new station. The other reason for a low degree of fit is that a small number of TOD construction were still incomplete. For example, around stations such as Tanglang and Houhai—although TOD has been built and operated for years—weak building programmes and over-ambitious planning targets have resulted in a surrounding area that is still under construction and, as a consequence, has not yet formed a developed TOD community.
The result has shown that this proposed new measurement of LCA of individual TOD stations is more fine-grained. It can identify the location of regional centres and match with planning guidelines, which proves the reliability of this new measurement method. Furthermore, this approach can better reflect each station in real situations. The characteristics of scale and form can help to identify TOD typologies from a land use perspective, which compared to planning guidelines, is more applicable in recognising developed or undeveloped stations.
3.5.2. Results of the PLS Regression Model
The results of the PLS regression analyses are shown in Table 7. They represent the contribution of each predictor in each model. For avoiding error propagation, the stations with the low goodness of fit (Adj. R2 is lower than 0.5) are deleted. Finally, a total of 48 stations were taken as samples. Variable importance in projection (VIP) values above 1.0 and 0.8 are considered to indicate a significant important variable and important variables, respectively [55,56]. By comparing VIP values, the importance of different independent variables can be assessed. The Weight value measures the positive or negative contribution. A negative value of weight variable contributes to the smallness of the station area and to a sprawling form. The Adj. R2 of PLS regression analysis is 0.84 in model 1 and 0.71 in model 2.
From Table 7, it can be seen that the significant factors that associated with LCA came from facilities both before and after station construction. Among the three physical environmental factors, facilities-based accessibility is the most important, while variables relating to proximity and station accessibility only related with LCA to a certain extent. Around 71.6% of facility factors show an important correlation (where the VIP value is greater than 0.8, which are marked in bold) and 55% of facility factors show a significant correlation (where the VIP value is greater than 1.0, which are marked bold and underlined) with TOD scale and compactness degree.
Most of the variables relating to facilities have a significant correlativity with TOD scale and form. The job-population balance factor before station construction had the most obvious interaction. The strongest correlation in both Model 1 (Scale of TOD) and Model 2 (Compactness of TOD) both comes from this variable. The transit and commercial facilities factor had less interaction. They limited related to the scale but highly related to the compactness.
In terms of proximity-based accessibility, metro departure frequencies had the most noteworthy correlation with LCA form, while distance from the main road and CBD had an important relationship with LCA scale. All three factors show negative correlation. This indicates that the nearer the station is to a main road and CBD, and the more important the station is, the bigger and more compact the form of the station’s LCA would be. The number of transit lines was weakly related to LCA.
With regard to station-based variables, the station’s position in the hierarchy has a noticeable positive correlation with LCA, while the aboveground station shows a positive correlation only with the influencing scale.
4. Discussion
4.1. Stations Grew to Fit the Exponential Curve Trend
In order to understand the fitting goodness of the density curve, the correlation analysis has been shown in Table 8. In the correlation test, the ‘a’ value and the ‘b’ value have no significant relationship, while the goodness of fit of the density gradient curve is both significantly positive related with both the ‘a’ and ‘b’ value.
The correlation result reveals that LCAs with a large size and compact land use pattern tend to be exponentially distributed. It follows the same rule of facilities distribution in a city scale area, indicating greater increase of facilities density in the areas adjacent to the station than in those further from it. This is also consistent with the population density and land value distribution in a city scale [29,32], further proving the Tobler’s first law of geography [57] which stated near things were more related than geographically distant things. When considering a large scale LCA (high ‘a’ value) as a mature place, the more facilities the space contains, the more probability that the facilities aggregate close to the station. In Shenzhen, most of the large scale and compact LCAs are located in the old settlements. This is because the older areas have been fully developed. Although with the same time of station construction, it contains numerous buildings and facilities around the station area than newly constructed areas. Thus, it is easier to form a large place with the railway construction in those areas.
However, in turn, the scale of LCA cannot be estimated according to the fitting degree of facilities’ exponential distribution. Based on the specifical inspection of each station, some stations with few facilities can also fit the exponent distribution curve, for example, the Qianhai station has only a few facilities and they are all situated near the station entrance. Although the compact level and exponential distribution is high, the influencing scale of such stations is small.
4.2. Land Function Is a Key Element in Determining LCA
From the findings shown in Table 7, the impacts of 2016 facilities are certainly significant to the LCA, however, it can be as a comparison group. It is clear that most of the land functional factors, especially those existed before a station construction has a significant impact on the LCA. It is consistent with the central hypothesis: good accessibility before TOD construction has significantly shaped land use pattern of scale and form characteristics.
Particular attention should be to job-population balance. In almost every distance, it has the greatest impact on LCA. This effect slightly increases with distance. In relation to TOD scale and form, the overall job-population showed a positive impact. This indicates that locations with more job opportunities are the most likely to form large-scale and compact TOD areas. However, this factor no longer affected the area after the station constructed. The main causation of compactness turns to the number of transit and commercial facilities.
The role ascribed to commerce and traffic is consistent with the findings of previous studies. Tan et al. [43] found the biggest impact on similar developments in Guangzhou, China, came from transit and commercial facilities. In this study, the effect has been observed in more details. Prior commercial and transit facilities within 400 m reduce the size of LCA, while after TOD construction, these facilities increase the size of LCA within 600 m. Due to the aggregation effect of old facilities, the growth of further functions is excluded from the central 400 m area. However, with the construction of TOD, the force from governmental planning break this barrier and compulsively extend the station area. Correspondingly, the compactness of the facilities has declined. The more commercial facilities beyond 400 m and transit facilities beyond 200 m, the less compactness of a station area. This result indicates that the existing good commercial and transit accessibility in the central 400 m area can diminish the scope of a TOD’s influence. Commercial agglomeration may limit further development beyond the 400–600 m radius from the station.
4.3. Importance of Distance from Main Roads
The distance from the main roads affects the scale as much as the distance from CBD. However, the effect is a negative one, which means that the farther the station is from main roads, the larger the LCA’s scope and the more compact its form.
Many previous studies have only emphasised the distance from CBD to be an important factor [3,43]. In this study, the result found that the location of main roads also has a noticeable effect on the land use transformation of TOD, even greater than proximity to the CBD. Adjacency with or segmentation by main roads can noticeably weaken the impact of a TOD, especially in terms of LCA scale. The nearer the station is to main roads, the smaller its LCA will be. Therefore, the distance from main roads should be paid more attention in the future research.
4.4. Station Effects
The result implies that station hierarchy (whether it operates primarily at the regional, city or neighborhood area) and above ground or underground station are related to LCA. Station-based accessibility is important variables where TOD construction is concerned, but its importance is less than that of variables relating to the functional factors. An elevated station has an important impact on TOD scope. Where the station and railway are constructed above ground, and are associated with the surrounding landscape, they are able to stimulate the development of other surrounding facilities.
Overall, the study suggests that the local physical environments need to be more carefully considered in TOD station planning. Well-developed TOD communities are more likely to occur in areas with a certain level of infrastructure that are not yet fully developed. In order to improve the planning efficiency of these areas, planners should consider regions with high job-population ratios first, followed by those with existing commercial and transit infrastructure. In addition, maintaining a proper distance from urban main roads is also important. For stations in potential development areas, planners should also consider building the station concourse above ground to promote development and to expand the scope of the LCA.
5. Conclusions
TOD is an approach that links people, activity and traffic through transport-friendly hubs. Depending on differences in geographical background and city development, however, each station needs its own customised and pertinent planning strategy, taking into account its specific needs. The study proposed that LCA is not a fully fixed area and should not be regarded as such. Instead, the boundary should be expected to expand and be determined by the conditions and stage of development at any given point in time.
This study allows us to comprehensively understand the changes of TOD land use and the factors influencing the scale and form in relation to TOD construction. It provides not only a new method for assessing the scale and compact characteristics of LCA but, more importantly, empirical evidence of the impact of various accessibility on the land use intensity distribution. This will be useful for further study and thus enables us to propose some new methods to influence these aspects of the development of the TOD approach. This study also illustrates how new big data sources allow for a greater level of detailed analysis in the measurement of TOD.
The findings highlight the importance of accessibility prior to TOD construction. The land use scope and compactness of TOD station areas are highly related to previous facilities. Job opportunities appear to be the most important factor in the formation of a large and compact TOD station. Although previous studies have suggested that commercial factors are key, in this study the effects of these factors are not as significant as those of other variables that it considers here, such as job opportunities. This study also highlights the importance of distance from main roads and of the location of stations (in terms of their construction above or underground). Furthermore, recommendations for future planning is provided, in the hope that this empirical evidence will attract attention from those concerned with land use planning decisions around TOD stations in the future.
These results suggest some interesting directions for future research. More studies need to be conducted to confirm density gradient patterns of TOD and explore how the different patterns respond to the local environments. The effects of job-population balance, station location, and other relevant factors need to be internationally compared and justified in the future.
Author Contributions
X.T. designed the research and wrote the paper. Y.W. and E.H.W.C. supervised the process of manuscript development and supported the research funding. Q.Z. advised the quantitative methodology.
Funding
This research received grant from Shenzhen Key Laboratory of Urban Planning and Decision Making, Harbin Institute of Technology, Shenzhen and research fund support from the RISUD of Hong Kong Polytechnic University.
Acknowledgments
This study was supported by Harbin Institute of Technology, Shenzhen. The Hong Kong Polytechnic University (PolyU) also provided resource support to make this paper contribute to the first author’s dual PhD degrees study in HIT(SZ) and PolyU.
Conflicts of Interest
The authors declare no conflict of interest.
References
- Calthorpe, P. The Next American Metropolis: Ecology, Community, and the American Dream; Princeton Architectural Press: Hudson, NY, USA, 1993; ISBN 9781878271686. [Google Scholar]
- Guerra, E.; Cervero, R.; Tischler, D. Half-mile circle: Does it best represent transit station catchments? Transp. Res. Rec. 2012, 2276, 101–109. [Google Scholar] [CrossRef]
- Sung, H.; Choi, K.; Lee, S.; Cheon, S.H. Exploring the impacts of land-use by service coverage and station-level accessibility on rail transit ridership. J. Transp. Geogr. 2014, 36, 134–140. [Google Scholar] [CrossRef]
- Jun, M.J.; Choi, K.; Jeong, J.E.; Kwon, K.H.; Kim, H.J. Land-use characteristics of subway catchment areas and their influence on subway ridership in Seoul. J. Transp. Geogr. 2015, 48, 30–40. [Google Scholar] [CrossRef]
- Cervero, R.; Kang, C.D. Bus rapid transit impacts on land uses and land values in seoul, korea. Transp. Policy 2011, 18, 102–116. [Google Scholar] [CrossRef]
- Higgins, C.; Kanaroglou, P. Rapid transit, transit-oriented development, and the contextual sensitivity of land value uplift in Toronto. Urban Stud. 2017, 55. [Google Scholar] [CrossRef]
- Johnson, A. Bus transit and land use: Illuminating the interaction. J. Public Transp. 2003, 6, 2. [Google Scholar] [CrossRef]
- Murphy, E.; Fox-Rogers, L. Transport and Land Use Planning in Contemporary Meath. In Meath: History and Society; Geography Publications: Dublin, Ireland, 2015. [Google Scholar]
- Canepa, B. Bursting the bubble: Determining transit-oriented development’s walkable limits. Transp. Res. Rec. 2007, 1, 28–34. [Google Scholar] [CrossRef]
- Western Australian Planning Commission. Liveable Neighbourhoods: Community Design Code (WAPC). Available online: www.planning.wa.gov.au/dop_pub_pdf/LN_Text_update_02.pdf (accessed on 1 September 2017).
- Ewing, R. Pedestrian-and Transit-Friendly Design: A Primer for Smart Growth. Smart Growth Network Manual; A manual prepared for the Florida Department of Transportation. Available online: www.epa.gov/sites/production/files/documents/ptfd_primer.pdf (accessed on 1 September 2017).
- Cartenì, A.; Galante, G.; Henke, I. The catchment area of high architectural railway stations: An application of the graham scan algorithm. Wit Trans. Built Environ. 2014, 135. [Google Scholar] [CrossRef]
- El-Geneidy, A.; Grimsrud, M.; Wasfi, R.; Tétreault, P.; Surprenant-Legault, J. New evidence on walking distances to transit stops: Identifying redundancies and gaps using variable service areas. Transportation 2014, 41, 193–210. [Google Scholar] [CrossRef]
- Sun, G.; Zacharias, J.; Ma, B.; Oreskovic, N.M. How do metro stations integrate with walking environments? Results from walking access within three types of built environment in Beijing. Cities 2016, 56, 91–98. [Google Scholar] [CrossRef]
- Lee, S.; Yi, C.; Hong, S.P. Urban structural hierarchy and the relationship between the ridership of the Seoul metropolitan subway and the land-use pattern of the station areas. Cities 2013, 35, 69–77. [Google Scholar] [CrossRef]
- Chakraborty, A.; Mishra, S. Land-use and transit ridership connections: Implications for state-level planning agencies. Land Use Policy 2013, 30, 458–469. [Google Scholar] [CrossRef]
- Zhao, J.; Deng, W.; Song, Y.; Zhu, Y. Analysis of Metro ridership at station level and station-to-station level in Nanjing: An approach based on direct demand models. Transportation 2014, 41, 133–155. [Google Scholar] [CrossRef]
- Kim, T.; Sohn, D.W.; Choo, S. An analysis of the relationship between pedestrian traffic volumes and built environment around metro stations in Seoul. KSCE J. Civil Eng. 2017, 21, 1443–1452. [Google Scholar] [CrossRef]
- Bartholomew, K.; Ewing, R. Hedonic price effects of pedestrian-and transit-oriented development. J. Plan. Lit. 2011, 26, 18–34. [Google Scholar] [CrossRef]
- Petheram, S.J.; Nelson, A.C.; Miller, M.; Ewing, R. Use of the real estate market to establish light rail station catchment areas. Transp. Res. Rec. 2013, 1, 95–99. [Google Scholar] [CrossRef]
- Upchurch, C.; Kuby, M.; Zoldak, M.; Barranda, A. Using GIS to generate mutually exclusive service areas linking travel on and off a network. J. Transp. Geogr. 2004, 12, 23–33. [Google Scholar] [CrossRef]
- Cevero, R. Transit-Oriented Development in America: Experiences, Challenges, and Prospects; The National Academies Press: Washington, DC, USA, 2004. [Google Scholar] [CrossRef]
- Growth Management Queensland. Transit Oriented Development Guide. Available online: https://www.cabinet.qld.gov.au/documents/2009/dec/tod%20publications/Attachments/tod-guide[1].pdf (accessed on 4 September 2017).
- Shenzhen Urban Transport Planning Center. Transit-Oriented Development Framework and Planning Strategies in Shenzhen; Urban Transport of China: Shenzhen, China, 2011. [Google Scholar]
- The Reconnecting America and the Center for Transit-Oriented Development. TOD 202: Station Area Planning—How To Make Great Transit-Oriented Places. Available online: http://reconnectingamerica.org/resource-center/books-and-reports/2008/tod-202-station-area-planning/ (accessed on 1 September 2017).
- Cervero, R. The Transit Metropolis: A Global Inquiry; Island Press: Washington, DC, USA, 1998; 11; pp. 1–13. ISBN 9781559635912. [Google Scholar]
- Ahlfeldt, G. If Alonso was right: Modeling accessibility and explaining the residential land gradient. J. Reg. Sci. 2011, 51, 318–338. [Google Scholar] [CrossRef]
- Clark, C. Urban Population Densities. J. R. Stat. Soc. Ser. A 1951, 114, 490–496. [Google Scholar] [CrossRef]
- Khatun, H.; Falgunee, N.; Kutub, M.J.R. Analyzing urban population density gradient of Dhaka Metropolitan Area using Geographic Information Systems (GIS) and Census Data. Geografia—Malays. J. Soc. Space 2015, 11, 1–13. [Google Scholar]
- White, M.J. Urban areas with decentralized employment: Theory and empirical work. Handb. Reg. Urban Econ. 1999, 3, 1375–1412. [Google Scholar]
- Li, J.; Zhang, W.; Chen, H.; Yu, J. The spatial distribution of industries in transitional China: A study of Beijing. Habitat Int. 2015, 49, 33–44. [Google Scholar] [CrossRef] [Green Version]
- Yang, K.Q.; Wang, Y.H.; Zhang, S.L.; Zhao, Q. The urban land price and its regional differences in China based on density gradient. Geogr. Res. 2012, 31, 1652–1660. [Google Scholar]
- Ding, C.; Zhao, X. Land market, land development and urban spatial structure in Beijing. Land Use Policy 2014, 40, 83–90. [Google Scholar] [CrossRef]
- Marzluff, J.M.; Bowman, R.; Donnelly, R. Avian Ecology and Conservation in an Urbanizing World; Springer US: New York, NY, USA, 2001. [Google Scholar]
- Longley, P.A.; Mesev, V. Measurement of density gradients and space-filling in urban systems. Pap. Reg. Sci. 2002, 81, 1–28. [Google Scholar] [CrossRef]
- Zhao, W.; Zhang, Q. The Application of Origin8.0 to Data Processing of Environmental Monitoring. Tianjin Chem. Ind. 2016, 30, 58–60. [Google Scholar] [CrossRef]
- Higgins, C.; Ferguson, M.; Kanaroglou, P. Light Rail and Land Use Change: Rail Transit’s Role in Reshaping and Revitalizing Cities. J. Public Transp. 2014, 17, 93–112. [Google Scholar] [CrossRef] [Green Version]
- Duranton, G.; Guerra, E. Urban accessibility: Balancing land use and transportation. Available online: https://faculty.wharton.upenn.edu/wp-content/uploads/2017/05/Urban-accessibility-Balancing-land-use-and-transportation-Gilles.pdf (accessed on 4 September 2017).
- Handy, S. Smart growth and the transportation-land use connection: What does the research tell us? Int. Reg. Sci. Rev. 2005, 28, 146–167. [Google Scholar] [CrossRef]
- Pacheco-Raguz, J.F. Assessing the impacts of light rail transit on urban land in manila. J. Transp. Land Use 2010, 3, 113–138. [Google Scholar] [CrossRef]
- Lee, G.K.L.; Chan, E.H.W. The Analytic Hierarchy Process (AHP) Approach for Assessment of Urban Renewal Proposals. Soc. Indic. Res. 2008, 89, 155–168. [Google Scholar] [CrossRef]
- Papa, E.; Bertolini, L. Accessibility and Transit-Oriented Development in European metropolitan areas. J. Transp. Geogr. 2015, 47, 70–83. [Google Scholar] [CrossRef]
- Tan, Z.; Li, S.; Li, X.; Liu, X.; Chen, Y.; Li, W. Spatio-temporal effects of urban rail transit on complex land-use change. Acta Geogr. Sinica 2017, 72, 850–862. [Google Scholar] [CrossRef]
- Ratner, K.A.; Goetz, A.R. The reshaping of land use and urban form in Denver through transit-oriented development. Cities 2013, 30, 31–46. [Google Scholar] [CrossRef]
- Cervero, R.; Landis, J. Twenty years of the bay area rapid transit system: Land use and development impacts. Transp. Res. Part A 1997, 31, 309–333. [Google Scholar] [CrossRef]
- Hurst, N.B.; West, S.E. Public transit and urban redevelopment: The effect of light rail transit on land use in Minneapolis, Minnesota. Reg. Sci. Urban Econ. 2014, 46, 57–72. [Google Scholar] [CrossRef]
- Bhattacharjee, S.; Goetz, A.R. The rail transit system and land use change in the Denver metro region. J. Transp. Geogr. 2016, 54, 440–450. [Google Scholar] [CrossRef]
- Zhao, J.; Deng, W. Relationship of walk access distance to rapid rail transit stations with personal characteristics and station context. J. Urban Plan. Dev. 2013, 139, 311–321. [Google Scholar] [CrossRef]
- Sung, H.; Oh, J.T. Transit-oriented development in a high-density city: Identifying its association with transit ridership in Seoul, Korea. Cities 2011, 28, 70–82. [Google Scholar] [CrossRef]
- Pan, H. Rail Transit and Its Impact on Shanghai Metropolitan Spatial Structure. In Proceedings of the International Conference on Transportation Engineering, Chengdu, China, 25–27 July 2009. [Google Scholar]
- Sung, H.G.; Kim, D.J.; Park, J.H. Impacts of land-use and urban design characteristics on transit ridership in the Seoul rail station areas. J. Korean Soc. Transp. 2008, 26, 135–147. [Google Scholar] [CrossRef]
- China Statistics Press. Shenzhen Statistical Yearbook. Available online: http://www.sz.gov.cn/cn/xxgk/zfxxgj/tjsj/tjnj/201712/P020181106397700083456.pdf. (accessed on 2 September 2017).
- VCG and Han Hua Yi Mei. Available online: https://www.vcg.com/creative/811933217 (accessed on 2 September 2017).
- Goetz, E.G.; Ko, K.; Hagar, A.; Ton, H.; Matson, J. The Hiawatha Line: Impacts on Land Use and Residential Housing Value; Center for Transportation Studies: Minneapolis, MN, USA, 2010. [Google Scholar]
- Sawatsky, M.L.; Clyde, M.; Meek, F. Partial least squares regression in the social sciences. Quant. Methods Psychol. 2015, 11, 52–62. [Google Scholar] [CrossRef] [Green Version]
- Mehmood, T.; Liland, K.H.; Snipen, L.; Sæbø, S. A review of variable selection methods in partial least squares regression. Chemom. Intell. Lab. Syst. 2012, 118, 62–69. [Google Scholar] [CrossRef]
- Tobler, W.R. A computer movie simulating urban growth in the Detroit region. Econ. Geogr. 1970, 46, 234–240. [Google Scholar] [CrossRef]
Figure 1.
Transit-oriented development (TOD) Land use pattern (Source: [25]).
Figure 1.
Transit-oriented development (TOD) Land use pattern (Source: [25]).

Figure 2.
Density distribution of TOD area.

Figure 3.
Functional curves of power, linear, logarithmic and exponential.

Figure 4.
Shenzhen density gradient in two years.


Figure 5.
Examples of high and low values of ‘a’ and ‘b’.


Figure 6.
Conceptual framework.

Figure 7.
Technical route of creating a model to explore impact of accessibility on land use catchment area (LCA).
Figure 7.
Technical route of creating a model to explore impact of accessibility on land use catchment area (LCA).

Figure 8.
Shenzhen TOD area and facilities distribution. (a) The study area of Shenzhen TOD; (b) The point of interest (POI) density change in 2007 and 2016; (c) Aerial view of Shenzhen’s inner city (Source: [53]).
Figure 8.
Shenzhen TOD area and facilities distribution. (a) The study area of Shenzhen TOD; (b) The point of interest (POI) density change in 2007 and 2016; (c) Aerial view of Shenzhen’s inner city (Source: [53]).

Figure 9.
A sample of POIs within the Taoyuan Station area.

Figure 10.
Comparison of reality-based boundaries and planning guideline.


Table 1.
The fitting goodness of density gradient curves.
| Probability > F-Value | Adjusted R2 | Fit Status | |
|---|---|---|---|
| power function | 0.017 | 0.460 | 118 Succeeded |
| liner function | 0.112 | 0.460 | 118 Succeeded |
| logarithmic function | 0.016 | 0.251 | 114 Succeeded |
| exponential function | 0.010 | 0.504 | 118 Succeeded |
Note: F value is a statistical test in which the test statistic has an F-distribution under the null hypothesis.
Table 2.
Statistical description of fitting result.
| 2007 | 2016 | |
|---|---|---|
| Fitting succeeded | 80 | 86 |
| Fitting failed | 6 | 0 |
| Average ‘a’ value | 1542.0043 | 3258.0773 |
| Average ‘b’ value | −0.0071 | 0.0022 |
| Average adj. R2 (0–1000 m) | 0.1964 | 0.5037 |
| Average adj. R2 (100–1000 m) | 0.3640 | 0.6166 |
Table 3.
Summary of TOD accessibility variables that affect land use transformation.
| Author (Year) | Facilities-Based | Proximity-Based | Human-Based | Time-Based | ||||||
|---|---|---|---|---|---|---|---|---|---|---|
| Land Use Change | Number/Proportion of Facilities | Job-Population Balance | Transit Serves | Distance to CBD | Distance to Highway | Distance to Services | Population | Socio-Economic Status | Develop Period | |
| TAN et al. (2017) [43] | √ | √ | √ | √ | √ | |||||
| Bhattacharjee et al. (2016) [47] | √ | √ | √ | √ | ||||||
| NB Hurst (2014) [46] | √ | √ | √ | √ | √ | √ | √ | |||
| Sung et al. (2014) [3] | √ | √ | √ | √ | √ | √ | ||||
| Ratner et al. (2013) [44] | √ | √ | √ | √ | √ | |||||
| JF Pacheco-Raguz (2010) [40] | √ | √ | √ | √ | √ | |||||
| Pan Haixiao (2009) [50] | √ | √ | √ | |||||||
| Sung et al. (2008) [51] | √ | √ | √ | √ | √ | |||||
Table 4.
Classification of POIs data.
| First-Level Categories | Second-Level Categories | |
|---|---|---|
| 1 | Commercial | Retail, shopping mall, supermarket, catering, movie theatre, KTV, ballroom, game center, cybercafé, post office, travel agency, print shops, bank, hotel, gas station, etc. |
| 2 | Industry | Enterprise, company, factory, etc. |
| 3 | Residence | Apartment, community, etc. |
| 4 | Public Service | Government, school, general and special hospitals, museum, gym, etc. |
| 5 | Green Space | Square, park, tourist spot, temple, historical sites, etc. |
| 6 | Utility | Toilet, kiosk, public telephone, etc. |
| 7 | Transport Facilities | Bus stop and parking |
Table 5.
Cause of formation.
| Dependent Variable | Measure | Data Source |
|---|---|---|
| LCA feature | ||
| Scale (Model 1) | Ln ‘a’ value | Calculation |
| Form (Model 2) | Ln ‘b’ value | Calculation |
| Independent variable | ||
| 1. Facility-based accessibility | ||
| Traffic | Number of parking lots and bus stops | Gaode map |
| Commercial | Number of stores, restaurants, financial services etc. | Gaode map |
| Job-population balance | the ratio of industry POI number (enterprise, company and factory etc.) and residence POI number (apartment and community etc.). | Gaode map |
| 2. Proximity-based accessibility | ||
| Distance to main road | Distance to nearest main road (m) | OpenStreetMap |
| Distance to CBD | Distance to Shiminzhongxin Station (m) | OpenStreetMap |
| Transit lines | Number of connecting lines (single line = 1, transit line = 2) | Observation |
| Transit services | Metro departure interval frequency (min) | Shenzhen Metro Corporation |
| 3. Station-based accessibility | ||
| aboveground or underground station | The stations that were constructed over ground and looks like a light rail station (elevated station = 1) The stations that were constructed underground with no appearance (underground station = 0) | Observation |
| Station hierarchy | Regional station = 3, urban station = 2, neighbourhood station = 1 | Shenzhen Urban Planning Guideline |
| Station entrance | Number of station exits and entrances | Shenzhen Metro Corporation |
| 4. Time-based accessibility | ||
| Before station construction | In the year of 2007 before TOD construction | |
| After station construction | In the year of 2016 after TOD construction | |
Table 6.
Statistical Description of the ‘a’, ‘b’ and goodness of fit.
| Mean | Max | Min | SD | |
|---|---|---|---|---|
| ‘a’ value | 3823.8109 | 27142.4707 | 128.5563 | 4879.3214 |
| ‘b’ value | 0.0091 | 0.8264 | −0.0010 | 0.0759 |
| adj. R2 | 0.5037 | 0.9982 | −0.3742 | 0.3556 |
Table 7.
The Variable Importance in the Projection (VIP) and Weight of variables in Model 1 and Model 2.
Table 7.
The Variable Importance in the Projection (VIP) and Weight of variables in Model 1 and Model 2.
| Model 1 (Scale of TOD) | Model 2 (Compactness of TOD) | |||||||
|---|---|---|---|---|---|---|---|---|
| 2007 | 2016 | 2007 | 2016 | |||||
| VIP | Weight | VIP | Weight | VIP | Weight | VIP | Weight | |
| 1. Facility-based accessibility | ||||||||
| Transit facilities | ||||||||
| 0–200 m | 1.182 ** | −0.359 | 1.206 ** | 0.045 | 0.989 * | −0.252 | 0.943 * | 0.282 |
| 200–400 m | 1.278 ** | −0.259 | 1.121 ** | −0.089 | 1.584 ** | −0.482 | 1.097 ** | −0.193 |
| 400–600 m | 0.639 | −0.088 | 0.405 | 0.151 | 0.617 * | 0.064 | 1.060 ** | 0.308 |
| 600–800 m | 0.648 | 0.003 | 0.410 | 0.002 | 0.793 | 0.279 | 1.523 ** | −0.086 |
| 800 m–1 km | 0.303 | 0.301 | 0.337 | 0.215 | 0.862 * | 0.172 | 1.020 ** | −0.095 |
| Commercial facilities | ||||||||
| 0–200 m | 1.276 ** | −0.225 | 1.793 ** | 0.234 | 0.842 * | −0.076 | 0.808 * | 0.162 |
| 200–400 m | 1.195 ** | −0.057 | 1.672 ** | 0.151 | 0.880 * | 0.079 | 0.828 * | 0.106 |
| 400–600 m | 0.451 | 0.015 | 1.138 ** | 0.302 | 1.109 ** | 0.179 | 1.246 ** | 0.165 |
| 600–800 m | 0.716 | −0.158 | 0.638 | 0.156 | 1.075 ** | −0.202 | 1.400 ** | −0.182 |
| 800 m–1 km | 0.437 | 0.161 | 0.339 | 0.030 | 0.817 * | −0.045 | 1.101 ** | −0.192 |
| Job-population balance | ||||||||
| 0–200 m | 1.317 ** | 0.382 | 0.984 * | 0.359 | 2.126 ** | .587 | 0.758 | −0.013 |
| 200–400 m | 1.376 ** | −0.026 | 1.097 ** | 0.250 | 1.129 ** | −0.092 | 0.935 * | 0.348 |
| 400–600 m | 1.399 ** | 0.179 | 1.181 ** | 0.019 | 1.264 ** | 0.026 | 0.738 | 0.269 |
| 600–800 m | 1.378 ** | 0.142 | 1.187 ** | 0.049 | 1.303 ** | 0.048 | 0.704 | 0.209 |
| 800 m–1 km | 1.407 ** | 0.032 | 1.197 ** | 0.066 | 1.387 ** | 0.053 | 0.736 | 0.091 |
| 2. Proximity-based accessibility | ||||||||
| Distance to the main road | - | - | 0.844 * | −0.458 | - | - | 0.703 | −0.145 |
| Distance to CBD | - | - | 0.827 * | −0.390 | - | - | 0.684 | −0.143 |
| Transit lines | - | - | 0.324 | −0.163 | - | - | 0.482 | 0.053 |
| Transit service | - | - | 0.578 | 0.234 | - | - | 1.037 ** | 0.358 |
| 3. Station-based accessibility | ||||||||
| Aboveground/underground station | - | - | 0.904 * | 0.003 | - | - | 0.479 | −0.079 |
| Station hierarchy | - | - | 0.839 * | 0.007 | - | - | 1.333 ** | 0.022 |
| Station entrance | - | - | 0.767 | −0.092 | - | - | 0.553 | −0.022 |
** Is the significant important variable; * is the important variable.
Table 8.
Correlation coefficients between fitting goodness and ‘a’, ‘b’ value.
| ‘a’ Value (Scale of TOD) | ‘b’ Value (Compactness of TOD) | ||
|---|---|---|---|
| Adj. R2 | Pearson Correlation | 0.467 ** | 0.515 ** |
| Sig. (2-tailed) | 0.000 | 0.000 | |
| N | 86 | 86 | |
** Correlation is significant at the 0.01 level (2-tailed).
© 2018 by the authors. Licensee MDPI, Basel, Switzerland. This article is an open access article distributed under the terms and conditions of the Creative Commons Attribution (CC BY) license (http://creativecommons.org/licenses/by/4.0/).
Share and Cite
MDPI and ACS Style
Tong, X.; Wang, Y.; Chan, E.H.W.; Zhou, Q. Correlation between Transit-Oriented Development (TOD), Land Use Catchment Areas, and Local Environmental Transformation. Sustainability 2018, 10, 4622. https://doi.org/10.3390/su10124622
AMA Style
Tong X, Wang Y, Chan EHW, Zhou Q. Correlation between Transit-Oriented Development (TOD), Land Use Catchment Areas, and Local Environmental Transformation. Sustainability. 2018; 10(12):4622. https://doi.org/10.3390/su10124622
Chicago/Turabian StyleTong, Xin, Yaowu Wang, Edwin H. W. Chan, and Qingfeng Zhou. 2018. "Correlation between Transit-Oriented Development (TOD), Land Use Catchment Areas, and Local Environmental Transformation" Sustainability 10, no. 12: 4622. https://doi.org/10.3390/su10124622
Note that from the first issue of 2016, this journal uses article numbers instead of page numbers. See further details here.