Sustainability Assessment According to the Selected Business Excellence Models


1
Faculty of Operation and Economics of Transport and Communications, University of Žilina, Univerzitná 1, 010 26 Žilina, Slovakia
2
Faculty of Management Science and Informatics, University of Žilina, Univerzitná 1, 010 26 Žilina, Slovakia
*
Author to whom correspondence should be addressed.
Sustainability 2018, 10(10), 3784; https://doi.org/10.3390/su10103784
Submission received: 7 September 2018
/
Revised: 14 October 2018
/
Accepted: 16 October 2018
/
Published: 19 October 2018
(This article belongs to the Special Issue Quality Management and Sustainable Development)
Abstract
:Not every Business Excellence model has an integral approach considering the environmental, economic, and social aspects of sustainability. The aim of the paper is to review the selected Business Excellence Models and to introduce a proposal to improve this type of models as being applicable for the sustainability assessment. The models that were chosen are used as a basis for organisational improvement. The paper is based on information gathered through extensive literature review (research publications, research studies, documents about The Business Excellence Models) using Internet and research databases and the author’s own experience. Methods of analysis, comparison, selection and statistics are to be used. Although the models are based on similar principles, the differences are in the number and structure of the criteria, respectively, sub-criteria and in the sustainability assessment approach. Therefore, as key criteria in the area of self-assessment, we propose seven non-results criteria and criterion results. The proposed Model is discussed with the analysed models, based on the calculation of their mutual distances. The model, which is closest to the proposed model, is The Singapore Business Excellence Framework.
1. Introduction
The term “sustainability” covers environmental issues, wider corporate social responsibility (CSR), the long-term continuity, and economic survival of business [1]. According to R. B. Pojasek, sustainability is only one of several terms now being used to denote the same concept; other terms include corporate social responsibility (CSR), social responsibility (which drops the “corporate” modifier in an attempt to make the term more universal), corporate citizenship, corporate responsibility, environmental sustainability, sustainable development, and each of these terms in turn can be defined in scores of different ways [2]. Sustainable business, or green business, is an enterprise that has minimal negative impact on the global or local environment, community, society, or economy [3]. It means a business with dynamic balance among three mutually interdependent elements: protection of ecosystems and natural resources; economic efficiency; and, consideration of social wellbeing such as jobs, housing, education, medical care, and cultural opportunities [4]. Therefore, to deliver a total or complete value to the customer, value propositions of the businesses must include economic, social and environmental value [5]. This opinion is reflected also by [2,6,7,8,9,10].
The sustainability assessment is demonstrated by many authors ([11,12,13,14,15,16,17,18,19,20,21,22,23]) and it can be simply defined as any process that directs decision-making towards sustainability [21]. This definition is sufficiently broad to encompass a vast range of decision making, from choices of individuals in everyday life through to projects, plans, programmes, or policies more familiarly addressed in the fields of impact assessment [21]. Devuyst defines the sustainability assessment as methodology that can help decision-makers and policy-makers decide what actions they should take and should not take in an attempt to make society more sustainable [12]. Verheem claims that the goal of sustainability assessment is to pursue that plans and activities make an optimal contribution to sustainable development [13]. Hacking and Guthrie take the view that sustainability assessment is best considered as an umbrella term encompassing a range of impact assessment practice [22]. They usefully designed a framework, based around strategicness, comprehensiveness and integratedness, which helps to classify the characteristics of an assessment and the extent to which it can be said to contribute to sustainability [22]:
- strategicness refers to the degree of emphasis on strategy (i.e., the extent to which the focus is broad, considers cumulative effects, is forward-looking, and incorporates intergenerational timescales);
- integratedness refers to the extent to which the various assessment techniques used are combined/aligned; and,
- comprehensiveness refers to the coverage of issues, which, for sustainability assessment, needs to include the three categories or pillars of environmental, social, and economic effects as well as indirect effects.
Based on the understanding of sustainability assessment, the variety of processes and applications under the banner of “sustainability assessment” became evident through a search for the term in January 2012 on the Scopus database by authors Bond, Morrison-Saunders, and Pope [19], which showed that growth in publications on sustainability assessment has been exponential in the period 1994 to 2010 inclusive [21]. It found examples of sustainability assessment practice from fields, including engineering, agriculture, and planning, many of which relate to very specific one-off decisions and are outside the bounds of traditional impact assessment, defined as “the process of identifying the future consequences of a current or proposed action” [21].
Although there are various international efforts on sustainability assessment (sustainability indices, sustainable development indicators, Business Excellence models) that can evaluate the sustainable development of companies [11,14,15,18,19,20,21,22,23,24,25,26,27,28,29,30,31,32], only few of them have an integral approach taking into account environmental, economic, and social aspects. In most cases, the focus is on one of the three aspects. Although, it could be argued that they could serve supplementary to each other, sustainability is more than an aggregation of the important issues, it is also about their interlinkages and the dynamics developed in a system [15].
Singh, Murty, Gupta, and Dikshit observed: “If the indices are poorly constructed, this will provide misleading results. It will be interpreted altogether differently” [15]. On the discrepancy of indexes also pointed Kašparová [33], her research was based on extensive research of Hamner [28], and similarly other authors, like [25,30,31,32,34,35]. Jankalová and Jankal examined the Business Excellence Models (namely The EFQM Excellence Model, The Baldrige Excellence Framework), the sustainability indexes (namely FTSE ESG, RobecoSAM) as multi-criteria analysis and determined that the best approach for the sustainability assessment is the Business Excellence Model [32]. Similarly, Avlonas stated that the EFQM Excellence Model is the best model for sustainability assessment [31]. By the approach of Avlonas important was also the purpose of the assessment—Tool for reporting, Tool for self-assessment or Tool for assessment?
Other authors recognized that current Business Excellence models do address sustainability [10,25,31,32,36,37,38,39,40,41,42,43,44,45]. Pojasek observed: “The Business Excellence model is a more suitable springboard for business sustainability than are other commonly used business improvement methods” [10]. Similarly, Fibuch and Van Way observed that the Baldrige Health Care Criteria for Performance Excellence “provided a clear model for organizational sustainability” [38].
The research problem is not the lack of such Business Excellence models, but the fact that not every model has an integral approach considering environmental, economic, and social aspects. The aim of the paper is to review the secondary data on criteria, sub-criteria, criteria weighting in the selected Business Excellence Models, and introduce a proposal to improve this type of models as being applicable for the sustainability assessment. The Business Excellence models were chosen that are, according to BPIR.com [46], used by 100,000’s of organisation’s worldwide as a basis for organisational improvement (Australian Business Excellence Framework, Canadian Framework for Business Excellence, The EFQM Excellence Model, The Singapore Business Excellence Framework, The Baldrige Excellence Framework). To these models have been added another 12 models (Modelo para una Gestión de Excelencia (Argentina), Modelo de Excelência da Gestão (Brazil), Modelo Chileno de Gestión de Excelencia (Chile), Modelo de Excelencia en la Gestión (Costa Rica), Modelo de Excelencia del Premio Nacional de Calidad de la República de Cuba, Modelo Iberoamericano de Excelencia en la Gestión, Japan Quality Award Framework, Malaysia Business Excellence Framework, El Modelo de Excelencia en la Gestión (Peru), El Modelo para una Gestión de Excelencia (San Salvador), South African Excellence Model, and Modelo de Mejora Continua (Uruguay)) to cover each of the continents.
The use of Business Excellence Models as a tool for sustainability assessment should be considered for a number of reasons:
- Business Excellence is about doing your Best; Excellent Organisations achieve and sustain outstanding levels of performance that meet or exceed the expectations of all their stakeholders [47]. Finally, Business Excellence Models provide a systematic approach for addressing stakeholder requirements [45].
- Business Excellence Models offer a means for improvement along key stakeholder dimensions and, thus, provide opportunities for the integration of sustainable development and traditional business processes [44].
- Sustainability can be achieved only through the integration of CSR and Business Excellence [47,48]. The idea is reflected also by the one of the fundamental concepts of excellence. It is called “creating a sustainable future” and it is characterized like “excellent organizations have a positive impact on the world around them by enhancing their performance whilst simultaneously advancing the economic, environmental and social conditions within the communities they touch” [47].
- Excellence is required on all level, but not every Business Excellence Model has an integral approach taking into account environmental, economic, and social aspects. Finally, it is necessary to improve this type of models as being applicable for the sustainability assessment based on Business Excellence and on three responsibilities: environmental, social, and economic.
The paper is organised as follows: Section 2 describes the methodology approach; Section 3 comparatively reviews the secondary data on criteria, sub-criteria, criteria weighting in the selected Business Excellence Models and introduces the proposed Business Excellence Model as being applicable for the sustainability assessment; and, Section 4 discusses the proposed Business Excellence Model with the analysed models, based on the calculation of their mutual distances.
2. Materials and Methods
The aim of the paper is to review the secondary data on criteria, sub-criteria, criteria weighting in the selected Business Excellence Models, and introduce a proposal to improve this type of models as being applicable for the sustainability assessment. The fulfilment of the aim is preceded by:
- analysis of criteria and sub-criteria in the selected Business Excellence Models
- analysis of the weight ratio of results and non-results criteria of selected Business Excellence models; and,
- analysis of the weights of the individual non-results criteria within selected Business Excellence models in relation to the weight of all non-results criteria in the analysed Business Excellence model.
We have included The Business Excellence Models that are, according to BPIR.com [46], used by 100,000’s of organisation’s worldwide as a basis for organisational improvement (Australian Business Excellence Framework, Canadian Framework for Business Excellence, The EFQM Excellence Model, The Singapore Business Excellence Framework, The Baldrige Excellence Framework). To these models have been added another 12 models (Modelo para una Gestión de Excelencia (Argentina), Modelo de Excelência da Gestão (Brazil), Modelo Chileno de Gestión de Excelencia (Chile), Modelo de Excelencia en la Gestión (Costa Rica), Modelo de Excelencia del Premio Nacional de Calidad de la República de Cuba, Modelo Iberoamericano de Excelencia en la Gestión, Japan Quality Award Framework, Malaysia Business Excellence Framework, El Modelo de Excelencia en la Gestión (Peru), El Modelo para una Gestión de Excelencia (San Salvador), South African Excellence Model, and Modelo de Mejora Continua (Uruguay)) to cover each of the continents. The choice of models was limited by the possibility of obtaining detailed information about the criteria, sub-criteria and their point assessment that were needed for the analytical part.
The analysis of The Business Excellence Models is presented as comparative review of the criteria, sub-criteria and criteria weighting in point-by-point (to discuss points about one Business Excellence Model with comparable points about another Business Excellence model). The identification of the Business Excellence Key Criteria depends on the weighting of the results and non-results criteria. The position characteristics-average, median, lower, and upper quartile are used. Due to the data structure and the degree of difference (identified in Part 3), the median is selected at the final weighting of the criteria.
The design of the model depends on the identification of the Business Excellence Key Criteria and on the calculated weights of the result and non-results criteria. The proposed model is then compared with the analysed models based on the calculation of their mutual distances. The following metrics are used to express the distance [49,50]:
- The Euclidean distancewhere DE = The Euclidean distance; m = number of variables; xil = i-th coordinate in dimension l; xjl = j-th coordinate in dimension l
- The Euclidean Squared distancewhere DES = The Euclidean Squared distance; m = number of variables; xil = i-th coordinate in dimension l; xjl = j-th coordinate in dimension l
- The Manhattan distancewhere DB = The Manhattan distance; m = number of variables; xil = i-th coordinate in dimension l; xjl = j-th coordinate in dimension l
- The Chebyshev distancewhere DC = The Chebyshev distance; m = number of variables; xil = i-th coordinate in dimension l; xjl = j-th coordinate in dimension l.
The results of these findings are stated in the following part 3.
This study is based on information that was gathered through extensive literature review (research publications, research studies, documents about The Business Excellence Models) using Internet and research databases and the author’s own experience.
3. Results
3.1. Interpretation of the Comparative Analysis
In the context of evaluating the comparative analysis of each Business Excellence model, it is necessary to define the following sets of questions:
- Q1: What weight ratio is assigned to the result and non-results criteria within the analysed models?
- Q2: What weight is assigned to each non-results criterion within the analysed models?
Q1: What weight ratio is assigned to the result and non-results criteria within the analysed models? It follows from the analysis (Table 1) that all the models have criteria broken down into results and non-results (non-results criteria are 6 on average). Only in two models (The EFQM Excellence Model, The South African Excellence Model) have results criteria the same weight ratio as non-results (50%:50%). In other models, the weight ratio of the results and non-results criteria is in the range of 20%:80% to 45%:55%.
Q2: What weight is assigned to each non-results criterion within the analysed models? By the non-results criteria was not compared the percentage weight against the total number of points of the analysed model, but against the points assigned to the non-results criteria of the analysed model. Due to the different number of non-results criteria in the analysed models, the increasing importance of social responsibility and sustainability, the number of criteria listed in Table 1, we identified seven non-results criteria based on an in-depth analysis of the criteria and sub-criteria and we have analysed their points assessment in relation to identified criteria. In the analysis we focus also on the sub-criteria of each model in order to find the intersection between the criteria. An example is the 7th criterion (Social responsibility and sustainability), which was presented as a single criterion in only five models (Modelo de Excelência da Gestão (Brazil), Modelo Chileno de Gestión de Excelencia (Chile), Modelo de Excelencia del Premio Nacional de Calidad de la República de Cuba (Cuba), Japan Quality Award Framework (Japan), and Modelo de Mejora Continua (Uruguay)). In other models, it was part of the leadership criterion (therefore, we used a weight of this sub-criterion in the overall analysis).
The results of these findings are stated in the Table 2, Table 3, Table 4, Table 5, Table 6, Table 7 and Table 8.
When comparing what weight is given to non-results criteria in the analysed Business Excellence Models, it is interesting to note that only in the EFQM Excellence Model are all criteria weighted equally. In other models, it is different. Regarding the most important non-results criteria according to their median and average weight in percentage in analysed models and depending on in how many models were the criterion most important (see Table 9), in the first place is the criterion Customers and other stakeholders, which has in the case of eight models highest weight among non-results criteria, of which in three cases the first place in importance is shared with another criterion/criteria. Its average weight is more than 18% and a median is more than 16%. Criterion Customers and other stakeholders has the highest percentage weight (25.86%) in Canadian Framework for Business Excellence (Canada) and highest point score (200 points) in Modelo de Excelencia del Premio Nacional de Calidad de la República de Cuba (Cuba). In second and third place are the criteria Leadership and People that have in the case of five models the highest weight among non-results criteria, their average weight and the median is more than 16%. Criterion Leadership has highest percentage weight (21.82%) and point score (120 points) in the Modelo Iberoamericano de Excelencia en la Gestión (Ibero-America). Criterion People has highest percentage weight (24.14%) and point score (140 points) in Canadian Framework for Business Excellence (Canada). In the case of four models was the most important non-result criterion the criterion Processes with average weight and a median of more than 16%. Criterion Processes has highest percentage weight (24.00%) in South African Excellence Model (South Africa) and highest point score (150 points) in Modelo de Excelencia del Premio Nacional de Calidad de la República de Cuba (Cuba). Then follow the criterion Strategy and planning with average weight and a median of nearly 14%, Information and knowledge with average weight and a median of more than 13% and criterion Social responsibility and sustainability with average weight and a median of around 9%.
3.2. The Design of Business Excellence Model
The identification of the Business Excellence Key Criteria depends on the weighting of the results and non-results criteria. Although the position characteristics—average, median, lower, and upper quartile were used (see Table 1, Table 2, Table 3, Table 4, Table 5, Table 6, Table 7 and Table 8); due to the data structure and the degree of difference, the median is selected at the final weighting of the criteria.
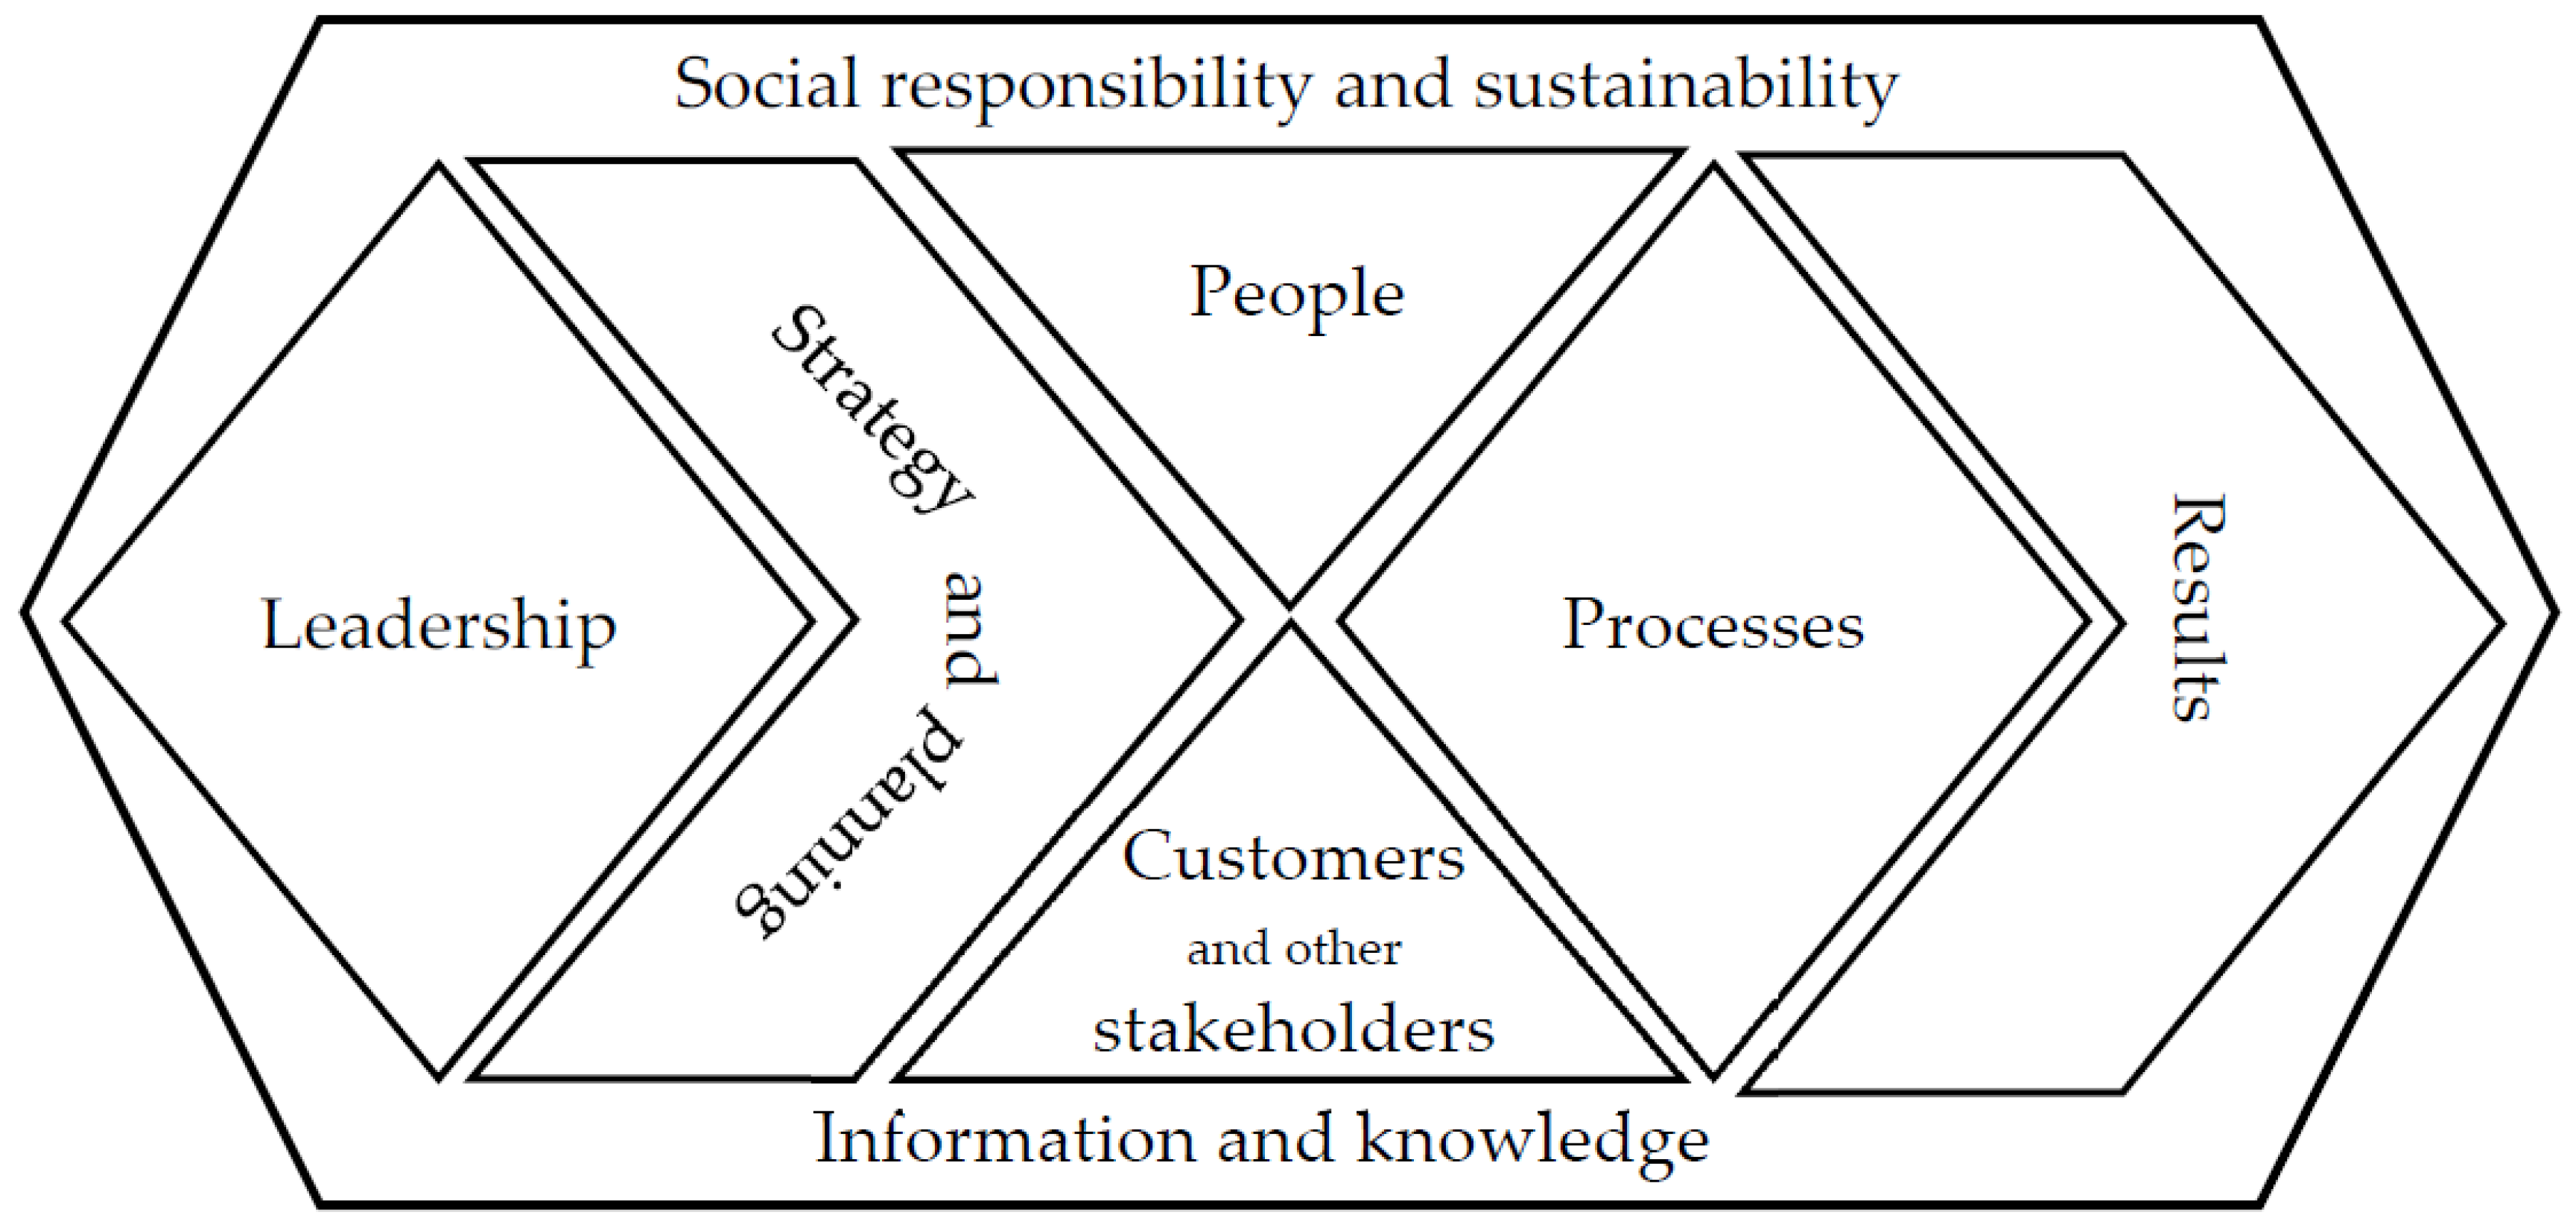
As key criteria in the area of self-assessment, we propose seven non-results criteria and criterion results (the weight ratio of the results and non-results criteria is 45%:55%—see Table 1) [51,52,53,54,55,56,57,58,59,60,61,62,63,64,65,66,67,68,69,70,71,72,73,74,75,76,77,78,79,80,81,82,83,84,85,86,87]:
- Criterion 1: Leadership (90 points)—the leadership of the organization and the way how it is managed reinforces the organization; how organization fulfils its legal, ethical, and social responsibility; focuses on the creation and development of culture, values, vision, ethical principles; the organization’s overall direction; to explore how top management takes responsibility for shaping strategy and values, how to address the consistency of expectations and sustainability; how it develops the values needed for long-term success and responsibility for the community and the environment.
- Criterion 2: Strategy and planning (75 points)—focuses on planning (including improvement plans), strategy development, implementation, implementation, and revision if necessary in the light of circumstances and taking into account the impact on the global and/or local environment, community, society, and economy; plans should take into account current and future challenges as well as the mission and vision of the organization; it examines how goals are reported throughout the organization, how performance is monitored, and how is measured and assessed the progress.
- Criterion 3: People (90 points)—focuses on the education and development of employees, the quality of their lives, the performance of individuals and teams, the working climate, the way employees are taken care of in order to make full use of their potential in order to meet the needs of the whole organization; how an organization evaluates employees and sets the necessary skills and knowledge; as an organization accepts that employees are important and should be valued, motivated, and enabled to engage in the organization’s goals and use their skills and knowledge for the benefit of the organization.
- Criterion 4: Customers and other stakeholders (90 points)—how an organization analyses its customers, other stakeholders and the market (identifying requirements, expectations, preferences and future trends), how it manages its relationship, and how it adds value to customers and other stakeholders; as an organization engages customers and other stakeholders to achieve long-term success on the market; listening to their voice, communicating with customers, other stakeholders and markets.
- Criterion 5: Processes (85 points)—examining the processes that the organization uses to create an increasing value for stakeholders; as an organization proposes and manages its processes in order to achieve strategic goals, how it promotes innovation and improvement of these processes, and thus improves the quality of their products; how it achieves lasting success.
- Criterion 6: Information and knowledge (70 points)—focuses on managing processes aimed at gathering information and knowledge, developing and using them to gain competitive advantage; how an organization measures performance in relation to the use of knowledge and information for improvement; as an organization uses information and knowledge for learning, planning, and decision-making that includes competitive analysis and benchmarking, helping the organization to determine actual performance, focus on improvement, and innovation to achieve excellence and sustainability.
- Criterion 7: Social responsibility and sustainability (50 points)—how the organization addresses its responsibility to society through the protection of the environment and natural resources; how the organization addresses its responsibility to society through the promotion of ethical and legal conduct, ensuring the protection of interests of its different stakeholders; how the organization addresses its responsibility to society through the promotion of good citizen practices towards the community, contributing to the development of their key communities); emphasis is also put on the fight against corruption and fraud.
- Criterion 8: Results (450 points)—this criterion is about performance and organization improvement in all key areas-results for: products, processes, customers, employees, leadership and organization leadership, market and finance, growth performance and organization development in relation to key stakeholders parties to verify their fulfilment; it is also essential to compare the level achieved against competitors and other organizations offering similar products, to examine the current level and trends; focuses on examining the methods that are used by the organization to demonstrate how well it performs and how likely it will be in the future; the organization must have clear objectives and appropriate indicators (indicators should go beyond the current level and include indicators relevant for future success), data available to assess performance against objectives and carry out reviews and improvements. Excellent organizations use systems and processes to measure and interpret internal and external indicators to help ensure future sustainability in relation to their economic, environmental, and social viability.
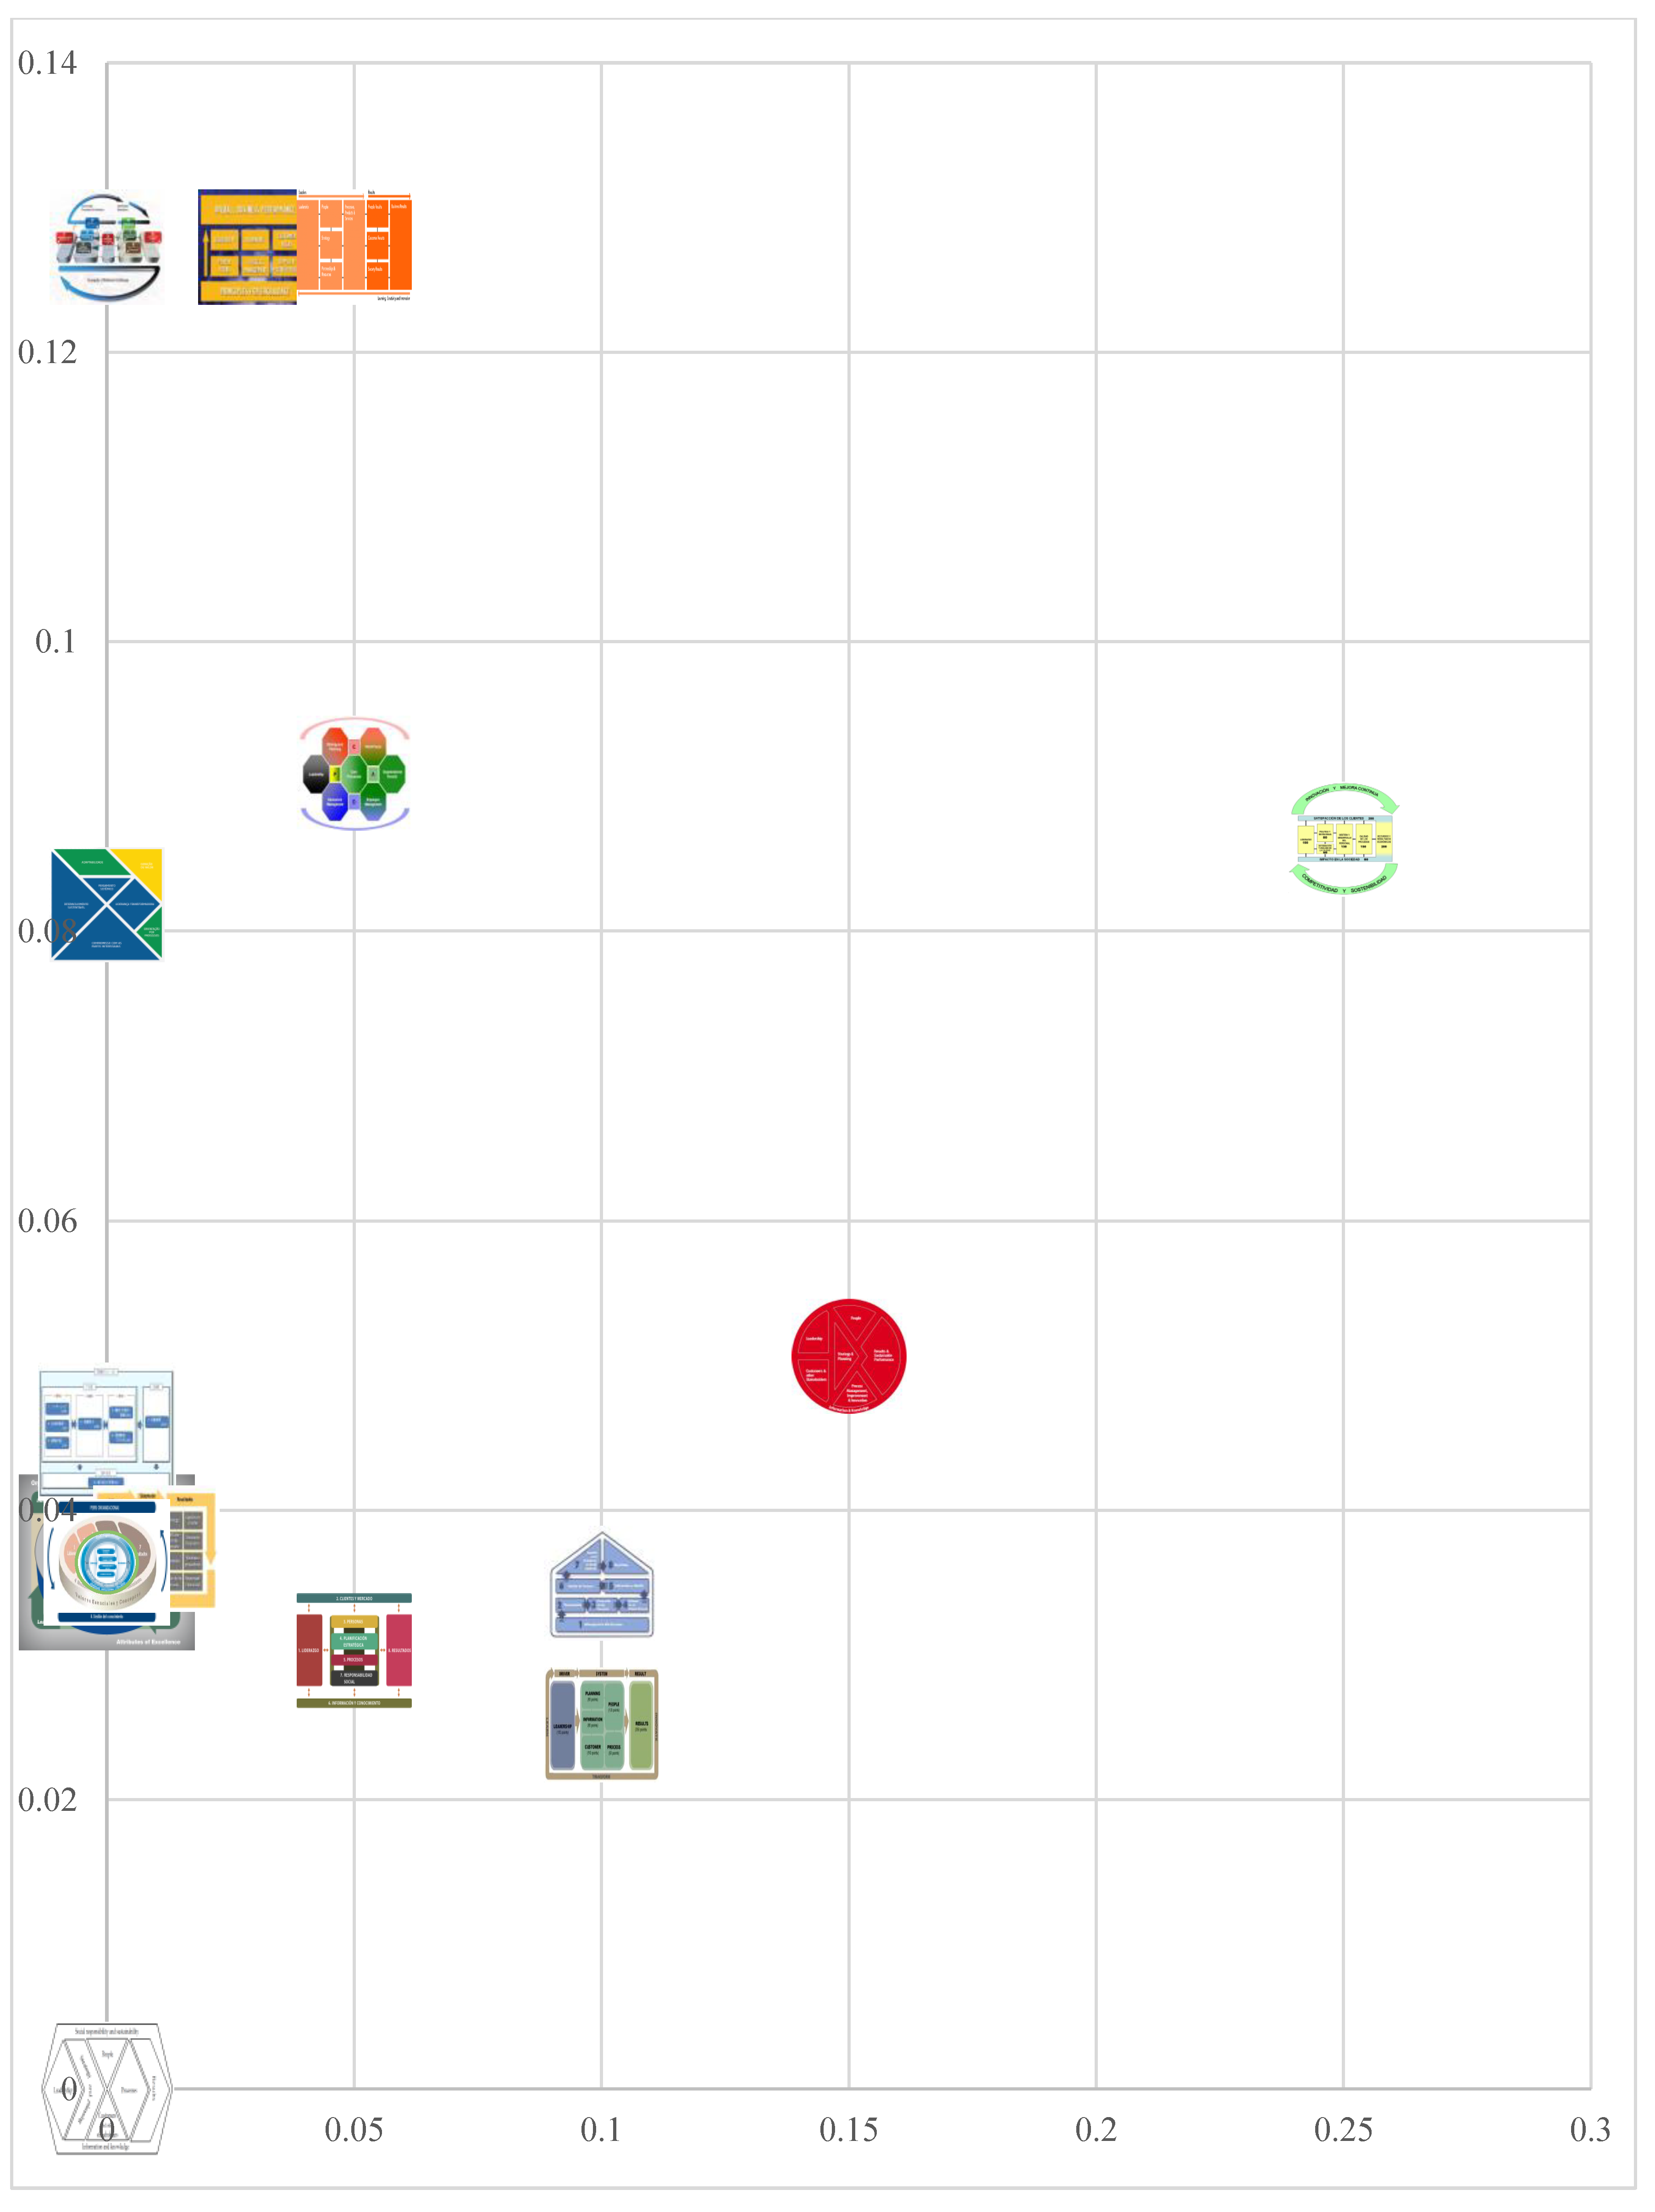
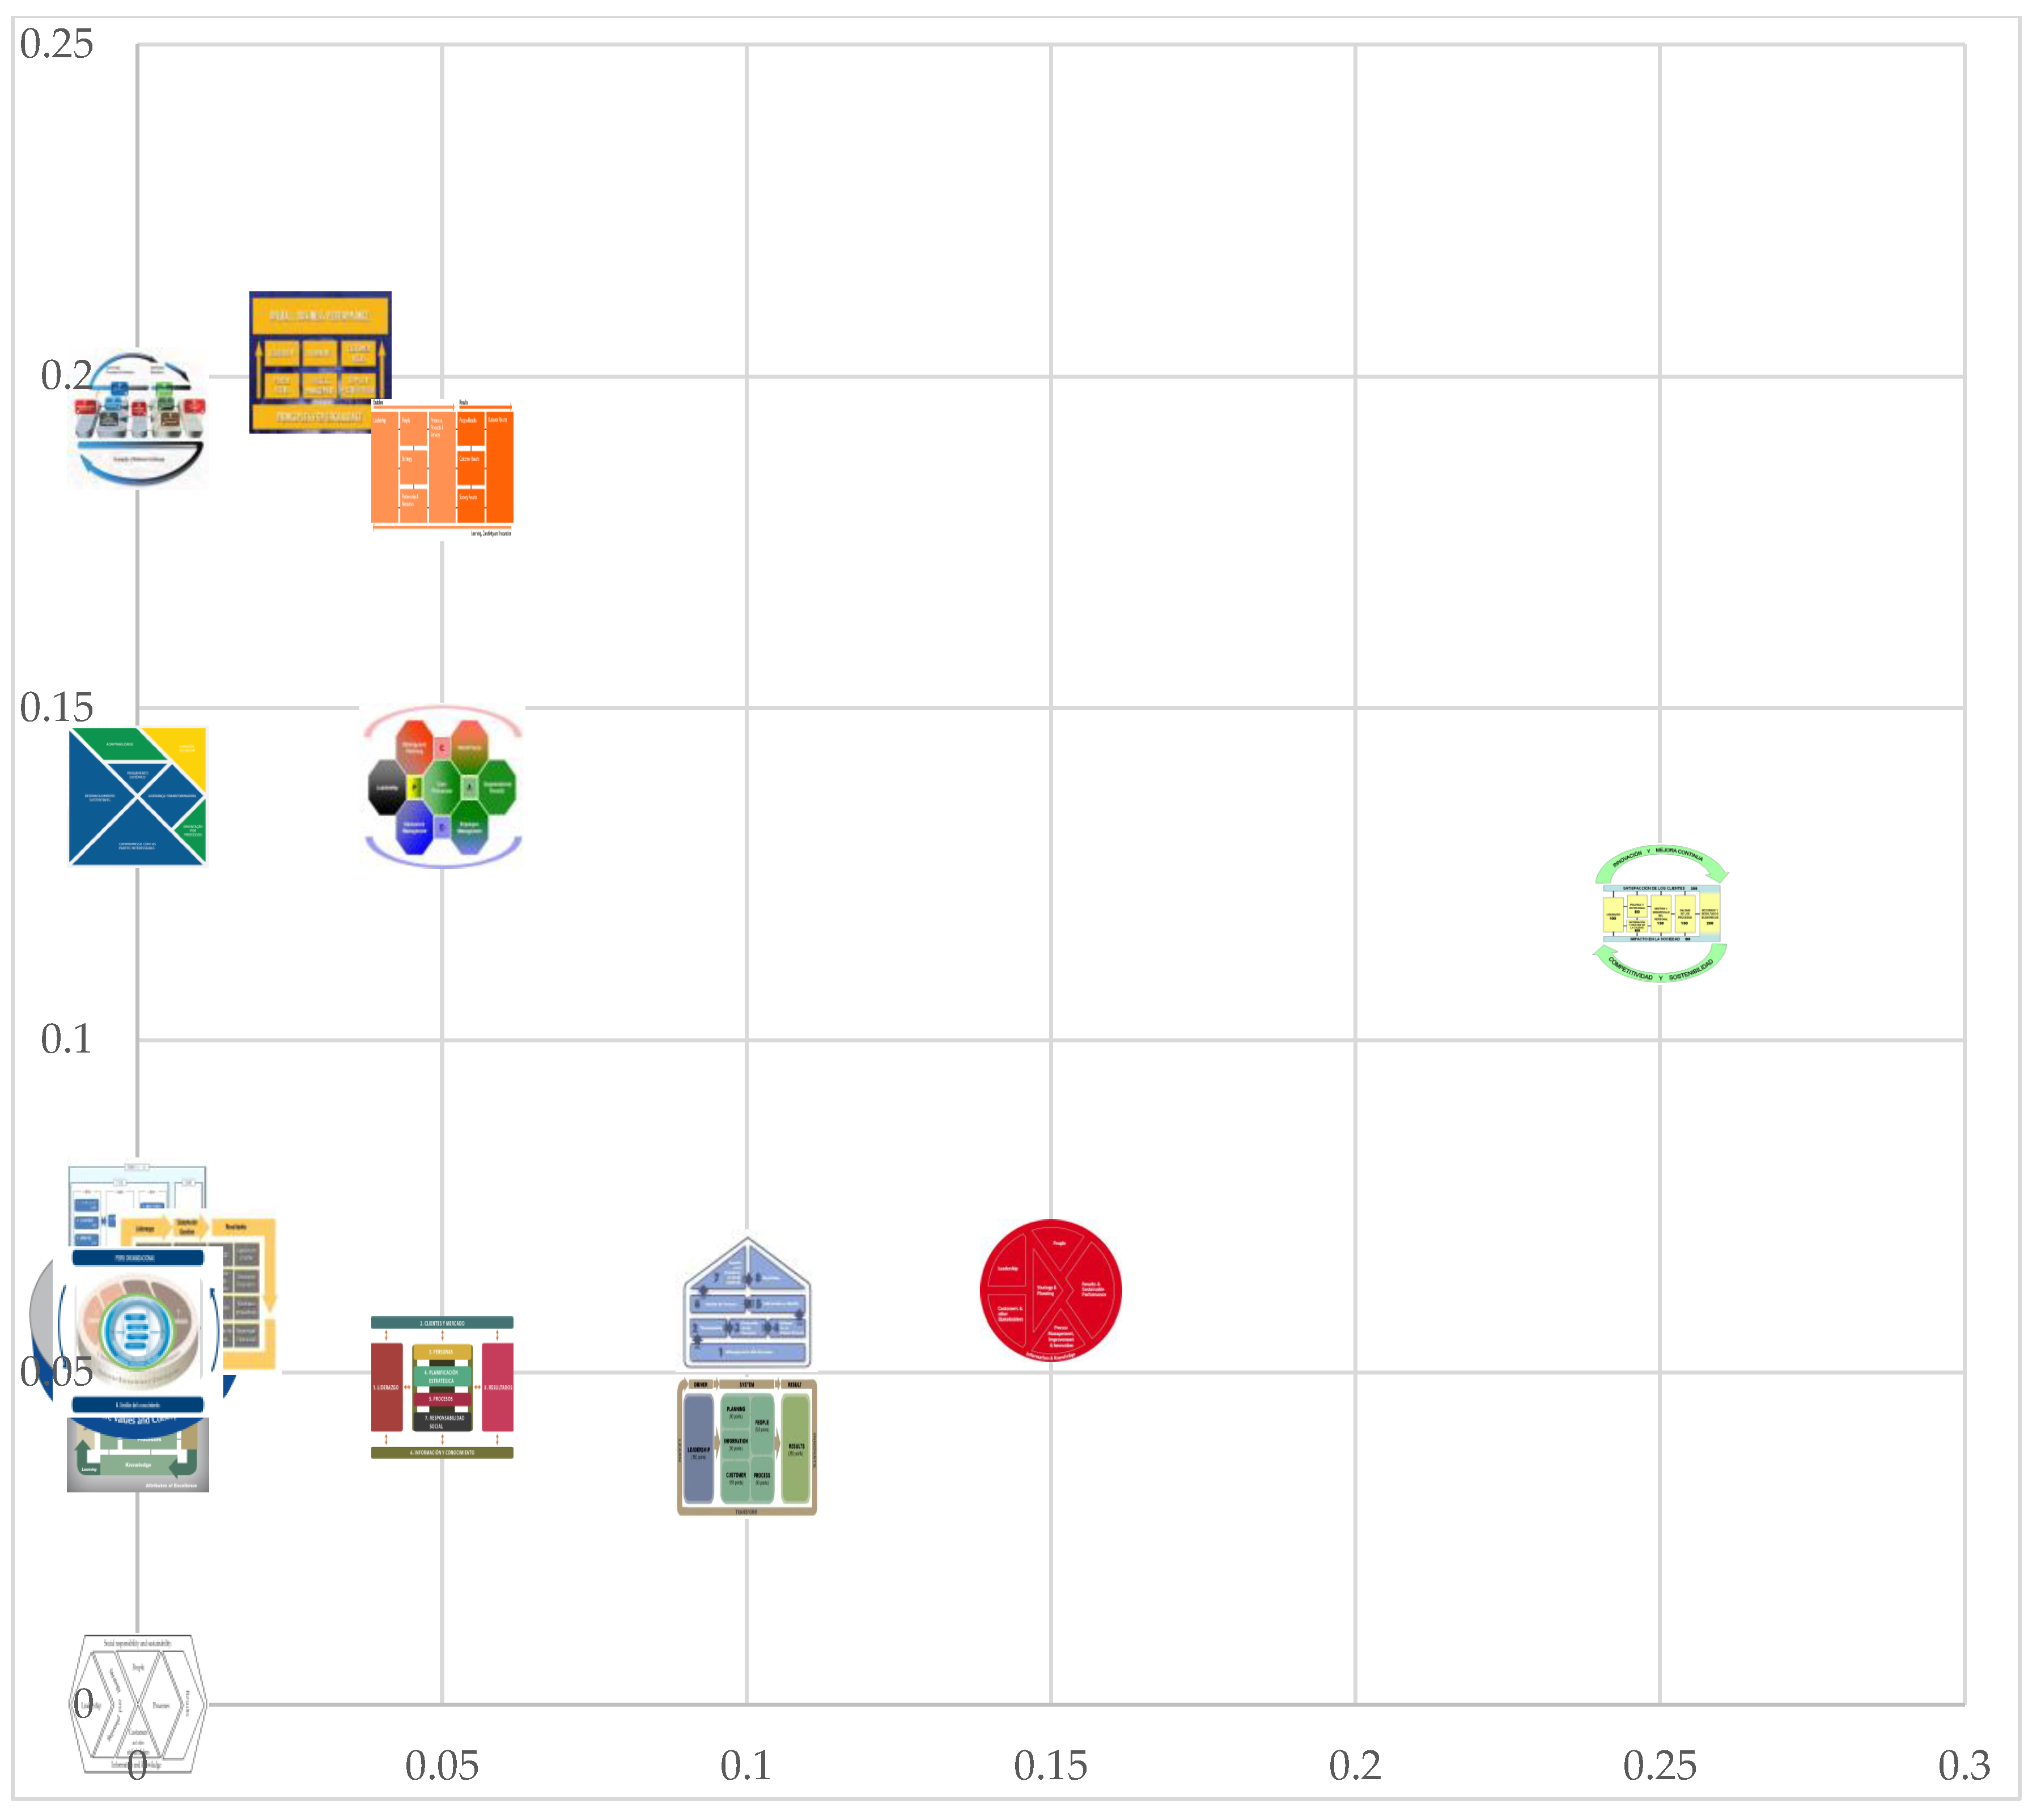
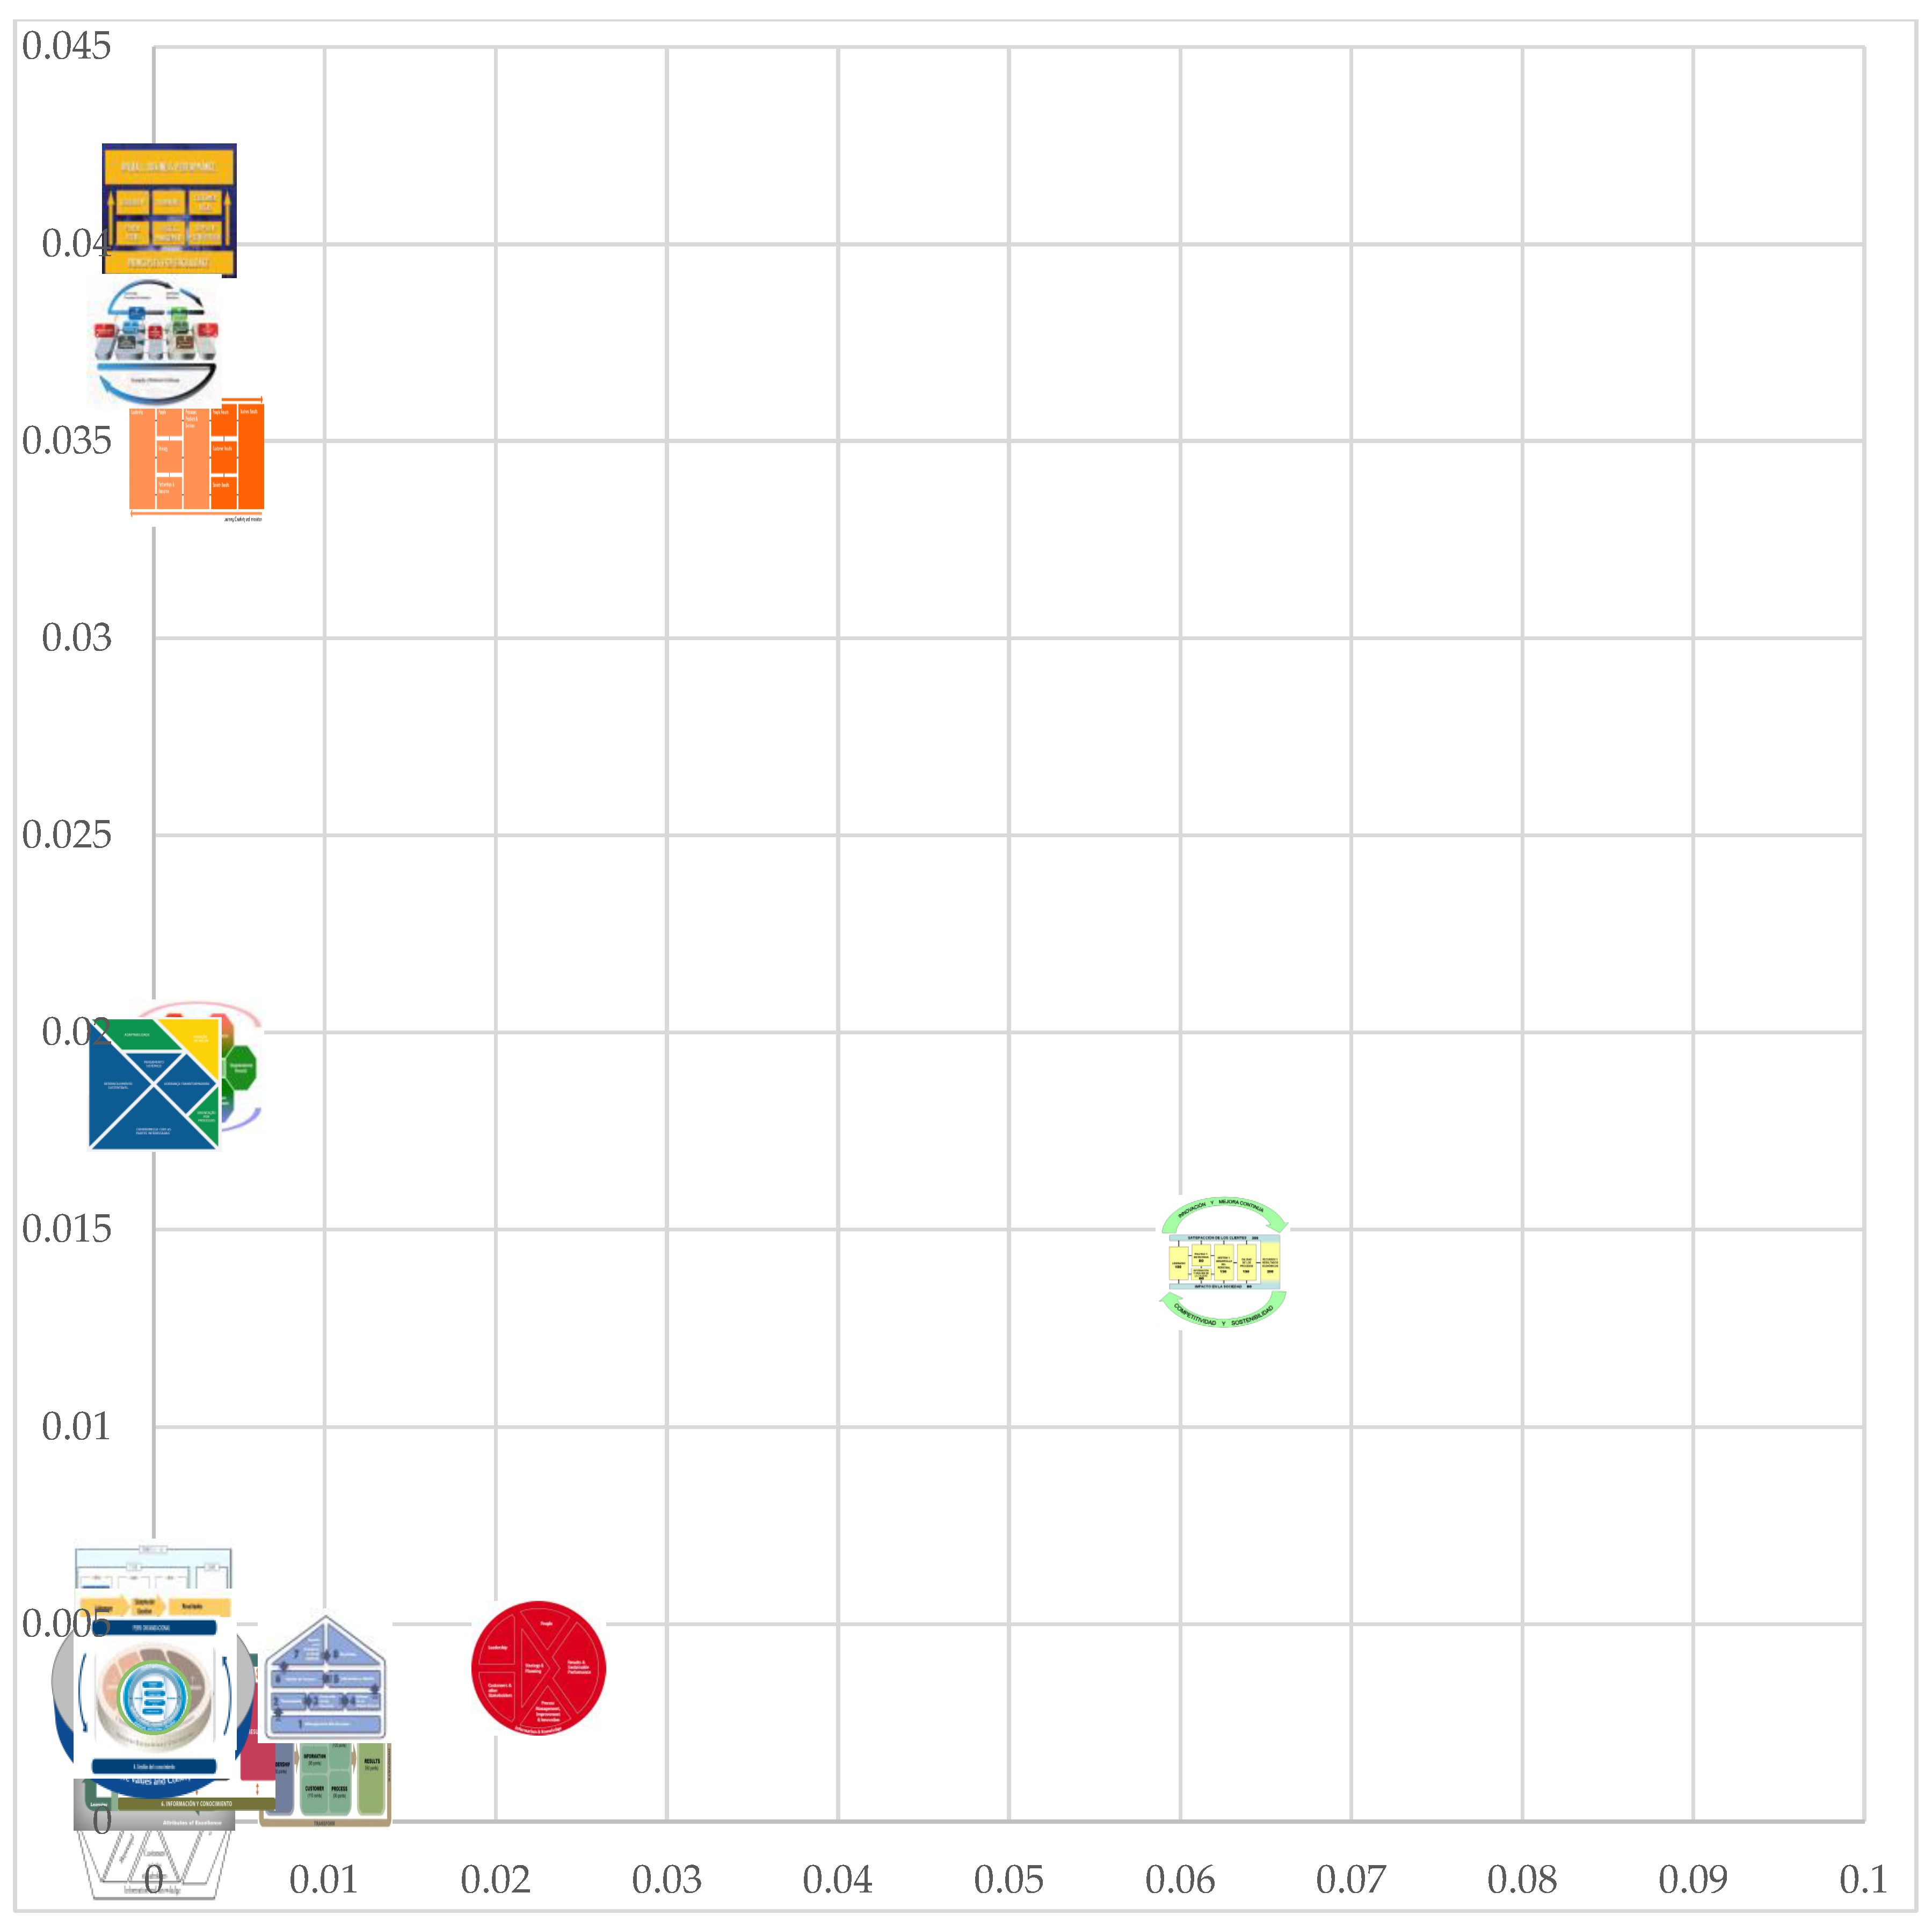
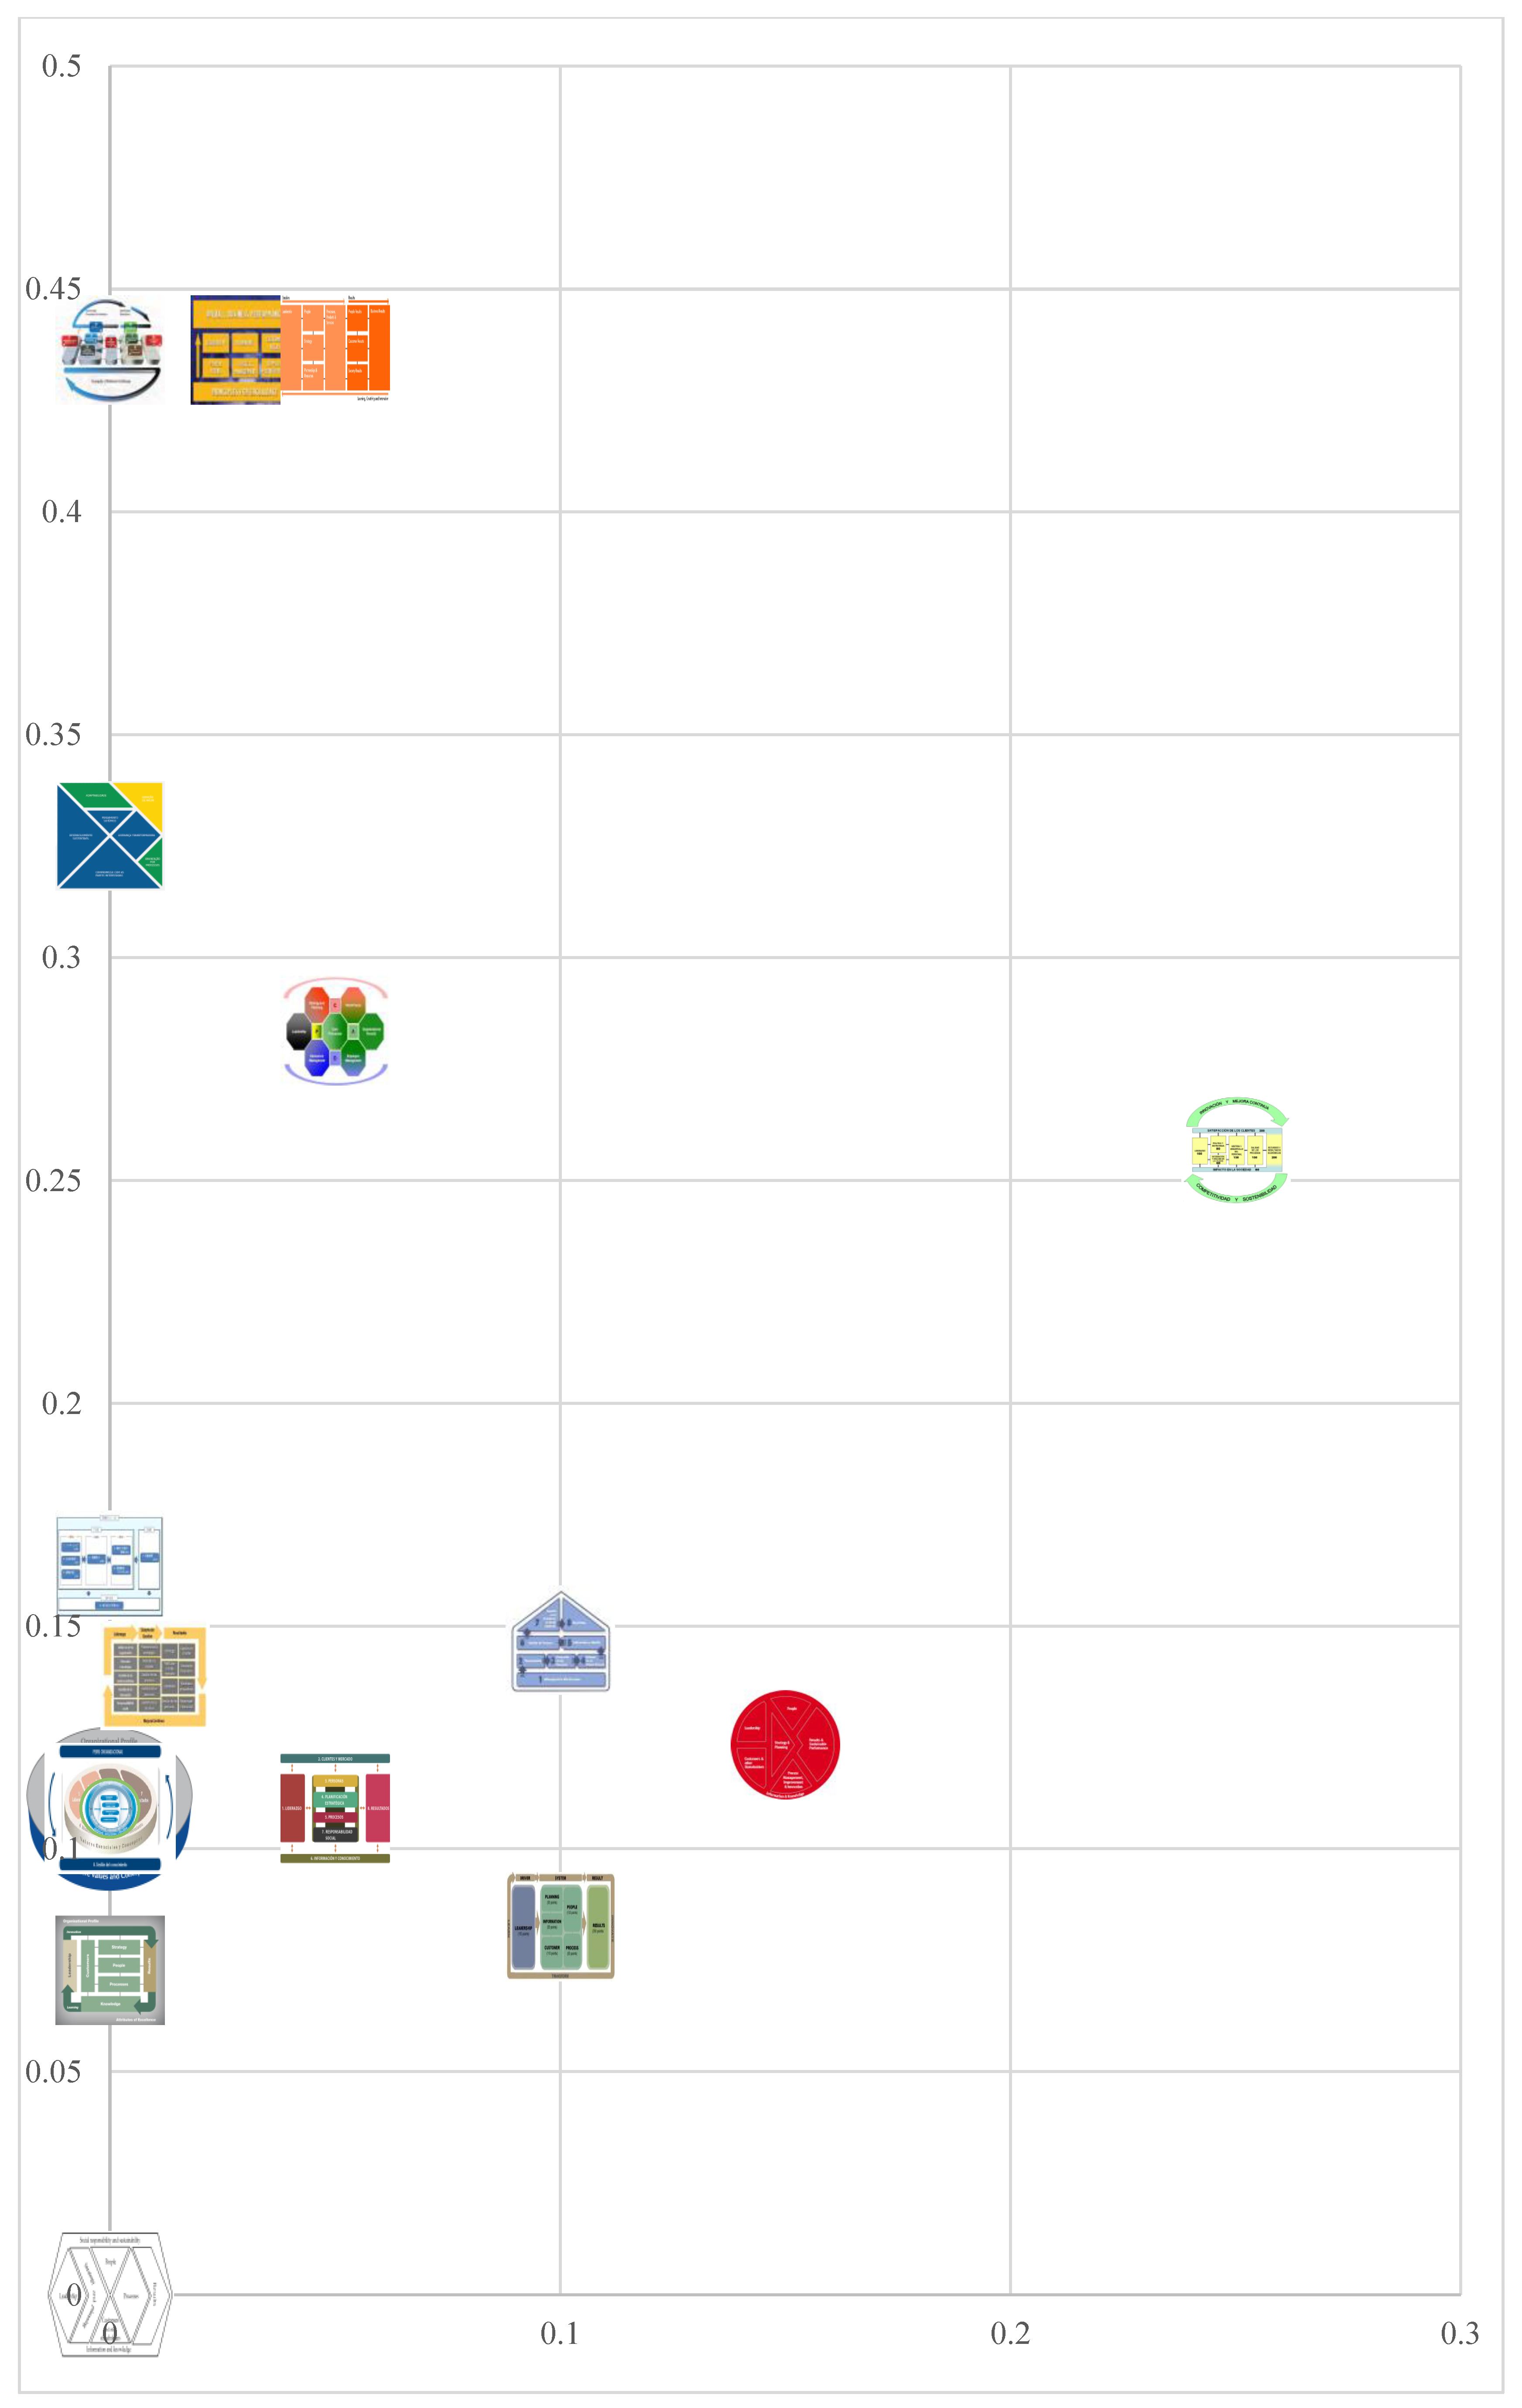
The proposed model (Figure 1) is then compared with the analysed models based on the calculation of their mutual distances. The following metrics are used to express the distance (Figure 2, Figure 3, Figure 4, Figure 5 and Figure 6 (In the Figure 2, Figure 3, Figure 4, Figure 5 and Figure 6 are used the symbols of the model from Table 10), Table 11):
The results of these findings are stated in the following part 4.
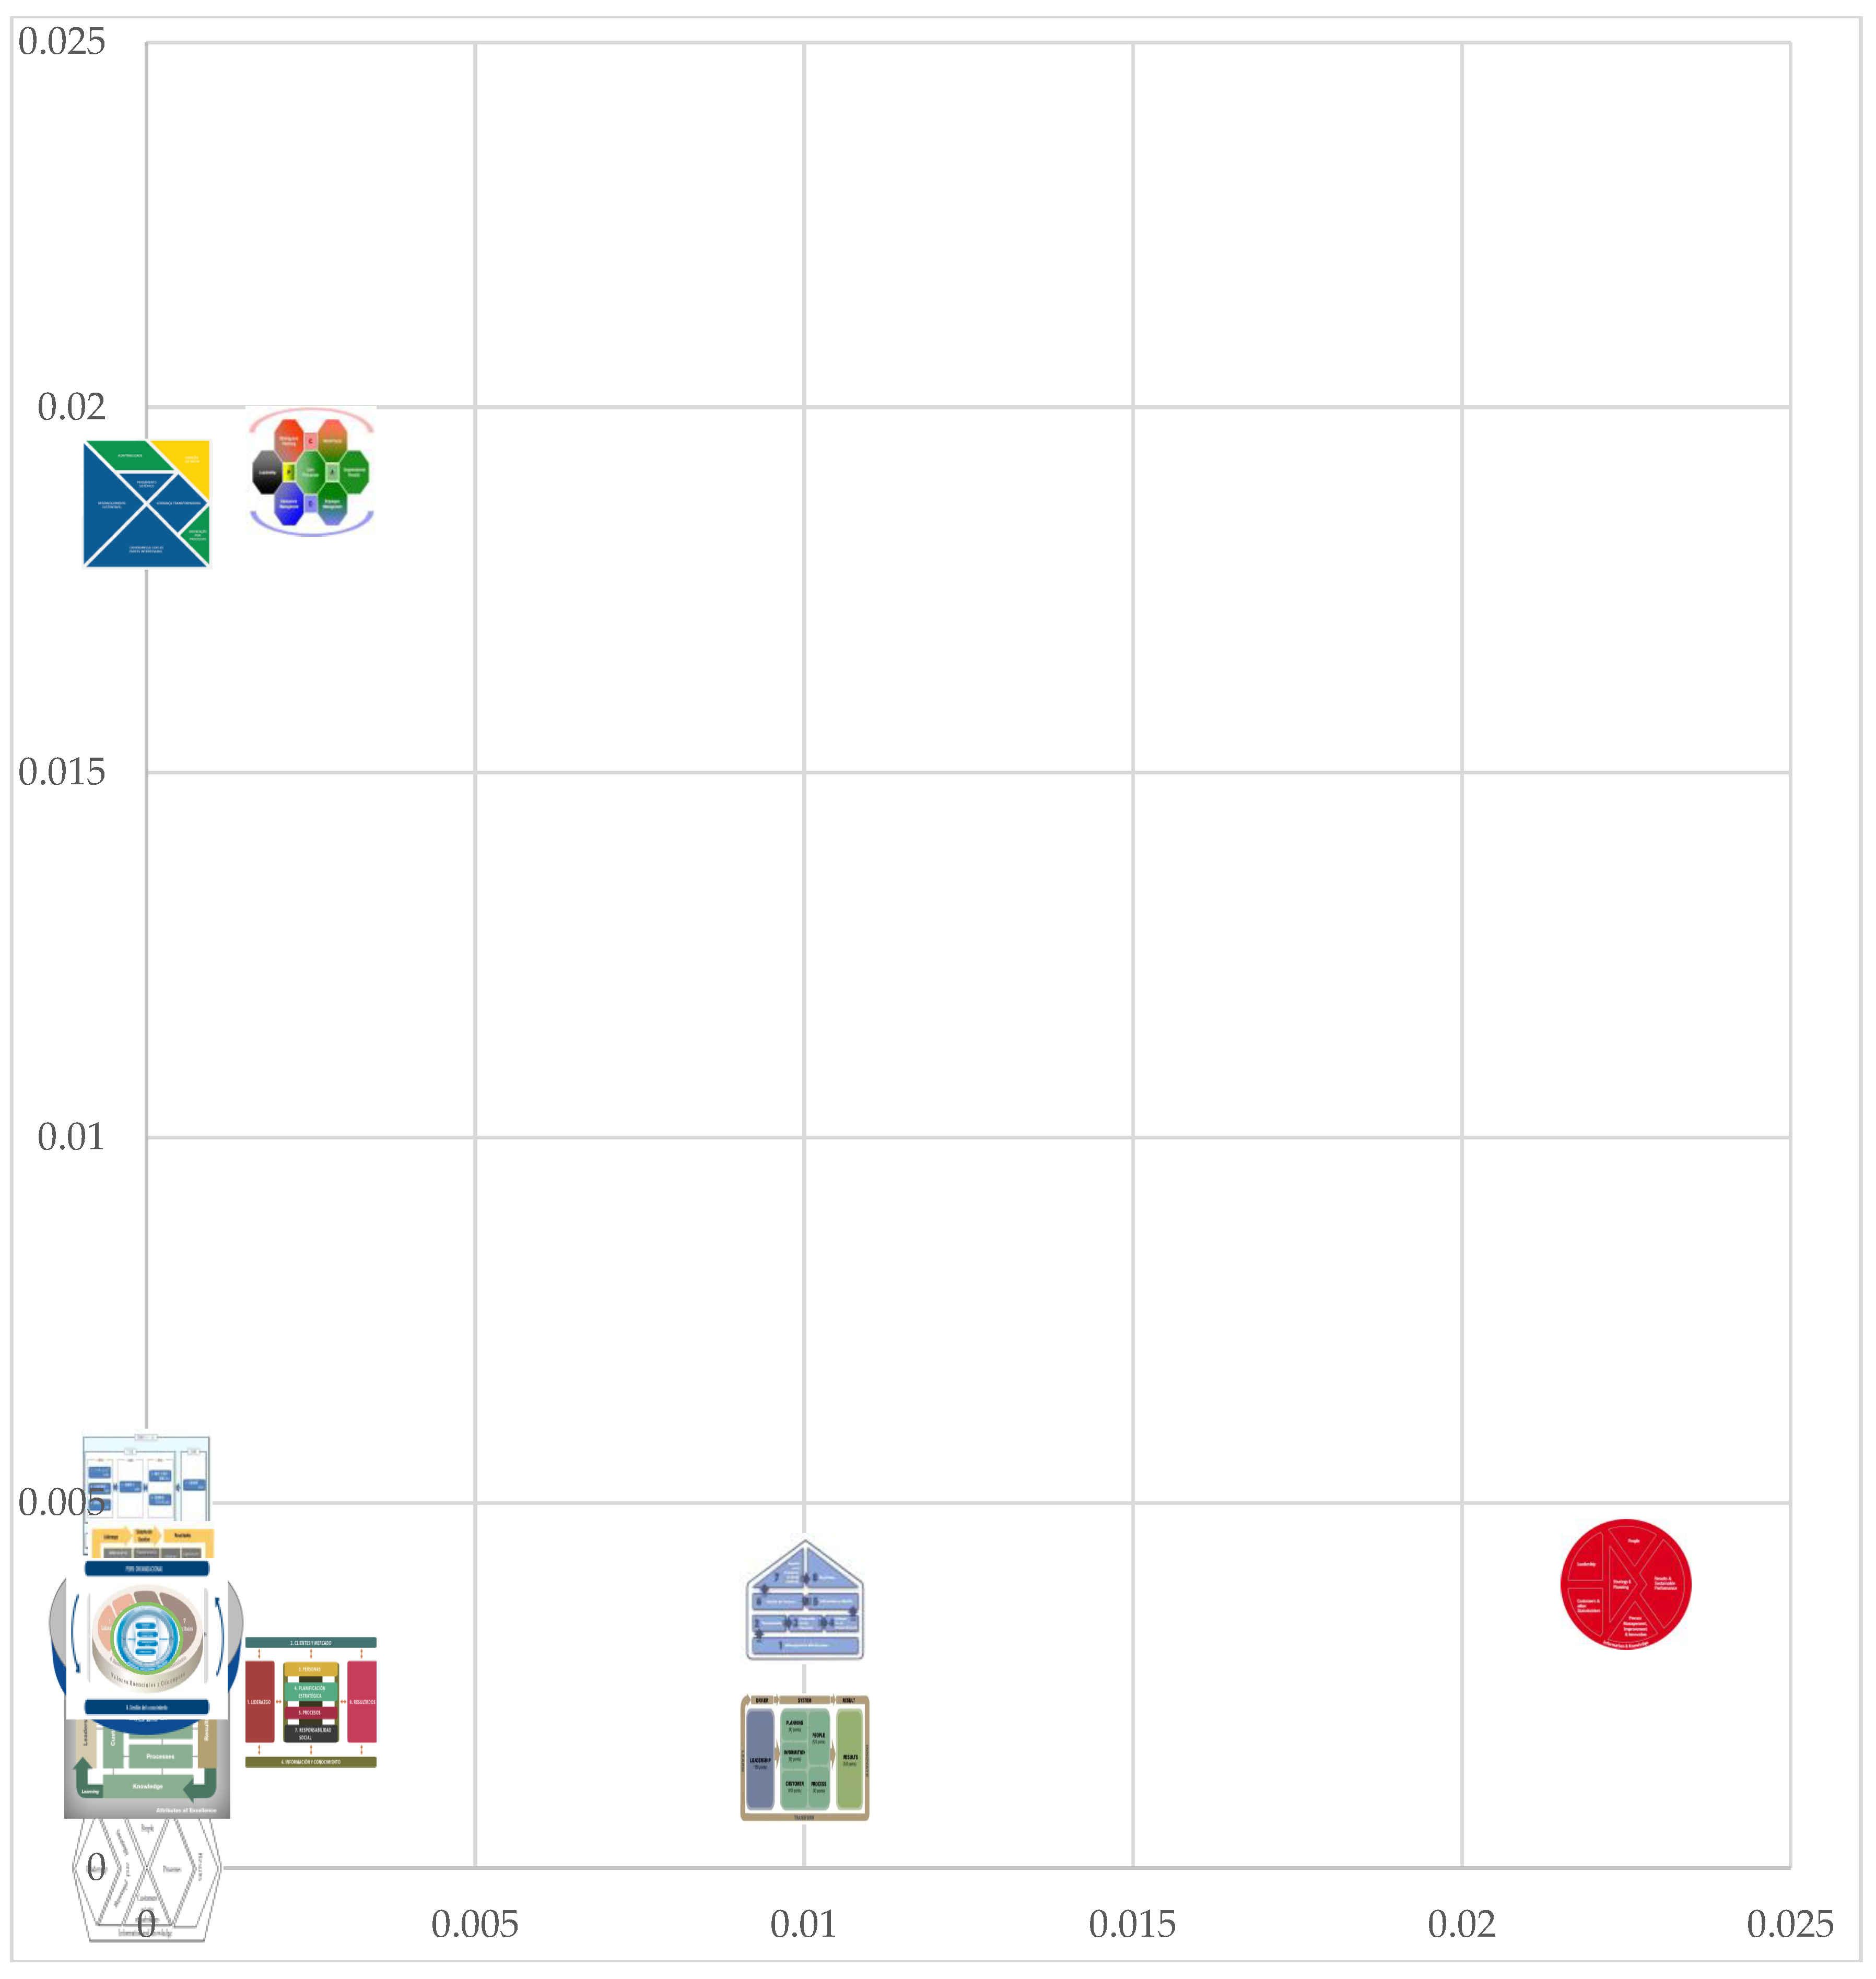
Due to the proximity of some models, only a portion of the resulting graph is used for better clarity (Figure 4).
4. Discussion
The main findings of this study are:
- All analysed models have criteria broken down into results and non-results (first findings), the non-results criteria are 6 on average (Table 1).Analysis of Business Excellence models has shown that only in two models (The EFQM Excellence Model, The South African Excellence Model) have results criteria the same weight ratio as the non-results criteria (50%:50%). In other models, the weight ratio of the results and non-results criteria is in the range of 20%:80% to 45%:55%.Finally, the calculated median suggests that the appropriate ratio between the results and non-results criteria is 45%:55%. The unequal representation of the results and non-results criteria is the outcome of the authors of the analysed models (experts from industry and academia), taking into account changes in the market place in the country—the differences between the models are the expression of the preferences of the individual research groups.
- The analysed models differ in the number and structure of criteria and sub-criteria (second findings).Although the Business Excellence models are based on similar principles, they differ in the number and structure of the criteria, respectively, sub-criteria (Table 1).Bassioni, Hassan and Price proposed The Business Excellence model divided into enabling and results criteria [88]. The enabling criteria include: leadership; customers and stakeholder focus; strategic management; information and analysis; people, partnerships, suppliers, physical resources, intellectual capital, risk, work culture, and process management. The results criteria include: internal stakeholder; project, external stakeholder; and organisational business results.Due to the different number of non-results criteria in the analysed models, the increasing importance of social responsibility and sustainability, the number of criteria listed in Table 1, we identified seven non-results criteria based on an in-depth analysis of the criteria and sub-criteria and we have analysed their points assessment in relation to identified criteria.Finally, as key criteria in the area of self-assessment, we propose seven non-results (enablers) criteria (Leadership; Strategy and planning; People; Customers and other stakeholders; Processes; Information and knowledge; Social responsibility and sustainability) and criterion results.
- The peculiarity of the analysed models is the placing of different importance on the individual criteria in the respective model (Table 1, Table 2, Table 3, Table 4, Table 5, Table 6, Table 7, Table 8 and Table 9)—third findings.According to the own comparative analysis, analysis of Business Excellence models has shown that only in the EFQM Excellence Model are all non-results criteria weighted equally. In other models, it is different.The scoring system of the EFQM Excellence Model has been shown to vary across industries and has been criticised as not corresponding to the way that companies are working ([88] in [89]). According to Bassioni, Hassan and Price, different methods for assessing the actual weights of the model’s criteria have been reported in literature [88]. For example, Eskildsen et al. used factor regression coefficients ([88] in [89]). Cheng and Li used the analytic hierarchy process (AHP) to determine the weights of performance measures of a business process ([90] in [89]). According to Eskildsen et al. any of the empirical approaches mentioned would be preferred to “an arbitrary weight structure, which has never been empirically tested”, as with the case of EFQM ([88] in [89]). In the research about the calculation of model criterion weights by Bassioni, Hassan and Price, the factor regression coefficients method was chosen because “it assesses the actual impact of each criterion on the organisation’s performance, whereas with AHP requires expert judgement data that can be obtained from the importance rating of each criterion, but might affect the accuracy of outcomes in the paired comparisons process, as well as reflecting the importance perception rather than actual impact” [89].According to Bassioni, Hassan and Price, it is difficult to assess which method is more accurate for the calculation of criterion weights [89]. According to the own comparative analysis, the calculated weightings of the criteria are: Leadership (90 points), Strategy and planning (75 points), People (90 points), Customers and other stakeholders (90 points), Processes (85 points), Information and knowledge (70 points), and Social responsibility and sustainability (50 points).Finally, what the studies illustrate is that the own opinion of each of the researcher brought a different view of the criterion weights. The methods used to calculate the weights of individual criteria are choice and opinion of experts from industry and academia—the differences between models are the expression of the preferences of the individual research groups.
- There are differences between the proposed model and the analysed models (Figure 2, Figure 3, Figure 4, Figure 5 and Figure 6; Table 11)The proposed model (Figure 1) was compared with the analysed models based on the calculation of their mutual distances. The four metrics were used to express the distance (The Euclidean distance, The Euclidean Squared distance, The Manhattan distance, The Chebyshev distance).The model, which (based on the calculation of mutual distances) was closest to the proposed model, is for all four metrics used: The Singapore Business Excellence Framework. In one case (The Chebyshev distance) shares the first place with: The Baldrige Excellence Framework (United States of America), Modelo de Excelencia en la Gestión (Kostarika), El Modelo de Excelencia en la Gestión (Peru), and El Modelo para una Gestión de Excelencia (San Salvador). This is, on the one hand, caused by the same ratio between the results and non-results criteria as the proposed model (45%:55%) and similar point distribution in the non-results criteria, as in the proposed model. The most distant model from the proposed is for all metrics used Modelo de Excelencia del Premio Nacional de Calidad de la República de Cuba. This is due to the diametrically different ratio between the results and the non-results criteria as the proposed model (20%:80%), which is different from the other analysed models too.Finally, based on the calculation of mutual distances, it is possible to compare not only analysed models with the proposed model, but also it is possible to compare the individual models. In graphical representation (Figure 2, Figure 3, Figure 4, Figure 5 and Figure 6), it is possible to identify clusters of models that have very similar (sometimes identical) structure (criteria of the model) and place similar/equal importance on the individual criteria of the model. Such cluster consists (for example based on the Euclidean distance) from following models: Japan Quality Award Framework (Japan), Modelo para una Gestión de Excelencia (Argentina), The Baldrige Excellence Framework (United States of America), Modelo de Excelencia en la Gestión (Costa Rica), El Modelo de Excelencia en la Gestión (Peru), El Modelo para una Gestión de Excelencia (San Salvador), and Singapore Business Excellence Framework (Singapore).
5. Conclusions
Although some individual companies have developed their own standards for corporate sustainability e.g., [91], there are no internationally established comprehensive management system standards for corporate sustainability available to date [44]. There are various tools (sustainability indices, sustainable development indicators, Business Excellence models) that can evaluate the sustainable development of companies, but only few of them have an integral approach considering environmental, economic, and social aspects. We agree with R. B. Pojasek [2], that acting responsibly is at the very core of the practice of sustainability and organizations must address three responsibilities: environmental, social, and economic.
Appropriate tools for the sustainability assessment are Business Excellence Models, because they do address sustainability [10,25,31,32,36,37,38,39,40,41,42,43,44,45]. The research problem was not the lack of such Business Excellence models, but the fact that not every model has an integral approach taking into account environmental, economic, and social aspects. Therefore, the aim of the paper was to review the selected Business Excellence Models and introduce a proposal to improve this type of models as being applicable for the sustainability assessment. When selecting models, we considered the fact that relationships between Business Excellence Models and sustainability were analysed by many authors [43,44,45], but were limited to fewer models, often only one or two (EFQM—[43]; EFQM, BCPE—[44]; MBNQA—[45]). The decision to analyse the widest possible number of Business Excellence Models (17 models) was to obtain more relevant information necessary to propose a model that is applicable for the sustainability assessment.
The main findings necessary for propose of the model were:
- all analysed models have criteria broken down into results and non-results, the non-results criteria are 6 on average,
- the analysed models differ in the number and structure of criteria and sub-criteria, and
- the peculiarity of the analysed models is the placing of different importance on the individual criteria in the respective model.
The main contribution of the proposed model is in the linking of proposed criteria with the sustainability (see Section 3.2), for examples, Leaders of an organization focus on the creation and development of ethical principles, address the consistency of expectations and sustainability. Since in most models there was no emphasis on Social responsibility and sustainability, which Asif, Searcy, Garvare and Ahmad [44] confirmed in their work, they stated: “In both excellence models, the development of sustainability indicators and sustainability reporting needs to be included”, we proposed this area as a separate criterion, and we also took into account this lack in the criterion Results. Similarly, Garvare and Isaksson [45], in their paper, stated: “Current models of business excellence, based on the values of total quality management, are not focusing on the concept of the Triple Bottom Line but have their drivers and enablers in the traditional context of the market economy”.
The limiting factor in the number of analysed models was the possibility of obtaining detailed information about the criteria, sub-criteria, and their point assessment that were needed for the analytical part. Future research in the field of Business Excellence models could, for example, be focused on the comparison of evaluation methodologies used in various Business Excellence Models.
The proposed model was compared with the analysed models based on the calculation of their mutual distances. The four metrics were used to express the distance (The Euclidean distance, The Euclidean Squared distance, The Manhattan distance, The Chebyshev distance). Managers can use the results of the calculation of mutual distances and identified clusters of models to compare their business with similar ones abroad, although they use a different Business Excellence Model for self-assessment.
Author Contributions
All authors contributed to writing the paper. M.J. documented the literature review, R.J. analysed the data, M.J. and R.J. wrote the paper. All authors were involved in the finalization of the submitted manuscript. All authors read and approved the final manuscript.
Funding
This research and APC was funded by The Ministry of Education, Science, Research and Sport of the Slovak Republic within the project VEGA 1/0653/18.
Conflicts of Interest
The authors declare no conflict of interest.
References
- Scottish Enterprise. Sustainable Business Models. Available online: https://ecoknights.org.my/images/doc/Sustainable-Business-Models.pdf (accessed on 1 October 2018).
- Pojasek, R.B. Understanding Sustainability: An Organizational Perspective. Environ. Qual. Manag. 2012, 21, 93–100. [Google Scholar] [CrossRef]
- Cooney, S. Build a Green Small Business: Profitable Ways to Become an Ecopreneur; McGraw-Hill: New York, NY, USA, 2008; p. 256. [Google Scholar]
- Bell, S.; Morse, S. Sustainability Indicators: Measuring the Immeasurable; Routledge: London, UK, 2008; p. 256. [Google Scholar]
- Dewan, M.N.A.; Chowdhury, M.M.H.; Quaddus, M.A. The Elements for Sustainable E-Business Modelling: A 3D Approach. PACIS 2012, 48. Available online: http://www.pacis-net.org/file/2012/PACIS2012-115.pdf (accessed on 1 October 2018).
- Sikdar, S.K. Sustainable development and sustainability metrics. AIChE J. 2003, 49, 1928–1932. Available online: https://onlinelibrary.wiley.com/doi/epdf/10.1002/aic.690490802 (accessed on 1 October 2018). [CrossRef] [Green Version]
- Carter, C.R.; Rogers, D.S. A framework of sustainable supply chain management: Moving toward new theory. Int. J. Phys. Distrib. Logist. Manag. 2008, 38, 360–387. Available online: https://www.researchgate.net/publication/230771054_A_Framework_of_Sustainable_Supply_Chain_Management_Moving_Toward_New_Theory (accessed on 28 September 2018). [CrossRef]
- Porter, M.E.; Kramer, M.R. Creating shared value. Harv. Bus. Rev. 2011, 89, 62–77. [Google Scholar]
- Emerson, J. The blended value proposition: Integrating social and financial results. Calif. Manag. Rev. 2003, 45, 35–51. Available online: http://www.blendedvalue.org/wp-content/uploads/2004/02/pdf-proposition.pdf (accessed on 28 September 2018). [CrossRef]
- Pojasek, R.B. A framework for business sustainability. Environ. Qual. Manag. 2007, 17, 81–88. [Google Scholar] [CrossRef]
- Silvius, G. Sustainability Integration for Effective Project Management: Practice, Progress, and Proficiency in Sustainability; IGI Global: Hershey, PA, USA, 2013; p. 482. [Google Scholar]
- Devuyst, D. How Green Is the City? Sustainability Assessment and the Management of Urban Environments; Columbia University Press: New York, NY, USA, 2001; p. 457. [Google Scholar]
- Verheem, R. Recommendations for Sustainability Assessment in the Netherlands. In Environmental Impact Assessment in The Netherlands: Views from the Commission for EIA in 2002; Commission for Environmental Impact Assessment: Utrecht, The Netherlands, 2002; p. 9. [Google Scholar]
- Sala, S.; Ciuffo, B.; Nijkamp, P. A systemic framework for sustainability assessment. Ecol. Econ. 2015, 119, 314–325. [Google Scholar] [CrossRef]
- Singh, R.K.; Murty, H.R.; Gupta, S.K.; Dikshit, A.K. An overview of sustainability assessment methodologies. Ecol. Indic. 2012, 15, 281–299. [Google Scholar] [CrossRef]
- Leonard, D.; McAdam, R. Corporate social responsibility. Qual. Prog. 2003, 36, 27–32. Available online: http://quality-texas.org/wp-content/uploads/2014/11/Social-Responsibility-Leonard.pdf (accessed on 21 December 2017).
- Planko, J.; Silvius, G. Sustainability in business. In Sustainability in Project Management; Silvius, G., Schipper, R., Planko, J., van den Brink, J., Köhler, A., Eds.; Gower Publishing Limited: Surrey, UK, 2012; pp. 7–20. [Google Scholar]
- Pojasek, R.B. Sustainability reports: An alternative view. Environ. Qual. Manag. 2009, 18, 85–92. [Google Scholar] [CrossRef]
- Bond, A.; Morrison-Saunders, A.; Pope, J. Sustainability assessment: The state of the art. Impact Assess. Proj. Apprais. 2012, 30, 53–62. [Google Scholar] [CrossRef]
- Talwar, B. Evolution of “Universal Business Excellence Model” incorporating Vedic philosophy. Meas. Bus. Excell. 2007, 11, 4–20. [Google Scholar]
- Morrison-Saunders, A.; Pope, J.; Bond, A. Handbook of Sustainability Assessment; Edward Elgar Publishing: Cheltenham Glos, UK, 2015; p. 488. [Google Scholar]
- Hacking, T.; Guthrie, P. A framework for clarifying the meaning of triple bottom-line, integrated, and sustainability assessment. Environ. Impact Assess. Rev. 2008, 28, 73–89. [Google Scholar] [CrossRef]
- Byrne, J.; Nyangon, J.; Deblauwe, H.; Chajes, O.; Shin, S.; Xu, J.; Taminiau, J.; Chajes, M.; Chajes, M.J. Measuring Urban Sustainability through Common Indicators and Peer City Benchmarking in Delaware. Final Report. 2017. Available online: https://www.researchgate.net/publication/324123298_Measuring_Urban_Sustainability_Through_Common_Indicators_and_Peer-City_Benchmarking_Assessing_Sustainability_Assets_for_Performance_Improvement_and_Economic_and_Environmental_Progress_in_Delaware (accessed on 1 October 2018).
- Krajnc, D.; Glavič, P. A model for integrated assessment of sustainable development. Resour. Conserv. Recycl. 2005, 43, 189–208. [Google Scholar] [CrossRef]
- Jankalová, M. Approaches to the Evaluation of Corporate Social Responsibility. Procedia Econ. Financ. 2016, 39, 580–587. [Google Scholar] [CrossRef]
- Sjöström, E. Investment Stewardship: Actors and Methods for Socially and Environmentally Responsible Investments; Nordic Partnership in collaboration with the Stockholm School of Economics: Stockholm, Sweden, 2004. [Google Scholar]
- Holt, D.; Kido, A.; Kolind, K.; Mitchell, C.; Song, J.; Swartz, R. Measuring Sustainability; University of North Carolina, Kenan-Flagler Business School: Chapel Hill, NC, USA, 2004. [Google Scholar]
- Hamner, B. Integrating Market-Based Sustainability Indicators and Performance Management Systems; Cleaner Production International: Seattle, WA, USA, 2005. [Google Scholar]
- Beurden, V.P.; Gossling, T. The Worth of Values—A Literature Review on the Relation Between Corporate Social and Financial Performance. J. Bus. Ethics 2008, 82, 407–424. [Google Scholar] [CrossRef]
- Cerin, P.; Dobers, P. The contribution of sustainable investments to sustainable development. Prog. Ind. Ecol. Int. J. 2008, 5, 161–179. [Google Scholar] [CrossRef]
- Avlonas, N. The EFQM Framework for Corporate Social Responsibility. Available online: http://www.das-nachhaltige-krankenhaus.at/Dokumente/docs/EFQMCSRFrameworkECOPF.pdf (accessed on 8 January 2018).
- Jankalová, M.; Jankal, R. The assessment of corporate social responsibility: Approaches analysis. Entrep. Sustain. Issues 2017, 4, 441–459. [Google Scholar] [CrossRef]
- Kašparová, K. Společenská zodpovědnost podniku—Způsoby jejího měření a vztah k finanční výkonnosti podniku. In Proceedings of the Vývojové Tendence Podniků II; Masarykova Univerzita: Brno, Czech Republic, 2006; pp. 159–217. [Google Scholar]
- Koellner, T.; Weber, O.; Fenchel, M.; Scholz, R. Principles for sustainability rating of investment funds. Bus. Strat. Environ. 2005, 14, 54–70. [Google Scholar] [CrossRef]
- Comincioli, N.; Poddi, L.; Vergalli, S. Corporate Social Responsibility and Firms’ Performance: A Stratigraphical Analysis. Available online: http://papers.ssrn.com/sol3/papers.cfm?abstract_id=2132202 (accessed on 31 January 2018).
- Abuhejleh, A.; Yehia, S. EFQM Framework for Corporate Social Responsibility in Healthcare Sector. Int. J. Bus. Quant. Econ. Appl. Manag. Res. 2014, 1, 46–67. [Google Scholar]
- Gorenak, Š. European Foundation for Quality Management Excellence Model Can Encourage ISO 26000 Implementation. In Perspectives on Business and Management; Bobek, V., Ed.; InTech: Rijeka, Croatia, 2015; pp. 23–43. [Google Scholar]
- Fibuch, E.; Van Way, C. Sustainability: A Fiduciary Responsibility of Senior Leaders? Phys. Exec. 2012, 38, 36–43. [Google Scholar]
- Foote, J.; Gaffney, N.; Evans, J.R. Corporate social responsibility: Implications for performance excellence. Total Qual. Manag. 2010, 21, 799–812. [Google Scholar] [CrossRef]
- Jonker, J.; Eskildsen, J. Management Models for the Future; Springer: Berlin, Germany, 2009. [Google Scholar]
- Thiengnoi, P.; Afzal, S. A Comparative Analysis of CSR Strategies, Implementation and Outcomes—A Qualitative Case Study of IKEA, Starbucks and H&M. Master’s Thesis, Faculty of Economic Sciences, Communication and IT of Karlstads University, Karlstad, Sweden, 2009. [Google Scholar]
- Neergaard, P.; Pedersen, E.R. The Business Excellence Model for CSR Implementation? Nang Yan Bus. J. 2012, 1, 54–59. [Google Scholar] [CrossRef]
- Adamek, P. An Investigation of Interconnection between Business Excellence Models and Corporate Sustainability Approach. Eur. J. Sustain. Dev. 2018, 7, 381–394. [Google Scholar] [CrossRef]
- Asif, M.; Searcy, C.; Garvare, R.; Ahmad, N. Including sustainability in business excellence models. Total Qual. Manag. Bus. Excell. 2011, 22, 773–786. [Google Scholar] [CrossRef]
- Garvare, R.; Isaksson, R. Sustainable development: Extending the scope of business excellence models. Meas. Bus. Excell. 2001, 5, 11–15. [Google Scholar] [CrossRef]
- Business Excellence Models. Available online: http://www.bpir.com/total-quality-management-business-excellence-models-bpir.com.html (accessed on 4 November 2017).
- EFQM. EFQM Framework for Sustainability; EFQM: Brussels, Belgium, 2015. [Google Scholar]
- Arabia CSR Network. About Us. Available online: http://www.arabiacsrnetwork.com/pages/about-us (accessed on 4 November 2017).
- Trebuňa, P.; Halčínová, J. Principles of cluster analysis. In Proceedings of the 13th International Scientific Conference Trends and Innovative Approaches in Business Processes, Košice, Slovakia, 8 December 2010; Available online: https://www.sjf.tuke.sk/umpadi/taipvpp/2010/index.files/clanky%20PDF/TREBUNA_HALCINOVA.pdf (accessed on 10 February 2018).
- Trebuňa, P.; Halčínová, J.; Kliment, M.; Markovič, J.; Fiľo, M. Determination of Distance Metrics (Dissimilarity) of Objects in Cluster Analysis. In Proceedings of the 16th International Scientific Conference Trends and Innovative Approaches in Business Processes, Košice, Slovakia, 7–8 November 2013; Available online: https://www.sjf.tuke.sk/umpadi/taipvpp/2013/journal/8_TREBUNA_HALCINOVA_KLIMENT_MARKOVIC_FILO_STANOVENIE.pdf (accessed on 10 February 2018).
- CDI. El Modelo de Excelencia en la Gestión. Available online: http://www.cdi.org.pe/pdf/PNC_2017/PNC2018.pdf (accessed on 5 February 2018).
- ChileCalidad. Guía de Autoevaluación del Sistema Escalonado de Mejora Continua. Available online: http://media.wix.com/ugd/62a27a_782d414adef64af8fc51c6dae1db26b5.pdf (accessed on 5 January 2018).
- ChileCalidad. Modelo de Gestión de Excelencia. Santiago-Chile. Available online: http://media.wix.com/ugd/62a27a_17affa25b64d1917f8a5b51dd72525fa.pdf (accessed on 5 January 2018).
- ChileCalidad. Modelo Chileno de Gestión de Excelencia. Available online: http://www.chilecalidad.cl/#!products/cfvg (accessed on 5 January 2018).
- EFQM. EFQM Excellence Model 2013; EFQM Representative Office: Brussels, Belgium, 2012; ISBN 978-90-5236-670-8. [Google Scholar]
- EFQM. Fundamental Concepts. Available online: http://www.efqm.org/efqm-model/fundamental-concepts (accessed on 15 December 2017).
- EFQM. Model Criteria—Enablers. Available online: http://www.efqm.org/efqm-model/criteria/enablers (accessed on 15 December 2017).
- Enterprise Singapore. Business Excellence Framework. Available online: https://spring.enterprisesg.gov.sg/Building-Trust/Business-Excellence/Documents/BE_Framework.pdf (accessed on 5 April 2018).
- ES Calidad. Modelo para una Gestión de Excelencia. Available online: http://premiocalidad.presidencia.gob.sv/descargar/2615/ (accessed on 10 January 2018).
- Excellence Canada. Organizational Excellence Assessment Training Course; Excellence Canada: Toronto, ON, Canada, 2011. [Google Scholar]
- Excellence Canada. Canadian Framework for Business Excellence—Overview Document. Available online: http://excellence.ca/assets/files/products/fbe_overview2007.pdf (accessed on 18 December 2017).
- FNQ. Modelo de Excelência da Gestão. Fundamentos. Available online: http://fnq.org.br/avalie-se/melhores_em_gestao/ciclo-de-premiacao/modelo-de-excelencia-da-gestao (accessed on 18 December 2017).
- FNQ. Modelo de Excelência da Gestão. Um Guia de Referência da Gestão para Excelência. Available online: http://fnq.org.br/aprenda/metodologia-meg/modelo-de-excelencia-da-gestao (accessed on 18 December 2017).
- FNQ. Pontuações Máximas. Available online: http://fnq.org.br/avalie-se/melhores_em_gestao/ciclo-de-premiacao/pontuacoes-maximas (accessed on 18 December 2017).
- FPNC. Modelo para una Gestión de Excelencia—Empresas. Available online: http://fpnc.org.ar/wp-content/files/MODELO_PNC_EMPRESAS_2017.pdf (accessed on 18 December 2017).
- FUNDIBEQ. Modelo Iberoamericano de Excelencia en la Gestión. Available online: http://www.fundibeq.org/images/pdf/Modelo_Iberoamericano_v2015_FUNDIBEQ-ES.pdf (accessed on 18 December 2017).
- FUNDIBEQ. Valores. Available online: http://fundibeq.org/fundibeq/valores (accessed on 18 December 2017).
- INACAL. Modelo de Mejora Continua: Premio Nacional de Calidad. Available online: http://www.inacal.org.uy/files/userfiles/mmc_web.pdf (accessed on 16 December 2017).
- JQAC. Japan Quality Award. Available online: http://www.jqac.com/contents/img/f_users/r_131517032img20170309170032.pdf (accessed on 10 January 2018).
- JQAC. Japan Quality Award Framework. Available online: http://www.jqac.com/contents/index.asp?patten_cd=12&page_no=22 (accessed on 10 January 2018).
- MIDEPLAN. Bases de Premio Nacional a la Calidad. Available online: https://documentos.mideplan.go.cr/share/s/IlTpUt6mSauR-w6bR7-ZMg (accessed on 16 December 2017).
- MITI. AKI Assessment Criteria. Available online: http://www.miti.gov.my/miti/resources/8.Assessment_Criteria(Questionnaire)_pdf (accessed on 10 January 2018).
- MITI. AKI Booklet; MITI: Kuala Lumpur, Malaysia. Available online: http://www.miti.gov.my/miti/resources/BOOKLET_AKI_2018.pdf (accessed on 10 January 2018).
- MPC. Business Excellence Programme: Journey Towards Enhancing Productivity & Competitiveness; Malaysia Productivity Corporation: Petaling Jaya, Malaysia, 2011. [Google Scholar]
- MPC. Malaysia Business Excellence Framework. Available online: http://www.mpc.gov.my/malaysia-business-excellence-framework/ (accessed on 16 December 2017).
- NIST. Baldridge Excellence Builder. Key Questions for Improving Your Organization’s Performance. Available online: https://www.nist.gov/sites/default/files/documents/2017/02/09/2017-2018-baldrige-excellence-builder.pdf (accessed on 18 December 2017).
- NIST. 2017–2018 Baldrige Excellence Framework: A Systems Approach to Improving Your Organization’s Performance; National Institute of Standards and Technology: Gaithersburg, MD, USA, 2017.
- NIST. 2017–2018 Baldrige Performance Excellence Framework: Criteria Commentary. Available online: https://www.nist.gov/sites/default/files/documents/2016/12/13/2017-2018-category-and-item-commentary-bnp.pdf (accessed on 18 December 2017).
- NQI. Canadian Framework for Business Excellence—Overview Document; National Quality Institute: Toronto, ON, Canada, 2007. [Google Scholar]
- ONN. Premio Nacional de Calidad de la República de Cuba. Available online: http://www.nc.cubaindustria.cu/index.php/component/jdownloads/send/7-archivos-de-interes/89-bases-del-premio-nacional-de-calidad (accessed on 15 February 2018).
- Porter, L.J.; Tanner, S.J. Assessing Business Excellence, 2nd ed.; Routledge: New York, NY, USA, 2011; ISBN 978-0-7506-5517-0. [Google Scholar]
- SAI Global. GB02-2011 the Australian Business Excellence Framework; SAI Global: Sydney, Australia, 2011; ISBN 1-921093-60-9. [Google Scholar]
- SAI Global. 2012 Australian Business Excellence Awards Applications Guidelines; SAI Global: Sydney, Australia, 2012. [Google Scholar]
- SAI Global. Australian Business Excellence Framework. Available online: https://www.saiglobal.com/improve/excellencemodels/businessexcellenceframework/ (accessed on 17 December 2017).
- Schaefer, C. A New Model for Excellence in South Africa. Available online: http://nistbaldrige.blogs.govdelivery.com/2014/08/14/a-new-model-for-excellence-in-south-africa/ (accessed on 10 December 2017).
- Van den Heever, J. SAEMXIII Launch v6. Available online: http://www.slideshare.net/EdvandenHeever/saemxiii-launch-v6-45643706 (accessed on 10 December 2017).
- Van den Heever, J. The New South African Excellence Model: Incorporation of ‘PDCA’ and ‘RTCK’ elements using Causality Based Assessment Scoring. Oakbrook Bus. Rev. 2015, 1, 11–15. [Google Scholar]
- Bassioni, H.A.; Hassan, T.M.; Price, A.D.F. Evaluation and analysis of criteria and sub-criteria of a construction excellence model. Eng. Constr. Archit. Manag. 2008, 15, 21–41. [Google Scholar] [CrossRef]
- Eskildsen, J.K.; Kristensen, K.; Juhl, H.J. The criterion weights of the EFQM excellence model. Int. J. Qual. Reliab. Manag. 2001, 18, 783–795. [Google Scholar] [CrossRef]
- Cheng, E.W.L.; Li, H. Analytic hierarchy process: An approach to determine measures for business performance. Meas. Bus. Excell. 2001, 5, 30–37. [Google Scholar] [CrossRef]
- Zhao, F. Siemens’ business excellence model and sustainable development. Meas. Bus. Excell. 2004, 8, 55–64. [Google Scholar] [CrossRef]
Figure 1.
Proposed Business Excellence model.
Figure 2.
The Euclidean distance of Business Excellence models.
Figure 3.
The Euclidean Squared distance of Business Excellence models.
Figure 4.
The Euclidean Squared distance of Business Excellence models-focus.

Figure 5.
The Manhattan distance of Business Excellence models.

Figure 6.
The Chebyshev distance of Business Excellence models.

Table 1.
View of points and weights of results and non-results criteria of selected Business Excellence models.
Table 1.
View of points and weights of results and non-results criteria of selected Business Excellence models.
| The Business Excellence Models | Results Criteria | Non-Results Criteria | |||
|---|---|---|---|---|---|
| Points | % | Points | % | Number of Criteria | |
| Modelo para una Gestión de Excelencia (Argentina) | 440 | 44.00 | 560 | 56.00 | 6 |
| Australian Business Excellence Framework (Australia) | 300 | 30.00 | 700 | 70.00 | 6 |
| Modelo de Excelência da Gestão (Brazil) | 450 | 45.00 | 550 | 55.00 | 7 |
| Canadian Framework for Business Excellence (Canada) | 420 | 42.00 | 580 | 58.00 | 6 |
| Modelo Chileno de Gestión de Excelencia (Chile) | 400 | 40.00 | 600 | 60.00 | 7 |
| Modelo de Excelencia en la Gestión (Costa Rica) | 450 | 45.00 | 550 | 55.00 | 6 |
| Modelo de Excelencia del Premio Nacional de Calidad de la República de Cuba (Cuba) | 200 | 20.00 | 800 | 80.00 | 7 |
| The EFQM Excellence Model (Europe) | 500 | 50.00 | 500 | 50.00 | 5 |
| Modelo Iberoamericano de Excelencia en la Gestión (Ibero-America) | 450 | 45.00 | 550 | 55.00 | 5 |
| Japan Quality Award Framework (Japan) | 450 | 45.00 | 550 | 55.00 | 7 |
| Malaysia Business Excellence Framework (Malaysia) | 350 | 35.00 | 650 | 65.00 | 6 |
| El Modelo de Excelencia en la Gestión (Peru) | 450 | 45.00 | 550 | 55.00 | 6 |
| El Modelo para una Gestión de Excelencia (San Salvador) | 450 | 45.00 | 550 | 55.00 | 6 |
| Singapore Business Excellence Framework (Singapore) | 450 | 45.00 | 550 | 55.00 | 6 |
| South African Excellence Model (South Africa) | 500 | 50.00 | 500 | 50.00 | 6 |
| The Baldrige Excellence Framework (United States of America) | 450 | 45.00 | 550 | 55.00 | 6 |
| Modelo de Mejora Continua (Uruguay) | 350 | 35.00 | 650 | 65.00 | 7 |
| minimum | 200 | 20.00 | 500 | 50.00 | 5 |
| maximum | 500 | 50.00 | 800 | 80.00 | 7 |
| average | 415.294 | 41.53 | 584.706 | 58.47 | 6.176 |
| median | 450 | 45.00 | 550 | 55.00 | 6 |
| lower quartile | 400 | 40.00 | 550 | 55.00 | 6 |
| upper quartile | 450 | 45.00 | 600 | 60.00 | 7 |
Table 2.
The result of the Leadership criterion scoring analysis of selected Business Excellence Models.
Table 2.
The result of the Leadership criterion scoring analysis of selected Business Excellence Models.
| The Statistical Characteristic | Leadership | |
|---|---|---|
| Points | % | |
| minimum | 70 | 12.50 |
| maximum | 120 | 21.82 |
| average | 93.53 | 16.19 |
| median | 100 | 16.36 |
| lower quartile | 90 | 12.73 |
| upper quartile | 100 | 18.33 |
Table 3.
The result of the Strategy and planning criterion scoring analysis of selected Business Excellence Models.
Table 3.
The result of the Strategy and planning criterion scoring analysis of selected Business Excellence Models.
| The Statistical Characteristic | Strategy and Planning | |
|---|---|---|
| Points | % | |
| minimum | 45 | 8.18 |
| maximum | 120 | 21.82 |
| average | 80.59 | 13.94 |
| median | 80 | 13.85 |
| lower quartile | 80 | 12.31 |
| upper quartile | 85 | 15.45 |
Table 4.
The result of the People criterion scoring analysis of selected Business Excellence Models.
Table 4.
The result of the People criterion scoring analysis of selected Business Excellence Models.
| The Statistical Characteristic | People | |
|---|---|---|
| Points | % | |
| minimum | 45 | 8.18 |
| maximum | 140 | 24.14 |
| average | 99.12 | 16.97 |
| median | 100 | 16.36 |
| lower quartile | 85 | 15.45 |
| upper quartile | 110 | 18.46 |
Table 5.
The result of the Customers and other stakeholders’ criterion scoring analysis of selected Business Excellence Models.
Table 5.
The result of the Customers and other stakeholders’ criterion scoring analysis of selected Business Excellence Models.
| The Statistical Characteristic | Customers and Other Stakeholders | |
|---|---|---|
| Points | % | |
| minimum | 60 | 12.00 |
| maximum | 200 | 25.86 |
| average | 107.06 | 18.09 |
| median | 100 | 16.92 |
| lower quartile | 85 | 15.45 |
| upper quartile | 110 | 20.00 |
Table 6.
The result of the Processes criterion scoring analysis of selected Business Excellence Models.
Table 6.
The result of the Processes criterion scoring analysis of selected Business Excellence Models.
| The Statistical Characteristic | Processes | |
|---|---|---|
| Points | % | |
| minimum | 70 | 12.73 |
| maximum | 150 | 24.00 |
| average | 98.82 | 16.95 |
| median | 90 | 16.07 |
| lower quartile | 85 | 15.45 |
| upper quartile | 110 | 18.75 |
Table 7.
The result of the Information and knowledge criterion scoring analysis of selected Business Excellence Models.
Table 7.
The result of the Information and knowledge criterion scoring analysis of selected Business Excellence Models.
| The Statistical Characteristic | Information and Knowledge | |
|---|---|---|
| Points | % | |
| minimum | 50 | 7.50 |
| maximum | 95 | 16.36 |
| average | 78.21 | 13.38 |
| median | 85 | 13.71 |
| lower quartile | 62.5 | 12.18 |
| upper quartile | 90 | 16.29 |
Table 8.
The result of the Social responsibility and sustainability criterion scoring analysis of selected Business Excellence Models.
Table 8.
The result of the Social responsibility and sustainability criterion scoring analysis of selected Business Excellence Models.
| The Statistical Characteristic | Social Responsibility and Sustainability | |
|---|---|---|
| Points | % | |
| minimum | 30 | 5.36 |
| maximum | 80 | 12.73 |
| average | 53.85 | 8.93 |
| median | 50 | 9.09 |
| lower quartile | 50 | 9.09 |
| upper quartile | 60 | 10.00 |
Table 9.
Overview of the analysis of selected Business Excellence Models.
| Median | Average | Number of Models with Highest Weight of the Criterion | Highest Percentage Weight | Highest Point Score | |
|---|---|---|---|---|---|
| Customers and other stakeholders | 16.92% | 18.09% | 8 | 25.86% | 200 |
| Leadership | 16.36% | 16.19% | 5 | 21.82% | 120 |
| People | 16.36% | 16.97% | 5 | 24.14% | 140 |
| Processes | 16.07% | 16.95% | 4 | 24.00% | 150 |
| Strategy and planning | 13.85% | 13.94% | 2 | 21.82% | 120 |
| Information and knowledge | 13.71% | 13.38% | 4 | 16.36% | 95 |
| Social responsibility and sustainability | 9.09% | 8.93% | 0 | 12.73% | 80 |
Table 10.
Symbols of the Business Excellence models.
| The Business Excellence Models | Symbol |
|---|---|
| Australian Business Excellence Framework (Australia) |  |
| Singapore Business Excellence Framework (Singapore) |  |
| Malaysia Business Excellence Framework (Malaysia) |  |
| Canadian Framework for Business Excellence (Canada) |  |
| South African Excellence Model (South Africa) |  |
| Modelo Chileno de Gestión de Excelencia (Chile) |  |
| Modelo de Excelência da Gestão (Brazil) |  |
| The Baldrige Excellence Framework (United States of America) |  |
| The EFQM Excellence Model (Europe) |  |
| Japan Quality Award Framework (Japan) |  |
| Modelo para una Gestión de Excelencia (Argentina) |  |
| Modelo de Excelencia en la Gestión (Costa Rica) |  |
| Modelo de Excelencia del Premio Nacional de Calidad de la República de Cuba (Cuba) |  |
| Modelo de Mejora Continua (Uruguay) |  |
| Modelo Iberoamericano de Excelencia en la Gestión (Ibero-America) |  |
| El Modelo de Excelencia en la Gestión (Peru) |  |
| El Modelo para una Gestión de Excelencia (San Salvador) |  |
| Proposed Business Excellence model |  |
Table 11.
Distance of selected Business Excellence models from proposed Business Excellence model.
| The Business Excellence Models | The Euclidean Distance | The Euclidean Squared Distance | The Manhattan Distance | The Chebyshev Distance |
|---|---|---|---|---|
| Australian Business Excellence Framework (Australia) | 0.162440227 | 0.000521357 | 0.273376623 | 0.15 |
| Singapore Business Excellence Framework (Singapore) | 0.042640143 | 3.30579 × 10⁻⁶ | 0.072727273 | 0.036363636 |
| Malaysia Business Excellence Framework (Malaysia) | 0.107216732 | 0.000102236 | 0.182517483 | 0.1 |
| Canadian Framework for Business Excellence (Canada) | 0.204306119 | 0.001668796 | 0.466363636 | 0.127272727 |
| South African Excellence Model (South Africa) | 0.147062139 | 0.000372103 | 0.333636364 | 0.090909091 |
| Modelo Chileno de Gestión de Excelencia (Chile) | 0.069084928 | 1.14153 × 10⁻⁵ | 0.159090909 | 0.05 |
| Modelo de Excelência da Gestão (Brazil) | 0.136666331 | 0.000348856 | 0.327272727 | 0.081818182 |
| The Baldrige Excellence Framework (United States of America) | 0.056040127 | 9.86271 × 10⁻⁶ | 0.109090909 | 0.036363636 |
| The EFQM Excellence Model (Europe) | 0.192471958 | 0.001199638 | 0.486363636 | 0.127272727 |
| Japan Quality Award Framework (Japan) | 0.07158189 | 2.6255 × 10⁻⁵ | 0.163636364 | 0.045454545 |
| Modelo para una Gestión de Excelencia (Argentina) | 0.06292057 | 1.49019 × 10⁻⁵ | 0.148961039 | 0.037337662 |
| Modelo de Excelencia en la Gestión (Costa Rica) | 0.056040127 | 9.86271 × 10⁻⁶ | 0.109090909 | 0.036363636 |
| Modelo de Excelencia del Premio Nacional de Calidad de la República de Cuba (Cuba) | 0.276904562 | 0.004107213 | 0.506818182 | 0.25 |
| Modelo de Mejora Continua (Uruguay) | 0.11700494 | 0.000113617 | 0.246853147 | 0.1 |
| Modelo Iberoamericano de Excelencia en la Gestión (Ibero-America) | 0.193702507 | 0.0014078 | 0.436363636 | 0.127272727 |
| El Modelo de Excelencia en la Gestión (Peru) | 0.056040127 | 9.86271 × 10⁻⁶ | 0.109090909 | 0.036363636 |
| El Modelo para una Gestión de Excelencia (San Salvador) | 0.056040127 | 9.86271 × 10⁻⁶ | 0.109090909 | 0.036363636 |
© 2018 by the authors. Licensee MDPI, Basel, Switzerland. This article is an open access article distributed under the terms and conditions of the Creative Commons Attribution (CC BY) license (http://creativecommons.org/licenses/by/4.0/).
Share and Cite
MDPI and ACS Style
Jankalová, M.; Jankal, R. Sustainability Assessment According to the Selected Business Excellence Models. Sustainability 2018, 10, 3784. https://doi.org/10.3390/su10103784
AMA Style
Jankalová M, Jankal R. Sustainability Assessment According to the Selected Business Excellence Models. Sustainability. 2018; 10(10):3784. https://doi.org/10.3390/su10103784
Chicago/Turabian StyleJankalová, Miriam, and Radoslav Jankal. 2018. "Sustainability Assessment According to the Selected Business Excellence Models" Sustainability 10, no. 10: 3784. https://doi.org/10.3390/su10103784
Note that from the first issue of 2016, this journal uses article numbers instead of page numbers. See further details here.