A System to Pre-Evaluate the Suitability of Energy-Saving Technology for Green Buildings

School of Environmental Science and Engineering, Tianjin University, Tianjin 300350, China
*
Author to whom correspondence should be addressed.
Sustainability 2018, 10(10), 3777; https://doi.org/10.3390/su10103777
Submission received: 17 September 2018
/
Revised: 16 October 2018
/
Accepted: 17 October 2018
/
Published: 19 October 2018
(This article belongs to the Collection Green Building Technologies)
Abstract
:Rating systems for green buildings often give assessments from the perspective of the overall performance of a single building or architecture complex but rarely target specific green building technologies. As some of the rating systems are scored according to whether the technologies are used or not, some developers tend to pile up energy-saving technologies blindly just for the sake of certifications without considering their suitability for the application. Such behavior may lead to the failure of achieving the energy goals for green buildings. To solve this problem, a system that pre-evaluates the suitability of green building energy-saving technologies is devised based on modified TOPSIS (Technique for Order Preference by Similarity to an Ideal Solution) method, SA (simulated annealing) algorithm and unascertained theory-based data analysis method. By setting indices from technology performance, economy, human satisfaction aspects and by using the building prior information and measured database of technology usage, this system can make a quantifiable and multi-dimensional grading assessment for the target green building energy-saving technologies in the design stage. The system aims at helping the designer choose technologies in the design phase that best enhance the performance of the finished green building. It also helps prevent the sub-optimal performance of unsuitable technologies caused by the “pile up” behavior mentioned earlier. To verify this evaluation system, two building designs which use energy-recovery technology are evaluated, and the predicted performance for both designs matched the actual operation of the technology in the buildings themselves well.
1. Introduction
Energy consumption is one of the issues widely concerned by the international community in this day and age. Statistics show that buildings are recognized as the largest consumer of primary energy; for example, nearly 30% of the energy consumed in China is used by buildings [1,2], while 40% in the US and a similar proportion is also observed in Europe [3,4]. Green buildings, as they require the consideration of resources depletion and waste emissions during their whole life cycle, are being widely promoted around the world. China’s Green Building Evaluation Labeling (GBEL) has the hierarchy of rating green buildings in the design and operation stage, which aims to respectively assess the green building design schemes and actual performance during operation. However, the existing green buildings with an “operation label” only account for 6% of the total number of green building projects [5], which means very few green buildings can actually achieve the desired performance in the operation stage. Through a literature review and field research, this paper summarizes three main problems faced the existing green buildings in China, which are higher cost with unsatisfied benefits; poor implementation of green building energy-saving technologies (GBESTs); as well as poor operation and management [5,6]. These problems can be attributed to some developers tend to blindly pile up “advanced” energy-saving technologies just for the sake of certifications and ignore the technology actual application performance and investment returns. Therefore, there is a pressing need for consideration on the suitability evaluation of GBESTs.
Since the 1990s, many countries in the world have formulated green building evaluation system as the basis to measure the performance of green buildings according to several aspects, which have made great contributions to the development of green buildings. For example, BREEAM is regarded as the first green building rating system in the world and has been widely accepted because most of the later major green building rating systems such as LEED, Green Star and CASBEE are under the influence of it; LEED, though later than BREEAM, is the most widely used green building evaluation system in the world because of its transparent and clear scoring mechanism; CASBEE takes into consideration peculiar issues and problems in Japan and Asia, and has been used as a reference model for developing the Green Olympic Building Assessment System (GOBAS) for the Beijing Olympics [7]. However, objects for these rating systems are a single building or architecture complex, and they hardly focus on specific GBESTs and the rationality of specific technical measures in green buildings in different regions with different cultures and climates. China’s GBEL took its reference from LEED, and the list-scoring method and weight accumulative scoring method focus on the number of GBESTs adopted in terms of water saving, land saving, material saving, energy conservation and environmental protection [8,9], while the actual application effects of GBESTs themselves including performance, comfort, economic, etc. are not fully considered. Germany’s DGNB Certification System [10] is a rare exception that considers economic and technical aspects. Despite the increasing number of studies on the post-occupancy evaluation (POE) of green buildings in terms of the practical application effects of GBESTs in many aspects, results also shows that unsuitable technologies are the main cause of poor building performance. As the performance of green buildings also depends on green building technology selection, it is meaningful to carry out technical pre-evaluation in the design stage, especially to provide effective decision-making assistance for designers.
Academic studies that are related to the suitability of GBESTs have been developing for a long time from the aspects of climate, social theory and economic theory etc. Zhong Ke et al. [11] carried out suitability evaluation on a heat recovery ventilator with separate or mixed fresh air system operation in China. Results show that total heat recovery is applicable in a mixed fresh air unit with humidity control, while sensible heat recovery is suitable for severe cold and cold regions without humidity control; however, for separate fresh air systems, one single heat exchanger, no matter whether it is a total or sensible heat exchanger, can meet the standard requirement except in the severe cold zone, and the double heat exchange air unit must be used to adapt the requirement of energy recovery in ventilating systems. Rebecca Yang [12] developed a social network analysis (SNA) method based on stakeholder-associated risk analysis, and made an assessment and analysis on the risks of complex green building projects to identify possible consequences. Rakesh Kumar et al. [13] established heat transfer models to evaluate the energy-saving performance of roof greening and shading technology, while M.S. Mayhoub et al. [14] analyzed the cost-effectiveness of the use of tubular guidance in office buildings, and estimated the investment payback period of the technology based on the life-cycle cost. Scholars normally focused on one or two aspects of application benefits; although this may solve some problems in the use of GBESTs, the suitability of GBESTs should be a complicated issue involving economic, environmental, technological factors etc., especially if there is less attention on the satisfaction aspect in the design stage. Therefore, the suitability of GBESTs should be assessed from a holistic point of view.
Research also includes the suitability of GBESTs for a certain building type or for a certain region. Geng Geng et al. [15] designed a framework for evaluating the GBEST suitability for office buildings in cold areas of China by using a fuzzy analytic hierarchy (FAHP) method, and using grey relational analysis (GRA) to verify the technical rankings. Juan Zhou et al. [16] studied the suitability of using double skin facades (DSF) in China through simulation models and research in literature. The conclusions were that applying ventilated DSF with a controlled shading device system would be an efficient approach for commercial buildings in the hot-summer and cold-winter zone to meet the task of sustainable building design in China. Carolina Perpiña Castillo et al. [17] from Italy made a suitability map for the solar energy (PV) systems deployment in European regions. Shuai Wang [18] established a calculation model of dynamic performance for flat-plate total-heat exchangers in Chengdu using TRNSYS software. The results show that the enthalpy efficiency of the total-heat exchanger is larger than the rated efficiency for most of the time. When the total-heat exchanger only works from June to August, the payback period of investment would be 7.2 years, which means the heat recovery is possible to apply in Chengdu. Some of these studies are a brief summary of the suitability of GBEST under a certain circumstance; but there is a lack of a universal quantitative system because they are often limited to separate aspects.
Furthermore, studies involving both technology suitability and assessment are mainly given in the form of technical ranking and technology selection. Peng Zhao et al. [19] considered that the green building technology selection is the most important thing in green buildings; they employed a fuzzy comprehensive evaluation method which is based on AHP to establish a green building technology regional suitability assessment system, where the factors of evaluation contain technical feasibility, economic benefits; ecological benefits etc. Jin Si et al. [20] explored the application of multi-criteria decision-making (MCDM) methods in technology selection for retrofitting existing buildings in terms of both economic and environmental impacts of building integrated green technologies. A decision-making framework is proposed by Zainab Dangana et al. [21] by using a MCDM method to assist both retailers and construction professionals to systematically and effectively select the most appropriate technology. Most of the above research aims to compare the adoption of various technologies in the early design stage; although this may also improve the phenomenon of technology “pile up”, it is still not available for a single chosen technology as the evaluation object to satisfy particular needs.
Therefore, from the above introduction, technology “pile up”, ignorance of application suitability and the evaluation criteria failing to focus on GBESTs in the design stage are the existing problems that make the green buildings fail to meet their desired performance during operation. To solve these problems, a system that pre-evaluates the suitability of GBESTs is devised in this paper. The system is quantitative and multi-dimensional. It uses evaluation indices derived from prior information and the measured characteristics of the target energy-saving technology. Through the weighting method of TOPSIS (Technique for Order Preference by Similarity to an Ideal Solution) and an SA (simulated annealing) algorithm, comprehensive evaluation value as well as the grading method, assessment on the suitability of GBESTs can be conducted. The system aims at helping the designers choose GBESTs in the design stage that best enhance the performance of the finished building including in its technical performance, economy and satisfaction. It may also be helpful to prevent the adoption of unsuitable technologies thus minimize the economic loss caused by the unsatisfactory performance of the unsuitable technologies after construction. In addition, Amos Darko [6] examined issues influencing the adoption of GBESTs where, except for the primary obstacle high cost, the lack of green building technologies databases and information are also potential barriers. Therefore, in this paper, the pre-evaluation system is based on actual measured database of GBESTs because actual operating data can better reflect the practical application. The continuous updating of the database can also make the evaluation standard change dynamically according to its development.
2. Methods
2.1. Evaluation Framework
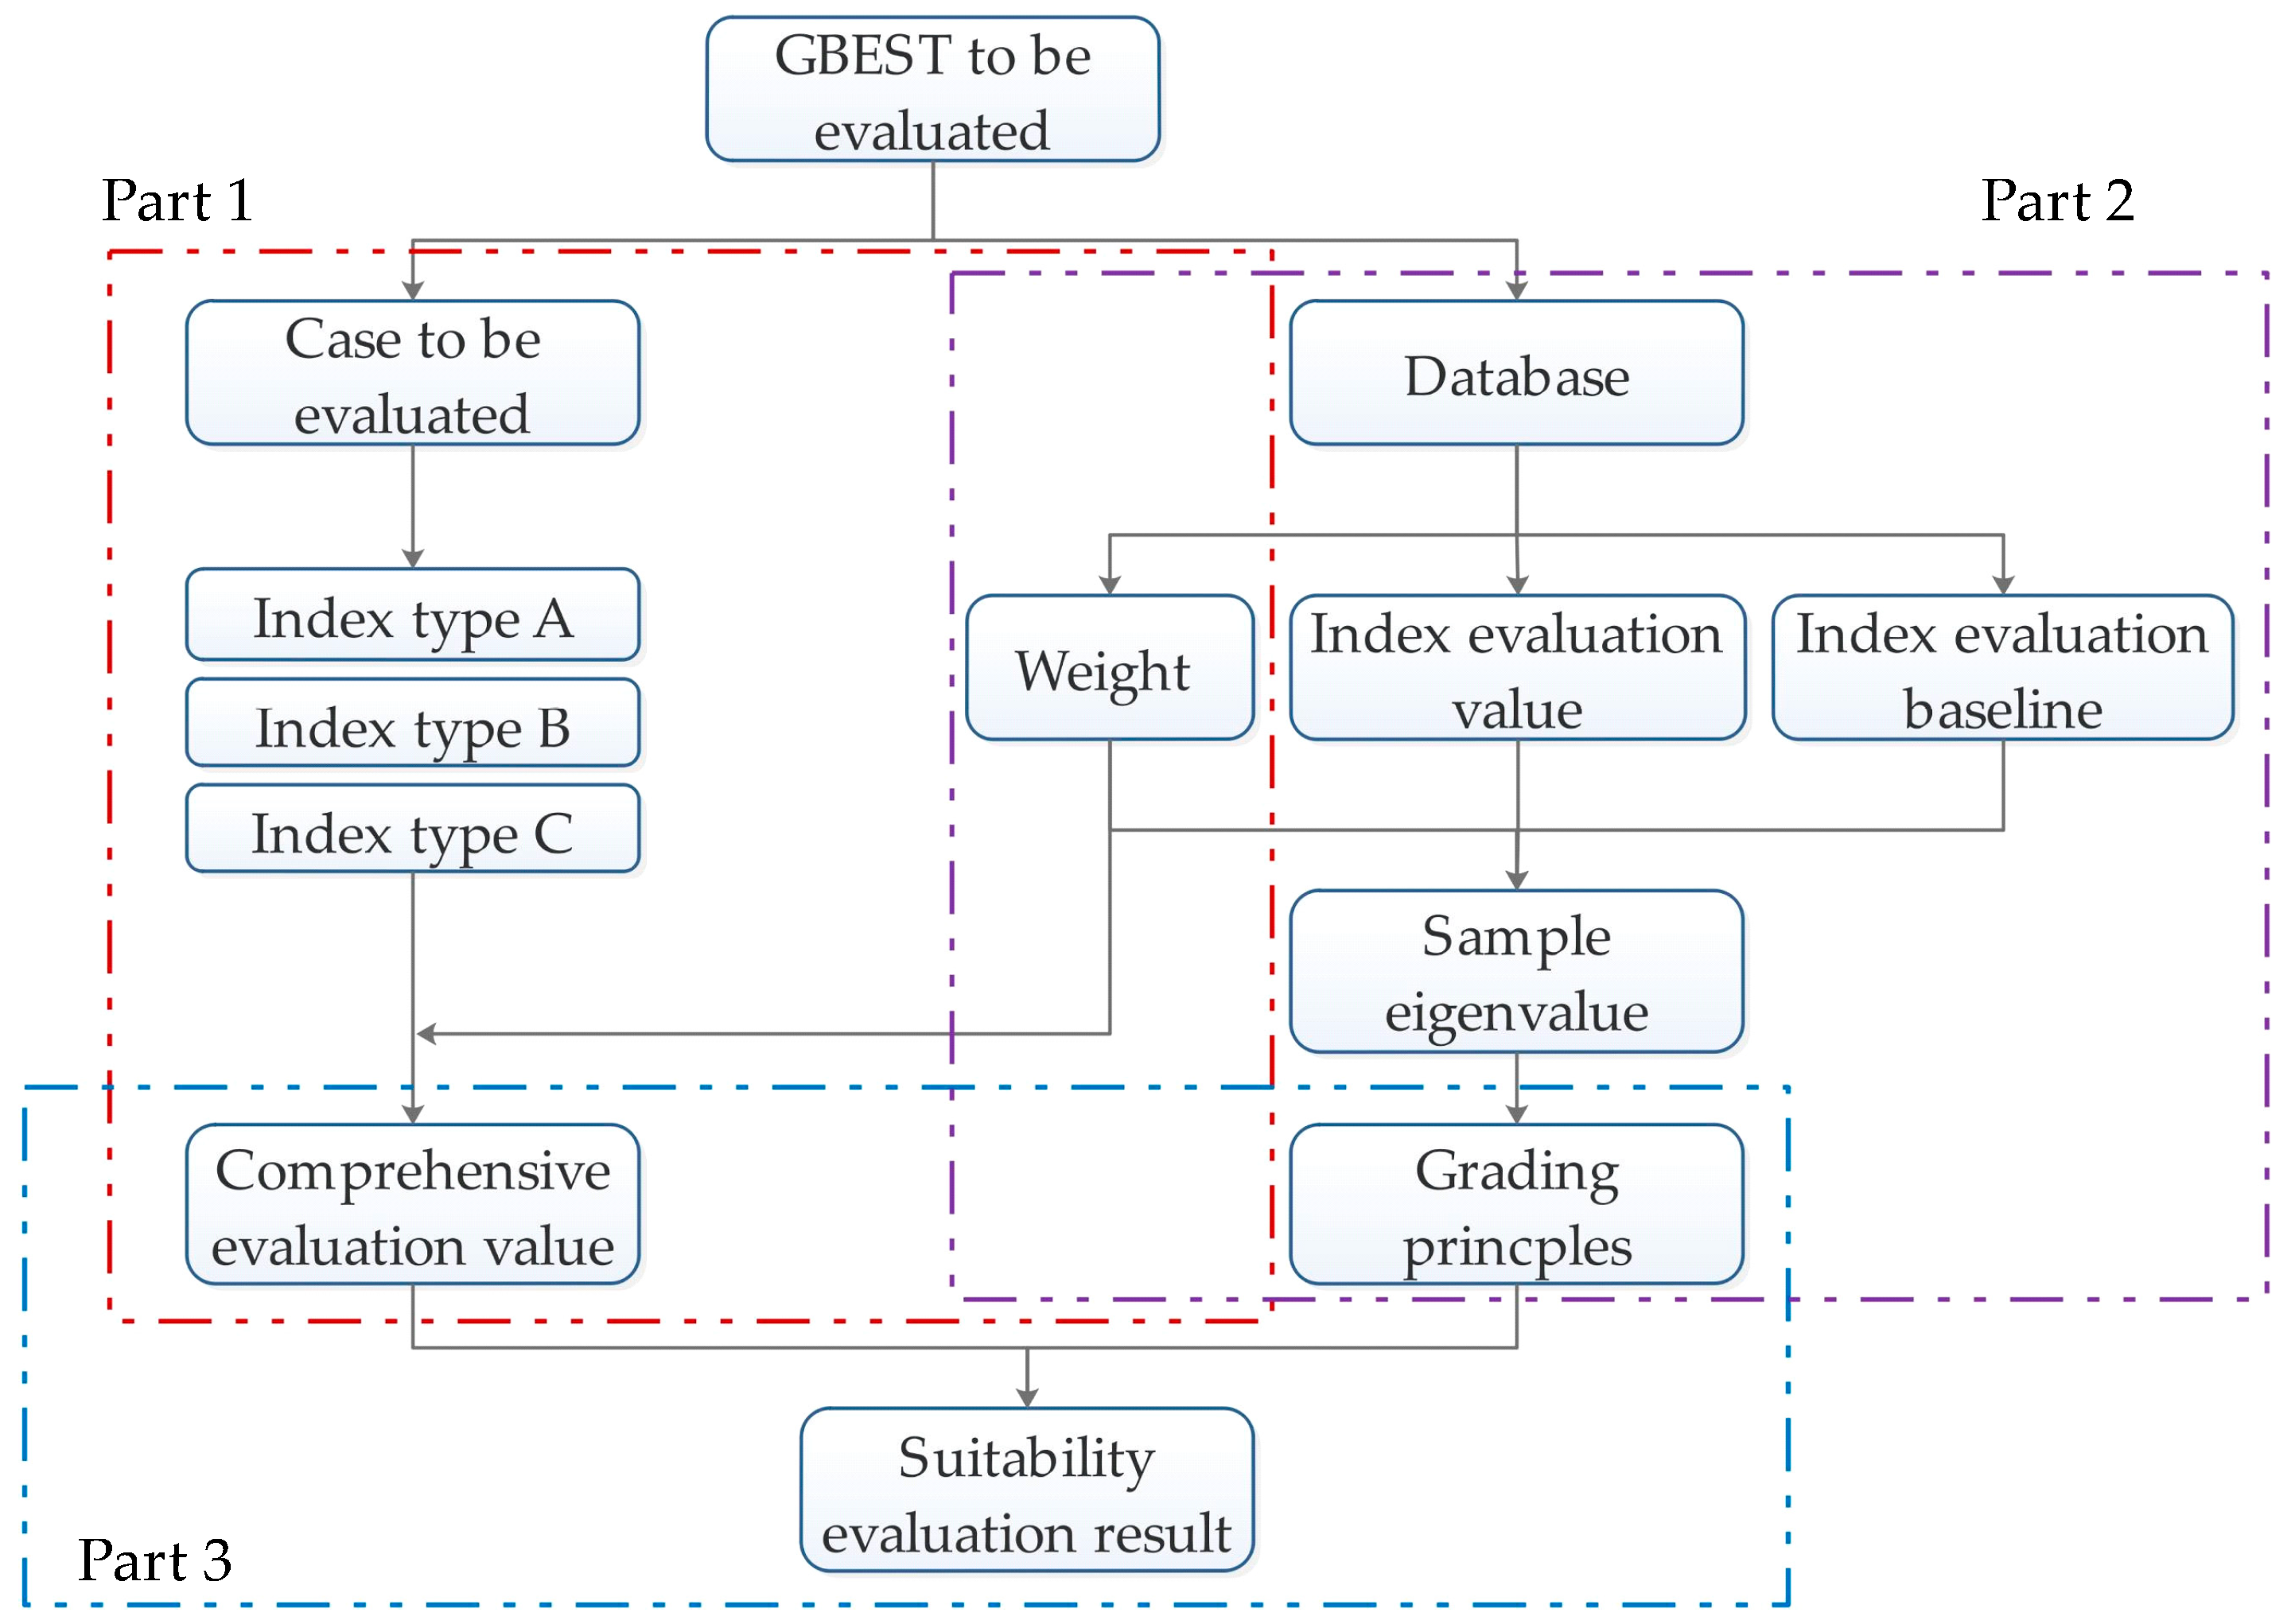
The suitability pre-evaluation system for the GBESTs is required to be objective, universal and complete. The framework of the evaluation system is shown in Figure 1, which mainly consists of a technical case to be evaluated and a database of many existing green buildings that use this technology. The pre-evaluation process can be broadly divided into three parts as described in the following:
Part 1: Indices calculation of the case to be evaluated. In this part, indices’ values (such as performance, economy and satisfaction) of the technology to be evaluated are deduced from the predictable information like average weather conditions, intended use of the building, and the measured characteristics of the target energy-saving technology.
Part 2: Database processing. The measured data as an important support for the pre-evaluation system are used in many links of the system, such as weight determination and grading basis.
Part 3: Obtaining evaluation results. According to the above, comprehensive evaluation values of the case to be evaluated and all the cases from the database as well as the baselines of evaluation indices can be drawn to further calculate a series of evaluation grading points.
2.2. Weighting Method
This paper refers to a new weight determination method developed by Li Cong et al. [22], which is through an improved TOPSIS method and optimization process to obtain weights of the indices. This method was originally applied to the evaluation of weapon systems’ operational effectiveness with multiple factors in Li’s paper, as the comprehensive assessment of the technology’s suitability in multiple indices has a similar purpose of obtaining weights, therefore can be referenced. The process of calculating the weights with the combination of TOPSIS method and SA algorithm is as follows.
2.2.1. Positive Ideal Solution (PIS) and Negative Ideal Solution (NIS) Determination
For the technology to be evaluated, organizing data from the database into a sample data set is the first step. The sample set contains N samples of a certain technology and M evaluation indices corresponding to each sample, as shown in Table 1.
Suppose there is an existing database of the needed information, the first step is to normalize the data to eliminate the impact caused by units of measurement on weight determination. For the convenience of calculation, the case values are standardized to the interval [0,1]. In the TOPSIS method [23], the positive ideal solution (PIS) is the scheme composing of the optimal values of indices referring to all the cases in the database, while the negative ideal solution (NIS) is the scheme consisting of the worst value of each index. The TOPSIS method can be used to calculate the best case and the worst case by calculating the relative proximity of all solutions to the positive and negative ideal solutions, and the nearest solution to the ideal solution is the best case , while the farthest case from the positive solution is the worst case .
2.2.2. Defining Objective Function
In this paper, weight vector of the indices is obtained through the optimization process, where the optimal weight vector allows the objective function to obtain the global minimum value. Assuming that the objective function is , where is an index vector of an evaluation object or a case, is a weight vector of indices and is an optimal weight vector, the objective function needs to meet the following requirements:
The first part requires that the evaluation value of the best case is larger than the worst and it is hoped that there is a greater gap in between. A weighting system obtained in this way has greater distinctions between suitable and unsuitable cases. The first objective function is shown as Equation (1). If , the value of is positive infinity, which helps the optimization process exclude the situation that the worst case evaluation value is larger than the best. Conversely, when increases from 0 to 1, it can be seen that decreases from positive infinity to zero, which ensures that the weight vector meets the first requirement.
The second part is to limit the comprehensive evaluation result of all cases in the interval between the best and worst evaluation value . Therefore, the function in this part is defined to reflect the average distance of the cases whose evaluation value exceeds the above interval. The second objective function is shown as in Equation (2). The function in Equation (3) gives the evaluation value of the sample point beyond the interval , and its value range is [0,1]. According to Equation (2), when the average value decreases from 1 to 0, will decrease from negative infinity to zero, which meets the second requirement.
Moreover, the weight distribution should also have some restrictions: weight distribution should neither be imbalanced nor overbalanced or it may appear that the weight allocation inclines to a certain index in extreme cases. Therefore, a normalization factor whose value increases with the imbalance degree of weight distribution is considered for the objective function. It can be noted that the weight is corresponding to a discrete probability distribution, and therefore the entropy of the can be used to measure the equilibrium degree of the weights. The entropy function is defined as Equation (4).
According to the definition of thermodynamics, entropy represents the degree of chaos in a molecular state. When it is applied to the field of information, information entropy is a measure of uncertainty. If the entropy is used to judge the discretization degree of an index, the more balanced the index, the smaller the degree of dispersion, and the more unbalanced the indicator, then the greater the degree of dispersion which exerts greater impact on the comprehensive evaluation. Then it can be proved that when the distribution of completely loses balance, that is , , takes the minimum value; while the distribution of is completely balanced, that is , ( is the number of indices), takes the maximum value . Accordingly, the normalization factor can be defined as Equation (5):
When the distribution of weights goes from complete unbalance to complete equilibrium, increases from 0 to and decreases from negative infinity to zero, which satisfy requirements for the normalization factor. So far, the objective function can be expressed as Equation (6):
where κ as a coefficient can take and N can be an arbitrary integer. As constraints are imposed on the imbalance of weight allocation, it is found that the weights of indices tend to be balanced, and with the increase of , the weights are forced to move closer to the average value. This indicates that the normalized factor can effectively reduce the imbalance of weight distribution. However, when the weights are evenly distributed, they cannot reflect the influential difference for the indices on the comprehensive evaluation results; therefore, the coefficient κ takes as a compromise. Finally, the optimization model for weights determination is described as Equation (7):
As the existence of constraints complicates the optimization problem, solving the real number vector can help remove the constraint, because the vector can be mapped back to the weight through the softmax function transformation, that is, to make the transformation for as shown in Equation (8):
From the above analysis, the optimization problem is transformed into an equivalent unconstrained optimization problem, as shown in Equation (9):
2.2.3. Optimizing Algorithm
As there are complex forms of logical judgement in the objective function, a conventional gradient based optimization algorithm can hardly meet the calculation conditions [24], so the SA algorithm is chosen to solve the objective function. The algorithm needs to input four parameters: T (initial high temperature), cool (cooling rate), lt (temperature drop threshold), and sampleset (sample database). Larger T value shows a higher initial temperature; a higher cool value indicates a slower cooling rate; and the smaller the lt value means the lower temperature of the stop iteration. The parameters in the algorithm are set as T = 1000, lt = 0.1, cool = 0.9, which can also be adjusted according to the computing speed, the requirements of calculation accuracy etc. Call up the processed data from the sample database to the matrix sampleset and run this algorithm a couple of times to return the smallest optimal value and its corresponding index weight, which is the optimal target weight.
2.3. Comprehensive Evaluation Value
The weighting linear summation method is adopted in this paper to calculate the comprehensive value. As shown in Equation (10), where represents the normalized value of the th index of the th sample, the comprehensive evaluation value of the case to be evaluated and sample cases can be obtained according to the processed index values and their corresponding weights:
2.4. Grading Method
2.4.1. Index Baseline Calculation
There are two ways to determine the evaluation baselines in this paper. For one thing, if there is a clear definition of index range in the related national standard, the evaluation baseline should be the mandatory value in the current standard or norms such as the energy efficiency parameter of a certain type of unit and the thermal conductivity of a certain structure. While for indices that are not specified in national standards, such as the payback period for most technologies, the evaluation baselines should be obtained from the measured database.
However, in the second situation, it may appear that a technology has less information in the database, which makes it difficult to obtain an appropriate evaluation baseline. Uncertainty theory-based data analysis methods on small-sized samples [25,26,27] are adopted to solve this problem. With this data processing method, a compiled data that eliminates gross errors and contains useful information can be gained, which can be used as a baseline for the evaluation of indicators without the mandatory requirements of national norms. By using this method, more accurate fitted eigenvalues can be obtained even with a small number of samples, and the samples with large deviation from data distribution can also be excluded. For technologies with enough samples, this method can still be used to calculate expectations as it does not depend on the number of samples and the mathematical distribution type of the data.
To calculate mathematical expectations based on unascertained theory, suppose the unascertained rational number is in Equation (11), where is the reliability distribution density function of the true value of the variable V, as shown in Equation (12):
In Equation (12), is the number of that contains in ’s neighborhood , where the smaller the λ, the higher the accuracy and the smaller the value of ; while the larger the λ, the greater the inclusiveness and the greater the value. λ is usually the variance of the difference between the entire observation sequence, and the difference variance is shown in Equation (13):
Finally, the unascertained expectation of the unascertained sample is shown in Equation (14). When the above method is used to process the sample values of the index without standard regulation in the sample database, the obtained unascertained rational expected value is the evaluation baseline of the index.
2.4.2. Grading Points Determination
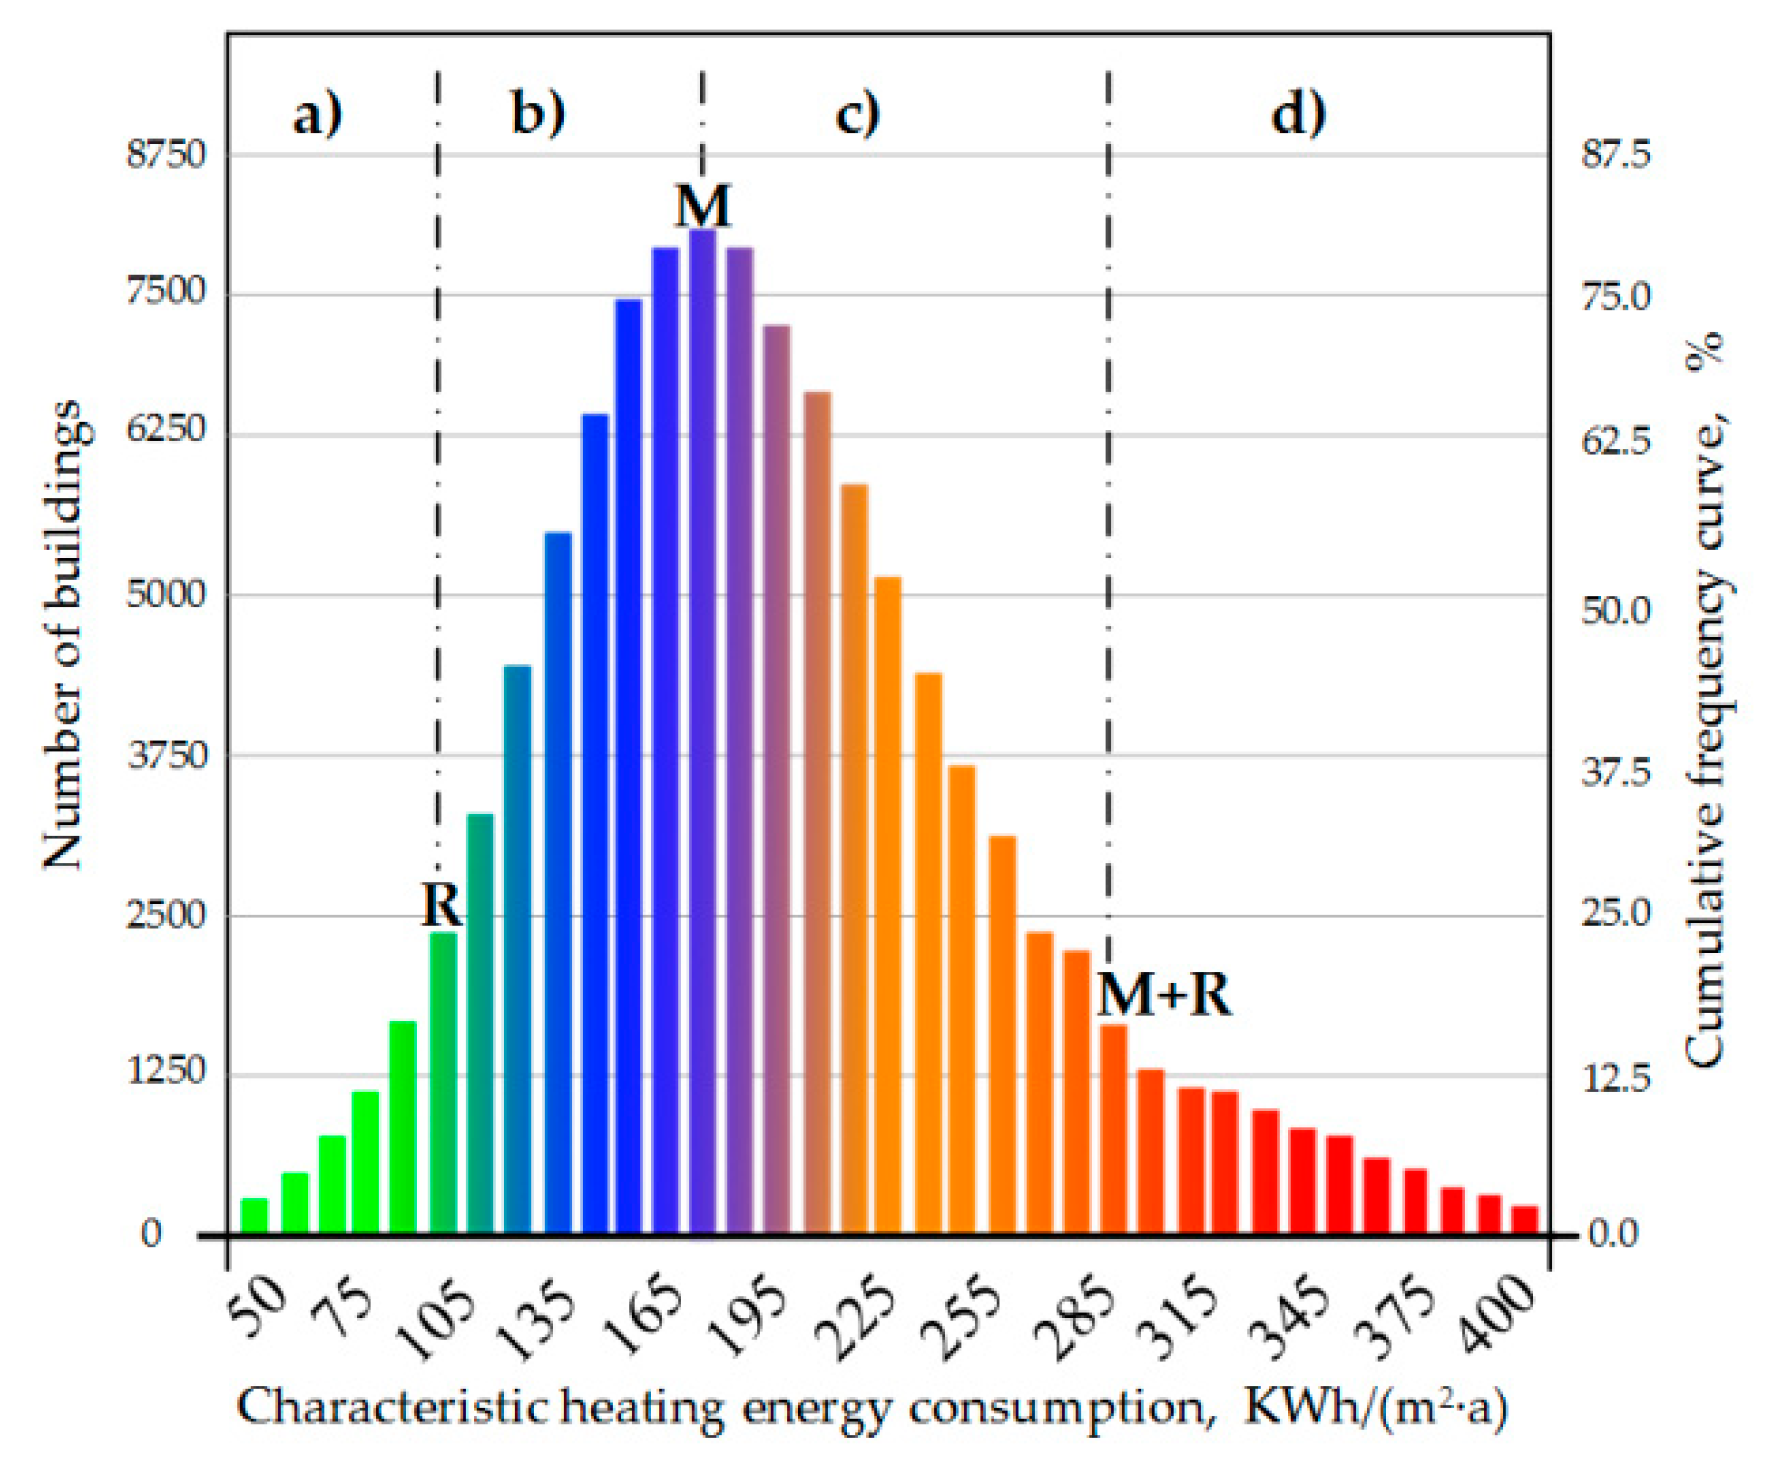
The suitability evaluation result is classified into three levels in this paper: “unsuitable”, “tolerable” and “suitable”. To make the pre-evaluation rating system both reflect the regulatory requirements and the actual application performance, this paper refers to the form of the grading method in VDI 3807 “Characteristic consumption values of buildings” [28] developed and promulgated by the German Ministry of Construction and the German Institute of Engineers. This standard proposes to assess the building energy consumption level by comparing its overall energy consumption with a reference value which includes “guide value,” “standard value,” and “average value”. “Guide value” refers to the average energy consumption of 25% buildings that are located at a lower energy consumption level. The “average value” is not an arithmetic average in the normal sense, but the average corresponding to the most densely populated area in the building energy consumption frequency distribution model, which is less susceptible to outliers. Furthermore, “guide value” can also be used as a goal for the next phase building energy conservation, because the energy consumption level of those 25% of buildings is higher yet achievable.
In VDI 3807, the frequency distribution histogram is drawn according to the building energy consumption level from low to high. As shown in Figure 2, the horizontal axis is the heating energy consumption value per unit building area, which is expressed in ; is the standard value and is the average value. The frequency distribution histogram of building energy consumption is divided into four regions:
(a) Excellent. When , it indicates that the building consumes very little energy, which has perfectly met the current requirement of energy consumption and is at a high level among the existing buildings, therefore no measures need to be taken.
(b) Good. When , it indicates that the building performs better in terms of energy efficiency and has a smaller energy-saving potential, but can still achieve better results through enhanced management or small-scale renovation.
(c) Poor. When , the building has a higher energy consumption and a greater potential in energy conservation.
(d) Terrible. When , it indicates that the energy consumption of this building is too much, so that analysis on the energy consumption of sub-items is needed to explore the potential of energy conservation from various aspects.
Similarly, the suitability assessment grading also needs to reflect the current application level and provide guidance for standard improvement. Referring to the classification method in VDI 3807, demarcation points for suitability assessment are median value (M), optimal value (O), and standard value (S). Optimal value is the maximum value among the samples. Standard value is the comprehensive evaluation value in a reference building where the GBEST to be evaluated just meets requirements of the current norms or standards.
Median is rarely used in China’s building evaluation, but it has a better statistical significance compared to the sample mean value. When the data distribution is symmetrical, the median is equal to the sample mean value; while the data is asymmetric, the sample mean value approaches to one side, and if the sample number is small, the average value will not be a sufficiently rigorous indicator.
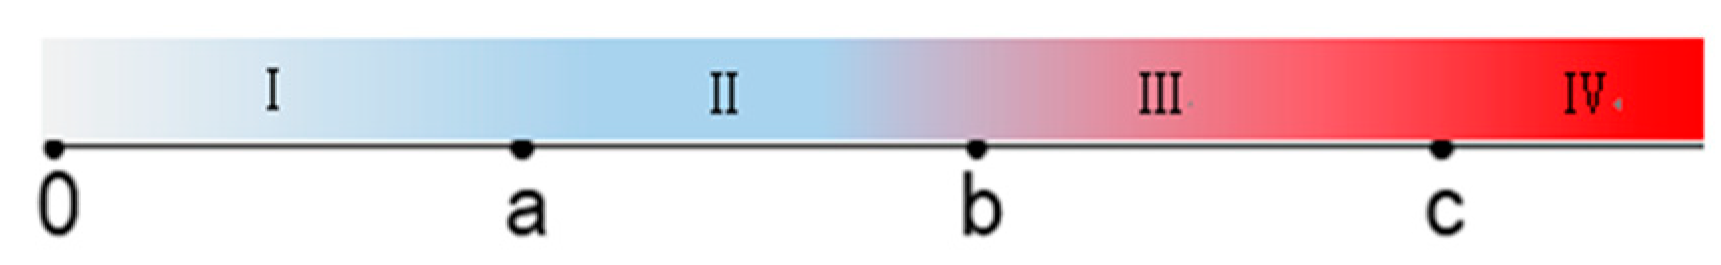
According to the possible ranking of the three values, Figure 3 vividly demonstrates an evaluation grading axis using three demarcation points, which divide the evaluation degree into four intervals. However, as the sample median value must be less than the optimal value, there are finally three situations for the indices arrangement as listed in Table 2.
Let be the comprehensive evaluation value of the GBEST to be evaluated, rating levels can be further explained as follows:
Situation 1 (): if , the evaluation value is smaller than the sample median value, the evaluation result falls in area I, which means that the use of this GBEST will not only fail to meet the requirements of the current standards, but its application will also be in poor conditions among the existing green building that adopt the same technology. Therefore, it should be assessed as “unsuitable”. While , although the technology to be evaluated may not fully meet the requirements of the current norms, its application can still reach the middle or upper level among the existing cases; therefore, it should be assessed as “tolerable”. If , that means the use of the technology to be evaluated can satisfy the requirements of national standards and the application level will be superior to most of the existing cases; it should then be appraised as “suitable”.
Situation 2 ): this situation occurs when the certain technology cannot meet the standard in all the existing buildings. If , that is the technology to be evaluated is less favorable in the current cases and should be appraised as “unsuitable”. If , the technology to be evaluated can perform better than most of the existing application cases, but still cannot reach normative provisions, it should be assessed as “tolerable”. While , the case to be evaluated can meet the requirements of the current norms and should be assessed as “suitable”.
Situation 3 : this situation arises when the certain technology performs generally better, and it suggests that relevant standards of this technology need to be adjusted in time. If , the application level of the technology to be evaluated cannot meet the requirements in the current standard, and should be set as “unsuitable”. If , it means the technology performance can meet the current standard but performs relatively poorly in the current existing cases, thus should be assessed as “tolerable”. If , it shows the technology to be evaluated is superior to most of the existing application cases, and should be assessed as “suitable”.
3. Evaluation Indices for Typical Technologies
3.1. Principles of Evaluation Index Determination
An important feature of this pre-evaluation system is to make multi-dimensional and comprehensive evaluation of GBESTs. The evaluation indices should be set before the building completion, according to its meteorological information, building basic information, design parameters or other predictable information. According to the principles of multi-dimensional assessment, technology evaluation index selection should meet the following three basic principles:
(1) Maneuverability. Evaluation indices can be obtained through the design information and other predictable information.
(2) Comprehensiveness. Evaluation indices should reflect the comprehensive effectiveness of the technology as much as possible.
(3) Independence: Evaluation indices should be simplified without range overlapping.
Among the existing GBESTs evaluation systems, there are many categories of evaluation indices such as technical performance, cost-benefit, staff satisfaction, environmental protection etc. However, it is obviously hard to include all these indices in the process of pre-evaluation. Therefore, the paper sets the evaluation indices from three representative while meaningful aspects: technical performance, economic, and satisfaction.
3.2. Technical Performance Evaluation
Technical performance is the first consideration for the adoption of green building technologies as it determines whether certain requirements for the green building can be achieved or not, like energy saving, water saving and environmental protection etc. Performance indices of technologies are often regulated by national, local as well as industry standards, which can be mandatory requirements. As for GBESTs, most of their performances are related to energy-saving performance and the evaluation indices used in this paper are supposed to reflect the key factors of the certain GBEST such as energy consumption level and the preliminary rationality of the technology adoption. Technical performance indices of GBESTs can vary from heat transfer coefficient to COP/EER (Coefficient of Performance/Energy Efficiency Ratio) improvement, that is to say different categories share different indices due to the particularity of technology. Some of the typical performance indicators provided in this paper can be used for reference.
3.3. Economy Evaluation
The economy performance of green building technology that the developers or markets are concerned about is essentially the incremental cost when compare to the non-green building, the extra cost to obtain greater environmental, social and economic benefits, and the speed of investment recovery. While the green building buyers are concerned about whether the savings in operating costs and willingness to pay extra due to the satisfaction of health and comfort are greater than the overpayment due to the choice of green buildings. Therefore, economic indices are the comprehensive reflection of the technical investment and return, which are closely relevant to the interests for investors and users. Unlike the technical indices, there are few regulations setting out the economic performance. In this paper, economic indices are uniformly set as the incremental payback period (PBP) since it is widely used and may effectively reflect the economic problems in both design phase and operation phase to some extent.
3.4. Satisfaction Evaluation
The aspect of satisfaction evaluation is of great significance because it tries to consider the user’s feelings in practical applications, which embodies the concept of “people-oriented”. The focus of satisfaction is placed on the thermal, visual and acoustical environments since these are the main factors determining the overall indoor environmental quality. In this paper, the evaluation of satisfaction mainly relates to the technologies that directly affect the indoor environment, which means because of the particularity, not all GBESTs have the dimensions of satisfaction.
At the same time, satisfaction is a subjective concept which is not easy to define in the suitability pre-evaluation. Therefore, in the process of application of the evaluation system, for some technologies, satisfaction can be considered in parallel with the other two dimensions, through some simulation works to obtain a comprehensive evaluation result. While for other GBESTs, the users’ preference and prospective may be consulted by questionnaires in advance to fulfill the dimension of satisfaction evaluation in technology suitability assessment. Take an example of sun shading technology. Early studies by Keighley [29] demonstrated that satisfaction of views was closely correlated with the percentage of glazing. While the blinds have a benefit of reducing glare to reduce discomfort which is likely to cause less productivity for occupants, and to some extent reducing cooling load [30]; shading also introduces disadvantages such as reducing views out. Therefore, if a decision is going to be made on the use of sun-shading technology, a questionnaire survey of the future occupants can be conducted to determine their choices on the priority of energy consumption or the priority of comfort and satisfaction in the light and heat environment.
3.5. Evaluation Indices for Typical Green Building Energy-Saving Technologies (GBESTs)
According to the characteristics of typical GBESTs, this paper divides the technologies into mainly three categories: passive technologies, heating, ventilation and air-conditioning (HVAC)-related technologies, and renewable energy application technologies. Some commonly used technologies are listed as examples to give specific indices for evaluation in Table 3. However, it should be noted again that not all technologies share the same evaluation indices. The previous contents pointed out that each technology should be considered from three dimensions of performance, economy and satisfaction to avoid crossover; however, some of the indicators may not be meaningful, and therefore the number of indices M should be in accordance with the rationality of the actual application.
Passive technologies refer to the use of non-mechanical, less energy-consuming methods in architectural planning and design to achieve energy consumption reduction in heating, air conditioning, ventilation etc., for example through the reasonable settings of building orientation, shading, envelope thermal insulation technology and natural ventilation. Some of the commonly used passive technologies like natural ventilation have fewer suitability problems and therefore are not covered in this paper. Typical technologies especially with high incremental investment like double skin façade, tubular daylighting as well as adjustable sunshading are still necessary to conduct a comprehensive suitability evaluation.
The energy consumption of a HVAC system is recognized as a large part of the total building energy consumption; therefore, the performance of a HVAC system is one of the important indicators to evaluate the performance of green buildings. HVAC-related GBESTs include cold and heat sources and system modes of air-conditioning systems and terminals, whose design choices are closely related to the comfort of users, and are also affected by different areas and the size of building. Therefore, it is necessary to consider a variety of indicators before making decisions. In Table 3, energy recovery, radiant floor heating, temperature and humidity independent control technologies are listed together with their performance and economic evaluation indices. However, some comfort indicators are missing because these technologies do not directly interact with the users.
Renewable energies are often encouraged in green buildings as they have the characteristics of clean, environmentally friendly and inexhaustible, which is in line with the sustainable development view of today’s society [31]. Commonly used renewable energies in green buildings are mainly solar energy and geothermal energy. However, the distribution of renewable energy often has geographical differences and climate variability, or due to different building functions, the suitability will also be different. For example, different latitudes and climates regions have large differences in solar energy resources; the performance of air-source heat pumps under different air temperature and humidity areas is various; ground-source heat pumps and other technologies with large initial investment are more suitable for buildings with large heating and cooling loads rather than small-scale residential buildings. The evaluation indices’ selection of renewable energy related technologies mainly refers to the China national standard GB/T 50181-2013 “Evaluation standard for application of renewable energy in buildings” [32].
4. Case Study
In this paper, energy recovery technology is chosen as a sample technology to be evaluated to demonstrate the complete evaluation process.
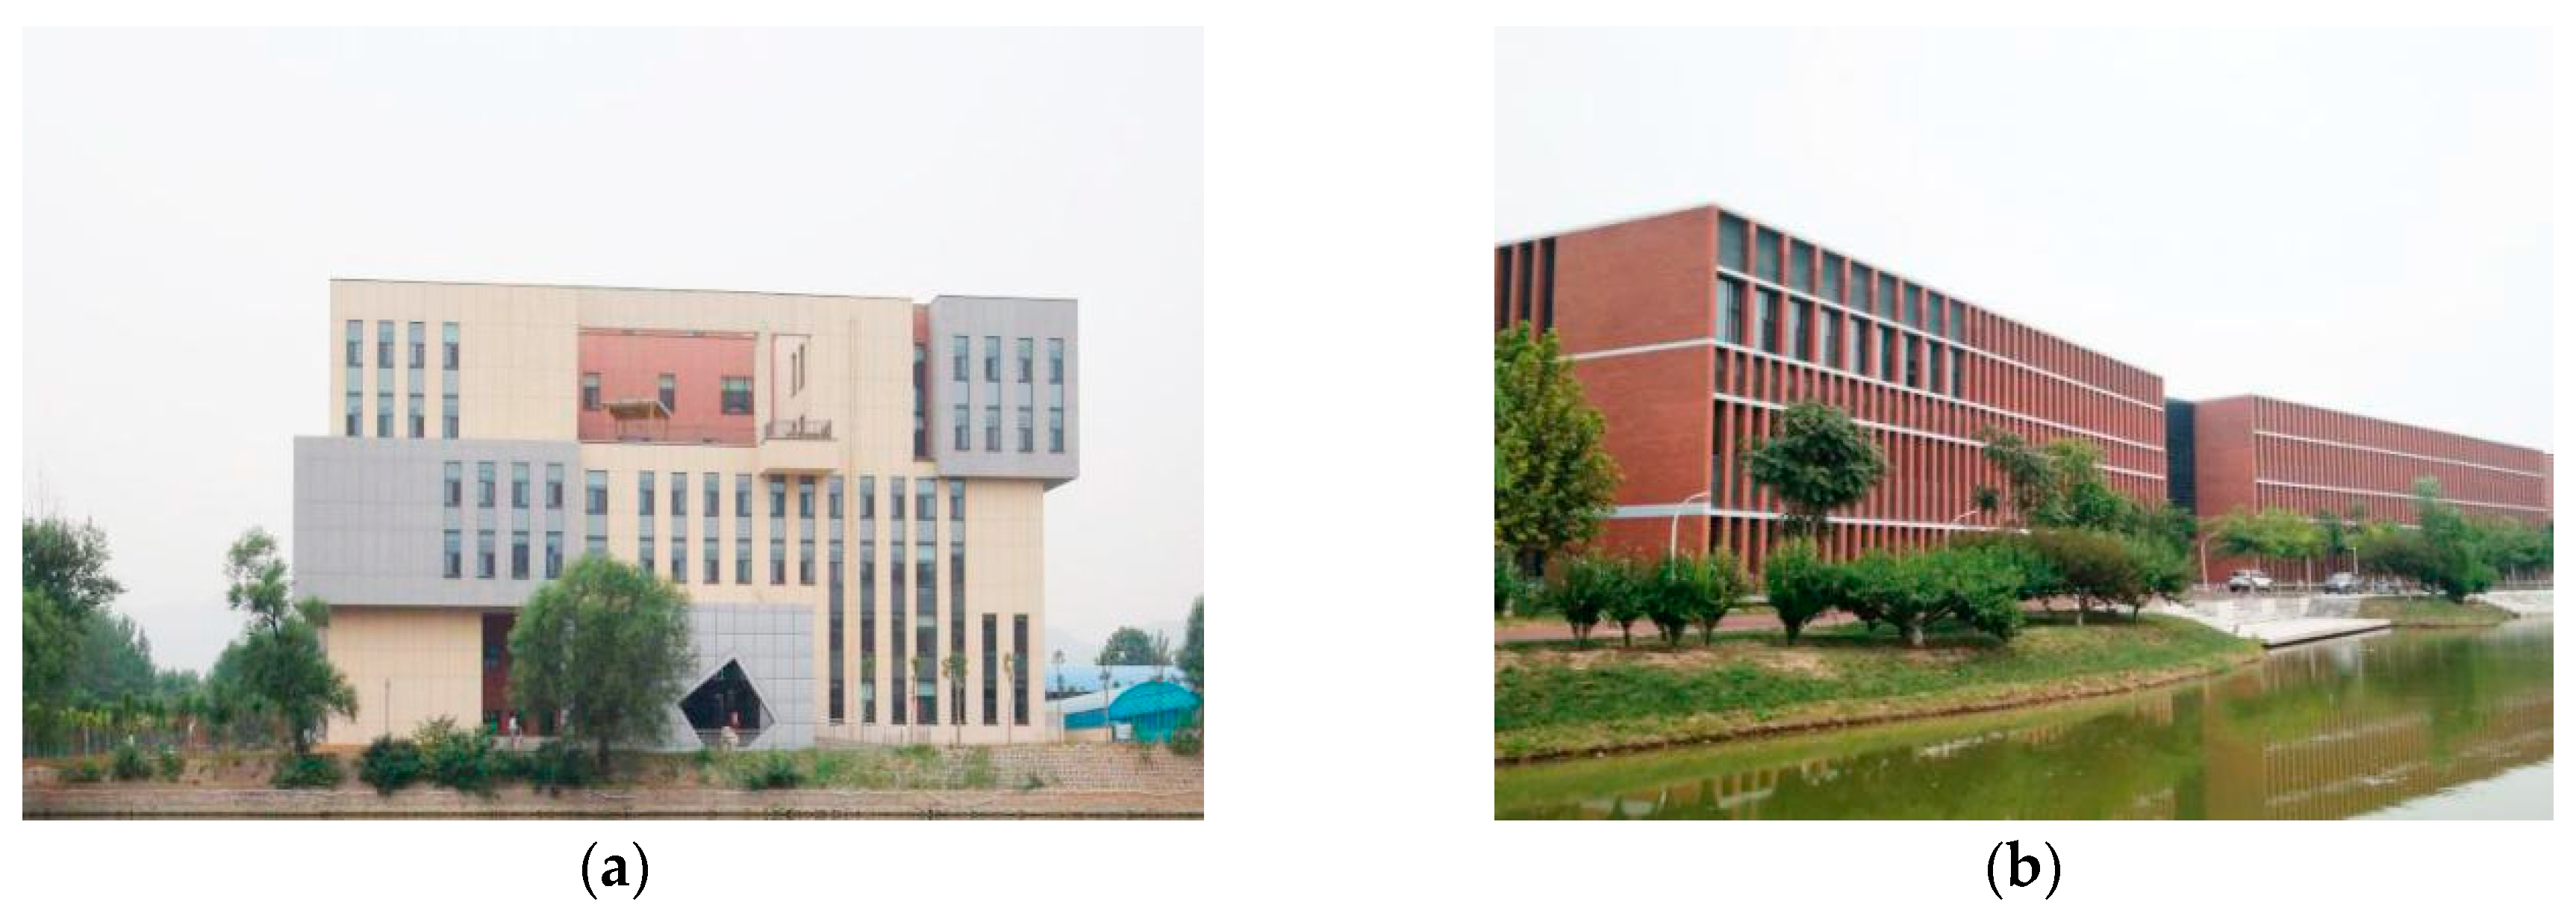
The two case-study buildings are: office building A in Shijiazhuang City, Hebei Province (Figure 4a), and teaching building B in a university in Tianjin (Figure 4b). The two buildings selected are existing constructions but regarded as buildings in the design stage in the case study to verify the feasibility and practicability of the evaluation system. Basic information of the two buildings is listed in Table 4. The total investment of building A is 19.92 million yuan and the incremental investment of green building B is 3.39 million yuan.
4.1. Evaluation Indices for Energy Recovery Technology
In the architectural design stage, energy recovery unit selections are made by designers through the load calculation and the combination with the design form of the HVAC system. The evaluation of energy recovery technology is conducted in this stage according to the indices mentioned in the above context in three dimensions: performance index (using the energy recovery efficiency), economic index (using the incremental investment PBP), however satisfaction index is not considered since it is less meaningful in energy recovery technology.
(1) Performance index: energy recovery efficiency
The parameter of energy recovery efficiency directly determines the energy-saving effect of the energy recovery devices. According to the requirements of the current specification in China “Air–Air Energy Recovery Equipment” [33], the minimum efficiency requirements for the total heat recovery or sensible heat recovery unit in winter and summer are shown in Table 5. The enthalpy efficiency is applicable for the total heat exchange devices and the temperature efficiency is for the sensible heat exchange devices.
(2) Cost-benefit index: incremental payback period
Incremental investments for the energy recovery system are initial investments of the equipment and the operating costs; while the benefits reflect on the energy savings through energy recovery. The initial investment for heat recovery technology is the cost of heat-exchange units and auxiliary fans. The cold and heat source unit capacity of the air-conditioning system with energy recovery technology are relatively small, and its operational energy consumption can be reduced accordingly, thus reducing the operating costs. Although additional power consumption of the fan can increase due to the wind pressure and wheel resistance, it can nearly be offset by the operating electricity cost saved by the reduction of the capacity of the cooling and heating source units. As a result, operating costs can be neglected during the pre-evaluation process.
Taking the sensible heat recovery unit as an example, sensible heat recovery efficiency is calculated as Equation (15), which is based on the preheated air temperature as well as the mixed temperature deduced by the fresh air and return air ratio. Energy saving is clear when compared to two cases with and without energy recovery technology. The cost saved by using energy recovery can be calculated according to the local electricity price:
where, —Temperature exchange efficiency, %
—Fresh air quality,
—Exhaust air quality,
—Fresh air temperature,
—Preheated air temperature,
—Indoor air design temperature, .
Incremental investment PBP can be calculated as Equation (16). Compared to a single-season used system or system with returning air, an all season used system and full fresh air system are more energy-efficient with shorter PBP. But there is no clear regulation for the investment PBP for energy recovery technology in current norms.
4.2. Data Collection
According to the design information, the energy recovery efficiency in Cases A and B are 0.78 and 0.62 respectively. Based on the load, initial investment of the units as well as the evaluation index calculation and analysis process of the energy recovery unit, incremental PBPs of the units in Case A and B are 2.8 and 16.96 years, respectively.
Through field investigation and literature research, the statistics of eight green buildings with exhaust air heat recovery technology were collected as a database. The evaluation index values of each sample case were obtained through the method mentioned above. By contrast with the case to be evaluated, the index value of the sample cases should be calculated based on the actual operation data. For the energy recovery technology evaluation, recovery efficiency of the sample case should be the parameter in the actual operation. When calculating the PBP, the amount of the saved electricity in calculating the technical benefits is obtained by the difference between the actual amount of electricity consumed by energy recovery units and the estimated electricity consumption of the conventional air-conditioning system without the energy recovery technology of the building. The statistical results of the cases to be evaluated and the sample database are shown in Table 6.
4.3. Evaluation Process
4.3.1. Statistics Normalization
4.3.2. Weight Calculation
Program codes of the TOPSIS-based SA algorithm are written in MATLAB. By reading the processed data, weight distribution results of the multiple-indicators are obtained. According to the calculation results, the weights on the indices of energy recovery efficiency and investment PBP are 0.41 and 0.59, respectively, which is also consistent with the requirements of emphasizing technical and economical rationality in Chinese national standard GB 50189-2015 [34].
4.3.3. Comprehensive Evaluation Calculation and Ratings
According to the weight distribution and evaluation index values, comprehensive evaluation of all the cases are listed in Table 8. Comprehensive evaluation results are calculated as Equation (17), where, M is the number of indices, is the weight of each index, and is the corresponding index value.
Next, the sample median value, optimal value and standard value should be determined to obtain the suitability grading. The first two values can be calculated from the comprehensive evaluation values of the sample cases in Table 8, but the standard value should be deduced according to the weights and baselines of each index.
Energy recovery efficiency is clearly defined as shown in Table 5. According to different operating conditions, the norm has different provisions, and finally the baseline of the first index is set as 0.57.
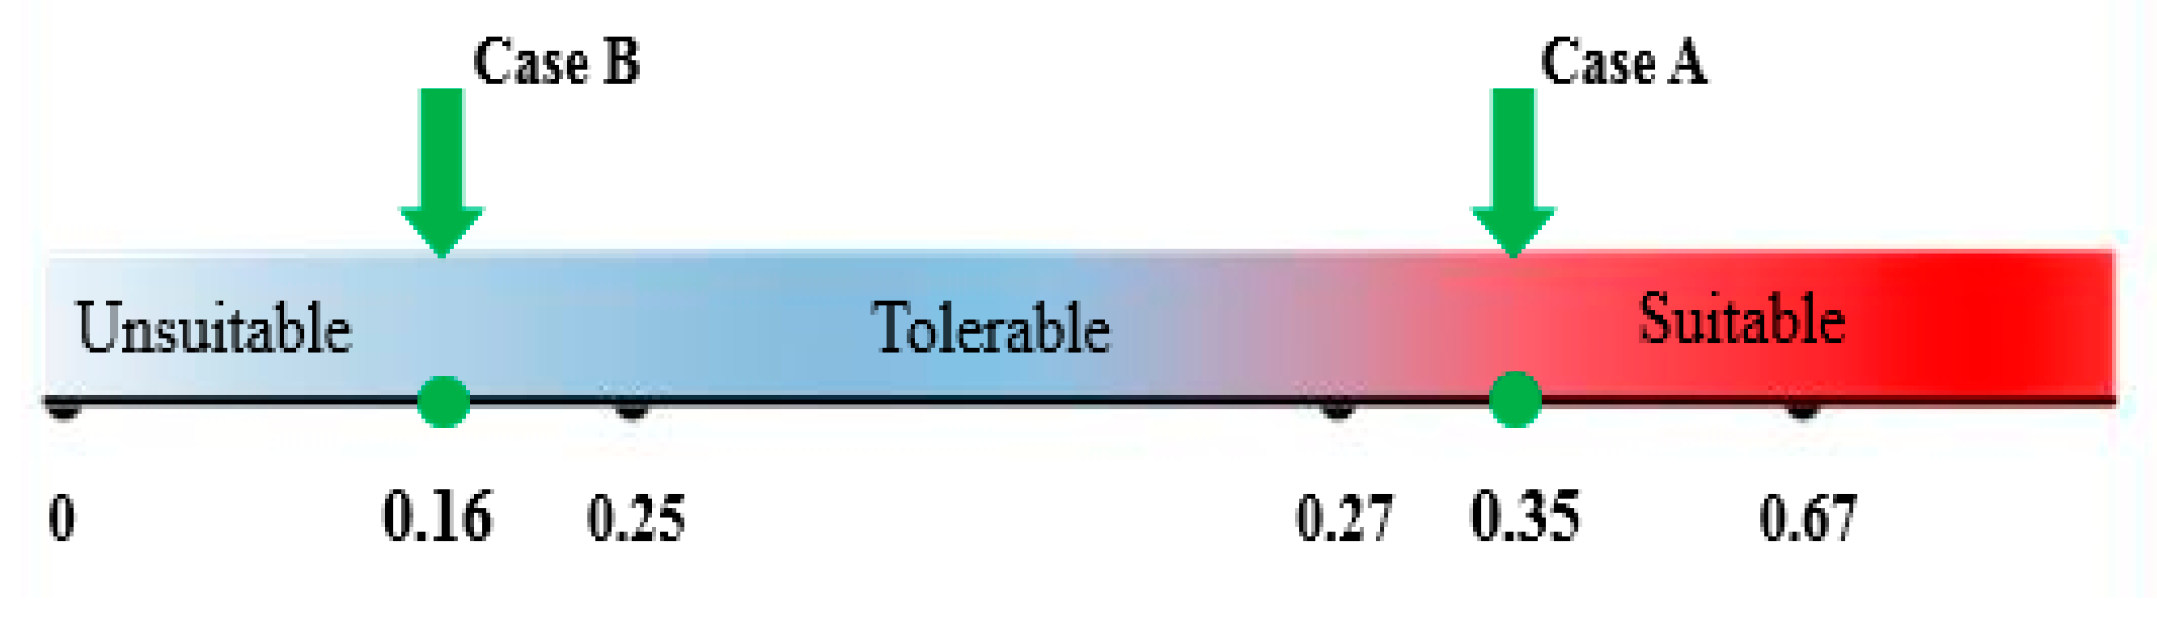
The second index incremental PBP is not mandatory in current national regulations, therefore the evaluation baseline needs to be obtained from the database through unascertained theory. Based on the original data of the investment PBP in Table 6, the assessment baseline is defined as 4.0 years. Finally, a standard value can be set combined with the weights and it turned to be 0.27. Therefore, according to the calculation results, the sample median value, optimal value and standard value are 0.25, 0.67 and 0.27, respectively.
Since the grading points meet , the pre-evaluation grades according to the comprehensive evaluation of the case to be evaluated are as follows: when , the application level of the technology to be evaluated cannot reach the standard value, and it is in the middle and lower levels in the practical application, which should be assessed as “unsuitable”; when , that is the application level is not fully satisfied with the requirements of the current standard, but belongs to the middle and upper class among the existing cases, evaluation should be “tolerable”; when , it means the technology application level meets the regulatory requirements and is better than most of the existing application cases, which should be assessed as “suitable”.
The comprehensive evaluation result of the two cases are 0.35 (Case A) and 0.16 (Case B) as shown in the evaluation rating axis in Figure 5. Therefore, the pre-evaluation result of Case A is set as “suitable” and of Case B as “unsuitable”.
4.4. Results and Analysis
Case A is an office building with the two-star certificate for green building design, located in the cold region in northern China, which is used for scientific research. As an office building, an air-conditioning system operates relatively longer hours over a year, and therefore there is a greater potential of using energy recovery technology. Case B is a teaching building in a university used only for graduate students taking classes; as the heat recovery is only used in winter, the operating time for energy recovery is limited. Results shows that energy recovery technology in Case A has a relatively better level, while the PBP of the technology used in Case B is even longer; the final score of the comprehensive evaluation in Case B is very low, even though the energy recovery efficiency is similar to other cases. Although the green building certification of Case A is not as good as Case B which has a three-star certificate, its rational application of energy recovery technology and excellent performance on various aspects make for a better performance in the multi-dimensional evaluation process. A better green building certificate in Case B only means there may be more green building technologies adopted; however, the higher cost makes it an unsuitable technology to use. Moreover, poor operation and equipment depletion may even cause a greater loss in investment. Therefore, it is of great significance to make predictions and comprehensive evaluation on various indices for the technology to be used in green buildings in the design stage.
5. Discussion
The above description and case study provide a brief demonstration of the pre-evaluation system for GBESTs’ suitability. However, superiorities and limitations of this system should be further discussed. For superiorities, there are mainly four aspects as follows:
(1) The pre-evaluation system of GBESTs’ suitability in this paper is devised to be mainly used at the design stage, which may assist the designers in making proper choices of green building technologies. However, this system can also be applied after the building is put into operation to verify the rationality of GBEST decision making based on the actual operation conditions, which may also provide a reference for similar buildings in the surrounding area.
(2) The pre-evaluation system in this paper does not rely on expert scoring but uses as many quantitative indices as possible in the assessment process. Through the modified TOPSIS method and unascertained theory, more reasonable and accurate index weight distribution and evaluation baselines are obtained. Besides, the adoption of a GBEST measured database provide the results with more referential significance as comparisons are made between the predicted conditions of technology to be evaluated and the GBEST used in existing buildings.
(3) Multi-dimensional comprehensive evaluation is conducted in terms of technology performance, economy, and satisfaction. Moreover, it is also available to simply evaluate technology suitability from one aspect according to specific needs. For example, it is still applicable when certain technology is only required to take the investment payback period into consideration.
(4) The relationship between this evaluation system and national standards is that it depends on, but is not confined to, the national standard and specification requirements. Technology indices and parameters required by the national standards are strictly followed and reflected in this evaluation system, while for those indices that are not regulated, the measured database can be called to set baselines. The actual application data can help to determine criteria for the evaluation. With the expansion of the database as well as the continuous advancement of GBESTs, the evaluation criteria are constantly improving. Therefore, this evaluation model is also conducive to the formulation and updates of the national standards.
Furthermore, this system unavoidably includes some limitations at the initial stage that need to be focused upon in further studies. First, the three aspects of evaluation indices may not be able to cover all the technologies; technologies differ after all. Therefore, it is also necessary to formulate detailed evaluation dimensions according to different technologies. Second, the number of green building samples is limited at the initial stage. This pre-evaluation system requires a large number of case data supporting it, because the accuracy of technical evaluation increases with the database continuously expanding, and then the measured GBEST database can be further sorted according to regions and building types. Besides, as the data volume tends to be complicated, a fixed input format for the GBESTs in existing green buildings may be helpful to achieve the database update. Finally, this evaluation system currently tries to use one algorithm to cover most of the GBESTs through their commonalities. However, this seems to lead to a lack of consideration of their own characteristics; more targeted algorithms developed for different types of technologies should also be listed in the further studies.
6. Conclusions
In this research, an effort has been made to develop a system to evaluate the suitability of green building energy-saving technologies in the building design stage. The target of this pre-evaluation system is a single technology, that is, every time only one technology can be evaluated. The evaluation process includes determining detailed evaluation indices from the performance, economical properties and satisfaction aspects; obtaining each index evaluation value through field tests, software simulation or calculation; calculating the weight of each index according to the database through the TOPSIS method and SA algorithm; setting evaluation baselines according to specifications or standards; and using sample eigenvalues from the database to give a rating scale etc. The final pre-evaluation results in terms of the degree of suitability are defined as “unsuitable”, “tolerable” and “suitable” based on the comprehensive evaluation value of a certain technology applied in the target building. GBESTs are classified into three categories: passive technologies, HVAC-related technologies, and renewable energy application technologies. The evaluation indices of typical GBESTs according to each aspect are set based on their actual requirements, considering the needs of relevant stakeholders such as building designers, users and developers; meaningless indices should not be included so as to achieve a reasonable and quantifiable comprehensive evaluation system for the suitability assessment of GBESTs. In the case study of the energy recovery technology, the accordance of evaluation results and actual application performance of Case A and Case B verifies the feasibility of the pre-evaluation system, and also demonstrates the significance of suitability pre-evaluation in the early design stage to avoid unnecessary investment.
This pre-evaluation system is convincing since it is based on national regulations, standards, as well as research data from a large number of existing green buildings in China. Although this pre-evaluation system has some unavoidable limitations, it is still a driving force for the advancement of GBEST application tin a better direction and for the promotion of deeper-level building energy conservation.
Author Contributions
The main text of the manuscript was drafted by M.F., and revised by S.L. and Y.Z. Y.Z. wrote the code in MATLAB. All the authors put forward ideas in this study and read and approved the final manuscript.
Funding
This research has been supported by “National Key R&D Program of China” (Grant No. 2016YFC0700100).
Conflicts of Interest
The authors declare no conflict of interest.
References
- Feng, W.; Huang, K.; Levine, M. Evaluation of Energy Savings of the New Chinese Commercial Building Energy Standard. In Proceedings of the 2014 ACEEE Summer Study on Energy Efficiency in Buildings, Washington, DC, USA, 17–22 August 2014. [Google Scholar]
- Jiang, Y.; Peng, C.; Yan, D. China’s building energy-saving technology roadmap. Constr. Sci. Technol. 2012, 2, 12–19. (In Chinese) [Google Scholar]
- Rouleau, J.; Gosselin, L.; Blanchet, P. Understanding energy consumption in high-performance social housing buildings: A case study from Canada. Energy 2018, 145, 677–690. [Google Scholar] [CrossRef]
- Zhao, H.; Magoulès, F. A review on the prediction of building energy consumption. Renew. Sustain. Energy Rev. 2012, 16, 3586–3592. [Google Scholar] [CrossRef]
- Li, Y.; Yang, L.; He, B.; Zhao, D. Green building in China: Needs great promotion. Sustain. Cities Soc. 2014, 11, 1–6. [Google Scholar] [CrossRef]
- Darko, A.; Chan, A.P.C.; Ameyaw, E.E.; He, B.; Olanipekun, A.O. Examining issues influencing green building technologies adoption: The United States green building experts’ perspectives. Energy Build. 2017, 144, 320–332. [Google Scholar] [CrossRef] [Green Version]
- Doan, D.T.; Ghaffarianhoseini, A.; Naismith, N.; Zhang, T.; Ghaffarianhoseini, A.; Tookey, J. A critical comparison of green building rating systems. Build. Environ. 2017, 123, 243–260. [Google Scholar] [CrossRef]
- Kajikawa, Y.; Inoue, T.; Goh, T.N. Analysis of building environment assessment frameworks and their implications for sustainability indicators. Sustain. Sci. 2011, 6, 233–246. [Google Scholar] [CrossRef]
- Lee, W.L. A comprehensive review of metrics of building environmental assessment schemes. Energy Build. 2013, 62, 403–413. [Google Scholar] [CrossRef]
- Hamedani, A.Z.; Huber, F. A comparative study of DGNB, LEED and BREEAM certificate systems in urban sustainability. Sustain. City VII 2012, 155, 121–132. [Google Scholar]
- Zhong, K.; Kang, Y. Applicability of air-to-air heat recovery ventilators in China. Appl. Therm. Eng. 2009, 29, 830–840. [Google Scholar] [CrossRef]
- Yang, R.J.; Zou, P.X.W. Stakeholder-associated risks and their interactions in complex green building projects: A social network model. Build. Environ. 2014, 73, 208–222. [Google Scholar] [CrossRef]
- Kumar, R.; Kaushik, S.C. Performance evaluation of green roof and shading for thermal protection of buildings. Build. Environ. 2005, 40, 1505–1511. [Google Scholar] [CrossRef]
- Mayhoub, M.S.; Carter, D.J. The costs and benefits of using daylight guidance to light office buildings. Build. Environ. 2011, 46, 698–710. [Google Scholar] [CrossRef]
- Geng, G.; Wang, Z.; Zhao, J.; Zhu, N. Suitability assessment of building energy saving technologies for office buildings in cold areas of China based on an assessment framework. Energy Convers. Manag. 2015, 103, 650–664. [Google Scholar] [CrossRef]
- Zhou, J.; Chen, Y. A review on applying ventilated double-skin facade to buildings in hot-summer and cold-winter zone in China. Renew. Sustain. Energy Rev. 2010, 14, 1321–1328. [Google Scholar] [CrossRef]
- Perpiña Castillo, C.; Batista E Silva, F.; Lavalle, C. An assessment of the regional potential for solar power generation in EU-28. Energy Policy 2016, 88, 86–99. [Google Scholar] [CrossRef]
- Wang, S.; Yuan, Y.; Sun, L.; Cao, X. Dynamic Analysis of Exhaust Air Total-heat Recovery of Air Conditioning System in Summer Condition of Chengdu Using TRNSYS Simulation. HV&AC 2016, 46, 128–132. (In Chinese) [Google Scholar]
- Zhao, P.; Niu, Y.T.; Xie, L.N.; Wang, Z. Green Building Technology of Regional Suitability Evaluation System Research and Case Study. Appl. Mech. Mater. 2013, 357–360, 478–481. [Google Scholar] [CrossRef]
- Si, J.; Marjanovic-Halburd, L.; Nasiri, F.; Bell, S. Assessment of building-integrated green technologies: A review and case study on applications of Multi-Criteria Decision Making (MCDM) method. Sustain. Cities Soc. 2016, 27, 106–115. [Google Scholar] [CrossRef] [Green Version]
- Dangana, Z.; Pan, W.; Goodhew, S. A Decision Making System for Selecting Sustainable Technologies for Retail Buildings. In Proceedings of the 19th CIB World Building Congress, Brisbane, Australia, 5–9 May 2013. [Google Scholar]
- Li, C.; Chen, J.; Yang, J.; Wang, X. Weight Determination Approach for Assessment Index Based on Positive and Negative Ideal Points. Ordnance Ind. Autom. 2015, 34, 22–25. (In Chinese) [Google Scholar]
- Kuo, T. A modified TOPSIS with a different ranking index. Eur. J. Oper. Res. 2017, 260, 152–160. [Google Scholar] [CrossRef]
- Rere, L.M.R.; Fanany, M.I.; Arymurthy, A.M. Simulated Annealing Algorithm for Deep Learning. Procedia Comput. Sci. 2015, 72, 137–144. [Google Scholar] [CrossRef]
- Lihua, M.; Xiaoyan, C.; Xiaohui, Y. Evaluation Method of Dissertation Based on Unascertained Rational-AHM. Procedia Eng. 2011, 15, 4751–4756. [Google Scholar] [CrossRef]
- Li, W.; Shi, H. Applying Unascertained Theory, Principal Component Analysis and ACO-based Artificial Neural Networks for Real Estate Price Determination. J. Softw. 2011, 6, 3745–3746. [Google Scholar] [CrossRef]
- Zhao, G.L.; Yang, R.G.; Ge-Ning, X.U.; Fan, X.N. Applying ambiguity-theory-based data analysis on small-size samples for mechanical reliability. Chin. J. Constr. Mach. 2010, 8, 444–448. (In Chinese) [Google Scholar]
- VDI-Standard: VDI 3807 Blatt 1. Available online: http://www.vdi.eu/nc/guidelines/vdi_3807_blatt_1-verbrauchskennwerte_fuer_gebaeude_grundlagen_/ (accessed on 9 October 2018).
- Keighley, E.C. Visual requirements and reduced fenestration in office buildings—A study of window shape. Build. Sci. 1973, 8, 311–320. [Google Scholar] [CrossRef]
- Byrd, H.; Rasheed, E. The Productivity Paradox in Green Buildings. Sustainability 2016, 8, 347. [Google Scholar] [CrossRef] [Green Version]
- Wimmler, C.; Hejazi, G.; Fernandes, E.D.O.; Moreira, C.; Connors, S. Multi-Criteria Decision Support Methods for Renewable Energy Systems on Islands. J. Clean. Energy Technol. 2015, 3, 185–195. [Google Scholar] [CrossRef]
- China Academy of Building Research, Evaluation standard for application of renewable energy in buildings. In GB/T 50801-2013; China Architecture and Building Press: Beijing, China, 2013. (In Chinese)
- China Academy of Building Research, Air-to-Air Energy Recovery Equipment. In GB/T 21087-2007; China Architecture and Building Press: Beijing, China, 2007. (In Chinese)
- China Academy of Building Research, Design standard for energy efficiency of public buildings. In GB 50189-2015; China Architecture and Building Press: Beijing, China, 2015. (In Chinese)
Figure 1.
Framework of the pre-evaluation system.

Figure 2.
Building energy consumption grading in VDI 3807 [28].
Figure 2.
Building energy consumption grading in VDI 3807 [28].

Figure 3.
Evaluation grading axis.

Figure 4.
(a) Office building A in Shijiazhuang City, Hebei Province; (b) teaching building B in Tianjin.
Figure 4.
(a) Office building A in Shijiazhuang City, Hebei Province; (b) teaching building B in Tianjin.

Figure 5.
Energy recovery technology pre-evaluation rating axis.


Table 1.
Single technology data collection table [22].
Table 1.
Single technology data collection table [22].
| Case Sample | Evaluation Indices | |||
|---|---|---|---|---|
| ... | ||||
| ... | ||||
| ... | ||||
| ... | ... | ... | ... | ... |
| ... | ||||
| ... | ||||
| ... | ||||
Table 2.
Evaluation grading results.
| Situations | Demarcation Points | Evaluation Results | |||||
|---|---|---|---|---|---|---|---|
| a | b | c | I | II | III | IV | |
| 1 | M | S | O | Unsuitable | Tolerable | Suitable | |
| 2 | M | O | S | Unsuitable | Tolerable | Suitable | |
| 3 | S | M | O | Unsuitable | Tolerable | Suitable | |
Table 3.
Evaluation indices of typical green building energy-saving technologies (GBESTs).
| Types | Technology | Performance Indices | Cost and Benefit Indices | Satisfaction Indices |
|---|---|---|---|---|
| Passive technologies | Double-skin facade | Heat transfer coefficient/Shading coefficient | Incremental investment payback period (PBP) | Sound insulation/DGP (Daylight Glare Probability) |
| Tubular daylighting | System efficiency 1 | Incremental investment PBP | —— | |
| Adjustable sun shading | Comprehensive energy consumption ratio | Incremental investment PBP | Light flux ratio/DGP | |
| Heating, ventilation and air-conditioning (HVAC) technologies | Energy recovery | Energy recovery efficiency 1 | Incremental investment PBP | —— |
| Radiant floor heating | Energy-saving rate | Incremental investment PBP | PMV | |
| Independent temperature-humidity control | Energy-saving rate | Incremental investment PBP | —— | |
| High efficiency cold and heat source | COP/EER improvement 1 | Incremental investment PBP | —— | |
| Renewable energy-related technologies | Solar photovoltaic power generation | Photoelectric conversion efficiency1 | Incremental investment PBP | —— |
| Solar hot water heating | Energy collection efficiency1 | Incremental investment PBP 1 | Indoor air temperature 1 | |
| Ground source heat pump | EER/COP 1 | Incremental investment PBP 1 | Indoor air Temperature 1 |
1 shows the index is regulated in national standards or guidelines in China.
Table 4.
Basic building information.
| Building | Total Area | Stories above the Ground | GBESTs Used in the Buildings |
|---|---|---|---|
| A | 11,090 | 6 | High-efficiency thermal insulation wall system Exhaust air heat recovery system Ground-source heat pump system Solar hot water system |
| B | 10,762 | 3 | Roof greening Tubular daylighting system Exhaust air heat recovery technology |
Table 5.
Heat exchange efficiency requirements for heat recovery units.
| Type | Exchange Efficiency | |
|---|---|---|
| Cooling | Heating | |
| Enthalpy efficiency | >50% | >55% |
| Temperature efficiency | >60% | >65% |
Table 6.
Sample statistics table of energy recovery technology.
| Cases | Building Occupancy | Location | Using Time 1 | Recovery Forms 2 | Recovery Efficiency | Payback Period (Year) |
|---|---|---|---|---|---|---|
| A | Office | Shijiazhuang | A | Sensible | 0.78 | 2.8 |
| B | Teaching | Tianjin | W | Sensible | 0.62 | 16.96 |
| 1 | Factory | Benxi | W&S | Sensible | 0.75 | 1 |
| 2 | Office | Chendu | W&S | Total | 0.648 | 4.5 |
| 3 | Office | Guangzhou | W&S | Total | 0.65 | 5.5 |
| 4 | Office | Shenzhen | S | Total | 0.60 | 8 |
| 5 | Office | Zhujiang | S | Sensible | 0.70 | 5 |
| 6 | Residence | Guangzhou | S | Total | 0.65 | 3.3 |
1 Using time: A = All year round, W = Winter, S = Summer; 2 Recovery forms: Sensible = Sensible heat recovery, Total = Total heat recovery.
Table 7.
Data processing results of the cases.
| Cases | Positive Management | Non-Dimensionalization | ||
|---|---|---|---|---|
| 0.78 | 0.357 | 0.41 | 0.31 | |
| 0.62 | 0.059 | 0.32 | 0.05 | |
| 0.75 | 1.000 | 0.39 | 0.86 | |
| 0.648 | 0.222 | 0.34 | 0.19 | |
| 0.65 | 0.182 | 0.34 | 0.16 | |
| 0.6 | 0.125 | 0.31 | 0.11 | |
| 0.7 | 0.200 | 0.37 | 0.17 | |
| 0.65 | 0.303 | 0.34 | 0.26 | |
Table 8.
Comprehensive evaluation results of sample cases and the cases to be evaluated.
| Case | ||||||||
|---|---|---|---|---|---|---|---|---|
| Comprehensive evaluation | 0.35 | 0.16 | 0.67 | 0.25 | 0.23 | 0.19 | 0.25 | 0.29 |
© 2018 by the authors. Licensee MDPI, Basel, Switzerland. This article is an open access article distributed under the terms and conditions of the Creative Commons Attribution (CC BY) license (http://creativecommons.org/licenses/by/4.0/).
Share and Cite
MDPI and ACS Style
Lu, S.; Fan, M.; Zhao, Y. A System to Pre-Evaluate the Suitability of Energy-Saving Technology for Green Buildings. Sustainability 2018, 10, 3777. https://doi.org/10.3390/su10103777
AMA Style
Lu S, Fan M, Zhao Y. A System to Pre-Evaluate the Suitability of Energy-Saving Technology for Green Buildings. Sustainability. 2018; 10(10):3777. https://doi.org/10.3390/su10103777
Chicago/Turabian StyleLu, Shilei, Minchao Fan, and Yiqun Zhao. 2018. "A System to Pre-Evaluate the Suitability of Energy-Saving Technology for Green Buildings" Sustainability 10, no. 10: 3777. https://doi.org/10.3390/su10103777
Note that from the first issue of 2016, this journal uses article numbers instead of page numbers. See further details here.