Modelling of Reversible Plant System Operations in a Cultural Heritage School Building for Indoor Thermal Comfort


Department of Industrial Engineering, University of Florence, via Santa Marta 3, 50139 Florence, Italy
*
Author to whom correspondence should be addressed.
Sustainability 2018, 10(10), 3776; https://doi.org/10.3390/su10103776
Submission received: 28 July 2018
/
Revised: 9 October 2018
/
Accepted: 15 October 2018
/
Published: 19 October 2018
(This article belongs to the Section Tourism, Culture, and Heritage)
Abstract
:The aim of our present research is to investigate possible solutions for the achievement of indoor comfort with the absence of any draft risks in the occupied zones of Cultural Heritage school building. A simple method for sustainable, reversible, and easily maintainable operations on the plant system, oriented to indoor comfort improvement and possible building-plant system refurbishment, is provided. It is based on thermal comfort assessment at an early design stage, carried out by dynamic simulation and CFD techniques. It helps to identify major ineffective equipment in historical school buildings, and potential sustainable, noninvasive, reversible, and conservative measures. Results obtained by a simulation exercise of a historical school building, a check case study, showed that the evaluation of thermal comfort conditions can be a strong guideline for reversible plant design. This guarantees building protection and preventive conservation. Refurbishment and retrofitting solutions, with a lower impact can be identified. Thus in depth assessment of the building physics and plant performance aiming at energy efficacy and sustainability, can contribute to finding out the balance between energy saving, sustainability, and quality of life. Our method can be a useful tool for effectiveness analysis on retrofit and refurbishment measures for similar case studies.
1. Introduction
Energy efficiency has become a common target for buildings and plant systems: European Directives point out that new buildings must consume less and less fossil energy and reach the nZEB goal by 2020 [1,2,3]. Most research has demonstrated that refurbishment and retrofitting interventions on the existing building heritage is a cogent and complex task [4,5]. This is particularly true for historical state school buildings. Furthermore, results published with the European HESE study (Health Effects of School Environment [6]) of the World Health Organization (WHO) involving 21 European schools with constant monitoring of respiratory health of over 600 Italian, Swedish, Norwegian, French, and Danish students, showed that indoor air quality (IAQ) in the classrooms was poor (especially due to dust concentrations, CO2, allergens, and moulds) with respiratory health effects. The well-known SEARCH project (School Environment and Respiratory health of Children [7]) involved 10 countries in three phases based on indoor and outdoor monitoring of 60 schools. The three project phases were SEARCH I, on energy consumption in schools; SEARCH II, for impact assessment on the children and staff health; and SEARCH III with the realization of an educational toolkit for teachers with fun activities for children between 8 and 11 years. The wider project, SINPHONIE [8], involved 114 schools distributed in 23 European countries with over 5000 children involved and reached the conclusion that 85% of students are exposed to fine particles in concentrations well above the values per cubic meter established by the WHO as the danger threshold. This situation does not improve for other pollutants such as radon, benzene, formaldehyde, and carbon dioxide, all found in quantities that, even in this case, come to exceed the parameters expected in 25% of cases for benzene and in 50% of cases for radon.
At the end of the Sinphonie project, guidelines [8] were developed for governments and schools so as to allow small children to enjoy a healthy school environment during lesson hours.
Existing school buildings are much larger than new constructions and are responsible for most of energy consumption. While it can be stated that newly built schools mostly comply with the requirements of sustainability, energy saving, and use of renewable energy sources suggested previously [9], cannot be equally affirmed with regard to existing buildings, especially if they belong to the historical cultural heritage. Very often, energy solutions in the field of renovation are not always compatible with historical buildings and preservation of historical value, authenticity and integrity.
One of the fundamental characteristics of historical school buildings in Italy is the partial utilization of the structure, in terms of time and indoor environments. Generally, they have good mass and thermal inertia, but low thermal insulation of the roof and floors, windows, and glazed systems. As a consequence, heating systems are not correctly dimensioned, the rooms are too hot in winter and ventilation (air renewal) is never enough.
A great deal of research concerns the energy performance improvement of school buildings by means of interventions using solar energy, passive solutions, better construction features (i.e., higher thermal insulation, thermal mass, and shading systems) and HVAC systems (Heating, Ventilating, and Air Conditioning), albeit mostly concerning new construction buildings [10,11].
Some authors have worked out a set of well-defined and structured procedures to establish basic guidelines for the assessment of energy performance and indoor climate in schools, identifying potential corrective measures for indoor air quality (IAQ) and thermal comfort [12,13]. Others have investigated the air flow pattern in terms of temperature and velocity along with thermal comfort quantification by varying clothing index and air inlet and outlet-recovery diffuser positions in two university test rooms [14]. Most of the recent literature has shown that dynamic energy simulation is fundamental for retrofit measure efficacy and efficiency evaluation [12,14], in particular because retrofitting and refurbishment produce combined effects [15,16,17,18]. Transient simulations based on Computational Fluid Dynamic (CFD) techniques, play an essential role in analysing the performance of retrofit measures, identifying the best air-conditioning system, assessing indoor microclimatic parameters and thermal comfort indexes in historical school buildings [16,17,19].
Analysing recent literature on existing school buildings (especially historical constructions), basic assumptions regarding retrofitting and refurbishment operations on the building-plant system, energy saving, and conservation measures, as well as thermal comfort, indoor air quality, occupancy and acclimatization schedules, internal loads, and architectural features are not the same and are usually based on specific local conditions. This is the reason why, even in the presence of similar external and internal climatic conditions, these studies do not lead to results and conclusions of general value [17,18,19].
Extensive literature has provided integrated methodological approaches for the energy performances assessment of building-plant systems in schools, taking into account indoor climate, indoor air quality, well-being, health, and development of student cognitive and comprehension activities, using in situ measurements, monitoring campaigns, energy audits, cost analysis, and transient simulations [20,21,22,23,24,25,26]. Generally, these methodologies involve: (a) architectural features and plant system analysis; (b) experimental field measurements; (c) collected data processing on user/student perception; (d) dynamic simulation of the building-plant system for thermophysical, energy performance, and energy consumption evaluation; (e) thermal comfort assessment by transient simulation; (f) assessment of energy saving, efficacy/efficiency, and cost due to retrofit and refurbishment solutions for school energy improvement; and (g) indoor air quality and comfort achievement [23,26,27,28]. Some recent literature has provided crucial guidelines for the achievement of cultural heritage energy efficiency, even if not always uniquely and strictly applicable to all types of existing historical buildings and plants [27,29,30]. Other literature has shown that it is possible to achieve very low and/or nearly zero energy standards for historical buildings [31,32]. It has also been demonstrated that plant system retrofitting and refurbishment are the most effective and sustainable operations because they have a shorter payback time and are more easily achievable [32,33,34].
Starting from a recent study on the subject [35], in this research the authors investigated the optimal, minimally invasive, reversible, and sustainable operations, on plant systems of historical school buildings with particular attention to the air flow scheme for improving indoor climate, thermal comfort, student health, and well-being in compliance with the constraints for preventive protection and conservation. A historical building occupied by a high school in Florence (Italy) was the case study. The research presented here focuses on thermal comfort quantification by means of air flow patterns in terms of indoor air temperature and velocity distribution, with reference to, and comparison with the main literature [36,37,38,39]. Reversible and sustainable plant system operations were considered specifically oriented to its terminal units. In our study, a simple method of practical use for the assessment of effectiveness and sustainability of solutions oriented to indoor comfort improvement, and building-plant system possible refurbishment, is provided. The novelty of the proposed method concerns the use of thermal comfort assessment by means of dynamic simulation and CFD techniques. These are the basic criteria for the early plant design stage, allowing the identification of plant solutions combined with effective air flow schemes and occupants comfort and health.
This method is extensible, with modifications and adaptations due to specific individual conditions, to all similar cases of existing building-plant systems, belonging to the cultural heritage. This also concerns old buildings and recent construction design.
2. Materials and Methods
This study aims at identifying the correct choice and placing of the heating plant terminal units for historical school building environments. The methodological approach used was based on field-practical research, necessary for useful data and information collection. In Italy, schools are frequently located in historical buildings with high cultural value and often places of worship (e.g., former, churches, and monasteries) and are usually state owned. Transient CFD simulations aimed at defining an optimal heating plant solution and indoor air flow scheme guaranteeing health, well-being, and thermal comfort for occupants and being minimally invasive, reversible, dynamic, and easily manageable and removable, were carried out.
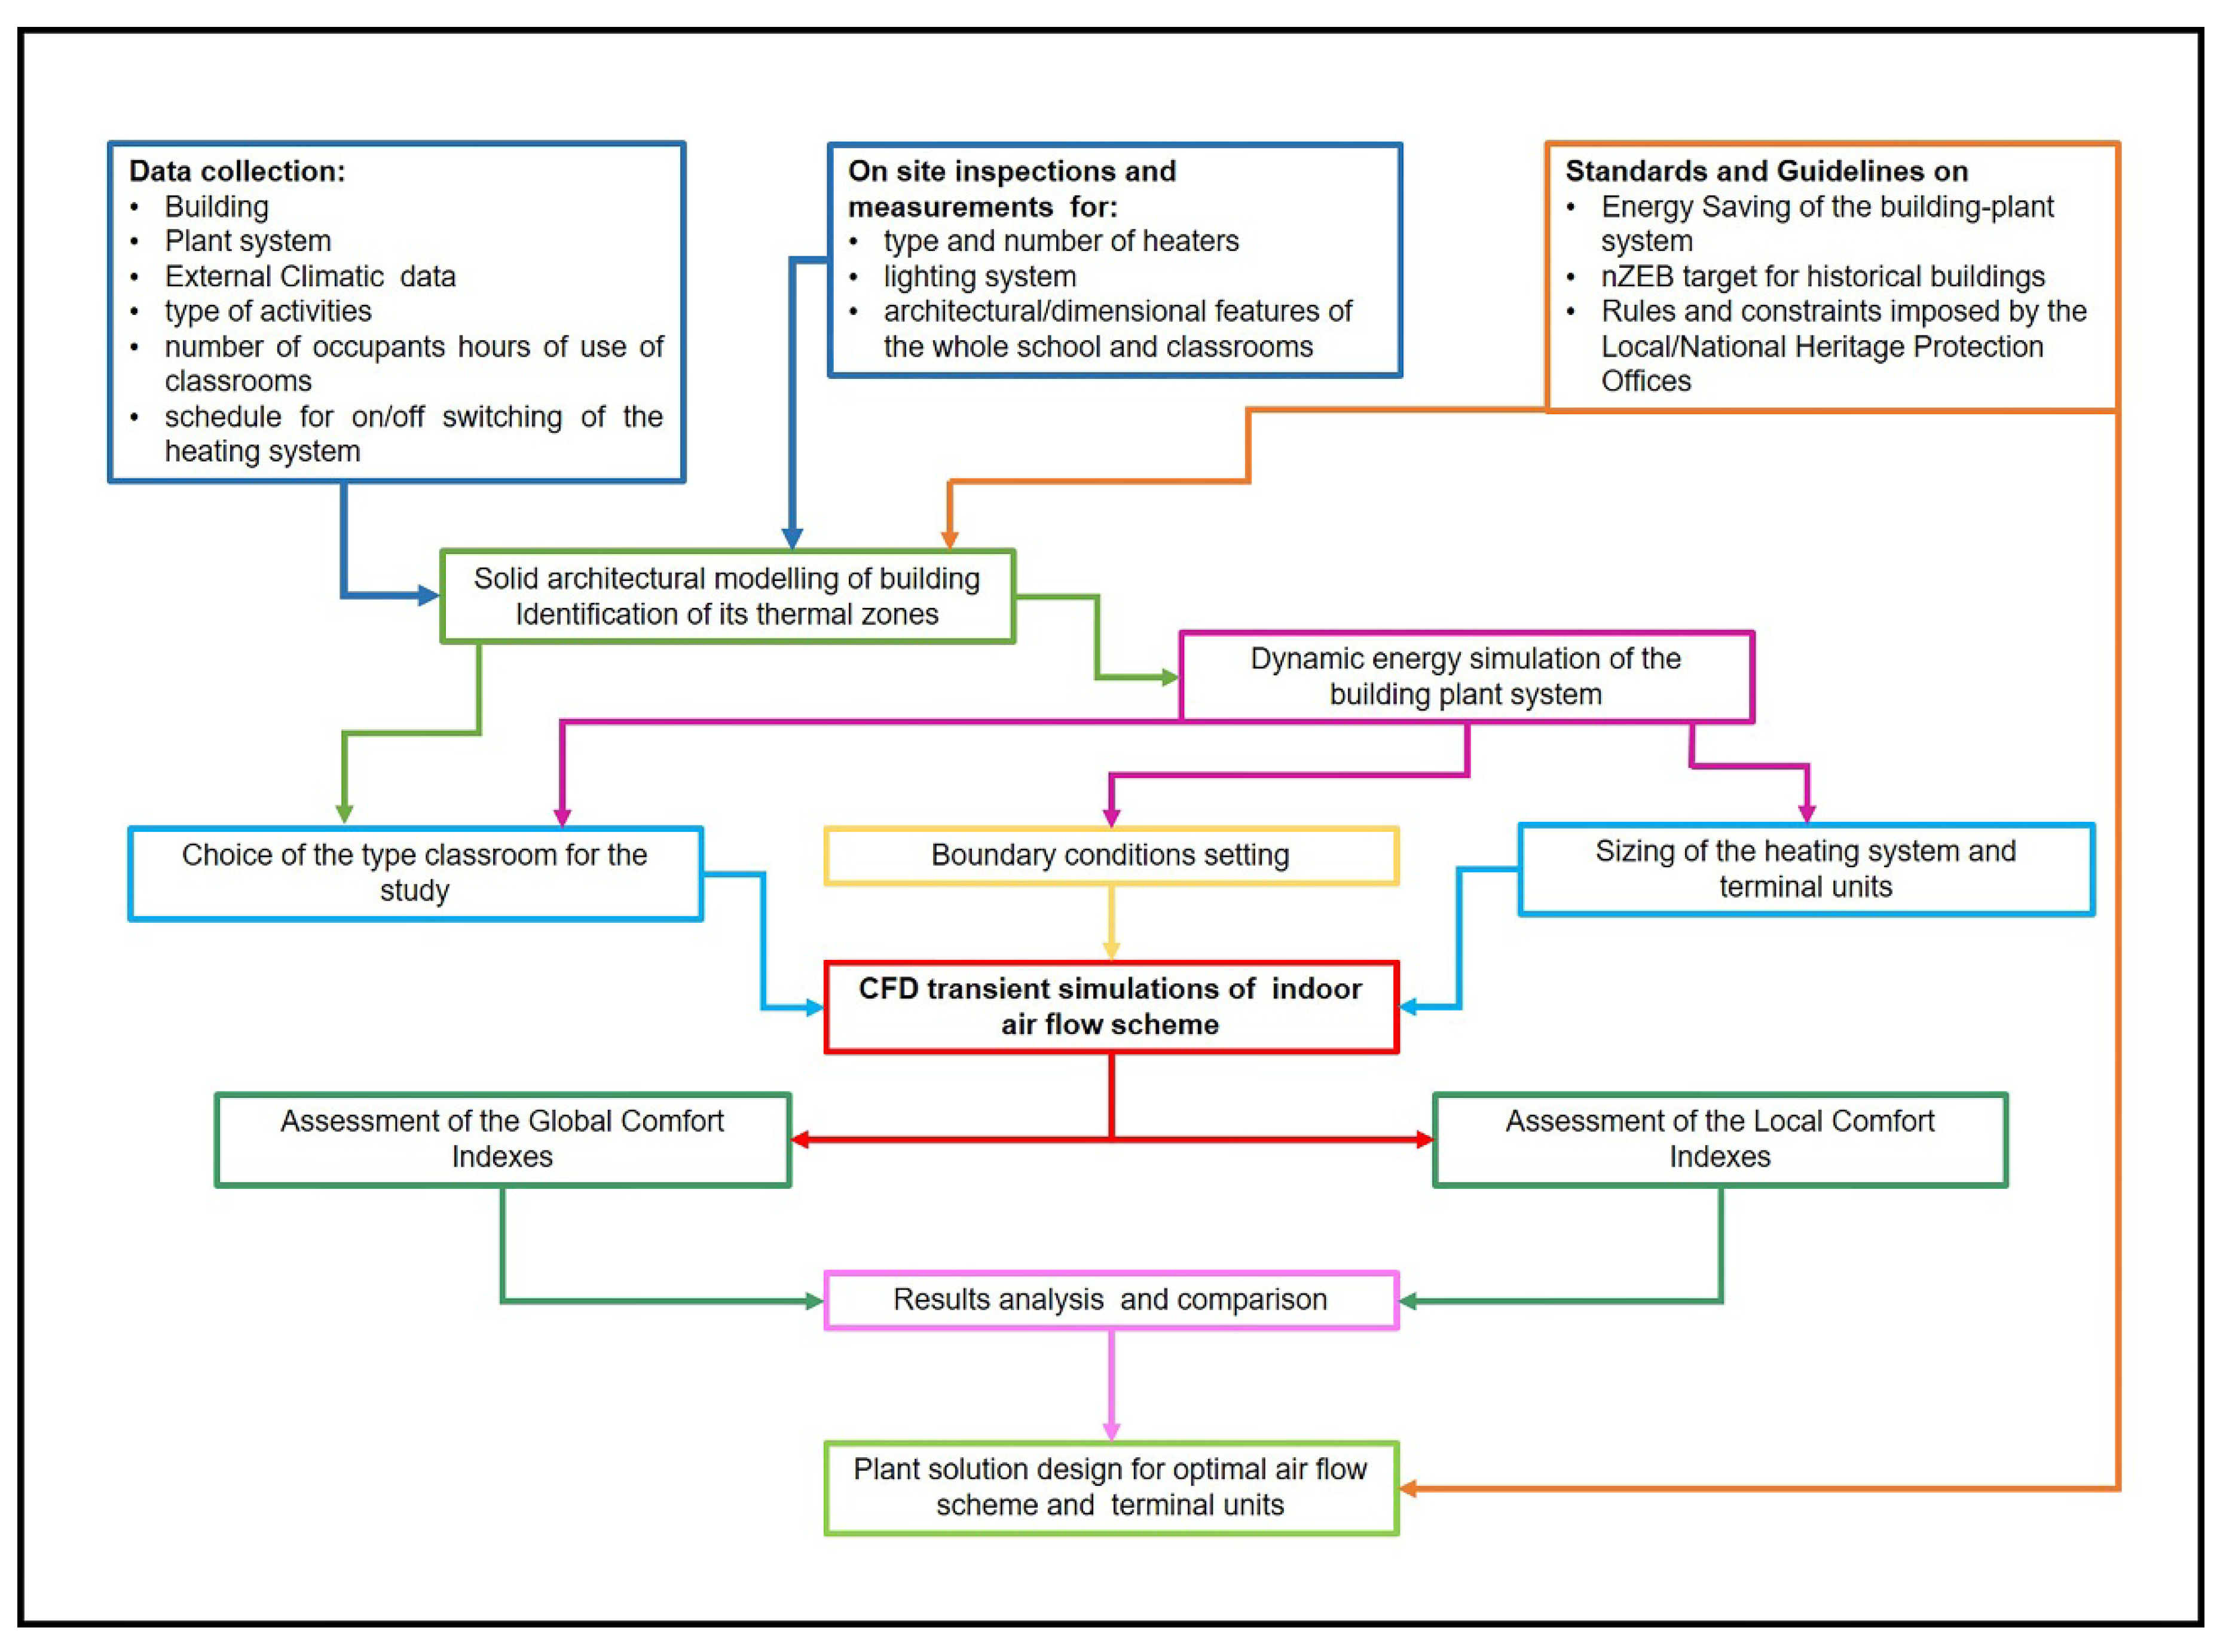
Our proposed method can be a useful tool for the evaluation of the real applicability, in-depth assessment, and comparison of different retrofitting and refurbishment interventions on historical building-plant systems, in compliance with the current standards for protection and preventive conservation with the main aim of user health, well-being, and thermal comfort. The proposed methodology requires first the connected different phases: data collection of external climate, architectural and dimensional features of the building, thermophysical properties of the envelope, characteristics and energy consumption of the plant system, and present laws and standards. The second phase is a connected step for the three-dimensional modelling of the building-plant system and involves energy dynamic simulations, transient CFD simulations, and results post-processing. The final crucial phase concerns the assessment, by an integrated approach based on CFD simulation results of the indoor thermal comfort. This could also be easily used as a decisional and preliminary design tool for sustainable plant system interventions. A scheme of the logical process of the proposed method application is provided by the flowchart in Figure 1.
2.1. Data Collection
Most data on the architectural features of the school building and plant systems (i.e., heating and lighting) were provided by the Metropolitan City of Florence (public authority for school buildings management and administration) together with architectural drawings, technical reports, adjustment interventions for fire regulations, and any functional information (e.g., type of activities, number of occupants and hours of classroom use, and schedule for on/off switching of the heating system). However, direct inspections for determination of the type, position, and number of heaters in each classroom, the structure, artificial lighting system, type of windows, and shielding elements, were carried out. All the constructive and thermophysical characteristics of building materials were obtained by technical reports of the Metropolitan City of Florence and comparison with historical and scientific sources.
2.2. Dynamic Energy Simulation of the Building Plant System
Building-plant system analysis carried out by dynamic simulations using commercial software TRNSYS have been shown in a recent paper [35]. Here [35] the simulation models were calibrated and validated with real data of yearly heating consumption. The authors demonstrated that active operations for plant system improvements can be more effective than building envelope improvements for possible retrofitting and refurbishment projects with minor impact on the historical value of the school building. They are also noninvasive with lower costs and pay-back time [35]. Furthermore, the authors analysed the whole building taking into account the different thermal zones (thermophysical data, schedule concerning activity, occupation, and plant-system) and the heating plant system composed of cast iron radiators with barycentric distribution. The heating period was taken in compliance with Italian Building Regulations (from 1 November to 15 April [35]). Results obtained from simulations performed on the “present state” demonstrated that the heat generator is consistently dimensioned and the dry bulb air temperature values in the classrooms are different and oscillating with positive and negative values around the set-point [35]. This is due to the fact that there is no control system and radiator numbers are not always sufficiently dimensioned [35]. This means that set-point conditions cannot always be guaranteed in all the classrooms. In particular, the “present state” of the building-plant system studied refers to the real present condition of a building that had undergone isolation interventions on the envelope (i.e., roof, slab-under roof room, slab-wattle, and pavement on the ground floor) and heating plant retrofitting with heat generator and radiator terminal unit replacement [35]. The heating plant consists of a condensing boiler with modulating burner powered by methane gas. The heating system terminal units consist of cast iron radiators with important thermal inertia, without thermostatic valves. These are placed in a central position of the longer opaque walls of each classroom facing the corridor.
Real energy consumption only refers to methane consumption for school heating during the winter period and not to hot water use, because there is no dedicated hydraulic system. This was deduced from the annual billing invoice data over two years (2012/2013–2013/2014). Comparison between real energy consumption, normalized to the heating degree days to take into account the influence of external climatic conditions, and simulated energy consumption provided reliability and validity of the transient simulation model [35].
Starting from dynamic simulation results obtained for the “present state” in a past paper [35], we carried out CFD simulations, using them as boundary conditions. The external climatic data used for the building-plant simulation were extracted from a standard year in Florence.
2.3. The Case Study
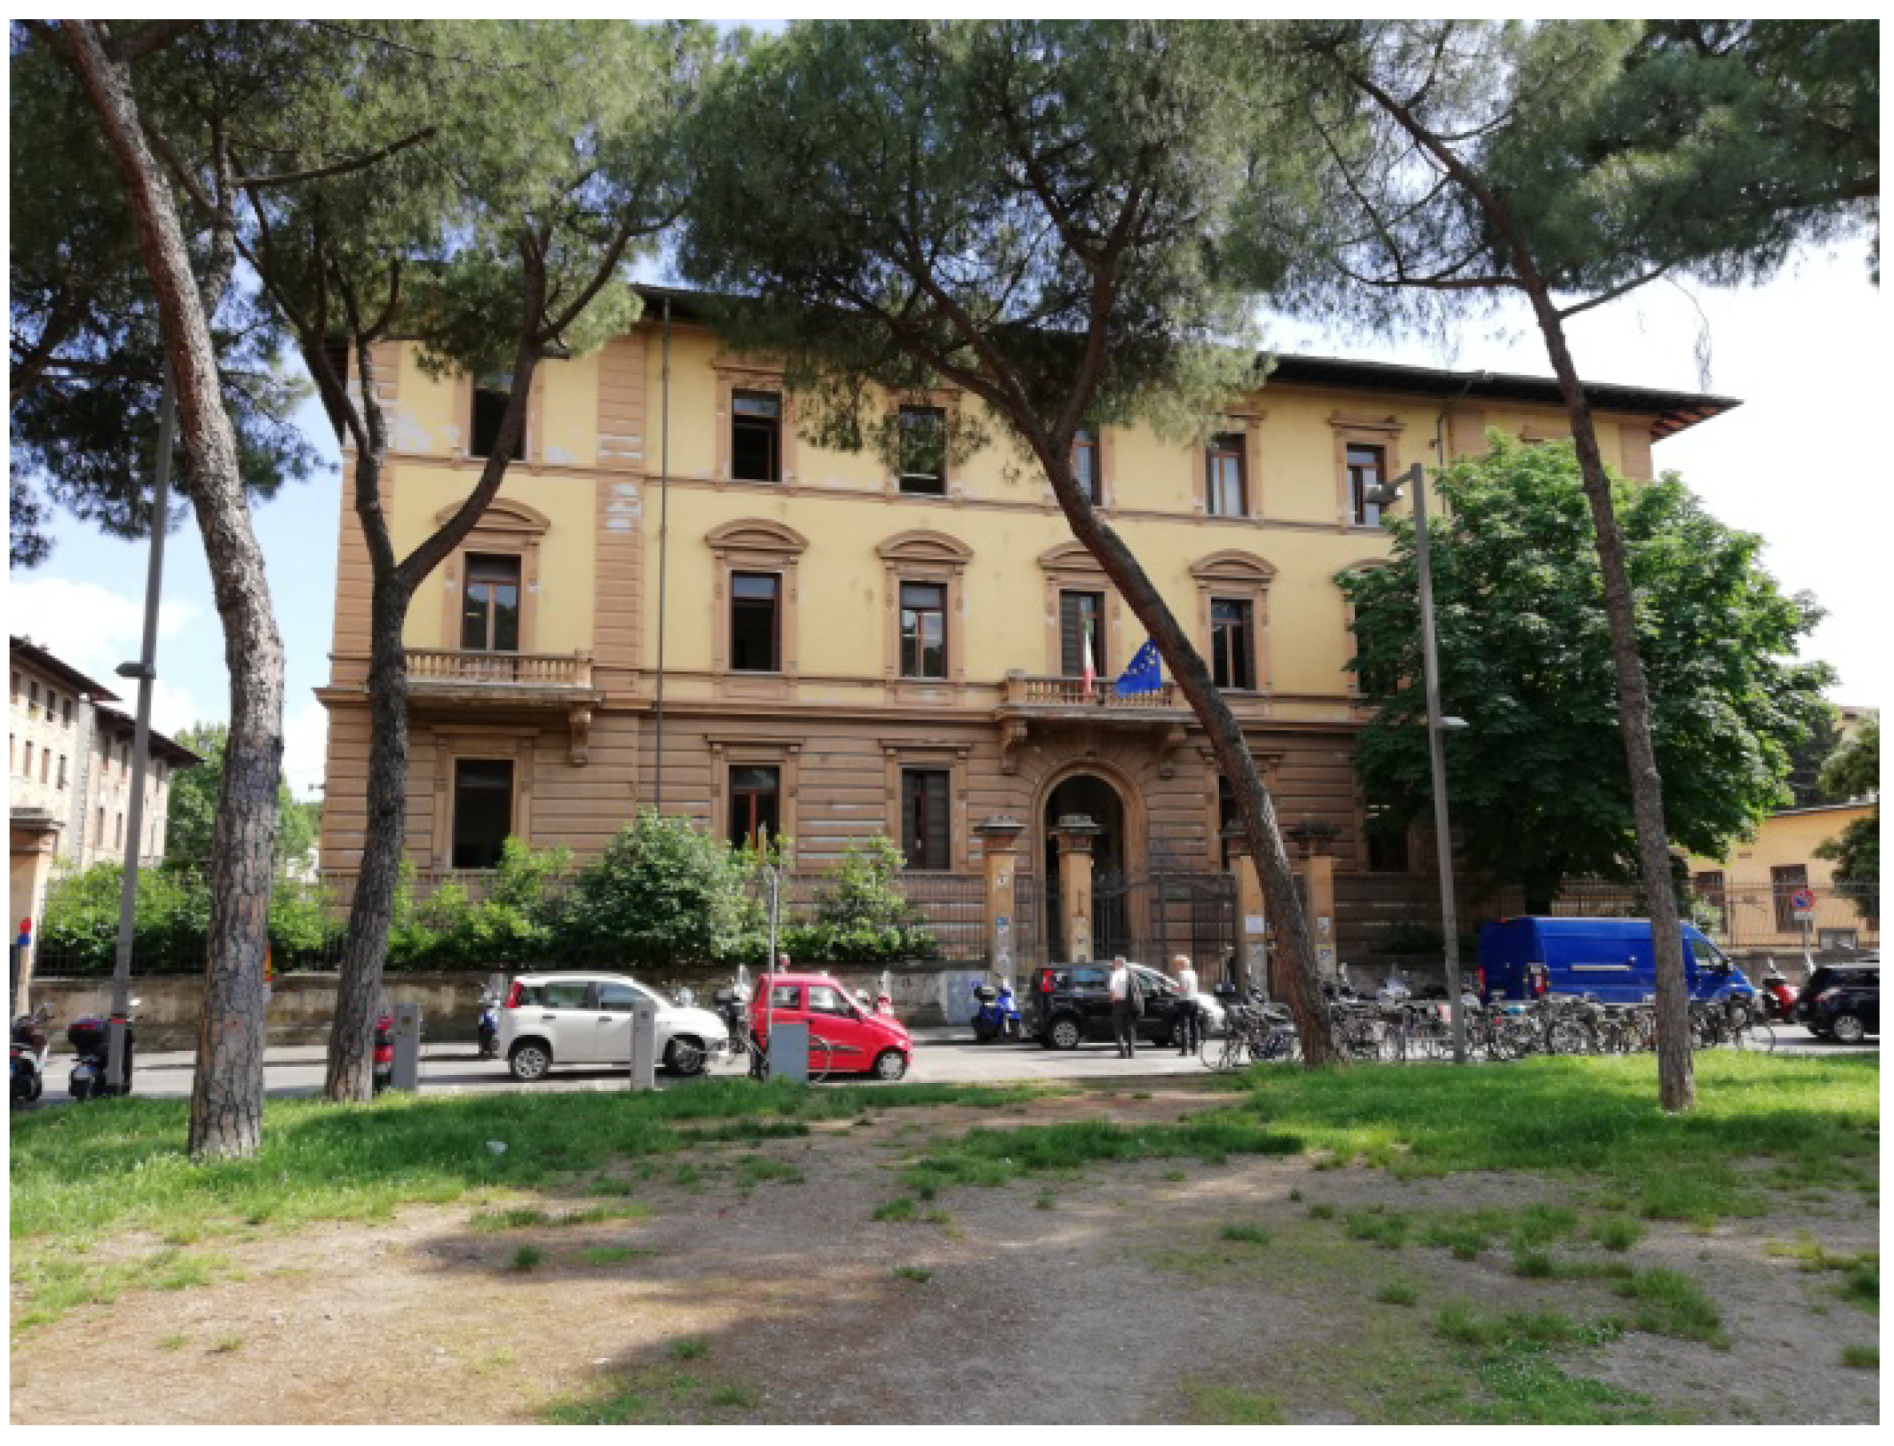
A historical building used as a high school (with an important music department) located in Florence (Italy) was the case study. It is a compact building (Figure 2) with three floors above ground exposed to all four cardinal points and rotated with respect to the north by 18 degrees counter-clockwise. In particular, a significant classroom, representative for orientation and positioning, was chosen for achieving results. These may be extendible and applicable to other similar environments with the same use and hours of occupation, dimensional and architectural features, and climatic location.
The classroom studied is located on the first floor, adjacent to other classrooms and with central access to the corridor. The external wall is north-oriented (i.e., the worst condition). Architectural and thermophysical properties of building materials are provided in Table 1.
Thermal loads due to the occupants’ activity were assumed to be in agreement with a previous paper [40]: for the classrooms “seated, very light writing” i.e., 120 W per occupant, of which 65 W was sensible heat and 55 W latent heat with a clothing thermal resistance for the winter season of 1 clo. Profiles over time of classroom occupation were defined by assuming precautionary conditions with maximum utilization and disregarding time for lunch, because it is not included in the school timetable. The occupation times for each classroom were assumed to be from 8:00 a.m. to 2:00 p.m. with maximum presence, and from 2:00 p.m. from 7:00 p.m. with reduced presence. Thermal load due to the lighting system was assumed to be 5 Wm−2: there are eight fluorescent lamps with 28 W absorbed power in each classroom of area 35 m2. The lighting turn-on time and the connected thermal load were assumed to be from 8:00 a.m. to 7.00 p.m. Indoor set-point values were set in compliance with a previous work [41], at 20 °C temperature and 50% relative humidity.
2.4. CFD Transient Simulations of the Indoor Air Flow Patterns
The air flow path and velocity distribution assessment, connected to the resulting variation of the indices and parameters concerning global/local comfort, was developed by CFD application. An applicative program of DesignBuilder software was used.
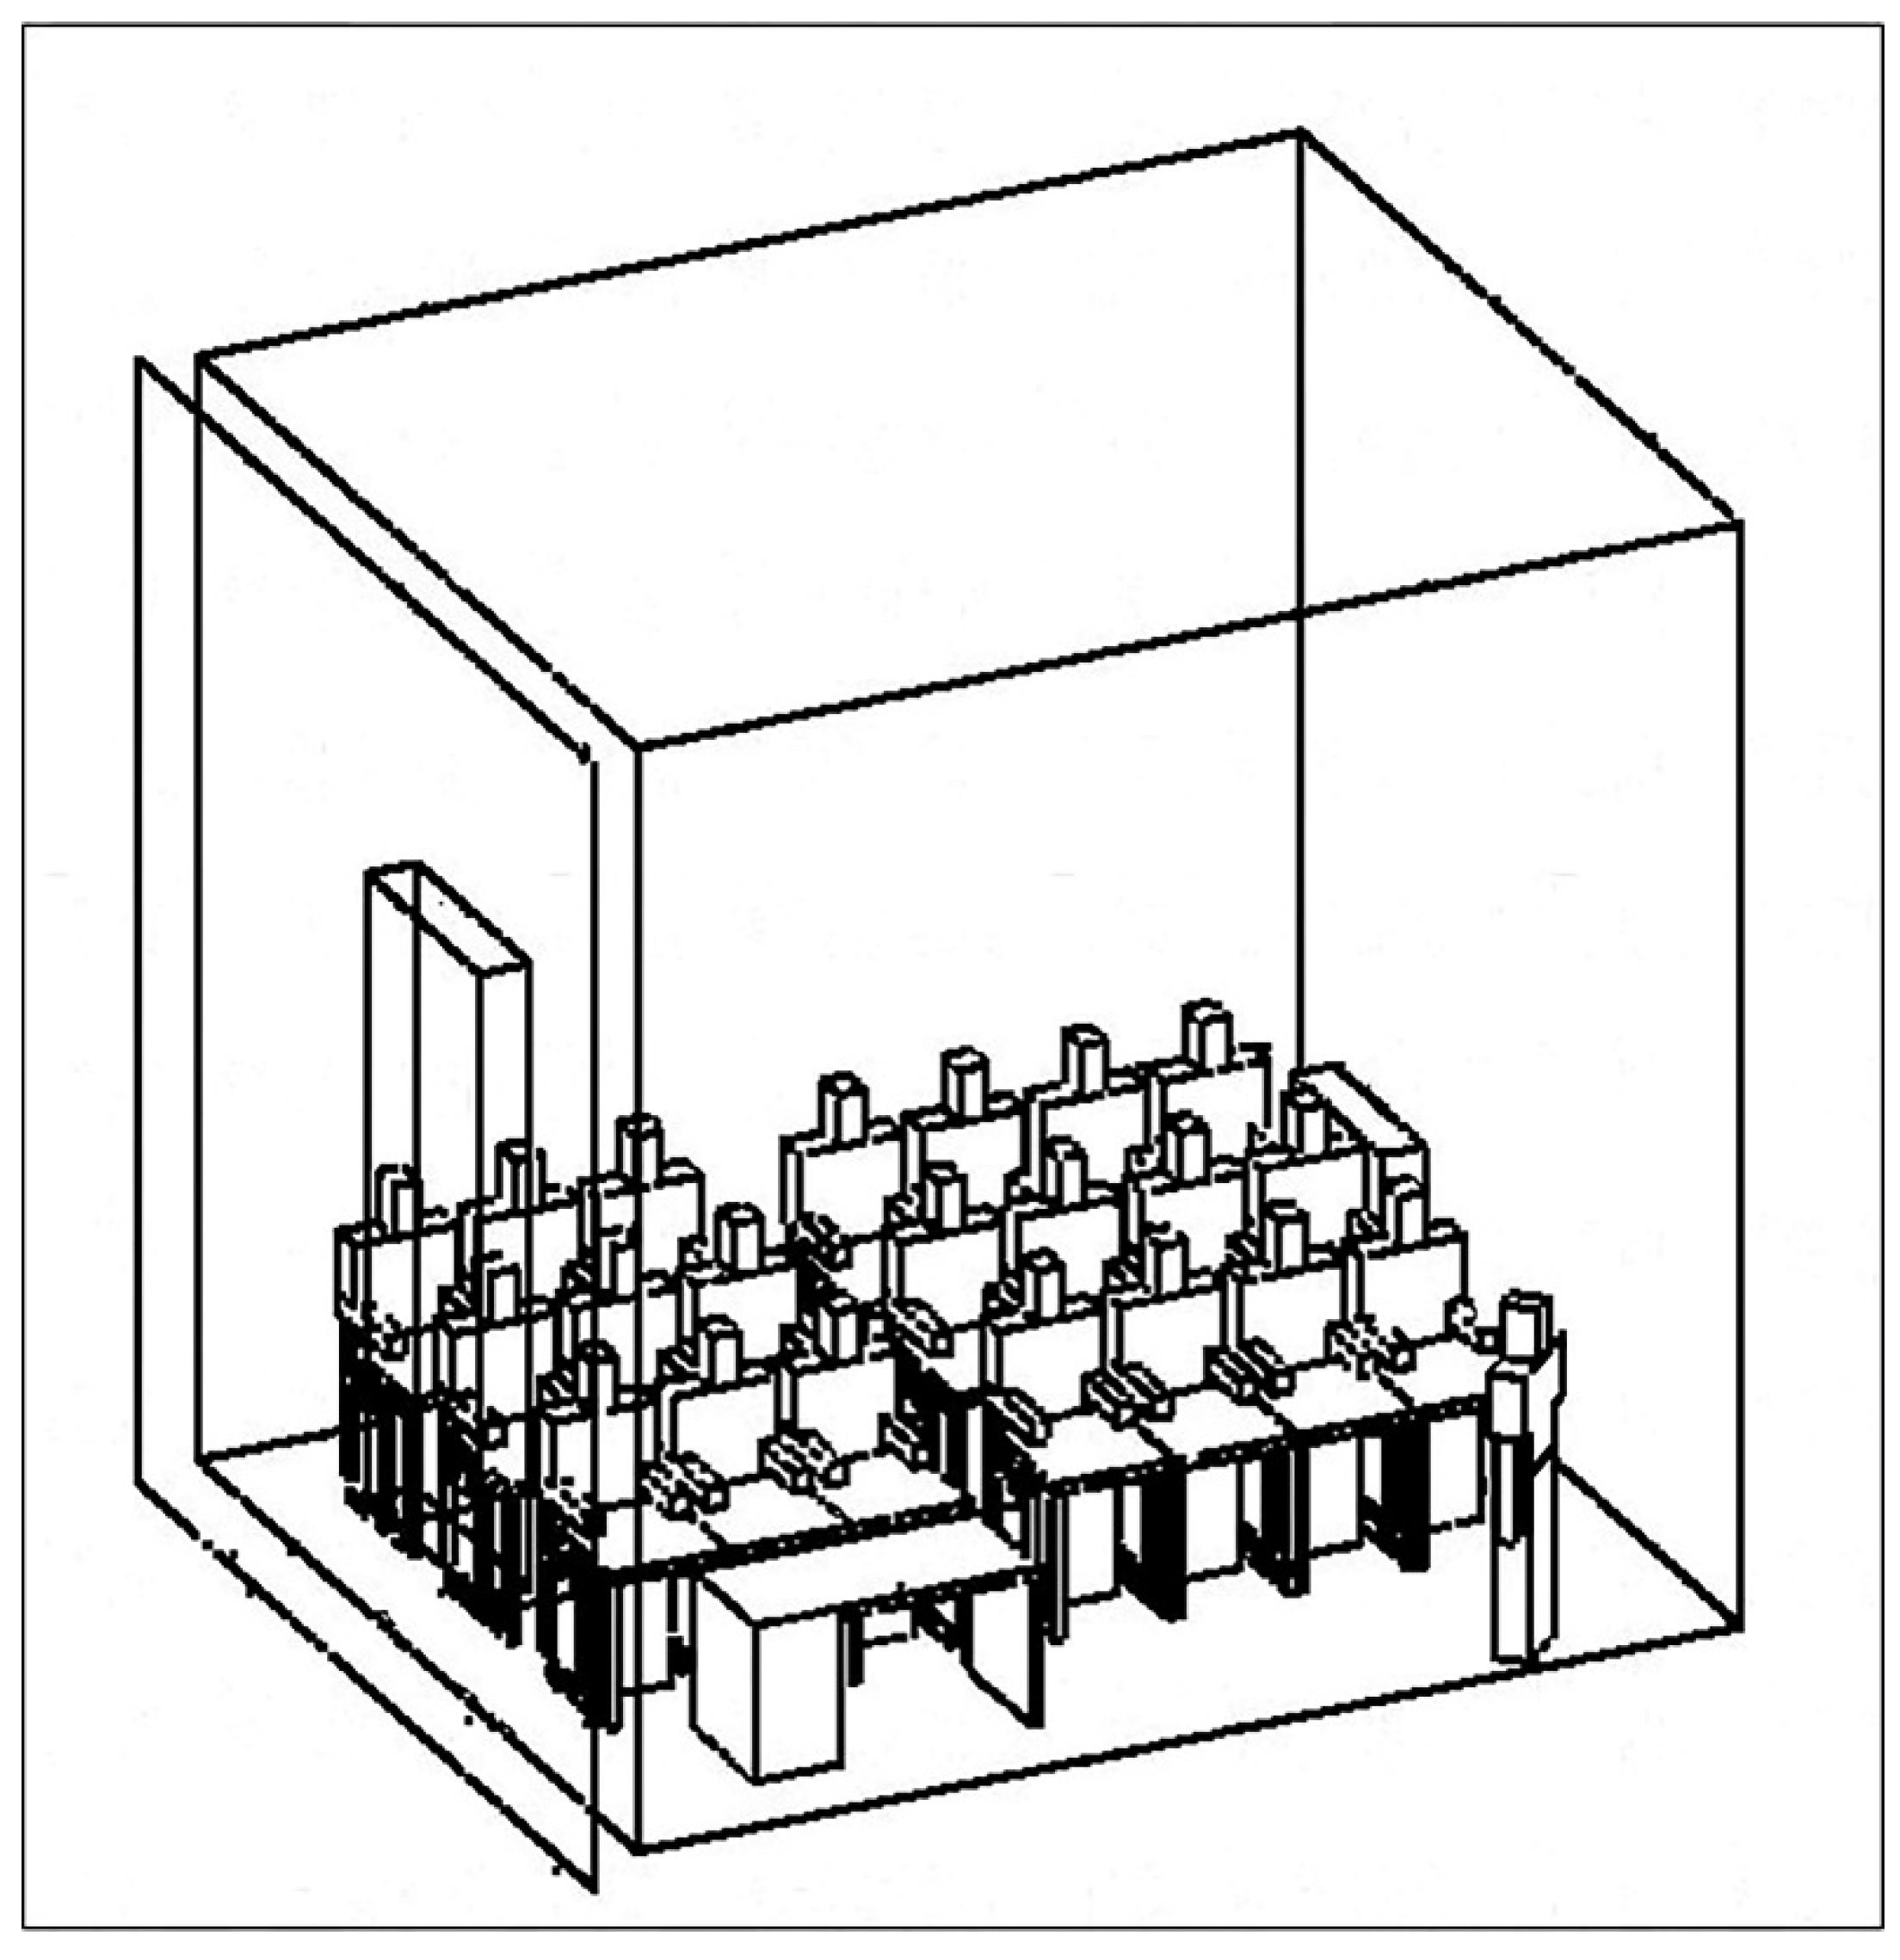
A dedicated solid-architectural 3D model of the studied classroom was made by geometrical data previously compared before with those collected by trial tests in situ. The classroom dimensions are 5.30 m length, 6.4 m width, and 5.3 m height. There is only one window of 1.4m in width, 3.0 m height and north-oriented, and one cast iron radiator positioned on the internal wall facing the corridor (Figure 3).
All the desks, including the teacher’s desk, the basic furniture, and lighting system were modelled: the students were taken to be seated and the teacher standing. Total heat (i.e., sensible plus latent heat) released to the ambient environment by each occupant was assumed to be equal to 120 W. The cloth thermal resistance was assumed to be equal to 1 clo in connection with a metabolic rate of 1.2 met as reported previously [40]. The occupants were always considered without body movements. This boundary condition allowed us to disregard the corrections of clothing insulation and metabolic rate connected to air movement effects [37,42,43].
CFD was applied to the geometry of the studied room carried out by the solid modelling where all the different computational domains and persons sitting and/or standing were considered in the simulations. The mean surface temperature and exchanged heat flux, obtained by means of building-plant system dynamic simulation, were assigned to each wall and building component and/or solid object, and then assumed to be boundary conditions for CFD transient simulations: 19.5 °C for the mean value of surface temperature of internal walls, partitions and ceiling; 17.8 °C for the external walls; 11.1 °C for the window; and 75 °C for the radiator.
Several simulations were performed until dynamic equilibrium of the system was reached, from which the initial stationary conditions of the transients could be detected: 14.6 °C for the indoor air temperature and 50% for relative humidity. These values contain the effects over time before the power-on of the heating system until its steady operation, heat transfer to the external environment at night, and thermal inertia of the massive perimetral walls. The positive effects of thermal inertia, quantified through the parameter of phase shift and decrement or attenuation factor (i.e., the ratio between the external temperature variation and the heat flux given inside to keep indoor air temperature constant) showed the heat accumulation capacity of the masonry walls, and therefore its gradual release with a time delay, outside (during the hours when the external air temperature is lower than the internal one with the plant off) and inside the classrooms (for the hours when the external air temperature is higher than the internal one with the plant off).
The external climatic data used, corresponding to the coldest day of the year, were selected from the analysis of the typical Florence reference year. Of the total transient simulation, the boundary conditions corresponding to the central hours of the day (12:00 a.m.) were set, being affected by the highest external climate forces (i.e., incident solar radiation and the fictitious sun-air temperature) and strong delay effects due to building mass and its thermal inertia.
3. Results and Discussion
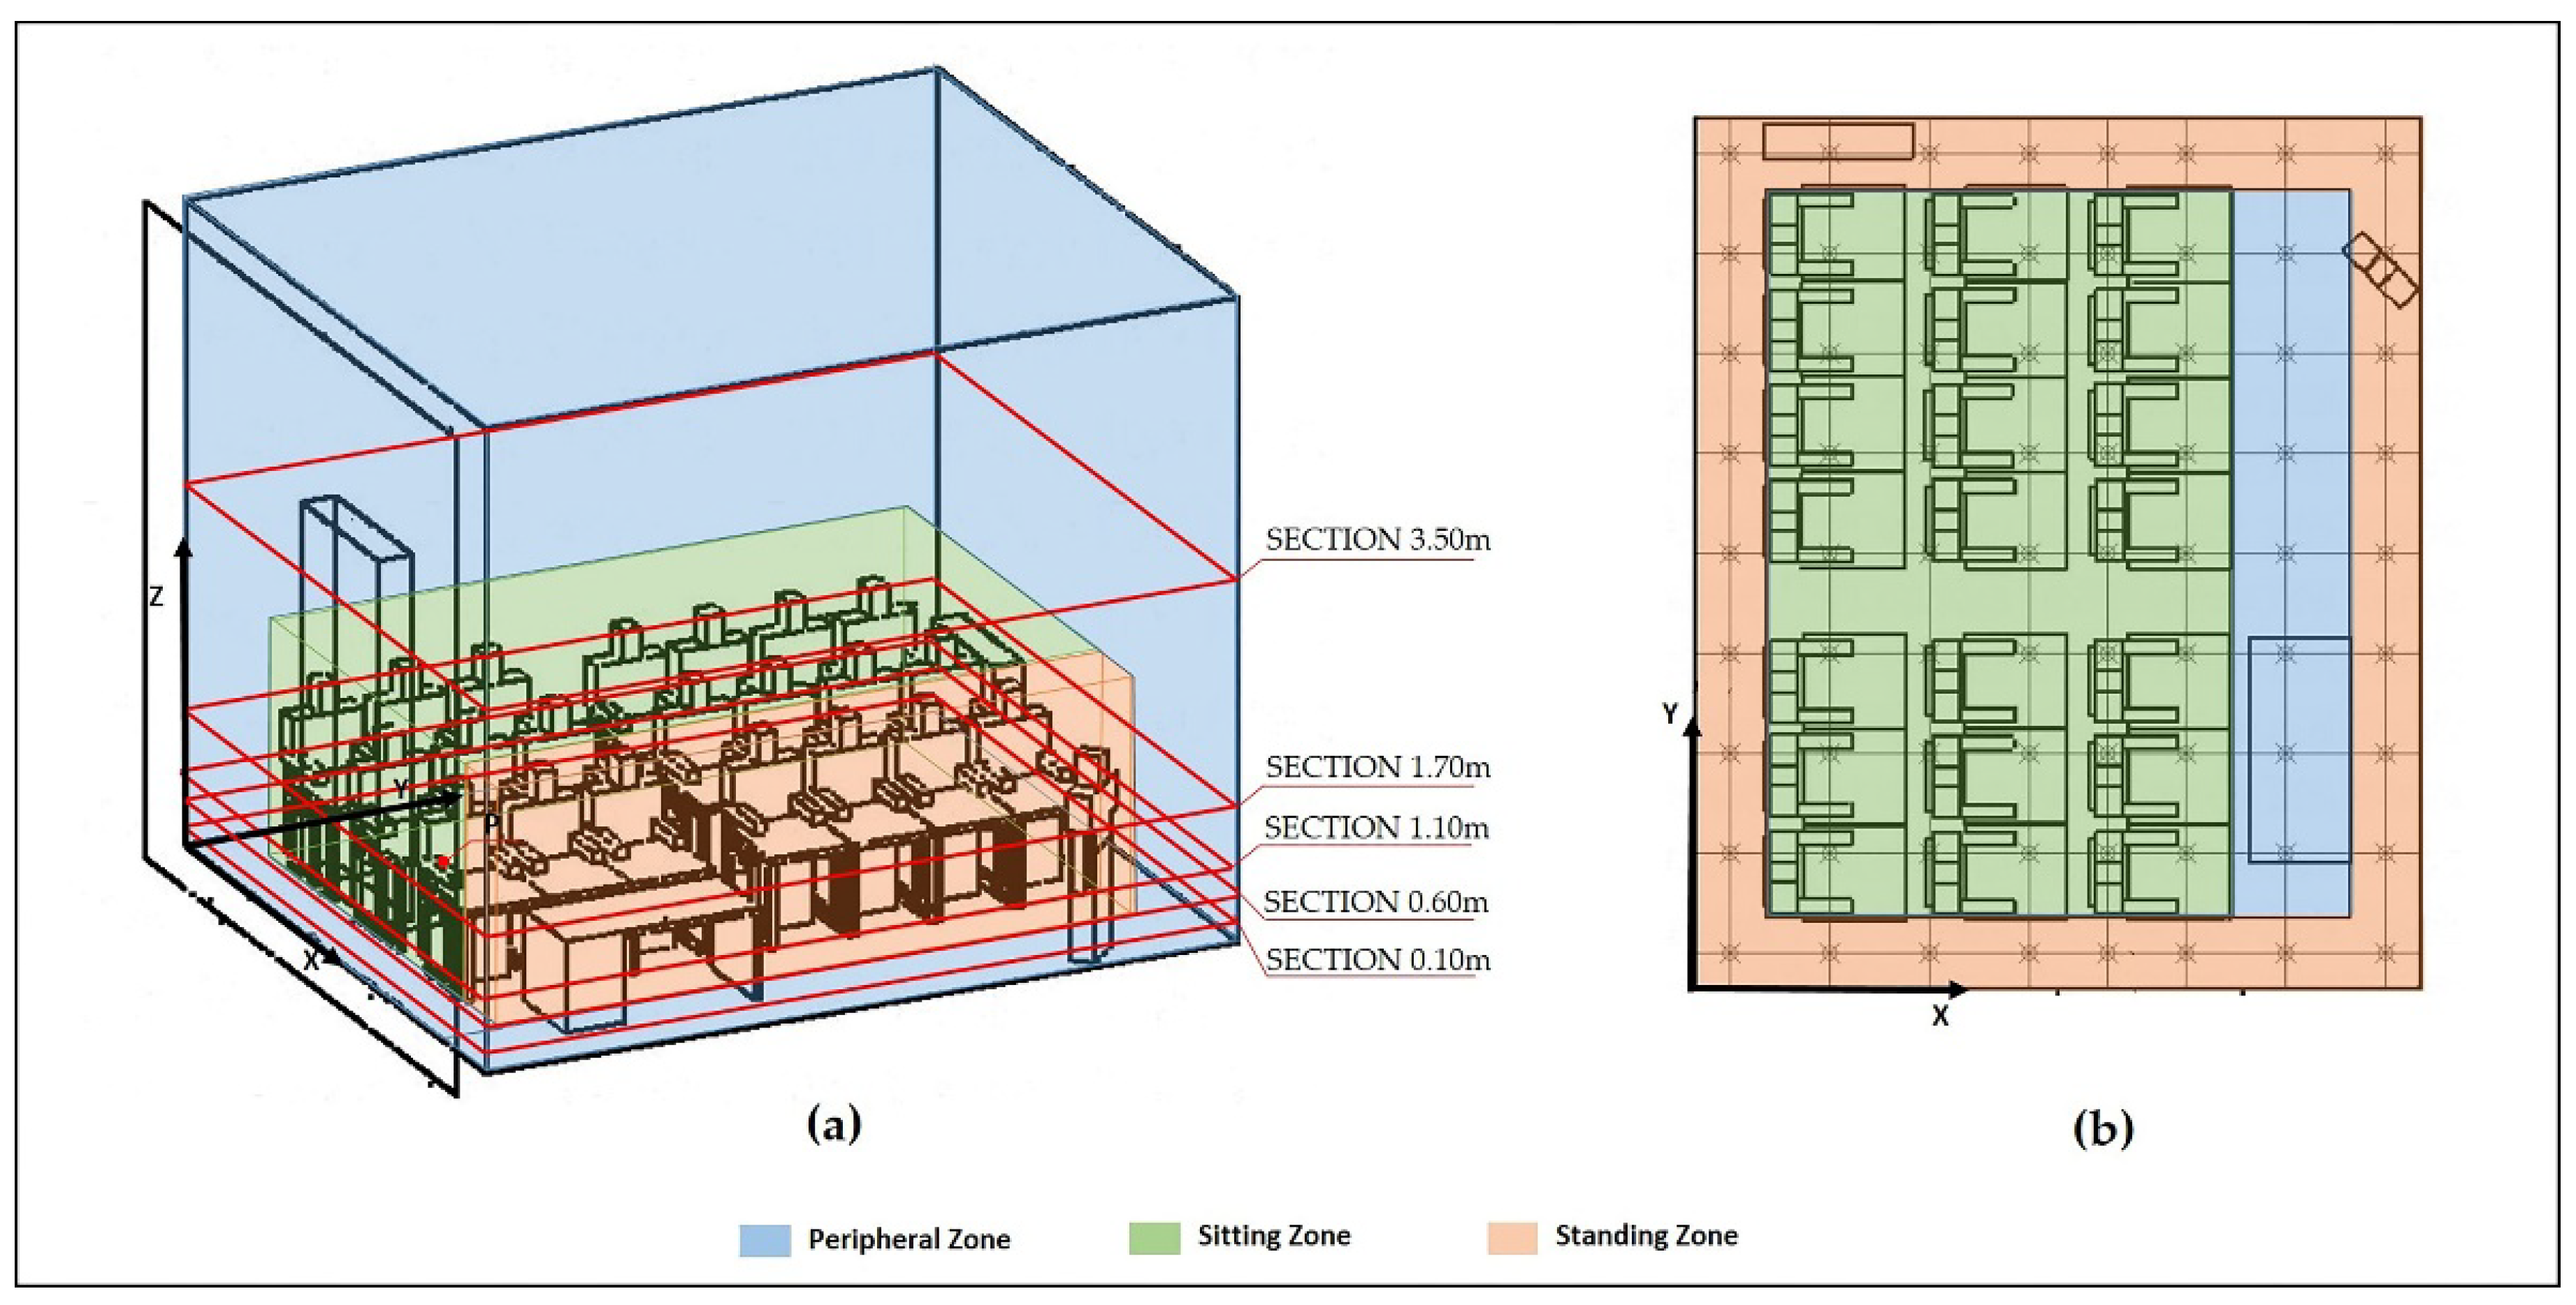
In this section results obtained by the CFD transient simulations are presented and discussed. Simulation results were used to obtain thermal local and global parameters of the environment. These are dry-bulb air temperature, mean radiant temperature, air velocity, turbulence index, plane radiant temperature, and operative temperature. Knowing these parameters, the comfort indices were evaluated for the global volume of the classroom and separately for the following subareas identified in agreement with a past paper [44] (Figure 4a,b). The aforementioned subareas are
- Occupied zone: occupation area between the floor level and 1800 mm from the walking plane and 1000 mm away from the perimetral walls and air conditioning equipment [44]. This area was identified and adapted to the case study; in particular, it was divided into two subvolumes: a sitting area corresponding to the volume occupied by students and with a crowding index of 1.2 people m−2 and a standing zone corresponding to the volume occupied by the teacher and with a crowding index of 4.1 people m−2.
- Peripheral zone: this zone corresponds to the volume complementary to the occupied zone and with a null crowding index.
A square mesh of 0.70 m on each side was defined and located at significant heights that take into account stratigraphic and altimetric variation of all the parameters (i.e., for a seated person at the height of 0.1 m, 0.60 m, and 1.1 from the floor and for a standing person at the height 0.1 m, 1.10 m, and 1.7 m from the floor) in relation to the above-defined zones. To take into account the volume above the occupied zone, connected to the peripheral zone, the height of 3.5 m was also considered.
By way of example, Figure 4b shows a horizontal section of the mesh. In Figure 4a an axonometric cross-section, with the identification of the aforesaid zones, is provided.
In particular, it can be noted that any point of the grid has three spatial coordinates such as point “P” of Figure 4a,b with coordinates 3.05-0.95-1.10 m (XX-YY-ZZ).
For comfort condition assessment, local and global parameters were used. CFD transient simulations led to the thermo-hygrometric parameters and comfort indices. The software used implements the standard [40] and provides the point values and maps of the above indices and parameters for the total volume of the environment. Knowing the distribution (maps) and the connected point values of all the indices, the Predicted Mean Vote (PMV) and Predicted Percentage Dissatisfied (PPD) were identified. These indices were assessed with reference only to the occupied zone, because they are strictly connected to people presence. By using the parameters concerning the occupied zone, the Draft Risk (DR) index in compliance with those of a previous paper [40] and the Effective Temperature (ET) index in compliance with a previous paper [45] were evaluated.
DR was only calculated in the presence of mechanical ventilation (it takes into account the turbulence index (Tu) and dry bulb temperature of the air and its velocity [40]). In particular, Tu was calculated by means of the standard deviation between the values of punctual velocity and those of the corresponding mean value. ET, which takes into account the dry bulb temperature, air velocity, and relative humidity, was calculated as reported previously [45].
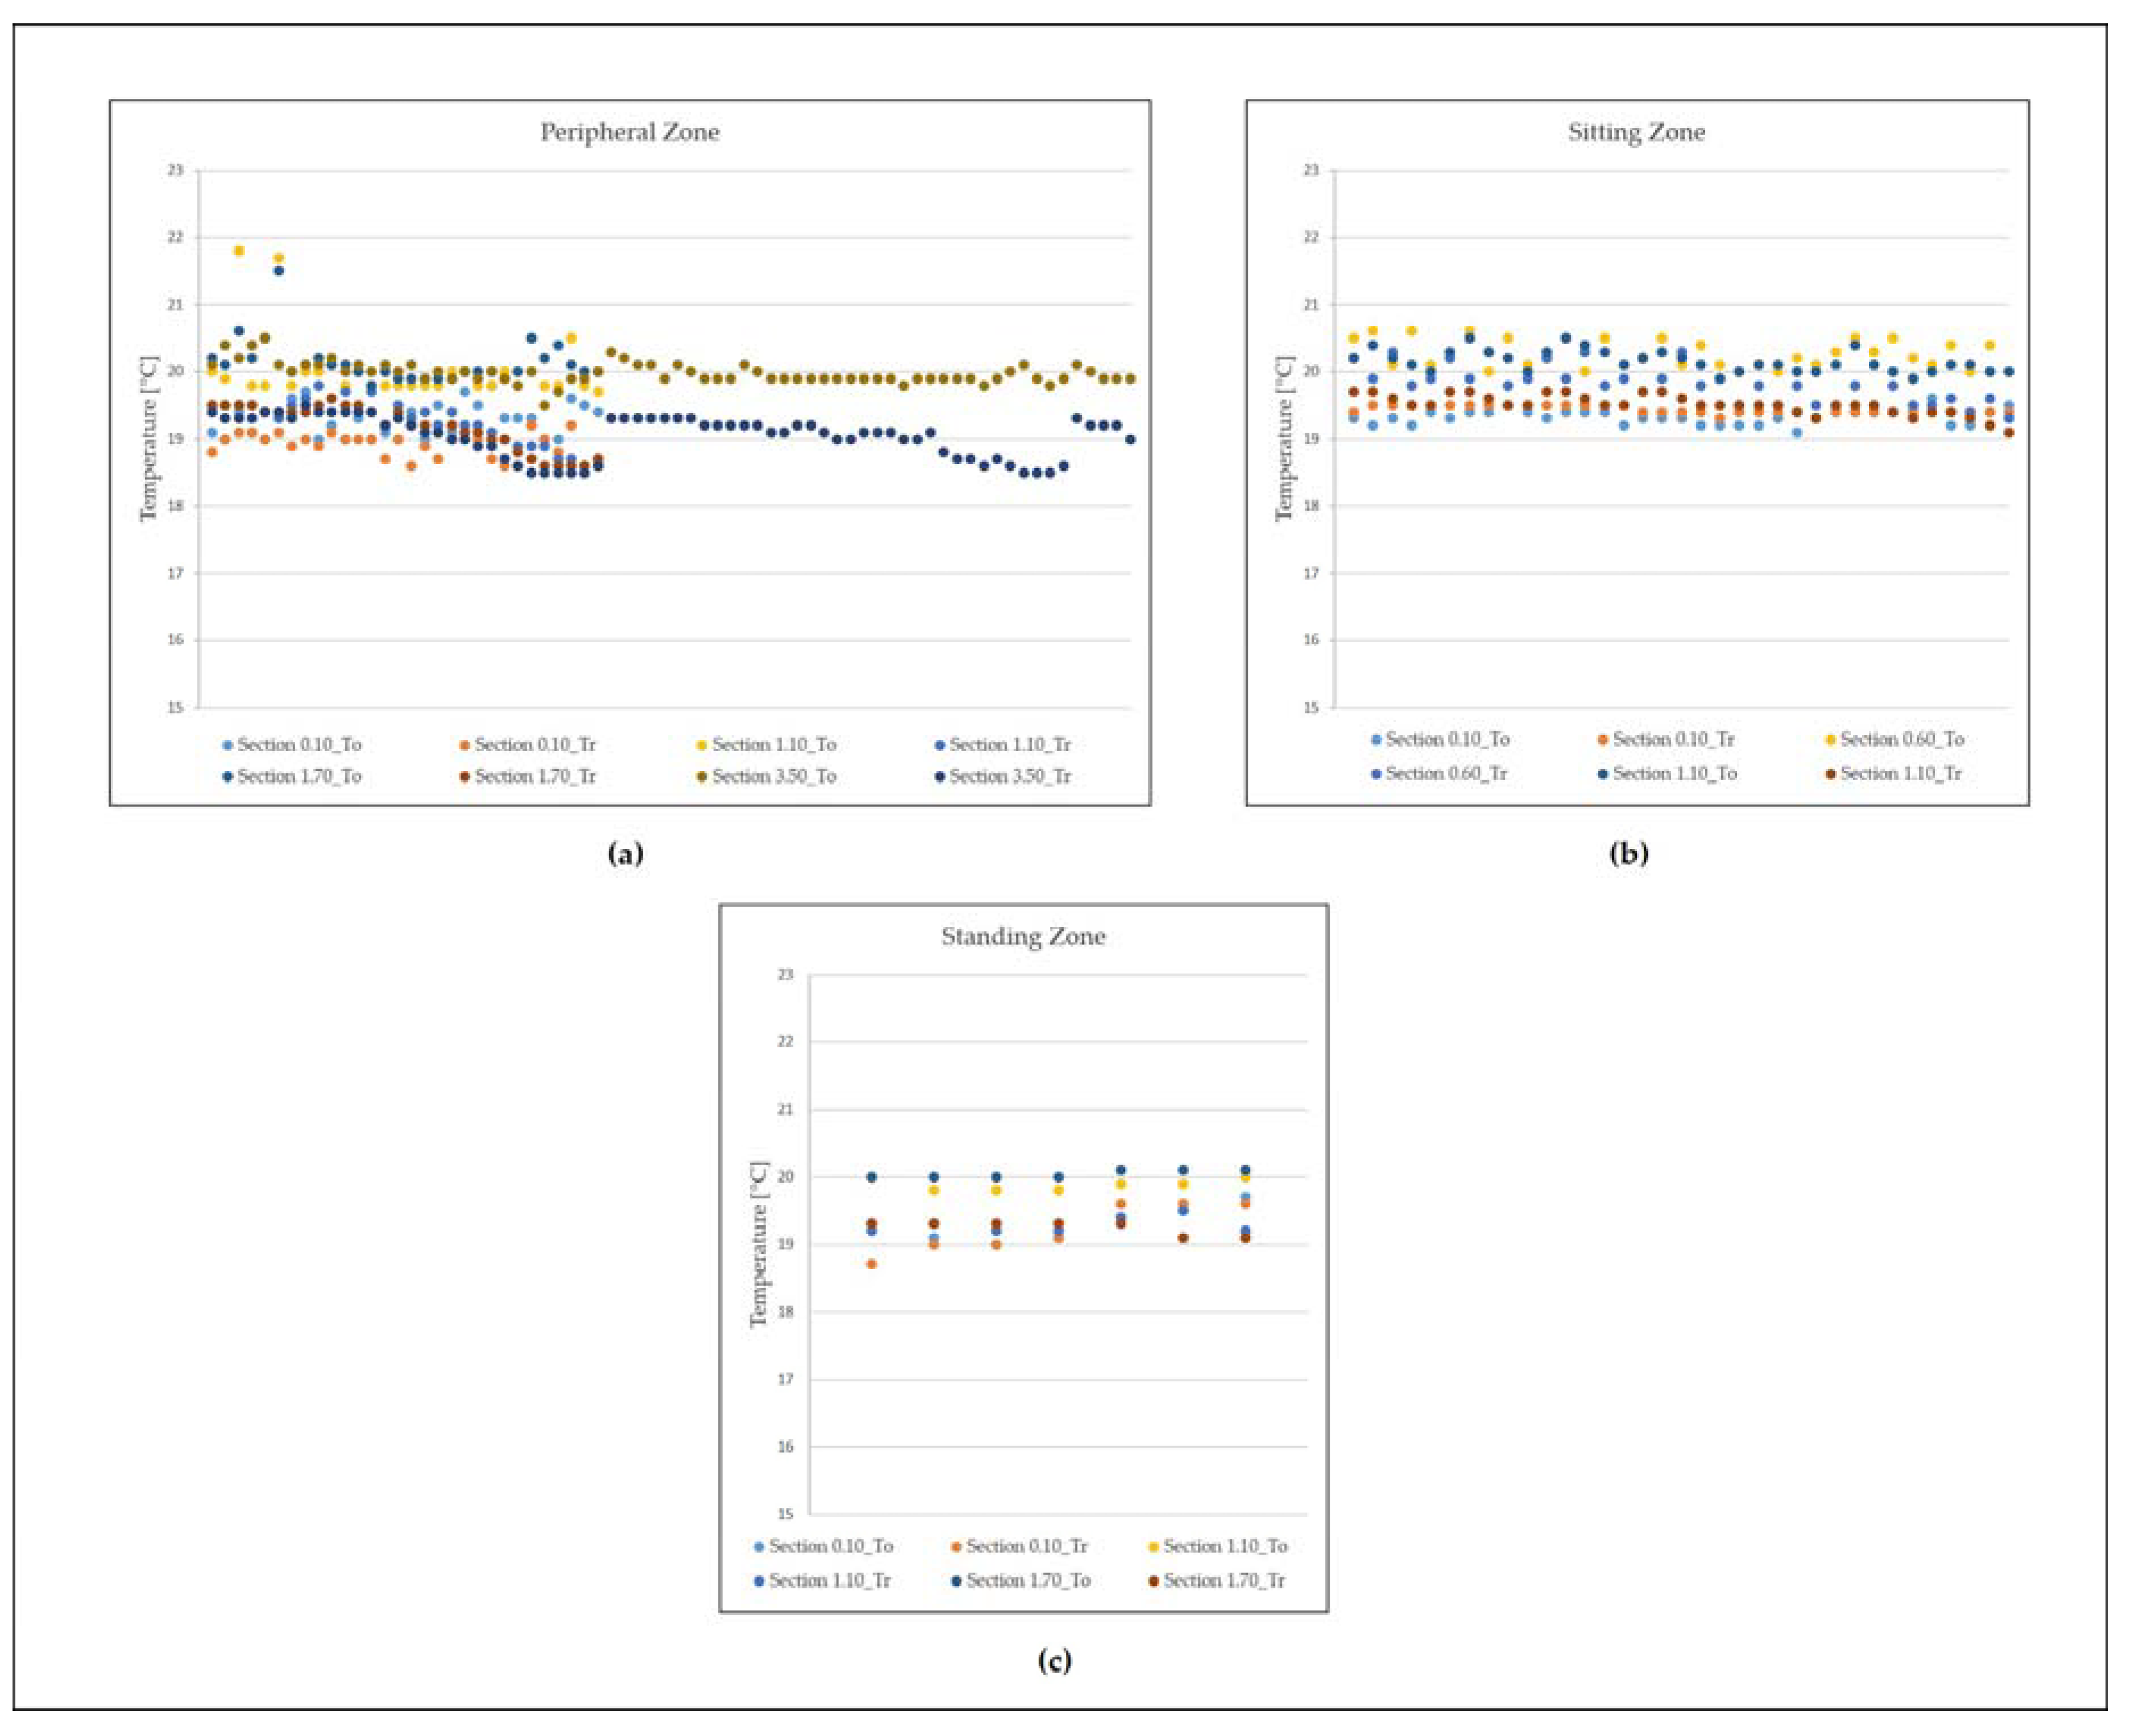
The parameters that allowed the evaluation of local discomfort, calculated on the whole volume, are air velocity, mean radiant temperature (Tr), and operative temperature (To).
3.1. Present State
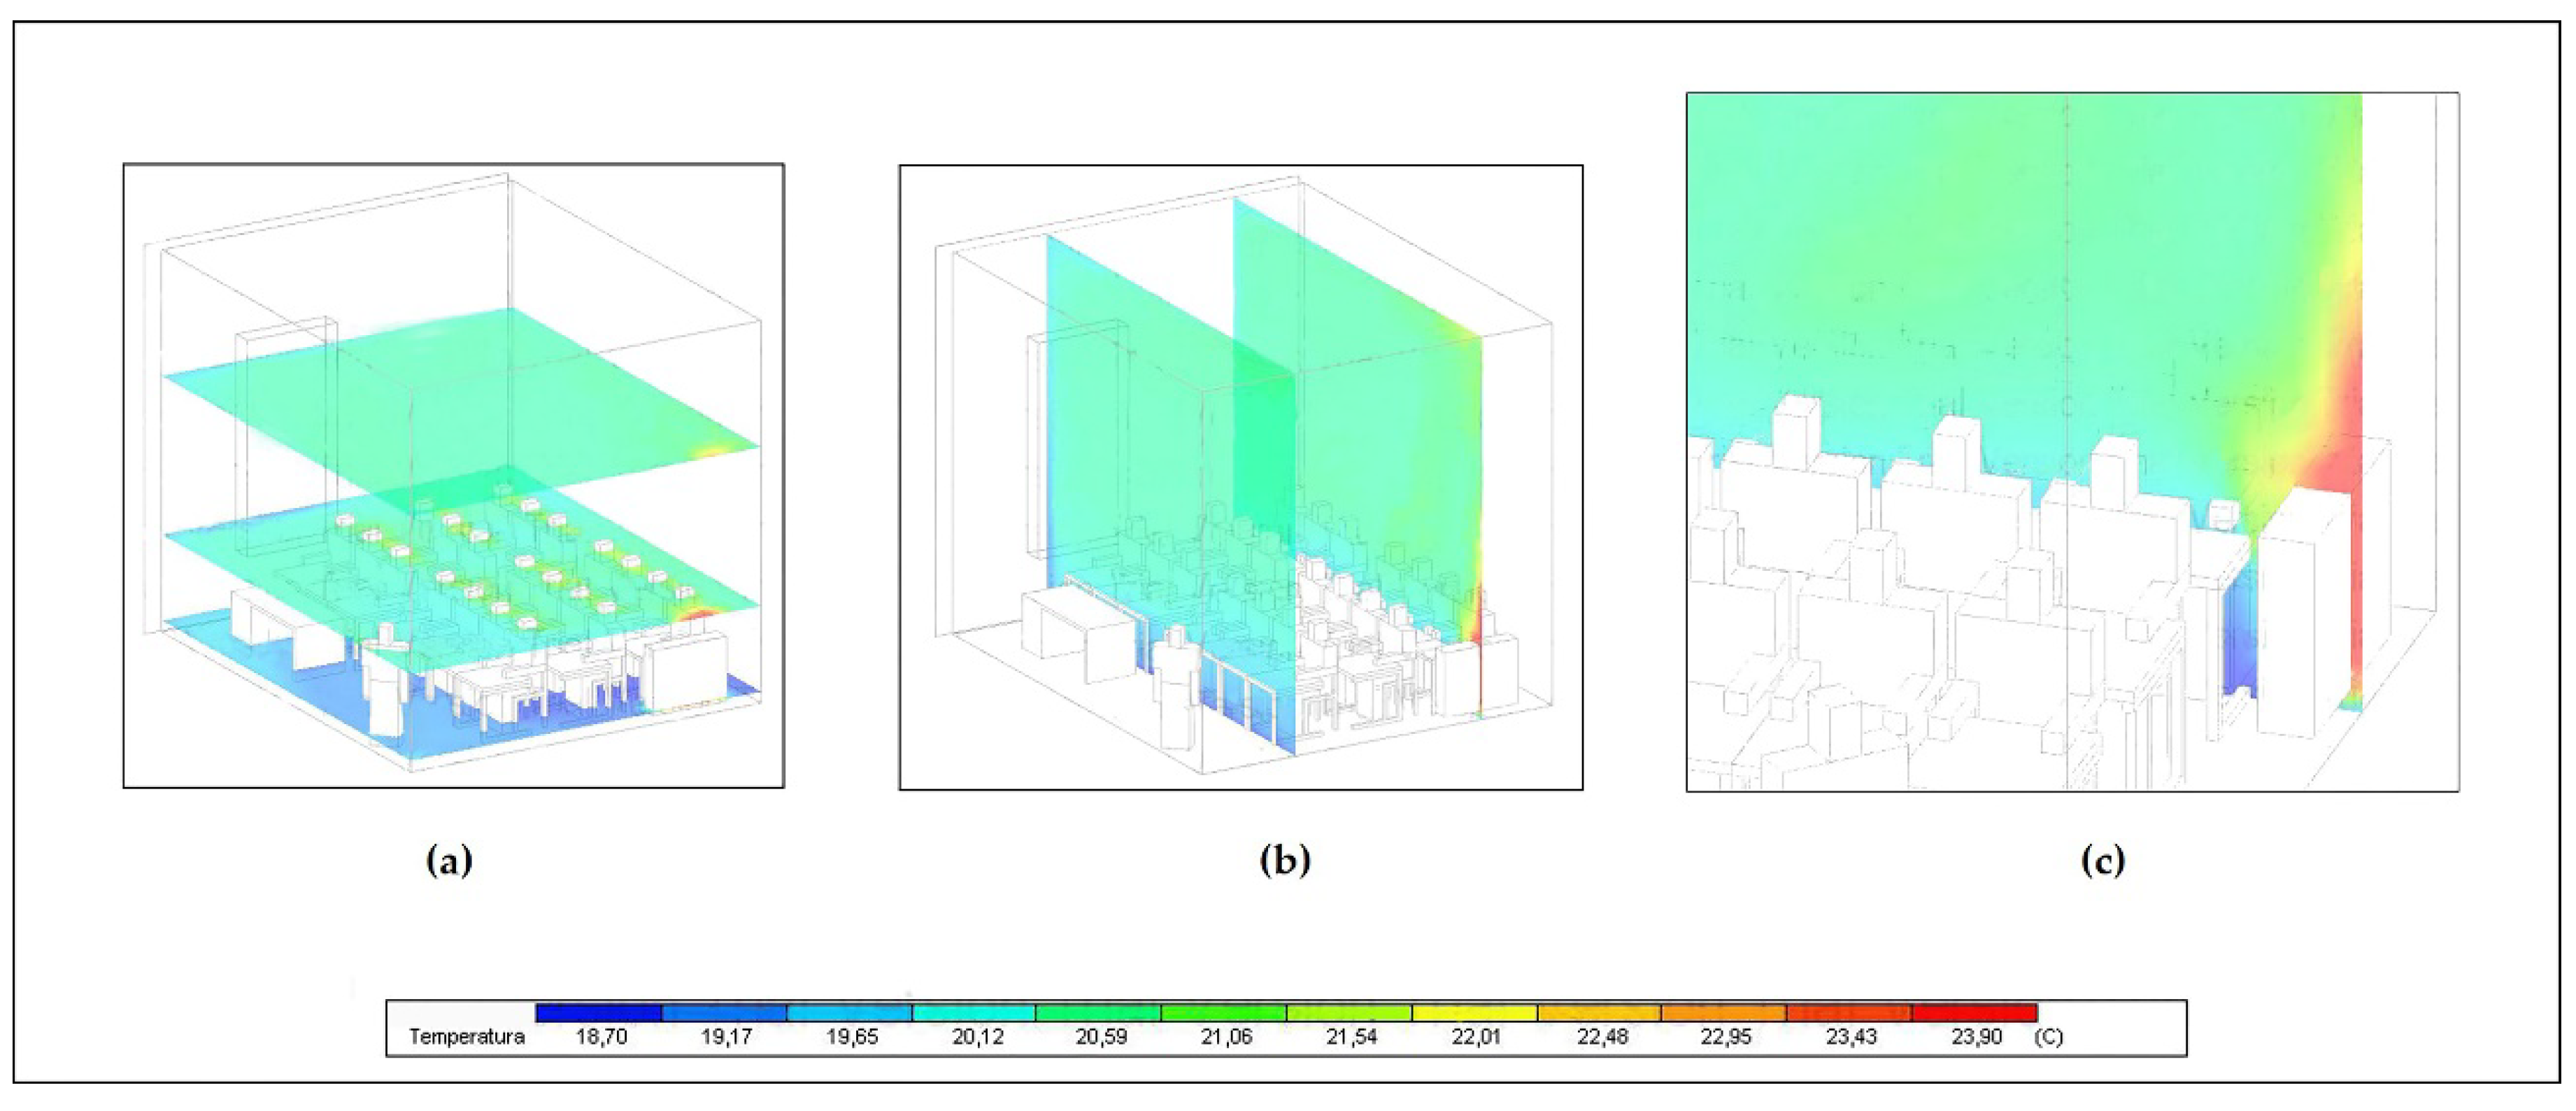
Figure 5, Figure 6 and Figure 7 and Table 2 provide the transient CFD simulation results for the present state.
The results analysis shows that the terminal units of the thermal plant combined with the thermal plume due to people sitting (occupied zone) and the mutual heat exchange (radiative) effects is sufficient to guarantee an indoor mean air temperature of 20 ± 2 °C (Figure 5c). However, there are strong radiant asymmetries due to radiator positioning (with a hot surface at 75 °C) and the large windowed surface (with the lowest surface temperature of 11.2 °C).
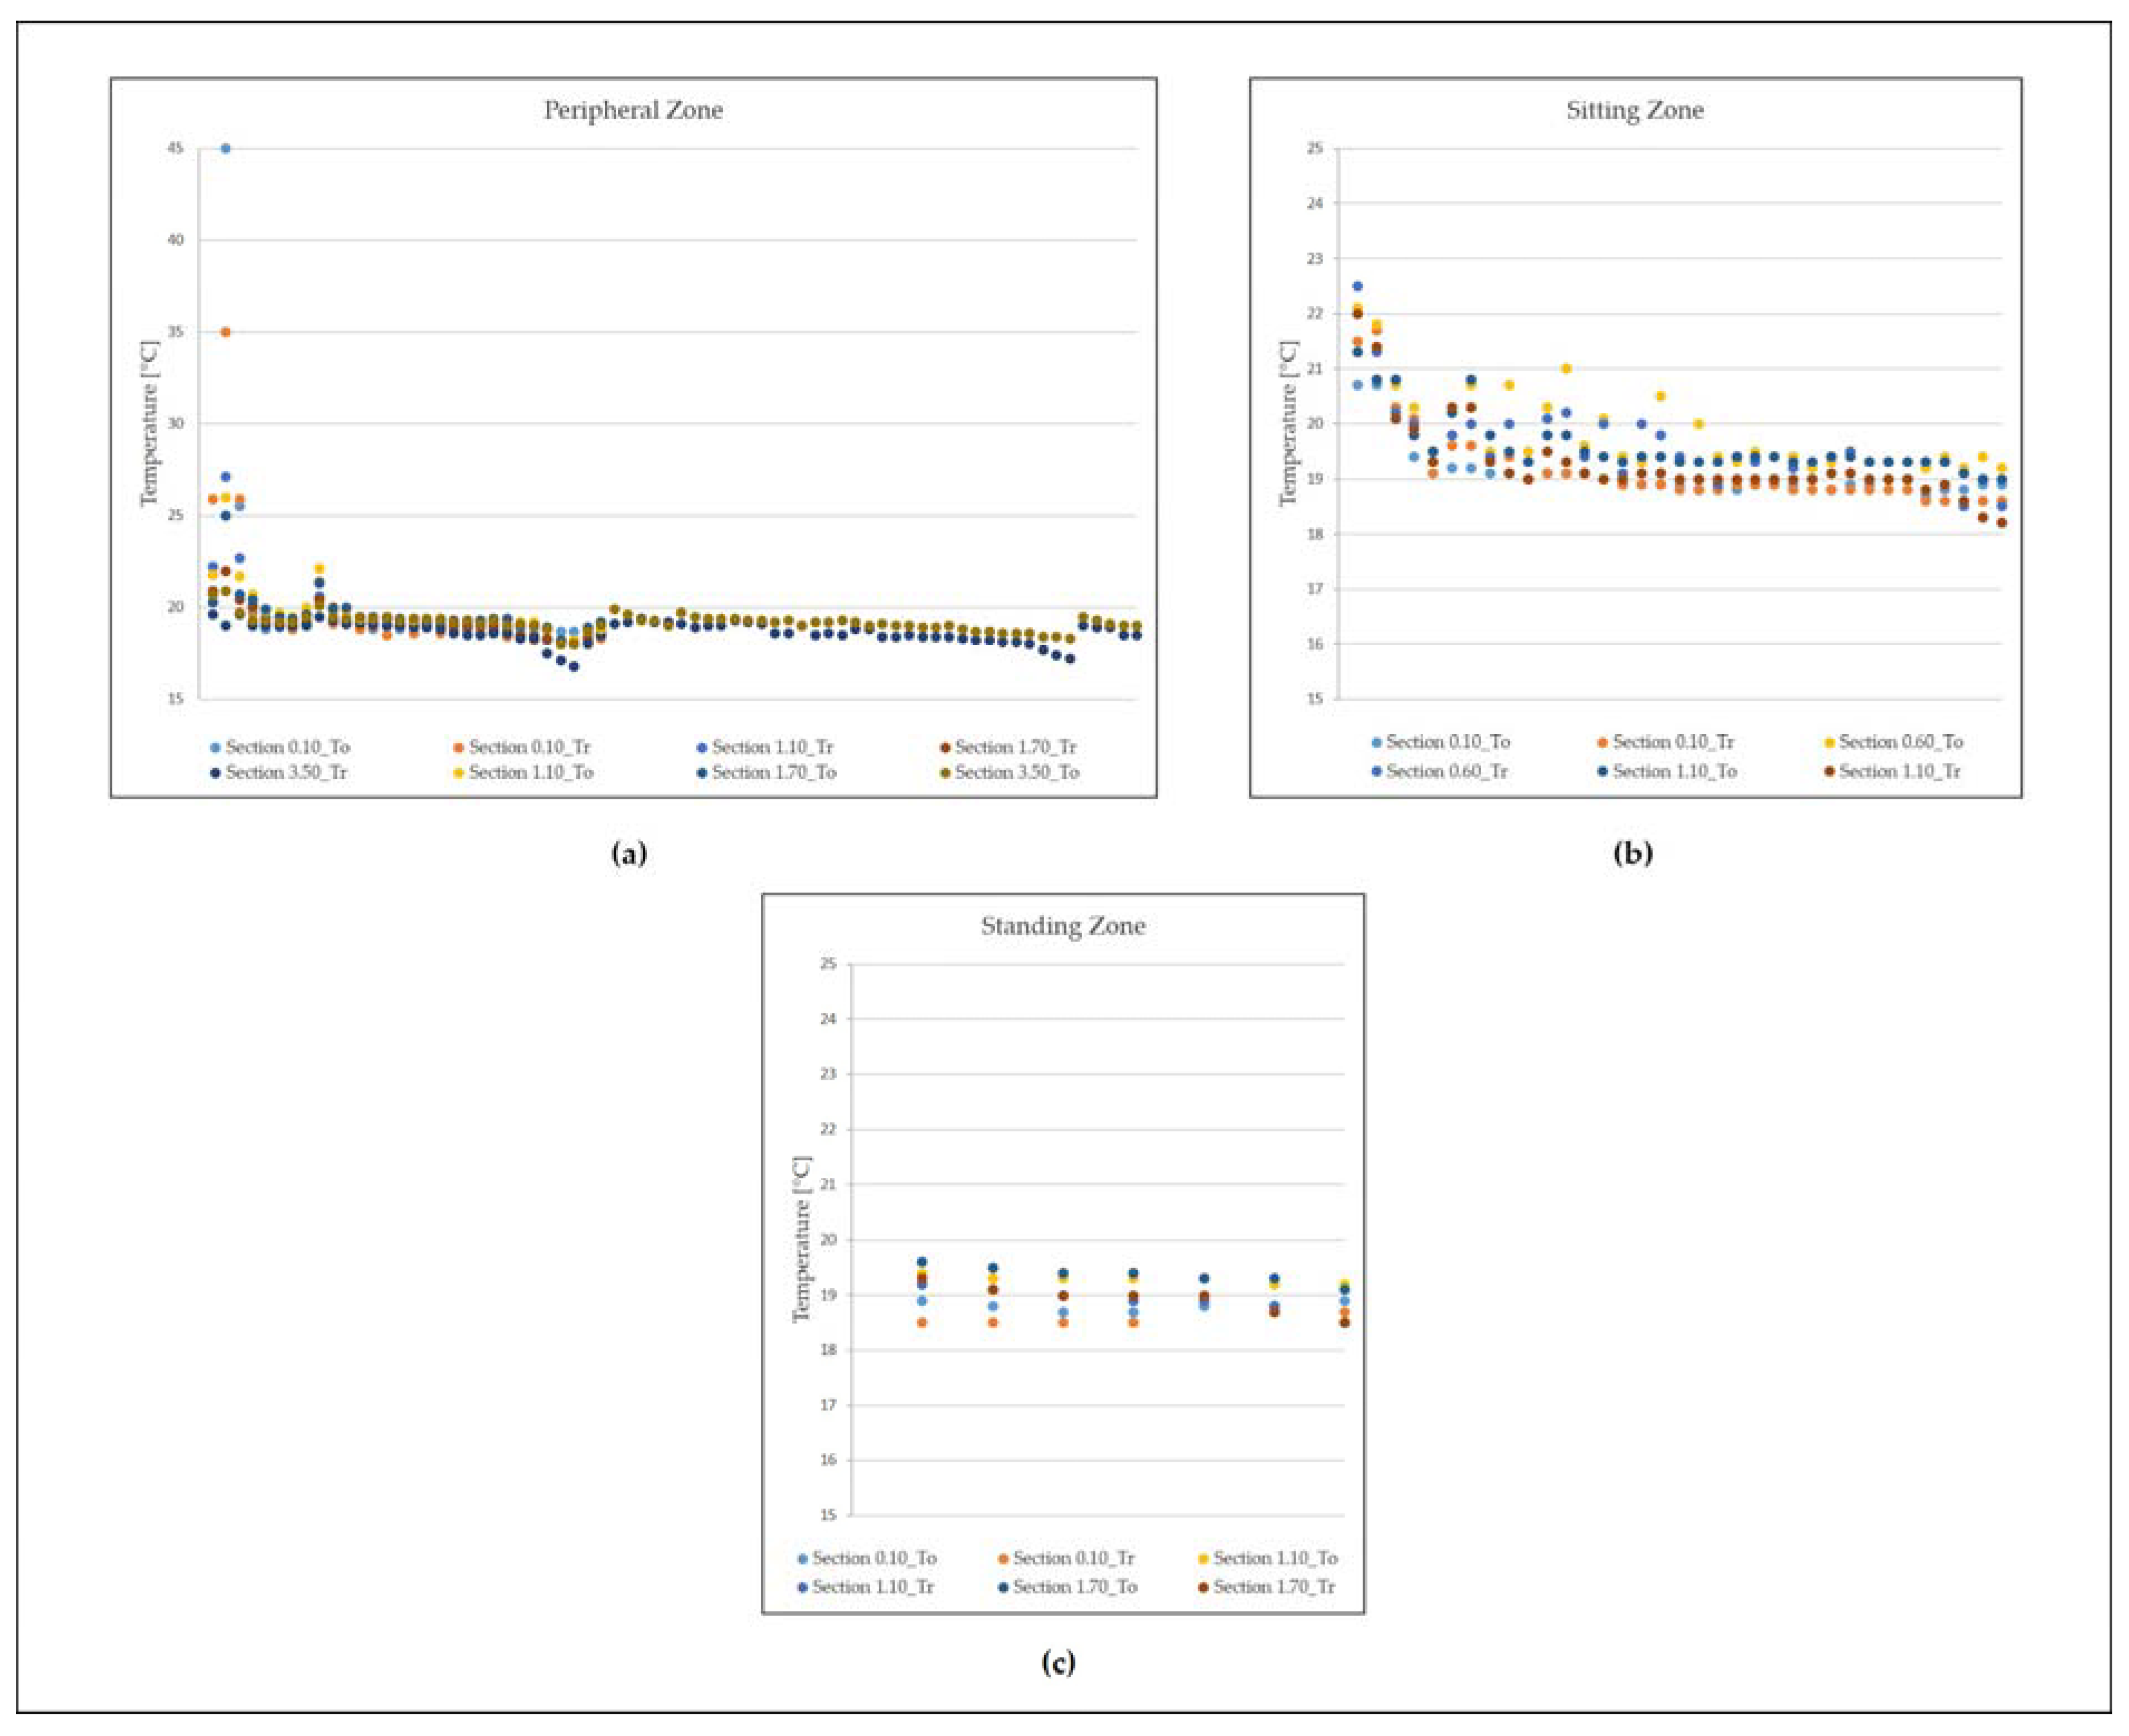
The non-uniformity and nonhomogeneity of the microclimatic parameters distribution means that the operative temperature is between 16.8 °C and 25.9 °C (Figure 6).
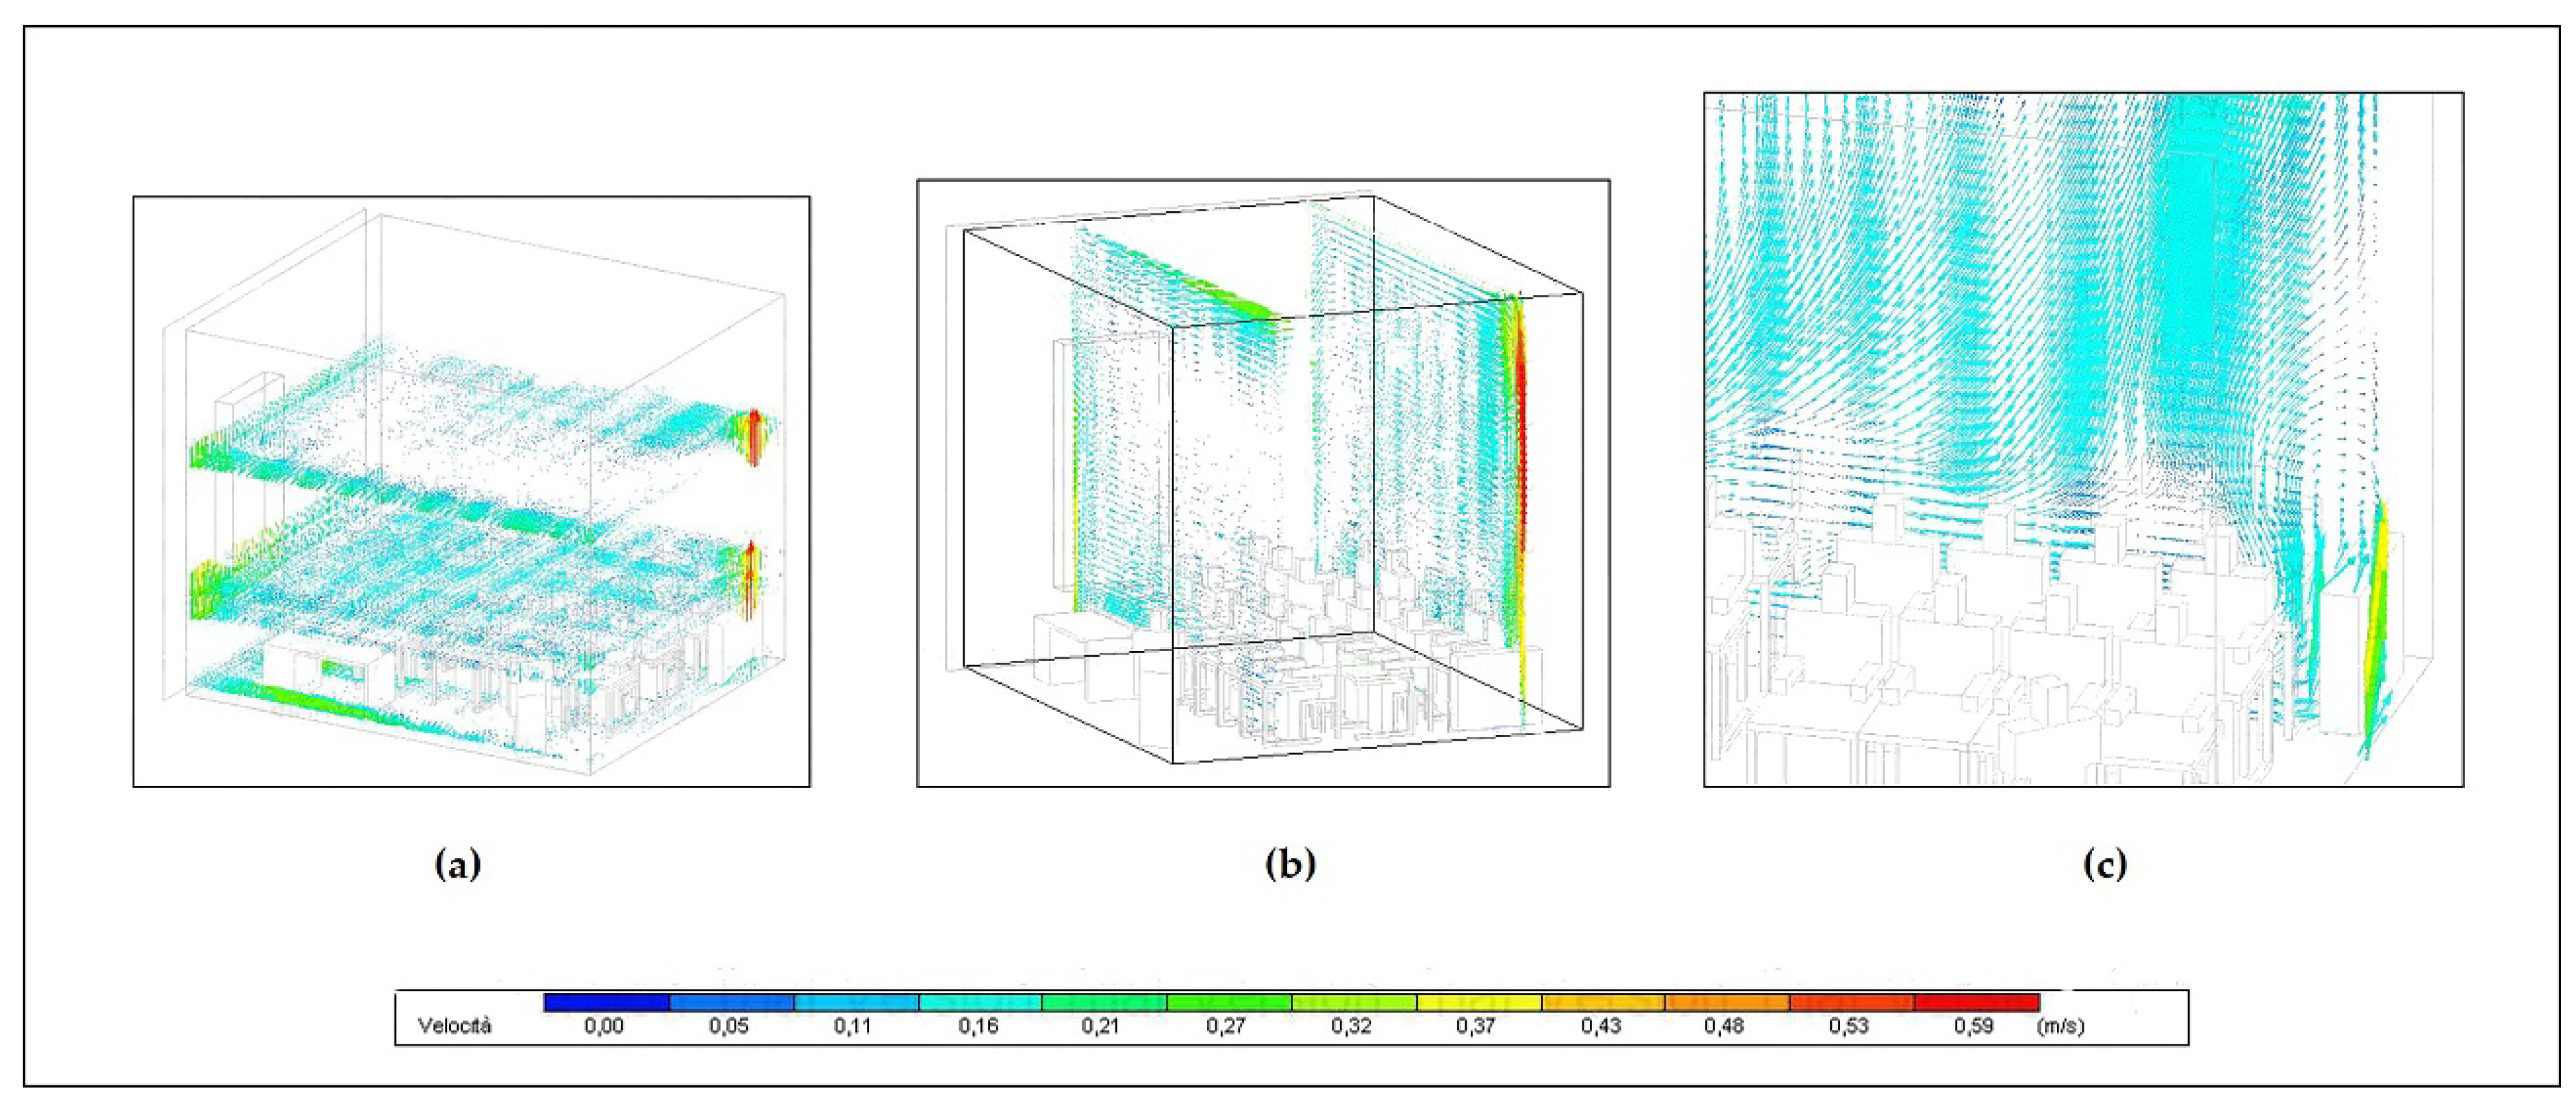
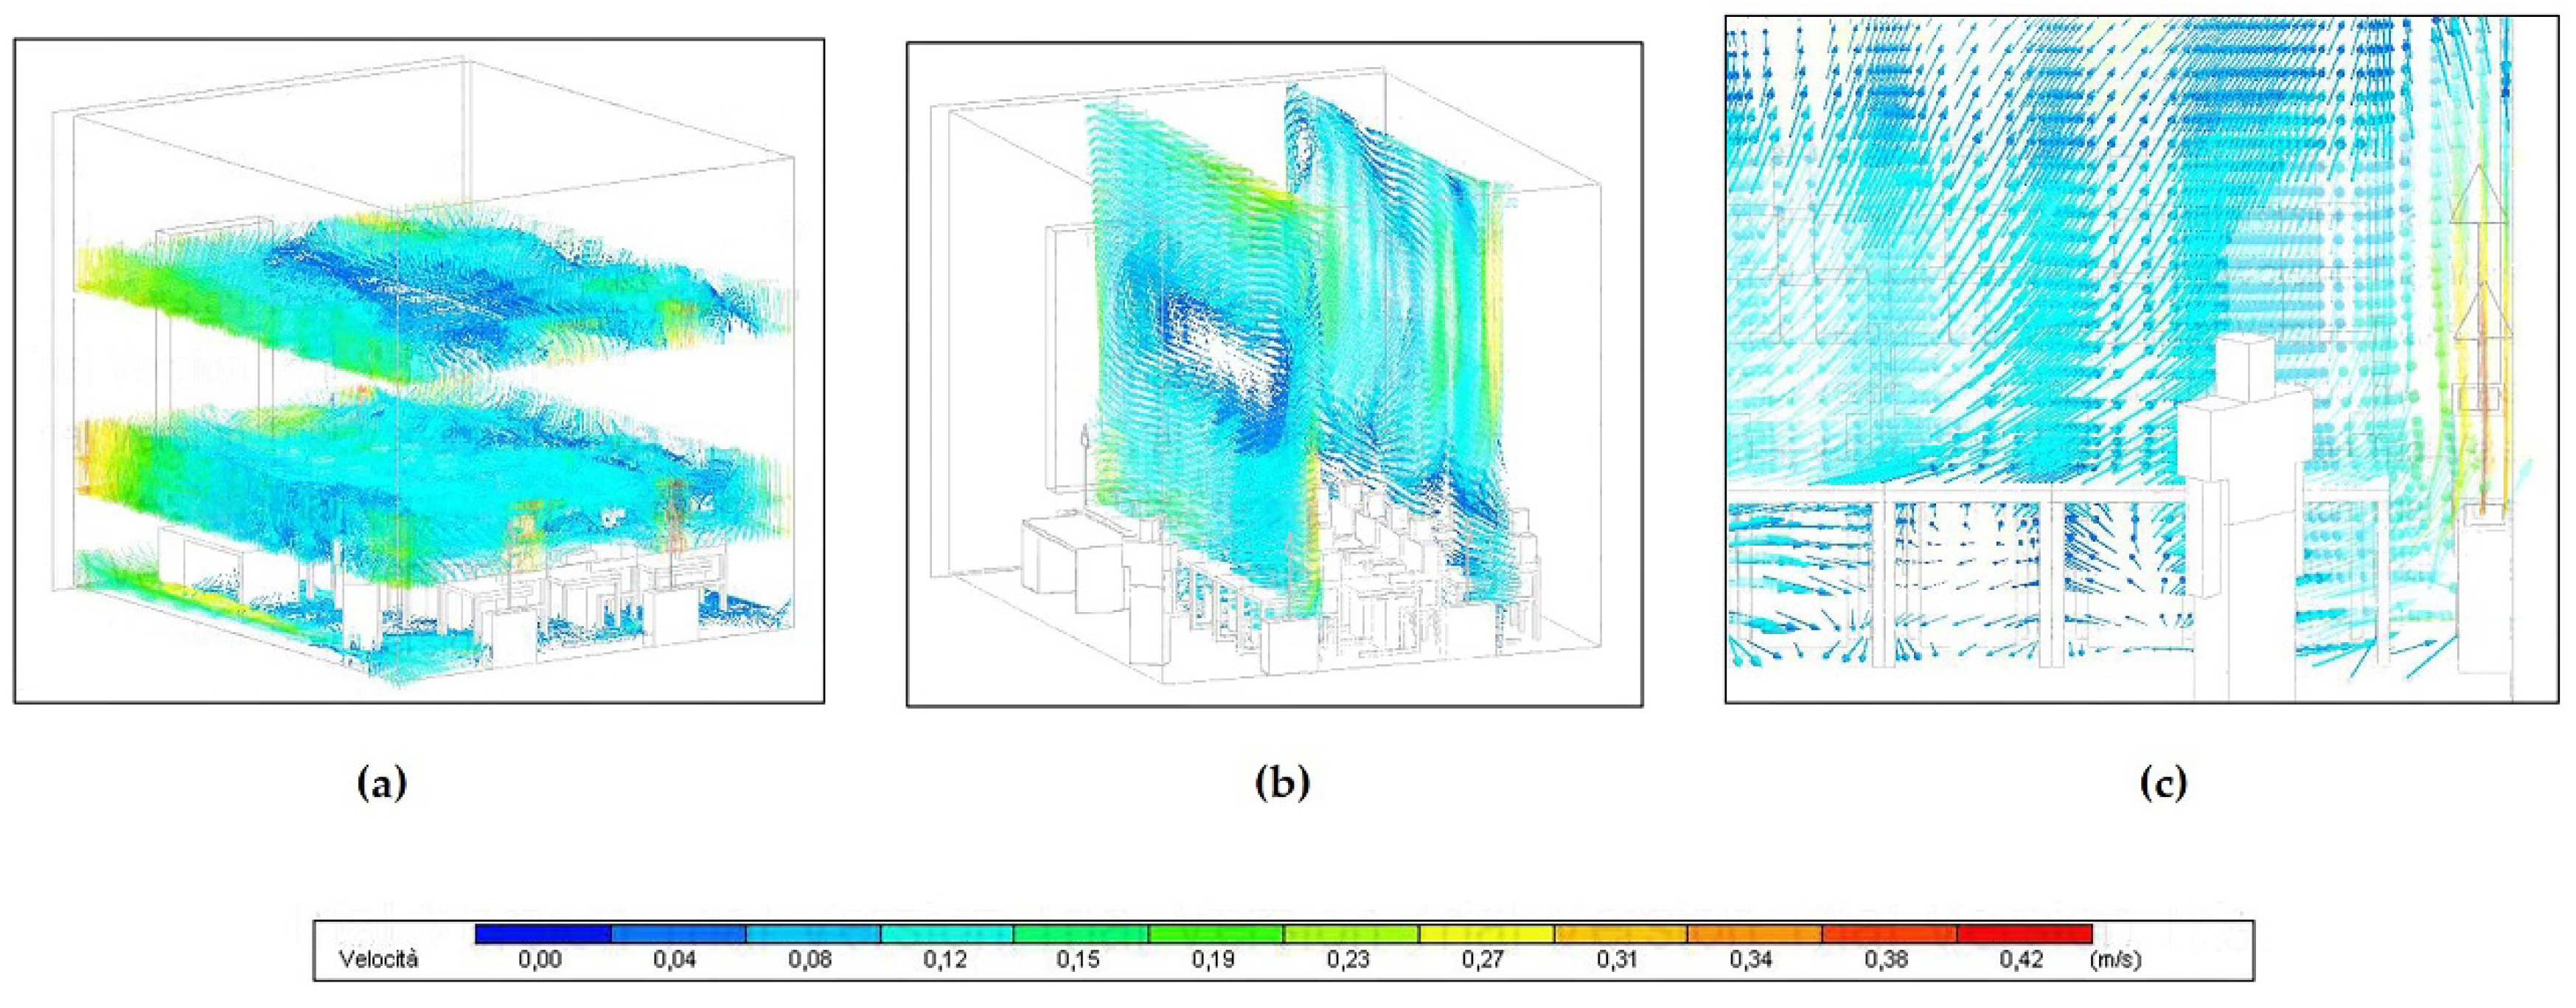
The air flow pattern analysis (Figure 7) shows low air velocity values, as reported in Table 2, due to the only natural convection condition. In this situation the turbulence index evaluated in the occupied zone is 0.80.
This value is due to the strong deviation of the air velocity value at some points with respect to the mean value calculated in the whole volume of the occupied zone.
This condition causes a short-circuit of the air that does not allow its movement to be minimal and sufficient to reach minimum acceptability conditions for the occupants: the air velocity varies between a maximum of 0.25 m s−1 at 1.10 m height, corresponding to the height of the thermal plume due to the radiator (Figure 7c) and placed in the peripheral zone, up to minimum values that become zero, located at 0.10 m height, and in a large portion of the global volume at 3.5 m height above both the standing zone and part of the sitting zone, where air stagnation areas can be identified (Figure 7).
The effective temperature (ET) was also calculated, because it combines the influence of air temperature, air humidity, and air motion providing an equal thermal sensation. The ET index calculation, following the formulation suggested in a past paper [45], allowed the identification of those zones where the recommended comfort conditions (usually ET = 18 °C; the dry bulb air temperature approaches the mean radiant temperature; air relative humidity in the range of 40 to 60% as suggested in [46,47]) are not guaranteed. The equation used is that suggested in a past paper [45], where air temperature, relative humidity, and mean velocity are chosen at the above-defined different heights of the occupied zone.
ET calculated for the whole occupied zone is 18.8 °C; ET at the height of 0.10 m, corresponding to the ankles of the occupants, is 18.5 °C; and ET at the height of 1.10 m, corresponding to the head, is 19.5 °C.
The consequent temperature range of thermal sensation on the ET scale [45,47] indicates acceptable environmental conditions for the occupants. However, by not taking into account the metabolic rate, clothing thermal resistance, and mutual radiative exchanges, it provides a rough evaluation. For this reason, the PMV was estimated, which in the occupied zone is below the limit value of ±0.50 as suggested in a previous work [41]. Therefore, we considered the “II category” [41] because the school building had undergone plant system retrofitting and building envelope refurbishment.
3.2. Design Solution
All the criticalities deduced from the results analysis and data comparisons concerning the present state led to the identification of a proposal of plant system retrofitting. A new 3D solid model was made for the CFD simulations with the same geometrical features and type of occupation but with
- Replacement of the cast iron radiator by four fan coils (air flow rate 21.6 L s−1, water flow rate 0.03 L s−1, and outlet air temperature 25 °C); two of them are positioned close to the perimetral wall and two, in a specular position with respect to the previous ones, close to the wall bordering the corridor with access to the classroom. The air delivery grilles are facing upwards perpendicular to the floor, while the air recovery grilles are positioned on the side of the occupied zone.
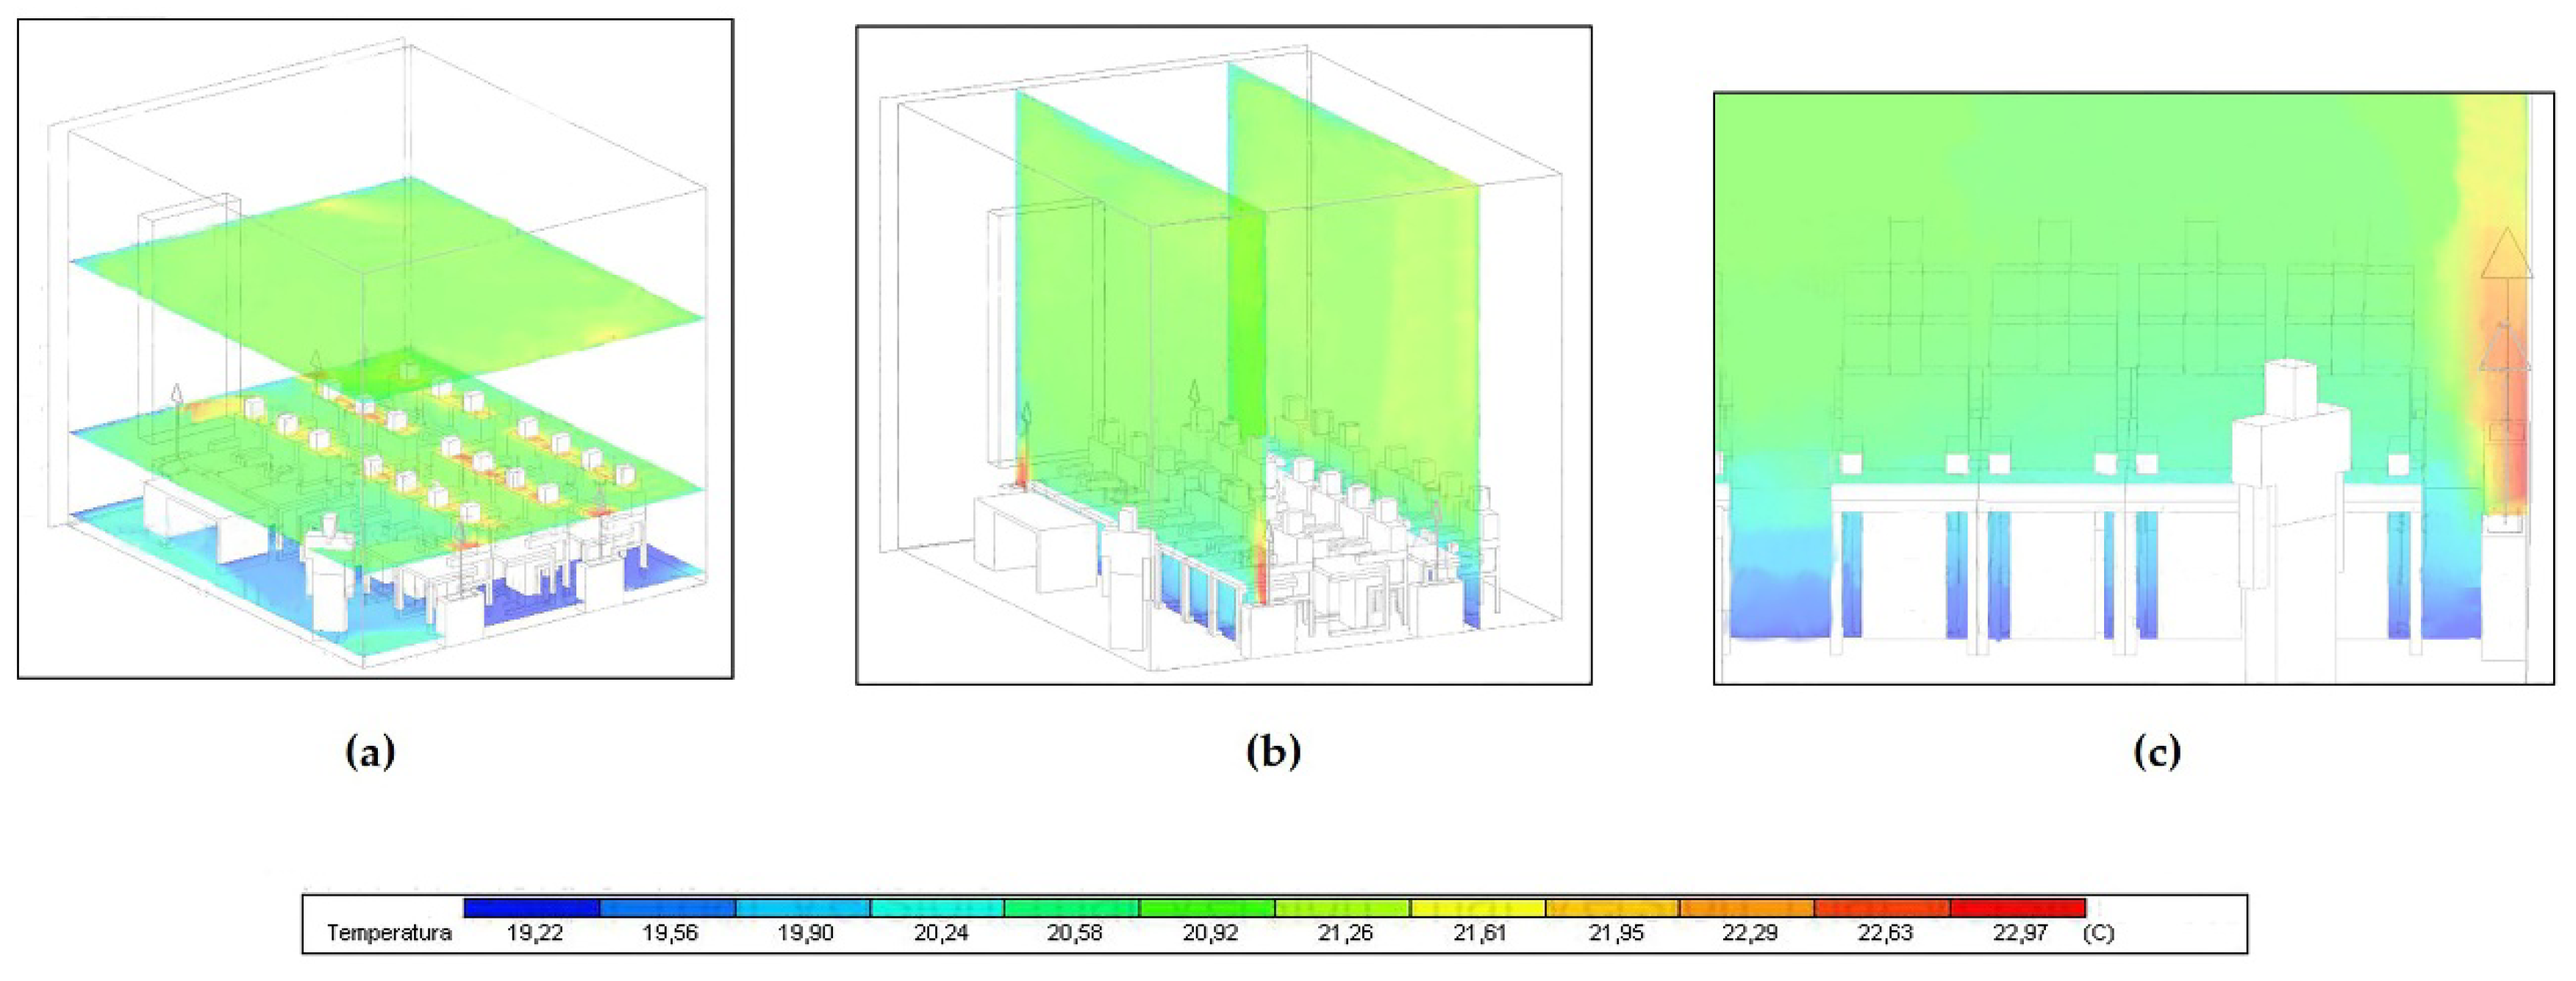
- Replacement of the single window glass with double glass (new thermal transmittance 1.27 Wm−2K−1 compared with the old one; Table 1) allows for a mean internal surface temperature of 17.5 °C. This temperature value was deduced from the results processing obtained by dynamic simulation presented and discussed previously [35]. Figure 8, Figure 9 and Figure 10 and Table 3 provide all results obtained by transient simulations of the design solution.
From the results assessment (see Figure 8, Figure 9 and Figure 10 and Table 3), referring to the global volume of the classroom, it is clear that the mean radiant and operative temperature distribution is uniform and homogeneous, falling within the ranges of 18.6 to 20.5 °C and 19 to 20.1 °C, respectively (Figure 9). The air flow pattern (Figure 10), mainly due to forced ventilation, proves the presence of an air flow scheme characterized by large convective vortexes which guarantee air mixing and the absence of air velocity values above the limit imposed by the standard of 0.20 m s−1 in the occupied zone [40,44].
The range of the air velocity values is between a maximum of 0.28 m s−1, in correspondence of the fan coil air inlet (positioned in the peripheral zone) at 1.10 m height, and a minimum of 0.01 m s−1 corresponding to the sitting zone at 0.10 m height (occupant ankles). In particular, if in the peripheral zone the air velocity exceeds the imposed limit, this can be neglected because it is not related to an area occupied by people.
The air flow displacement was studied by evaluating the effects due to terminal unit location, low fan speed, correct launch angle, and air throw that can provide the best air flow pattern guaranteeing the total absence of air stagnation zones and short-circuit areas throughout the room volume. The turbulence index, evaluated for the occupied zone, is 0.52. This means that homogeneous air velocity and good air mixing and distribution are present.
The ET, calculated for the occupied zone, is 19.3 °C. At 0.10 m height, corresponding to the ankles of the occupants, the ET value is 19.1 °C. At 1.10 m height, corresponding to the head, the ET value is 19.7 °C. Similarly to the present state, the PMV index was estimated in the occupied zone and its value is now −0.20. This means that thermal comfort conditions are guaranteed. According to a previous paper [40], DR evaluated at 1.10 m height from the floor (neck level) is 3.0%. The DR calculated in the whole occupied zone is equal to 1.1%. This index must be less than 15% for well-being conditions [40,44].
4. Conclusions
The practical application of the methodological approach presented in this research to a real specific case study, such as the high school located in a cultural heritage historical building, shows that it is always possible to identify operations with minimally invasive solutions that are easy to implement and maintain and are removable and reversible. The proposed method can be a useful tool to identify the optimal combination of the building’s thermophysics (i.e., building thermal behaviour and energy performance over time as a function of its inertia and envelope thermal capacity) and plant solutions (noninvasive and strongly effective). Therefore, it is also useful to obtain a building-plant system design of energy and environmental quality and sustainability, in compliance with the historical and artistic value of the building and the requirements related to protection and preventive conservation.
The plant design proposed significantly and effectively improves indoor thermo-hygrometric conditions necessary for this kind of environment. Here, indoor air quality and ventilation requirements are crucial for thermal comfort, and, as some important research has demonstrated, for the health, well-being, and optimal work conditions of the occupants [24,28,32,36,37].
This aspect was proved by the specific value and distribution of the obtained indoor climatic parameters that allow the achievement of comfortable conditions. In particular, the temperature range is uniform and the local values of the different subzones, as for the total volume of the environment, are homogeneous and close to the standard set point of 20 °C.
The comparison between the map on the air velocity distribution, obtained with CFD transient simulations for the present state and for the design proposal, highlights the highly homogeneous air velocity magnitude values for the total volume and the corresponding values for the different zones (i.e., peripheral and occupied zones). As a consequence, the very low turbulence index and air temperature and velocity values, never exceeding the limits imposed by current standards [40,41,44], allowed for a very low DR. These results were achieved with a design of the plant terminal units (with low air inlet velocity) which took into account the proximity of people in each zone and the efficacy of the air flow scheme, which must be guaranteed.
It has also been demonstrated that the assessment of thermal comfort conditions cannot only be carried out through simplified indices evaluation (e.g., ET) but, especially, by complex indexes that take into account all the environmental variables correlated to those of the subject. As a matter of fact, the ET value obtained for the present state would seem to show conditions of well-being, but referring to complex index values (e.g., PMV) the comfort conditions (local and global) are never guaranteed. The PMV values for the design proposal indicate the local and global well-being conditions were reached. The heating system retrofitting proposal, as shown previously [35], was combined with a further refurbishment of the building envelope, which consisted of the replacement of the windows [35]. In a past paper [35] it was demonstrated that plant terminal unit replacement and introduction of the regulation system are particularly sustainable, as they require simple adjustments to adapt the system ducts. Furthermore, it is possible to obtain appreciable energy savings because the plant can work at a lower water temperature than that required by the radiator terminals.
With the same thermal capacity of the building envelope, by converting the heating plant from a high to a low inertia system, supplied by a regulation and control system, it was possible to achieve well-being conditions in less time in strong compliance with occupation hours and user presence.
The outcomes of this study can be a useful basis for a better understanding of possible operations for thermal comfort improvement and the guarantee of health and safety for users. The results obtained in this study suggest the importance of air ventilation, correct air flow schemes, thermophysical and energy performance of building components, and efficacy of the pant system (i.e., the typology and location of terminal units and regulation system). In particular, results highlighted that the thermal comfort assessment, based on dynamic simulation and CFD techniques, can provide the guidelines for an early design stage oriented to plant-building system sustainability, as well as an optimal combination between well-being and health and protection and conservation preventive measures.
Further development and application for analysis on the effectiveness of the proposed method to other similar case studies, can contribute to operation programming on the entire historical school building heritage for energy sustainability, environmental quality, and health.
Author Contributions
The authors contributed equally to this work. C.B. and A.C. thought and programmed this research, performed the simulations, assessed and obtained results, and wrote the paper.
Funding
This research received no external funding.
Acknowledgments
The authors would like to thank the following for providing data and information useful for the realization of this study. Luca Fibbi and the technical staff of Consorzio LaMMA, Laboratory for Meteorology and Environmental Modelling and the director and staff of the Environmental Department of Metropolitan City of Florence.
Conflicts of Interest
The authors declare no conflicts of interest.
References
- EU Directive 2010/31/EU of the European Parliament and of the Council of 19 May 2010 on the Energy Performance of Buildings. Available online: https://eur-lex.europa.eu/legal-content/EN/TXT/?uri=CELEX:32010L0031 (accessed on 23 July 2018).
- EU Directive 2002/91/EC of the European Parliament and of the Council of 16 December 2002 on the Energy Performance of Buildings. Available online: https://eur-lex.europa.eu/legal-content/IT/TXT/?uri=celex%3A32002L0091 (accessed on 23 July 2018).
- EU Directive 2012/27/EU of the European Parliament and of the Council of 25 October 2012 on Energy Efficiency, Amending Directives 2009/125/EC and 2010/30/EU and Repealing Directives 2004/8/EC and 2006/32/EC. Available online: https://eur-lex.europa.eu/legal-content/EN/TXT/?uri=celex%3A32012L0027 (accessed on 23 July 2018).
- Dalla Mora, T.; Righi, A.; Peron, F.; Romagnoni, P. Cost-optimal measures for renovation of existing school buildings towards nZEB. Energy Procedia 2017, 140, 288–302. [Google Scholar] [CrossRef]
- Lou, S.; Tsang, E.K.W.; Li, D.H.W.; Lee, E.W.M.; Lam, J.C. Towards zero energy school building designs in Hong Kong. Energy Procedia 2017, 105, 182–187. [Google Scholar] [CrossRef]
- World Health Organization. School Environment: Policies and Current Status; WHO Regional Office for Europe: Copenhagen, Demark, 2015. [Google Scholar]
- Italian Ministry for the Environment, Land and Sea (IMELS), School Environment and Respiratory Health of Children. Available online: http://search.rec.org (accessed on 23 July 2018).
- SINPHONIE Project, the Schools Indoor Pollution and Health: Observatory Network in Europe. Available online: http://www.sinphonie.eu/ (accessed on 23 July 2018).
- Italian Ministry of Economic Development. Ministerial Decree 26/06/2015. Applicazione Delle Metodologie di Calcolo Delle Prestazioni Energetiche E Definizione Delle Prescrizioni e dei Requisiti Minimi Degli Edifici. Off.JItalianRepublic. 15 July 2015. Available online: www.sviluppoeconomico.gov.it/index.php/it/normativa/decreti-interministeriali/2032966-decreto-interministeriale-26-giugno-2015-applicazione-delle-metodologie-di-calcolo-delle-prestazioni-energetiche-e-definizione-delle-prescrizioni-e-dei-requisiti-minimi-degli-edifici (accessed on 23 July 2018). (In Italian)
- Zhang, A.; Bokel, R.; Van den Dobbelsteen, A.; Sun, Y.; Huang, Q.; Zhang, Q. The Effect of Geometry Parameters on Energy and Thermal Performance of School Buildings in Cold Climates of China. Sustainability 2017, 9, 708. [Google Scholar] [CrossRef]
- Kang, J.E.; Ahn, K.U.; Park, C.S.; Schuetze, T. Assessment of Passive vs. Active Strategies for a School Building Design. Sustainability 2015, 7, 15136–15151. [Google Scholar] [CrossRef] [Green Version]
- Bernardo, H.; Hantunes, C.H.; Gasparb, A.; Pereira, L.D.; Da Silva, G.M. An approach for energy performance and indoor climate assessment in a Portuguese school building. Sustain. Cities Soc. 2017, 30, 184–194. [Google Scholar] [CrossRef]
- Fulpagare, Y.S.; Agrawal, N. Experimental investigation on room air flow pattern and thermal comfort quantification. Int. J. Eng. Sci. Emerg. Technol. 2018, 6, 120–132. [Google Scholar]
- Marino, C.; Minichiello, F.; Ronga, P. Thermal-Hygrometric and Energy Performance Analysis of HVAC Systems for Educational Buildings in Southern Europe. Int. J. Heat Technol. 2016, 34, S573–S580. [Google Scholar] [CrossRef]
- De Santoli, L.; Mancini, F.; Clemente, C.; Lucci, S. Energy and technological refurbishment of the school of Architecture Valle Giulia, Rome. Energy Procedia 2014, 133, 382–391. [Google Scholar] [CrossRef]
- Erhorn-Kluttig, H.; Erhorn, H. School of the future, towards zero emission with high performance indoor environment. Energy Procedia 2014, 48, 1468–1473. [Google Scholar] [CrossRef]
- Wang, Z.; Li, A.; Ren, J.; He, Y. Thermal adaption and thermal environment in university classrooms and offices in Harbin. Energy Build. 2014, 77, 192–196. [Google Scholar] [CrossRef]
- Wang, Y.; Zhao, F.Y.; Kuckelkorn, J.; Liu, D.; Liu, J.; Zhang, J.L. Classroom energy efficiency and air environment with displacement natural ventilation in a passive public school building. Energy Build. 2014, 70, 258–270. [Google Scholar] [CrossRef]
- Wang, Y.; Zhao, F.Y.; Kuckelkorn, J.; Liu, X.H.; Wang, H.Q. Indoor air environment and night cooling energy efficiency of a southern German passive public school building operated by the heat recovery air conditioning unit. Energy Build. 2014, 81, 9–17. [Google Scholar] [CrossRef]
- Saraiva, T.S.; De Almeida, M.; Bragança, L.; Barbosa, M.T. Environmental Comfort Indicators for School Buildings in Sustainability Assessment Tools. Sustainability 2018, 10, 849. [Google Scholar] [CrossRef]
- Kwon, C.W.; Lee, K.J. Outdoor Thermal Comfort in a Transitional Space of Canopy in Schools in the UK. Sustainability 2017, 9, 1753. [Google Scholar] [CrossRef]
- Peng, Z.; Deng, W.; Tenorio, R. Investigation of Indoor Air Quality and the Identification of Influential Factors at Primary Schools in the North of China. Sustainability 2017, 9, 1180. [Google Scholar] [CrossRef]
- Corrado, V.; Ballarini, I.; Paduos, S.; Tulipano, L. A new procedure of Energy audit and cost analysis for the transformation of a school into a nearly zero-energy building. Energy Procedia 2017, 140, 325–338. [Google Scholar] [CrossRef]
- De Angelis, E.; Tagliabue, L.C.; Cecconi, F.R.; Mainini, A.G. A simple method for the comparison of bioclimatic design strategies based on dynamic indoor thermal comfort assessment for school buildings. Procedia Eng. 2017, 180, 870–880. [Google Scholar] [CrossRef]
- Loreti, L.; Valdiserri, P.; Garai, M. Dynamic simulation on energy performance of a school. Energy Procedia 2016, 101, 1026–1033. [Google Scholar] [CrossRef]
- Salvalai, G.; Maligheti, L.E.; Luchini, L.; Girola, S. Analysis of different energy conservation strategies on existing school buildings in a Pre-Alpine Region. Energy Build. 2017, 145, 92–106. [Google Scholar] [CrossRef]
- Zanni, D.; Righi, A.; Dalla Mora, T.; Peron, F.; Romagnoni, P. The Energy improvement of school buildings: Analysis and proposals for action. Energy Procedia 2015, 82, 526–532. [Google Scholar] [CrossRef]
- Zhang, A.; Bokel, R.; Van den Dobbelsteen, A.; Sun, Y.; Huang, Q.; Zhang, Q. An integrated school and schoolyard design method for summer thermal comfort and energy efficiency in Northern China. Build. Environ. 2017, 124, 369–387. [Google Scholar] [CrossRef]
- Wang, J.C. A study on the energy performance of school buildings in Taiwan. Energy Build. 2016, 133, 810–822. [Google Scholar] [CrossRef]
- Erhorn, H.; Erhorn-Kluttig, H.; Reiß, J. Plus energy schools in Germany—Pilot projects and key technologies. Energy Procedia 2015, 78, 3336–3341. [Google Scholar] [CrossRef]
- Semprini, G.; Marinosci, C.; Ferrante, A.; Predari, G.; Mochi, G.; Garai, M.; Gulli, R. Energy management in public institutional and educational buildings: The case of the school of engineering and architecture in Bologna. Energy Build. 2016, 126, 365–374. [Google Scholar] [CrossRef]
- De Abreu-Harbich, L.V.; Chaves, V.L.A.; Brandstetter, M.C.G.O. Evaluation of strategies that improve the thermal comfort and energy saving of a classroom of an institutional building in a tropical climate. Build. Environ. 2018, 135, 257–268. [Google Scholar] [CrossRef]
- Sauchelli, M.; Masera, G.; D’Antona, G.; Manzolini, G.; Facchinetti, I. Nearly Zero Energy Retrofit in Italy. Energy Procedia 2014, 48, 1326–1335. [Google Scholar] [CrossRef] [Green Version]
- De Santoli, L.; Fraticelli, F.; Fornari, F.; Calice, C. Energy performance assessment and a retrofit strategies in public school buildings in Rome. Energy Build. 2014, 68, 196–202. [Google Scholar] [CrossRef]
- Balocco, C.; Colaianni, A. Assessment of Energy Sustainable Operations on a Historical Building. The Dante Alighieri High School in Florence. Sustain. Int. J. 2018, 10, 2054. [Google Scholar] [CrossRef]
- D’Ambrosio Alfano, F.R.; Ianello, E.; Palella, B.I. PMV-PPD and acceptability in naturally ventilated schools. Build. Environ. 2013, 67, 129–137. [Google Scholar] [CrossRef]
- D’Ambrosio Alfano, F.R.; Ianello, E.; Palella, B.I.; Riccio, G. Notes on the Calculation of the PMV index by means of Apps. Energy Procedia 2016, 101, 249–256. [Google Scholar] [CrossRef]
- D’Ambrosio Alfano, F.R.; Palella, B.I.; Riccio, G.; Toftum, J. Fifty years of Fanger’s equation: Is there anything to discover yet? Int. J. Ind. Ergon. 2018, 66, 157–160. [Google Scholar] [CrossRef]
- Al Horr, Y.; Arif, M.; Katafygiotou, M.; Mazroei, A.; Kaushik, A.; Elsarraga, E. Impact of indoor environmental quality on occupant well-being and comfort: A review of the literature. Int. J. Sustain. Built Environ. 2016, 5, 1–11. [Google Scholar] [CrossRef]
- ISO. EN 7730, Ergonomics of the Thermal Environment—Analytical Determination and Interpretation of Thermal Comfort Using Calculation of the PMV and PPD Indices and Local Thermal Comfort Criteria; International Standards Organisation: Geneva, Switzerland, 2005. [Google Scholar]
- EN 15251-2008. Indoor Environmental Input Parameters for Design and Assessment of Energy Performance of Buildings Addressing Indoor Air Quality, Thermal Environment, Lighting and Acoustics. Available online: http://store.uni.com/catalogo/index.php/uni-en-15251-2008.html (accessed on 14 February 2008).
- Havenith, G.; Nilsson, H. Correction of clothing insulation for movement and wind effects, a meta-analysis. Eur. J. Appl. Physiol. 2014, 92, 636–640. [Google Scholar] [CrossRef] [PubMed] [Green Version]
- ISO 9920. Ergonomics of the Thermal Environment e Estimation of the Thermal Insulation and Evaporative Resistance of a Clothing Ensemble; International Standardization Organization: Geneva, Switzerland, 2009. [Google Scholar]
- ASHRAE. Thermal environmental conditions for human occupancy. In ANSI/ ASHRAE Standard 55; American Society of Heating, Refrigerating and Air Conditioning Engineers: Atlanta, GA, USA, 2017. [Google Scholar]
- Blazejczk, K.; Epstein, Y.; Jendritzky, G.; Staiger, H.; Tinz, B. Comparison of UTCI to selected thermal indices. Int. J. Biometeorol. 2012, 56, 515–535. [Google Scholar] [CrossRef] [PubMed]
- Enescu, D. A review of thermal comfort models and indicators for indoor environments. Renew. Sustain. Energy Rev. 2017, 79, 1353–1379. [Google Scholar] [CrossRef]
- ASHRAE. ASHRAE (American Society of Heating Refrigerating and Air-conditioning Engineering) Handbook Fundamentals; American Society of Heating, Refrigerating and Air Conditioning Engineers: Atlanta, GA, USA, 2017. [Google Scholar]
- Koskela, H.; Häggblom, H.; Kosonen, R.; Ruponen, M. Flow Pattern and Thermal Comfort in Office Environment with Active Chilled Beams; ASHRAE (American Society of Heating Refrigerating and Air-Conditioning Engineering) Report; American Society of Heating, Refrigerating and Air Conditioning Engineers: Atlanta, GA, USA, 2010. [Google Scholar] [CrossRef]
Figure 1.
Flowchart scheme.

Figure 2.
An image of the school.

Figure 3.
Axonometric view of classroom model.

Figure 4.
(a) Axonometric view of the model with zone and section indications and (b) plan view of the model with mesh and zone indications.
Figure 4.
(a) Axonometric view of the model with zone and section indications and (b) plan view of the model with mesh and zone indications.

Figure 5.
Results of the dynamic simulation of dry bulb temperature: (a) Axonometric view of the model with horizontal section; (b) axonometric view of the model with vertical section; and (c) axonometric view of the model with focus on radiator.
Figure 5.
Results of the dynamic simulation of dry bulb temperature: (a) Axonometric view of the model with horizontal section; (b) axonometric view of the model with vertical section; and (c) axonometric view of the model with focus on radiator.

Figure 6.
Results of the dynamic simulation of mean radiant temperature and operative temperature: (a) Peripheral Zone; (b) sitting Zone; and (c) standing Zone.
Figure 6.
Results of the dynamic simulation of mean radiant temperature and operative temperature: (a) Peripheral Zone; (b) sitting Zone; and (c) standing Zone.

Figure 7.
Results of the dynamic simulation of air velocity: (a) Axonometric view of the model with horizontal section; (b) axonometric view of the model with vertical section; and (c) axonometric view of the model with focus on radiator.
Figure 7.
Results of the dynamic simulation of air velocity: (a) Axonometric view of the model with horizontal section; (b) axonometric view of the model with vertical section; and (c) axonometric view of the model with focus on radiator.

Figure 8.
Results of the dynamic simulation of dry bulb temperature: (a) Axonometric view of the model with horizontal section; (b) axonometric view of the model with vertical section; and (c) axonometric view of the model with focus on radiator.
Figure 8.
Results of the dynamic simulation of dry bulb temperature: (a) Axonometric view of the model with horizontal section; (b) axonometric view of the model with vertical section; and (c) axonometric view of the model with focus on radiator.

Figure 9.
Results of the dynamic simulation of mean radiant temperature and operative temperature: (a) Peripheral Zone; (b) sitting Zone; and (c) standing Zone.
Figure 9.
Results of the dynamic simulation of mean radiant temperature and operative temperature: (a) Peripheral Zone; (b) sitting Zone; and (c) standing Zone.

Figure 10.
Results of the dynamic simulation of air velocity: (a) Axonometric view of the model with horizontal section; (b) axonometric view of the model with vertical section; and (c) axonometric view of the model with focus on radiator.
Figure 10.
Results of the dynamic simulation of air velocity: (a) Axonometric view of the model with horizontal section; (b) axonometric view of the model with vertical section; and (c) axonometric view of the model with focus on radiator.


Table 1.
Thermophysical properties of building components.
| Partition/Component | Total Transmittance [Wm−2K−1] |
|---|---|
| Perimetral Walls | 1.910 |
| Perimetral Walls | 1.903 |
| Internal Walls | 2.391 |
| Roof | 2.102 |
| Slab-under roof room | 0.477 |
| Slab (wattle) | 1.628 |
| Windows | 5.680 |
Table 2.
Air velocity min/max/mean values in different zones.
| Peripheral Zone | Sitting Zone | Standing Zone | |
|---|---|---|---|
| Max Air Velocity [m s−1] | 0.25 | 0.22 | 0.09 |
| Min Air Velocity [m s−1] | 0.00 | 0.00 | 0.00 |
| Mean Air Velocity [m s−1] | 0.11 | 0.06 | 0.05 |
Table 3.
Air velocity min/max/mean values in different zones.
| Peripheral Zone | Sitting Zone | Standing Zone | |
|---|---|---|---|
| Max Air Velocity [m s−1] | 0.28 | 0.13 | 0.10 |
| Min Air Velocity [m s−1] | 0.01 | 0.01 | 0.04 |
| Mean Air Velocity [m s−1] | 0.15 | 0.07 | 0.08 |
© 2018 by the authors. Licensee MDPI, Basel, Switzerland. This article is an open access article distributed under the terms and conditions of the Creative Commons Attribution (CC BY) license (http://creativecommons.org/licenses/by/4.0/).
Share and Cite
MDPI and ACS Style
Balocco, C.; Colaianni, A. Modelling of Reversible Plant System Operations in a Cultural Heritage School Building for Indoor Thermal Comfort. Sustainability 2018, 10, 3776. https://doi.org/10.3390/su10103776
AMA Style
Balocco C, Colaianni A. Modelling of Reversible Plant System Operations in a Cultural Heritage School Building for Indoor Thermal Comfort. Sustainability. 2018; 10(10):3776. https://doi.org/10.3390/su10103776
Chicago/Turabian StyleBalocco, Carla, and Alessandro Colaianni. 2018. "Modelling of Reversible Plant System Operations in a Cultural Heritage School Building for Indoor Thermal Comfort" Sustainability 10, no. 10: 3776. https://doi.org/10.3390/su10103776
Note that from the first issue of 2016, this journal uses article numbers instead of page numbers. See further details here.