Abstract
As large-scale hydropower projects are influenced by many factors, risk evaluations are complex. This paper considers a hydropower project as a complex system from the perspective of sustainability risk, and divides it into three subsystems: the natural environment subsystem, the eco-environment subsystem and the socioeconomic subsystem. Risk-related factors and quantitative dimensions of each subsystem are comprehensively analyzed considering uncertainty of some quantitative dimensions solved by hybrid uncertainty methods, including fuzzy (e.g., the national health degree, the national happiness degree, the protection of cultural heritage), random (e.g., underground water levels, river width), and fuzzy random uncertainty (e.g., runoff volumes, precipitation). By calculating the sustainability risk-related degree in each of the risk-related factors, a sustainable risk-evaluation model is built. Based on the calculation results, the critical sustainability risk-related factors are identified and targeted to reduce the losses caused by sustainability risk factors of the hydropower project. A case study at the under-construction Baihetan hydropower station is presented to demonstrate the viability of the risk-evaluation model and to provide a reference for the sustainable risk evaluation of other large-scale hydropower projects.
1. Introduction
Hydropower is one of the most important renewable energy sources. Of all renewable energy sources, hydropower produces the most energy, contributing about 16% to global electricity production [1,2]. Hydropower also has a positive effect on water supply, irrigation, flood control and ice prevention, if properly handled. Despite their many advantages, hydropower construction projects, and especially large-scale hydropower projects, have adverse effects on the watercourse, river morphology and flow, such as river impoundment, flow reduction and hydropeaking. There can be a loss of habitat [3] and aquatic biota biodiversity [4]. Increased government and public awareness of these adverse effects has led to a greater focus on sustainable hydropower development that promotes economic development, and protects the environment and social justice [5]. Consequently, there has been an increase in research attention on sustainability and what it means; generally, sustainability has been defined as meeting the needs of modern life without endangering the needs of future generations [6].
Sustainability is a multifaceted concept that encompasses the environment, the economy and the society [7]. In the environmental dimension, sustainability means protecting and strengthening production and renewal capacity of environmental systems. In the economic dimension, sustainability means maximizing current and future net benefits of economic development while ensuring the quality of the natural resources and associated services. Socially, sustainability means improving the quality of life and health, and ensuring access to the necessary resources to create an environment where people’s rights to equality and freedom are protected. Risk refers to the chance of some unfavorable event occurring, that in the context of the organization arises from a decision or a commitment, and results in uncertainty and exposure [8]. Due to the multifaceted nature of sustainability, sustainability risk is the consideration of risks arising from environment, economy and society. Sustainability risk is a newly emerging risk area and one of the critical risk areas in the 21st century. In dealing with sustainability risk, whose three dimensions are not independent and have significant interconnected influences, sustainability risk management has been seen as a “triple bottom line” (TBL); that is, the sum of financial performance, environmental performance and social responsibility performance. Because of the interactions between the dimensions, risk managers need to maximize all three dimensions to achieve a maximum triple bottom line. While risk managers have been concerned about environmental risks since the 1970s, the intense increase in the focus on environmental issues in the past decade and a half has shown that the level of sustainability risk has reached a new level and is expected to increase over the century [9].
The sustainability evaluation of hydropower, a multi-dimensional evaluation, became a hot topic of discussion. Since the World Commission on Dams, an organization under the guidance of the World Bank and the World Conservation Union, called for more interdisciplinary and sustainable decision-making with respect to large dams, the integrative dam assessment model (IDAM) with funding from the United States National Science Foundation was built. The IDAM approach is based on sustainable development projects and balances the needs of biophysical, socioeconomic and geopolitical systems [10]. Based on the IDAM, original data on the culture, economics, hydro-politics and environment of the Nu River was presented and the results illustrated the important role of geographic isolation in intensifying vulnerability to hydropower development [11]. In recent years, the hydropower stations are analyzed by focusing on environmental, social and economic stability from a multi-dimensional perspective [12,13,14,15]. As for the methods of hydropower project evaluation, since the problem of conflicting objectives due to multiple purposes between environmental, social and economic sustainability considerations, multi-criteria analysis (MCA) is useful for sustainability evaluation. MCA is a method of evaluation where according to a set of evaluation criteria, different alternatives are compared and evaluated based on the purposes of different participants [2]. The authors regarded electricity supply cost as the economic indicator, the number of resettlements as the social indicator and the biodiversity index as the environmental indicator. In the way of MCA, it explicitly showed the quantitative relationship between economic, environmental and social impacts of hydropower projects used, and took full account of the trade-off among their objectives of hydropower development [16]. The most commonly used MCA technique is analytic hierarchy process (AHP), because it is flexible, user-friendly, and the results are clearly explained and justified [17]. Furthermore, some fuzzy methods are applied to the risk evaluation of hydropower stations. Using risk assessment and expert judgement instead of probabilistic reasoning to provide fuzzy rating tools for hydropower projects, the findings showed that site geological and environmental issues are considered the most important risks [18]. An integrated fuzzy entropy-weight multiple criteria decision making (IFEMCDM) method was proposed and applied to risk assessment of hydropower projects, and required a proper understanding of the context by the policy decision maker and MCA. IFEMCDM combines the fuzzy set theory, the entropy method and the multi-criteria decision-making method in the framework of risk assessment. It can quantify the uncertainty of the fuzzy set in evaluation indicators, the subjective influence of weights to evaluate multi-criteria decision-making in a more objective way, and then the risk of hydropower projects is evaluated in a more objective way by avoiding subjective influences on weights [19].
In general, the sustainability evaluation of hydropower projects, a multi-dimensional analysis, has become a hot topic of discussion. Hydropower project studies have mainly focused on environmental influences, terrestrial ecology losses, aquatic organisms and common ecological problems. However, there is little research focus on the sustainability risk evaluation. Further, many evaluations of hydropower projects have been based on MCA, and have evaluated the multiple conflicting criteria but without considering the interactions between the criteria. Some research in this area has also integrated fuzzy theory into the evaluation methods, with the quantified uncertainties being presented in fuzzy sets; but few have included hybrid uncertainty. In fact, there are some unknown sustainability risk values. The sustainability risk uncertainties are accounted for using fuzzy, random, and fuzzy random indicators in the practical large-scale hydropower projects. For example, the ecological index, the protection of cultural heritage and so on are fuzzy variables; the underground water levels, river width and others are random variables; and runoff volumes and precipitation are fuzzy random variables. Based on the above, we focus on describing hydropower project sustainability risks by examining the related factors and their interactions, handling the hybrid uncertainty including fuzzy, random, and fuzzy random certainty, and quantitatively assessing the sustainability risks, so as to give practical advice to managers on identifying the critical sustainability risk factors to reduce corresponding losses caused by these factors. The proposed methodology is then demonstrated in a practical case study on a large-scale hydropower project.
2. Key Problem Statement
This section examines the sustainability risk in hydropower projects and describes the inherent hybrid uncertainties.
2.1. Sustainability Risk in Large-Scale Hydropower Projects
The environmental and socioeconomic risks of hydropower engineering have often been discussed for large-scale hydropower projects because they require the relocation of local residents and the submerging of cultural heritage. When examining the influences of hydropower projects from a sustainability risk, there are many factors that need to be considered from the perspectives of the environment and socioeconomy.
As shown in Figure 1, the sustainability risk assessment for hydropower projects is a giant complex open system made up of a socioeconomic subsystem, an eco-environment subsystem and a natural environment subsystem. In the inner circle of the socioeconomic subsystem, there are resettlement risks, health risks, social stability risks and local industry/agriculture/landscape risks; in the eco-environment system, we focus on biological factors in the environment such as terrestrial biology and aquatic organisms risks; and in the natural environment subsystem, there are river/ground-surface/atmosphere risks which are natural resources and physical phenomena in the environment. Therefore, when examining the overall sustainability risk in this giant complex open system, by considering the risks across all the three subsystems, it is possible to comprehensively evaluate the full influence of hydropower projects. Within this framework, the sustainability risk evaluation results can assist construction project managers to identify the critical sustainability risk factors that need to be considered to reduce corresponding losses caused by the factors.
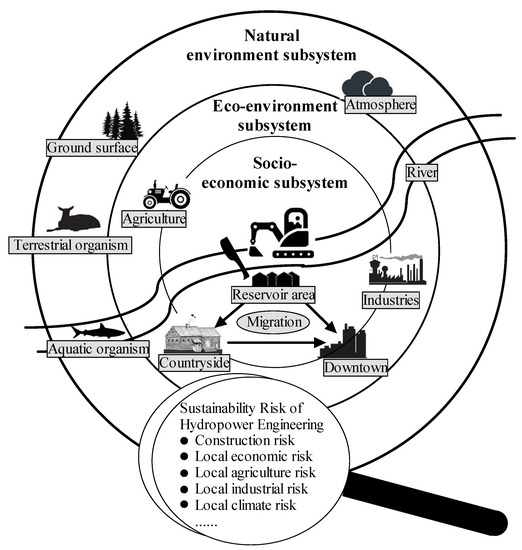
Figure 1.
Problem statement for the sustainability risks in large-scale hydropower projects.
2.2. Hybrid Uncertainty Description
This paper measures large-scale hydropower projects’ sustainability risks by comparing the risk standard values and the risk change values. Although the risk standard values are crisp values, as they are extracted from historical data, the risk change values are unknown when a project is still under construction. Inevitably, many risk change values can only be obtained by expert estimation or scientific prediction. Based on a practical field investigation, this paper considers three types of uncertainty; fuzzy, random, and two-fold uncertainty known as “fuzzy random”.
(1) Fuzzy uncertainty
Some hydropower project sustainability risk-related factors, such as the destruction degree of cultural heritage and the impact on the natural landscape, require expert judgement. Based on the construction planning, the local environmental status, and their experience, the experts first make their own judgements using linguistic variables, the values for which are phrased in natural language, which has been proven to be very useful when dealing with ill-defined situations that need to be described using conventional quantitative expressions [20].
The intuitionistic fuzzy numbers (IFNs) quantity the subjective feelings, and are defined as follows [21]:
Let X denote a universe of discourse. Then, an intuitionistic fuzzy set A in X is a set of ordered triples: , and the and represent the degree of membership and degree of nonmembership of the element to , respectively. The intuitionistic fuzzy subset A is called an intuitionistic fuzzy number if:
- (a)
- A is if-normal (i.e., there exist at least two points such that and ,
- (b)
- A is if-convex (i.e., its membership function is fuzzy convex and its nonmembership function is fuzzy concave),
- (c)
- is upper semicontinuous and is lower semicontinuous,
- (d)
- is bounded.
For example, for the factor “Protection of cultural heritage”, the expert judgements can be expressed on a 7-point rating scale: “very high”, “high”, “medium high”, “medium”, “medium low”, “low” and “very low”. These linguistic variables can then be converted into trapezoidal intuitionistic fuzzy numbers [20,22,23] as shown in Table 1. By applying IFN, the subjective expert opinions can be expressed mathematically. IFNs have been commonly used to solve decision-making problems where available information is imprecise. Trapezoidal IFNs and triangular IFNs have been the most commonly used IFN forms [24,25]. This paper uses trapezoidal IFNs because they are conceptually and computationally simpler. The advantages of employing trapezoidal IFNs in fuzzy modeling and interpreting have been well-justified [26]. A fuzzy set M in is given by , where is the membership function of the fuzzy set M, and is the membership of in M [27]. The linguistic variable membership functions for the subjective evaluation criteria ratings are shown in Figure 2.

Table 1.
Linguistic variables and trapezoidal IFNs for rating the destruction degree of cultural heritage.
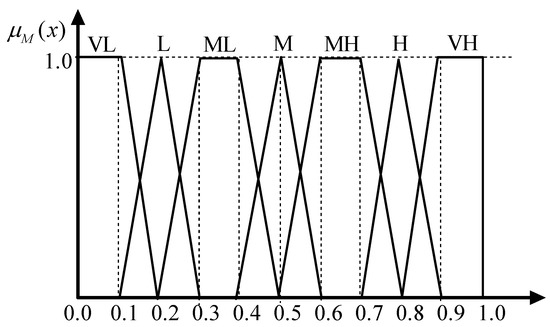
Figure 2.
Linguistic variable membership functions for rating the cultural-heritage destruction degree.
(2) Random uncertainty
Different from fuzzy uncertainty, which is internal and subjective, there is another type of uncertainty related to external forces such as the uncertainties associated with demand, product prices, task times and weather. This objective uncertainty has generally been dealt with using randomness. For example, in our field study at the Baihetan hydropower station construction project, some variables such as the pH value and river width had random fluctuation characteristics.
(3) Fuzzy random uncertainty
The need to consider two-fold uncertainty in practical evaluation/optimization problems has also been widely recognized [28,29,30,31]. Current risk evaluation research has tended to consider uncertainty as either fuzzy or random uncertainty [19,32]. In reality, because both objective and subjective information simultaneously exist, both fuzziness and randomness need to be considered.
For example, in sustainability risk, the stream flow is highly uncertain after the completion of a large-scale hydropower project due to the interannual climate variabilities in the monthly stream flow. Based on an analysis of the historical data for monthly stream flow over the past 50 years, the monthly stream flow in the study area for the five levels can be expressed as trapezoidal fuzzy numbers, and the monthly stream flow in the study area has typical fuzzy random variable characteristics as shown in Equation (1).
The monthly runoff was found to have five distinct levels: high (H), medium high (), medium (M), medium low () and low (L), with the probabilities that the monthly stream flow falls into each level. By analyzing the range in each level, the upper and lower boundaries and , and the most possible value range for each level can be estimated.
Figure 3 shows a description of the stream flow as a fuzzy random variable.
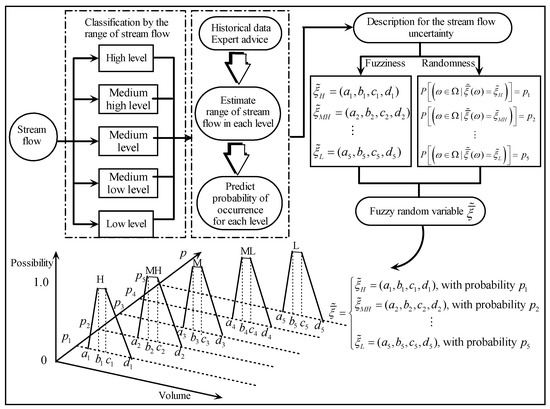
Figure 3.
Stream flow as a fuzzy random variable.
3. Sustainability Risk-Related Factors
As hydropower engineering construction is a complex process, sustainability risk is affected by many interrelated factors that encompass both environmental and social responsibility risks. To ensure a systematic, representative evaluation system, the sustainability risk of large-scale hydropower projects is seen as a complex system divided into three subsystems: the natural environment subsystem, the eco-environment subsystem and the socioeconomic subsystem, as mentioned in Section 2.1. The natural environment subsystem and the eco-environment subsystem focus on the material and biological resources separately.
Based on field studies, expert interviews and a literature review [18,19,33,34,35,36,37,38,39,40], we decomposed the three subsystems separately, then the complex sustainability risk-related factors and the quantitative dimensions (equivalent to the attributes for the sustainability risk-related factors) for large-scale hydropower projects were summarized. This method of dividing the system into subsystems first and then decomposing the subsystems separately according to the system layers can ensure scientific rigour of the evaluation system, comprehensive identification of the evaluation indicators, and accuracy in the risk-related factor evaluations. As mentioned before, there are some unknown sustainability risk values, and the sustainability risk uncertainties are accounted for using fuzzy, random, and fuzzy random indicators: that is, the ecological index, the national health degree, the national happiness degree, the protection of cultural heritage, and the influence of the landscape were seen to have fuzzy quantitative dimensions. For example, the national happiness degree is a summary of how inhabitants feel and experience their own existence and development; it tells us the happiness degree of inhabitants from the some point rating scale: “very happy”, “happy”, “not bad”, “bad” and “very bad”, which are linguistic. Moreover, the national health degree is similar to the national happiness degree and pays attention to inhabitants’ health status. The underground water levels, river width and pH value were assigned random quantitative dimensions, and runoff volumes and precipitation were assigned fuzzy random quantitative dimensions. The specific risk-related factors and quantitative dimensions are shown in Table 2.
Table 2.
Sustainability risk-related factors and quantitative dimensions for large-scale hydropower projects.
4. Sustainability Risk Evaluation Model
There are many sustainability risk-related factors in large-scale hydropower projects, the quantitative dimensions for which differ in number, value and characteristics. Furthermore, the impact risk degree of the different factors also differs. However, the impact risk degree caused by some related factors may be similar. To reflect the impact risk degree of all the risk-related factors and to better evaluate the sustainability risk, the structure of these risk-related factors needs to be analyzed first.
4.1. Sustainability Risk-Related Factor Structural Analysis
With considering the structure of the sustainability risk for large-scale hydropower projects, all sustainability risk-related factors were considered as a group , which had t related factors. The quantitative dimensions for the sustainability risk-related factors reflect the different dimensions of the sustainability risk influences on large-scale hydropower projects. To quantitatively reflect the sustainability risk influences of the related factors, the number of the quantitative dimensions of ith risk-related factors are defined as n, and the risk value of the pth quantification dimension in ith risk-related factors is defined as , and . For the other risk-related factors, the quantitative dimensions of jth risk-related factors are defined as m, and the risk value of the qth quantification dimension in the jth risk-related factors is defined as , and . As three types of uncertainty need to be considered for some sustainability risk quantitative dimensions, the quantitative dimension risk values are divided into three calculation modes. In this part, the expected values for the three types of uncertainty are employed to represent the risk values.
(1) Risk value for fuzzy quantitative dimensions
Some risk values for the hydropower project sustainability risk quantitative dimensions are fuzzy and therefore need experts to make judgments to estimate the values based on their knowledge of construction planning, the status of the local environment, and their experience. We use trapezoidal fuzzy numbers to determine the risk values for some fuzzy quantitative dimensions: , is the trapezoidal fuzzy number, with the membership function being extracted from the expert judgements, which can be expressed as follows:
To evaluate the fuzzy sustainability risk values, the expected values are calculated.
Liu and Liu presented a novel concept for the expected values of fuzzy variables based on a credibility measure [41]. For these trapezoidal fuzzy quantitative dimensions, the expected value is described as:
where is a credibility measure.
Therefore, the expected value of the fuzzy variable is used to express the risk values of some fuzzy quantitative dimensions.
(2) Risk values for the random quantitative dimensions
Some of the quantitative dimension risk values for the hydropower project sustainability risk evaluation fluctuate randomly or are expected to occur in the future; therefore, as it is very difficult to determine the exact risk value, we use the Monte Carlo method to simulate the expected value of these risk values. The law of large numbers states that when the number of simulations is large enough, the simulation value converges to the expected value. It is not possible to predict future data, but here it is assumed that the statistical risk value distribution does not change over the short term; therefore, historical data can be used to simulate the distribution to estimate future risk values, which is the most primitive use of the Monte Carlo method. Based on the Monte Carlo method, historical data are collected, and the parameters are estimated for each of the distribution functions for the random quantitative dimensions. The number of simulations is then estimated to ensure random number calculation accuracy. The next step is to identify n sample values and after statistical analysis, the estimated mean is determined based on the Monte Carlo method for each risk value for the random quantitative dimensions.
(3) Risk values for fuzzy random quantitative dimensions
The quantitative dimension risk values have subjective uncertainty because they include both fuzziness and randomness, and can be dealt with using the fuzzy random method. Hence the expected value of the fuzzy random variable in Xu and Zhou [42] is used to express the risk values for some fuzzy random quantitative dimensions, as described in the following,
where indicates the expected value of the different fuzzy levels, and indicates the most possible value range for i levels of the quantitative dimension.
As the fuzzy variables are expressed as trapezoidal fuzzy numbers, Equation (6) can be transformed into Equation (7), and finally is used to express the risk value for the fuzzy random quantitative dimensions.
After processing the fuzzy and random sustainability risk values, the risk value vector of the ith risk-related factors and the risk value vector of the jth risk-related factors can be determined.
Because of the different units and measurement methods in the different quantitative dimensions, the risks associated with each quantitative dimension of the sustainability risk-related factors are not comparable; therefore, we use a risk-change vector to measure the degree of influence between the sustainability risk-related factors. The risk-change value of the pth quantification dimension in the ith risk-related factors and the risk-change value of the qth quantification dimension in the jth risk-related factors can be expressed as:
where is the standard risk value of the pth quantification dimension in the ith risk-related factor, which indicates the initial value of the quantitative dimensions before the large-scale hydropower engineering construction, the value for which can be determined from historical data. Therefore, the standard risk vector for the ith risk-related factor is , and is similar.
Then, the risk-change vector of the ith and jth risk-related factors can be determined: and .
4.2. Risk-Related Degree of Sustainability Risk
Coupling is when two or more systems achieve synergy through various dynamic, interdependent, coordinated and mutually reinforcing interactions between the subsystems. The coupling degree is the degree of mutual influence and mutual interaction between the systems or elements. There are three sustainability risk subsystems in large-scale hydropower projects, each of which has several risk-related factors. There is, therefore, some coupling between the sustainability risk-related factors, as the risk impact between some factors is consistent in the environmental, economic and social subsystems [43]. In other words, a change in a quantitative dimension of the sustainability risk-related factors can cause other quantitative dimensions to change.
Based on the concept of capacity coupling in physics and the capacity coupling coefficient model, a coupling model of multiple systems (or factors) interacting can be generalized as [44]:
In this paper, a two-factor coupling model is used to calculate the coupling degree between the different quantitative dimensions for the risk-related factors according to their suitability so as to determine the risk-influence degree between the different quantitative dimensions. Therefore, the risk-influence degree of the pth quantitative dimension in the ith risk-related factor and the qth quantitative dimension in the jth risk-related factor is defined as:
The smaller the risk-influence degree between the quantitative dimensions, the greater the difference in the risk-change values for these quantitative dimensions, which indicates that the risk-related factors have less influence on each other.
The risk-influence matrix for the quantitative dimensions between the ith and jth sustainability risk-related factors can then be determined as based on :
The relativity measurement model for the preference vectors for any two members in a group is used to calculate the risk-related degree between the sustainability risk-related factors. The relativity degree between the preference vector and preference vector is defined as [45]:
where is the k-norm of vector and is the g-norm of vector.
In this model, the sustainability risk-related factors correspond to the members’ preferences, and the quantitative dimensions correspond to the attributes of those preferences. As the number of quantitative dimensions for the various sustainability risk-related factors is different, this relativity measurement model for the preference vectors is needed to extend the situation. Xu and Cao [46] added a risk influence matrix to a relativity measurement model for preference vectors to solve a problem that could not be compared because of the differences in the number of quantitative dimensions in the sustainability risk-related factors, in which the risk-related degree between the sustainability risk-related factor vectors and was described as:
4.3. Weighting Method
Based on the risk-related degree between the sustainability risk ith and jth risk-related factor vectors in Equation (14), the weight of the ith risk-related factor is calculated as:
After normalization, the normalized weight of the ith risk-related factor is:
The value of the normalized weight for the risk-related factor indicates the influence of the risk-related factor in correspondence with other related factors; that is, a higher normalized weight of the related factor indicates that the factor is consistent with more other related factors in the changes after construction of the hydropower project, and the greater the influence on sustainability risk. Finally, each normalized weight for each risk-related factor is sorted, with the risk-related factors with high normalized weight being regarded as the key targets for sustainability risk in large-scale hydropower projects.
5. Case Study
5.1. Baihetan Hydropower Station
The Baihetan hydropower station is the second step of four steps in the lower reaches of the Jinsha River, with comprehensive benefits including power generation, flood control, sand control, improvement in downstream shipping conditions, and navigation in the reservoir area. The location of the Baihetan hydropower station is as shown in Figure 4. The main power station project commenced in 2013, with the first power generation expected in 2018 and project completion due in 2022. The height of the dam is 834 m, the storage capacity of the underground powerhouse is 20.6 billion m equipped with 16 units. After the completion of the power station, the Baihetan hydropower station will be the second largest hydropower station in China after the Three Gorges hydropower station with 16 gigawatts initial installed capacity and 60.24 billion kWh average annual generating capacity. The dam site has a basin area of 430,300 km, which is 91% of the basin area above the Jinsha River. The land expropriation required for the construction of the Baihetan hydropower station for the reservoir flood area, the junction project construction area and the new town area involves two provinces (Sichuan Province and Yunnan province), six counties (Ningnan, Huidong, Qiaojia, Huize, Dongchuan and Luquan), four cities, 39 townships, 110 administrative villages, and an immigrant population of more than 11 million people, 96% of whom live in Ningnan, Huidong and Qiaojia counties.
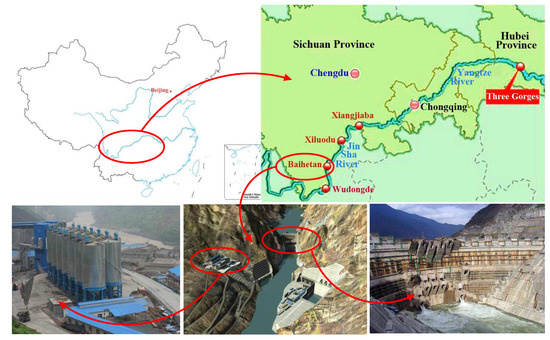
Figure 4.
Location of the study area.
5.2. Data Sources and Data Processing
In this section, the Baihetan hydropower station, a hydropower station under construction, is examined as a case study. Based on field research at the Baihetan hydropower station, and from information extracted from the Sichuan statistical yearbook, the Yunnan statistical yearbook, the Changjiang bulletin, the feasibility study reports on the pivotal project of the Baihetan hydropower station, the environmental impact statements for the Baihetan hydropower station, and our research at the Baihetan hydropower station, the relevant data for the evaluation of the sustainability risks at the Beihetan hydropower station were gathered. From the sustainability risk-related factors for large-scale hydropower projects shown in Table 2, the risk standard values and risk values for the quantification dimensions in the risk-related factors were determined. As the main project at the Baihetan hydropower station commenced in 2013, the risk standard value chosen was derived from the relevant pre-construction historical data for the Baihetan hydropower station in 2012. The risk values for the Baihetan hydropower station were extracted from data in the feasibility study reports. In total, 21 risk-related factors and 105 quantitative dimensions for the Baihetan hydropower station were identified and selected: and .
Since some risk values for the quantification dimensions were not mentioned in the feasibility study reports, expert estimation and historical data were used to predict the trapezoidal fuzzy numbers for the fuzzy quantitative dimensions (the ecological index, the national health degree, the national happiness degree, the protection of cultural heritage, the influence on the landscape), the distribution of the random quantitative dimensions (underground water levels, river width, pH values), and the -level trapezoidal fuzzy variables for the fuzzy random quantitative dimensions (runoff volumes, precipitation). As for fuzzy quantitative dimensions, we obtained data mainly through field research. Concerning the national hapiness degree and the national health degree, we conducted an interview survey in Huidong County, Sichuan Province, one of the areas where the hydropower station is located. A total of 158 people were surveyed by interview and asked their happiness and health situation, then we estimated their happiness and health degree through “very happy”, “very healthy”, “happy”, “healthy”, “not bad”, “bad”, ”very bad” and so on. The construction of the hydropower station will result in the resident relocation in the reservoir area. Since the Baihetan hydropower station is under construction and the residents in the reservoir area have not finished relocation yet, to obtain the data after project completion, we conducted interview surveys on happiness and health in areas where relocatees planned to relocate and we used the results in these areas to estimate the happiness and health degree after construction completion. The expected value was then calculated to express the risk values as described in Section 4.1. Finally, the risk standard values and the risk values for all quantification dimensions of the sustainability risk at the Baihetan hydropower station were determined.
5.3. Calculation of Normalized Weight for the Risk-Related Factors
Based on the risk standard value, risk value and Equation (8), the risk-change values for all quantification dimensions were respectively calculated. The risk influence matrix based on Equation (10) for the quantitative dimensions in the sustainability risk of the Baihetan hydropower station is shown in Table 3.
Table 3.
Risk influence degree between the quantitative dimensions for the sustainability risk at the Baihetan hydropower station.
Then, the risk-related degrees between the sustainability risk-related factors at the Baihetan hydropower station were calculated, as shown in Table 4, and the weights for the risk-related factors based on the results of the risk-related degrees were determined. After normalization and sorting, the results of the sorted normalized weights for the risk-related factors are shown in Table 5.
Table 4.
Risk-related degree between the sustainability risk-related factors for the sustainability risk at the Baihetan hydropower station.
Table 5.
Sorted normalized weight for the sustainability risk-related factors at the Baihetan hydropower station.
5.4. Sustainability Risk of the Baihetan Hydropower Station Analysis
The Baihetan hydropower station construction has different degrees of risk for the different risk-related factors. The greater the normalized weights of the risk-related factors, the greater the impact of the construction project on these related factors in the sustainable risk; that is, these risk-related factors need greater protection. As the results shown in Table 5 indicate, terrestrial animal, aquatic vegetation, fish, soil and environmental status were the factors most influenced by the construction, indicating that the Baihetan hydropower station construction significantly impacted risks in the eco-environment subsystem, and especially impacted organisms, with the influence on terrestrial animals being the most significant. In contrast, the influence of the construction on regional agriculture, air quality, regional industry, social stability, and water quality factors was small, indicating that the regional agricultural protection measures were effective in the Baihetan hydropower station construction planning. Therefore, to achieve sustainability risk minimization, focus at the Baihetan hydropower station construction site needs to be placed on the protection and maintenance of the eco-environment with special attention being placed on the protection of local animals to ensure the maintenance of quantity and species before and after the construction. These evaluation results can provide a valuable reference for sustainable risk evaluations at other hydropower stations.
In the subsystem perspective, the sustainability risk influence differs from different systems. As shown in Figure 5, the overall level of the normalized weights of the risk-related factors in the eco-environment subsystem is highest, the top three normalized weights are in the eco-environment subsystem, and those in the socioeconomic subsystem are lowest, where all but cultural heritage and reservoir landscape are very low in normalized weights; that is, they have little impact on other risk-related factors. From the macro-system analysis, the eco-environment subsystem fluctuations have a greater impact on other subsystems, the changes of the eco-environment subsystem may result in relatively large changes in other subsystems, so we need to give more attention and protection to the eco-environment subsystem when considering the sustainability of the Beihetan hydropower station. In addition, we analyzed the risk-related degree between the sustainability risk-related factors at the Baihetan hydropower station. The top five risk-related degrees are aquatic vegetation and fish, terrestrial animals and fish, terrestrial animals and aquatic vegetation, aquatic vegetation and resettlement, and resettlement and fish. The lives of terrestrial animals, fish and aquatic vegetation are all dependent on the environment. Changes in the environment will cause great changes in their habitats and lifestyles, and may even threaten their lives. At the same time, they show a strong connection in the food web. After the construction of the Baihetan hydropower station, their similar and related fates have promoted their high sustainability risk-related degree. The construction of the Baihetan hydropower station will inundate a certain number of residential areas, so residents need to be resettled. The change of resettlement factor shows a great similarity to the change of aquatic vegetation and fish, indicating that the resettled residents are more dependent on aquatic organisms and may be related to the use of aquatic life as necessities of life and sources of income for a long time.
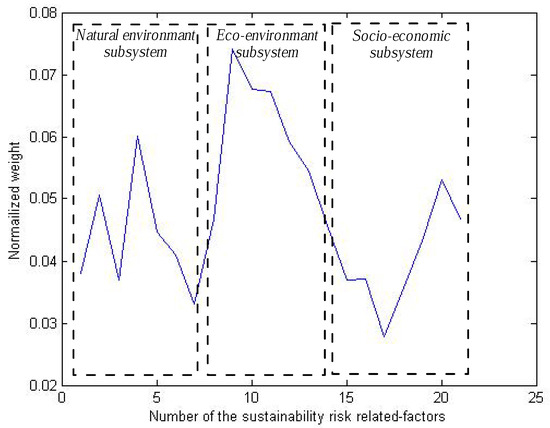
Figure 5.
Normalized weight for the sustainability risk-related factors in the subsystem perspective.
6. Conclusions
Sustainability risk evaluations for large-scale hydropower projects are systematic and complex. In this paper, the sustainability risk-related factors and quantitative dimension structures for large-scale hydropower projects were identified. From the calculations for the risk-related degrees for the sustainability risk-related factors with hybrid uncertainty, the sustainability risk impact degrees between all related factors were determined and the normalized weights for each risk-related factor obtained to deduce the main factors in sustainability risk for hydropower projects. The sustainability risk at the under-construction Baihetan hydropower station was taken as a case to demonstrate the methodology, the results from which provide a valuable reference to reduce or avoid the risks through targeted and effective measures to ensure sustainable hydropower projects. The results show that the eco-environment system is a relatively important part of the Baihetan hydropower station development because of its relatively large related impact. Specifically, terrestrial animals, aquatic vegetation, fish, soil, and environmental status are the most important factors in controlling sustainability risk. Managers can reduce the sustainability risk of the Baihetan hydropower station by some measures, such as emphasis on publicity and education of environmental protection for construction workers, implementation of greening projects in construction projects, establishment of fish-proliferation stations and a long-term mechanism for immigrants caused by the Baihetan hydropower station construction. At the same time, this paper also provides a sustainability risk evaluation method and gives some references to control sustainability risk for hydropower projects.
Future research will try to apply other evaluation methods to the sustainability risk evaluation of hydropower projects, and will consider the risk relation between the sustainability risk factors; then, the comparative analysis between different evaluation methods will generate a more-suitable sustainable risk evaluation of hydropower projects.
Acknowledgments
We are thankful for financial support from the National Natural Science Foundation (Grant No. 71601134), the China Postdoctoral Science Foundation (No. 2017M612983), the Fundamental Research Funds for the Central Universities (WUT: 2016VI002) and the Research Center for Systems Science & Enterprize Development (Grant No. Xq15C01 and Xq17B07).
Author Contributions
Conflicts of Interest
The authors declare no conflict of interest.
References
- Santl, S.; Steinman, F. Hydropower suitability analysis on a large scale level: Inclusion of a calibration phase to support determination of model parameters. Water Resour. Manag. 2015, 29, 109–123. [Google Scholar] [CrossRef]
- Vassoney, E.; Mochet, A.M.; Comoglio, C. Use of multicriteria analysis (MCA) for sustainable hydropower planning and management. J. Environ. Manag. 2017, 196, 48–55. [Google Scholar] [CrossRef] [PubMed]
- Alpine Convention. Situation Report on Hydropower Generation in the Alpine Region Focusing on Small Hydropower; Permanent Secretariat of the Alpine Convention: Innsbruck, Austria, 2011. [Google Scholar]
- Vezza, P.; Parasiewicz, P.; Calles, O.; Spairani, M.; Comoglio, C. Modelling habitat requirements of bullhead (Cottus gobio) in Alpine streams. Aquat. Sci. 2004, 76, 1–15. [Google Scholar] [CrossRef]
- Kumar, D.; Katoch, S.S. Sustainability assessment and ranking of run of river (ROR) hydropower projects using analytical hierarchy process (AHP): A study from Western Himalayan region of India. J. Mt. Sci. 2015, 12, 1315–1333. [Google Scholar] [CrossRef]
- WCED. Our Common Future, World Commission on the Environment and Development; Oxford University Press: New York, NY, USA, 1987. [Google Scholar]
- Hayashi, T.; Ierland, E.C.V.; Zhu, X. A holistic sustainability assessment tool for bioenergy using the Global Bioenergy Partnership (GBEP) sustainability indicators. Biomass Bioenergy 2014, 66, 70–80. [Google Scholar] [CrossRef]
- Canadian Institute of Chartered Accountants. Approaches to Dealing with Risk and Uncertainty; Canadian Institute of Chartered Accountants: Toronto, ON, Canada, 1990. [Google Scholar]
- Anderson, D.R. The Critical Importance of Sustainability Risk Management. Risk Management 2006, 53, 66. [Google Scholar]
- Tilt, B.; Schmitt, E. The Integrative Dam assessment model: Reflections from an anthropological perspective. Pract. Anthropol. 2013, 35, 4–7. [Google Scholar] [CrossRef]
- Tullos, D.; Foster-Moore, E.; Magee, D.; Tilt, B.; Wolf, A.; Schmitt, E.; Gassert, F.; Kibler, K. Biophysical, socioeconomic, and geopolitical vulnerabilities to hydropower development on the Nu River, China. Ecol. Soc. 2013, 18, 261–272. [Google Scholar] [CrossRef]
- Liu, J.; Zuo, J.; Sun, Z.; Zillante, G.; Chen, X. Sustainability in hydropower development—A case study. Renew. Sustain. Energy Rev. 2013, 19, 230–237. [Google Scholar] [CrossRef]
- Liden, R.; Lyon, K. The Hydropower Sustainability Assessment Protocol for Use by World Bank Clients: Lessons Learned and Recommendations. Available online: http://documents.worldbank.org/curated/en/870411468336660190/pdf/891470REVISED00Box0385238B00PUBLIC0.pdf (accessed on 30 June 2014).
- Xuehui, A.N.; Liu, C.; Huang, Z. Hydropower sustainability assessment system in Yangtze River Basin. China Dev. 2015, 15, 7–13. [Google Scholar]
- Kumar, D.; Katoch, S.S. Sustainability indicators for run of the river (RoR) hydropower projects in hydro rich regions of India. Renew. Sustain. Energy Rev. 2014, 35, 101–108. [Google Scholar] [CrossRef]
- Morimoto, R. Incorporating socio-environmental considerations into project assessment models using multi-criteria analysis: A case study of Sri Lankan hydropower projects. Energy Policy 2013, 59, 643–653. [Google Scholar] [CrossRef]
- Singh, R.P.; Nachtnebel, H.P. Analytical hierarchy process (AHP) application for reinforcement of hydropower strategy in Nepal. Renew. Sustain. Energy Rev. 2016, 55, 43–58. [Google Scholar] [CrossRef]
- Kucukali, S. Risk assessment of river-type hydropower plants using fuzzy logic approach. Energy Policy 2011, 39, 6683–6688. [Google Scholar] [CrossRef]
- Ji, Y.; Huang, G.H.; Sun, W. Risk assessment of hydropower stations through an integrated fuzzy entropy-weight multiple criteria decision making method: A case study of the Xiangxi River. Expert Syst. Appl. 2015, 42, 5380–5389. [Google Scholar] [CrossRef]
- Zhang, S.F.; Liu, S.Y. A GRA-based intuitionistic fuzzy multi-criteria group decision making method for personnel selection. Expert Syst. Appl. 2011, 38, 11401–11405. [Google Scholar] [CrossRef]
- Grzegorzewski, P. Distances and orderings in a family of intuitionistic fuzzy numbers. In Proceedings of the European Society for Fuzzy Logic and Technology (DBLP), Zittau, Germany, 10–12 September 2009; pp. 223–227. [Google Scholar]
- Rouyendegh, B.D. The Intuitionistic Fuzzy ELECTRE model. Int. J. Manag. Sci. Eng. Manag. 2017. [Google Scholar] [CrossRef]
- Atanassov, K.T. Intuitionistic fuzzy sets. Fuzzy Sets Syst. 1986, 20, 87–96. [Google Scholar] [CrossRef]
- Qin, Q.; Liang, F.; Li, L.; Chen, Y.W.; Yu, G.F. A TODIM-based multi-criteria group decision making with triangular intuitionistic fuzzy numbers. Appl. Soft Comput. 2017, 55, 93–107. [Google Scholar] [CrossRef]
- Liang, C.; Zhao, S.; Zhang, J. Multi-criteria group decision making method based on generalized intuitionistic trapezoidal fuzzy prioritized aggregation operators. Int. J. Mach. Learn. Cybern. 2017, 8, 597–610. [Google Scholar] [CrossRef]
- Vahdani, B.; Mousavi, S.M.; Hashemi, H.; Mousakhani, M.; Tavakkoli-Moghaddam, R. A new compromise solution method for fuzzy group decision-making problems with an application to the contractor selection. Eng. Appl. Artif. Intell. 2013, 26, 779–788. [Google Scholar] [CrossRef]
- Zadeh, L.A. Fuzzy sets. Inf. Control 1965, 8, 338–353. [Google Scholar] [CrossRef]
- Xu, J.; Li, Z. Multi-objective dynamic construction site layout planning in fuzzy random environment. Autom. Constr. 2012, 27, 155–169. [Google Scholar] [CrossRef]
- Xu, J.; Ni, J.; Zhang, M. Constructed wetland planning-based bilevel optimization model under fuzzy random environment: Case study of Chaohu Lake. J. Water Resour. Plan. Manag. 2015, 141, 04014057. [Google Scholar] [CrossRef]
- Li, M.; Guo, P.; Singh, V.P.; Yang, G. An uncertainty-based framework for agricultural water-land resources allocation and risk evaluation. Agric. Water Manag. 2016, 177, 10–23. [Google Scholar] [CrossRef]
- Adhikary, K.; Roy, J.; Kar, S. A distribution-free newsboy problem with fuzzy-random demand. Int. J. Manag. Sci. Eng. Manag. 2017. [Google Scholar] [CrossRef]
- Ameyaw, E.E.; Chan, A.P.C. A fuzzy approach for the allocation of risks in public-private partnership water-infrastructure projects in developing countries. J. Infrastruct. Syst. 2016, 22, 04016016. [Google Scholar] [CrossRef]
- Shi, C.; Huang, H.; Yang, Y. Natural risk vulnerability assessment of the international hydropower project. In Proceedings of the International Conference on Artificial Intelligence, Management Science and Electronic Commerce, Zhengzhou, China, 8–10 August 2011; pp. 4674–4677. [Google Scholar]
- Tang, W.; Li, Z.; Qiang, M.; Wang, S.; Lu, Y. Risk management of hydropower development in China. Energy 2013, 60, 316–324. [Google Scholar] [CrossRef]
- Zhou, J.L.; Bai, Z.H.; Sun, Z.Y. A hybrid approach for safety assessment in high-risk hydropower-construction-project work systems. Saf. Sci. 2014, 64, 163–172. [Google Scholar] [CrossRef]
- Kucukali, S. Environmental risk assessment of small hydropower (SHP) plants: A case study for Tefen SHP plant on Filyos River. Energy Sustain. Dev. 2014, 19, 102–110. [Google Scholar] [CrossRef]
- Gu, S.; Wang, B. The ANP Model for Dam risk identification of the hydropower project. In Proceedings of the Asia-Pacific Power and Energy Engineering Conference, Chengdu, China, 28–31 March 2010; pp. 1–4. [Google Scholar]
- De Almeida, A.T.; Moura, P.S.; Marques, A.S.; de Almeida, J.L. Multi-impact evaluation of new medium and large hydropower plants in Portugal centre region. Renew. Sustain. Energy Rev. 2005, 9, 149–167. [Google Scholar] [CrossRef]
- Cerne, M.M. Social impacts and social risks in hydropower programs: Preemptive planning and counter-risk measures. In Proceedings of the Keynote Address: Session on Social Aspects of Hydropower Development United Nations Symposium on Hydropower and Sustainable Development, Beijing, China, 27–29 October 2004. [Google Scholar]
- Zhang, S.; Sun, B.; Yan, L.; Wang, C. Risk identification on hydropower project using the IAHP and extension of TOPSIS methods under interval-valued fuzzy environment. Nat. Hazards 2013, 65, 359–373. [Google Scholar] [CrossRef]
- Liu, B.; Liu, Y.K. Expected value of fuzzy variable and fuzzy expected value models. IEEE Trans. Fuzzy Syst. 2002, 10, 445–450. [Google Scholar]
- Xu, J.; Zhou, X. Fuzzy-like multiple objective decision making. Stud. Fuzz. Soft Comput. 2011, 263, 227–294. [Google Scholar]
- Henriques, C.O.; Antunes, C.H. Interactions of economic growth, energy consumption and the environment in the context of the crisis—A study with uncertain data. Energy 2012, 48, 415–422. [Google Scholar] [CrossRef]
- Valefie Illingworth. The Penguin Dictionary of Physics; Foreign Language Press: Beijing, China, 1996; pp. 92–93. [Google Scholar]
- Xu, X.H.; Chen, X.H. Research on the group clustering method based on vector space. Syst. Eng. Electron. 2005, 27, 1034–1037. [Google Scholar]
- Xu, X.H.; Cao, J. Risk evaluation for complex ecological environment of large-scale hydropower engineering. Syst. Eng. Theory Pract. 2012, 32, 2237–2246. [Google Scholar]
© 2018 by the authors. Licensee MDPI, Basel, Switzerland. This article is an open access article distributed under the terms and conditions of the Creative Commons Attribution (CC BY) license (http://creativecommons.org/licenses/by/4.0/).