Article

An Approach to Evaluate Comprehensive Plan and Identify Priority Lands for Future Land Use Development to Conserve More Ecological Values

1
Faculty of Urban Management and Studies, City University of Macau, Taipa 999078, Macau, China
2
College of Design, Jiangnan University, Wuxi 214122, China
3
College of Architecture, University of Oklahoma, Norman, OK 73019, USA
4
Department of Urban Design and Planning, Tianjin University, Tianjin 300072, China
*
Author to whom correspondence should be addressed.
Sustainability 2018, 10(1), 126; https://doi.org/10.3390/su10010126
Submission received: 28 November 2017 / Revised: 23 December 2017 / Accepted: 5 January 2018 / Published: 8 January 2018

Abstract

:
Urbanization has significant impacts on the regional environmental quality through altering natural lands, converting them to urban built-up areas. One common strategy applied by urban planners to manage urbanization and preserve natural resources is to make a comprehensive plan and concentrate future land use in certain areas. However, in practice, planners used to make future land use planning mainly based on their subjective interpretations with limited ecological supporting evidence and analysis. Here, we propose a new approach composed of ecological modelling and land use zoning in the spatial matrix to evaluate the comprehensive plan and identify priority lands for sustainable land use planning. We use the city of Corvallis, OR, as the test bed to demonstrate this new approach. The results indicate that the Corvallis Comprehensive Plan 1998–2020 featured with compact development is not performing efficiently in conserving ecological values, and the land use plan featured with mixed-use spreading development generated by the proposed approach meets the city’s land demands for urban growth, and conserves 103% more ecological value of retaining storm water nitrogen, 270% more ecological value of retaining storm water phosphorus and 19% more ecological value in storing carbon in the whole watershed. This study indicates that if planned with scientific analysis and evidence, spreading urban development does not necessarily result in less sustainable urban environment than the compact development recommended in smart growth.

1. Introduction

Urbanization has been a crucial dynamic in the world since the middle of the twentieth century. The population of urban residents increased from 800 million in the 1950s to almost 4 billion in 2014, which accounted for more than half of the global population [1]. Urbanization brings great opportunities and benefits to industrialization, modernization and sociological rationalization, and due to this advantages urbanization is predicted to maintain with a rapid rate in decades to come [2]. The United Nations reports that urbanization need to accommodate 6.5 billion people living urban areas by 2050, which is more than 60% of the predicted global population [1]. Urbanization has been promoting technical advance, social development and cultural exchange [3], however, through altering natural lands, converting them to urban built-up areas, urbanization has proven to be threating to our environmental quality in various ways. For example, urbanization was found to be a main reason for surface water pollution, and the levels of nutrient pollution in storm water, such as nitrogen and phosphorous, discharging from built-up areas are commonly above the acceptable standards [4,5,6]. Besides, during the process of urbanization, an extensive volume of carbon deposited in natural lands is returned into the atmosphere, which is believed to be one of the significant causes for climate change [7].
Given that it is not feasible to reverse development and stop urban growth [2], making a comprehensive plan and concentrating urbanization within certain area are becoming popular strategies applied by urban planners to preserve nature resources and steer the development of urban settlement in a sustainable way [8,9,10]. However, few models were developed for making comprehensive plans with full consideration of ecological factors, therefore, in practice, planners used to delineate the areas for future land use development in the comprehensive plan mainly based on their subjective interpretations, with limited ecological supporting evidence and analysis [11]. The lack of environmental database and effective planning methods put the performance of future land use plan in managing urbanization and conserving ecological values in doubt [12,13]. Ecosystem service refers to the various welfares human gain from the functioning ecosystem [14], for example ecosystem purifies storm water and stores carbon to regulate water quality and climate temperature. Previous studies have applied the concept of ecosystem service in the planning scenarios evaluation under different strategies and policies at the regional scale [15,16,17,18]. But limited studies integrate the ecosystem service quantitative analysis in making the future land use plan and few attracted the decision-makers’ attention because they did not present the results at the local scale that is more related with their own benefit.
The aim of this research is to develop a spatially explicit approach based on ecological value mapping through ecosystem service quantification and land use zoning through spatial matrix in GIS (Geographic Information System) to assist urban planners in making the future land use plan using open-access dataset. The approach is supposed to accommodate future urbanization and conserve most ecological values theoretically based on: (1) mapping ecological values on the local level; (2) quantifying different land use categories’ impacts on ecological values locally; and (3) zoning the future land use category impacting ecological values more on the land of less ecological values to protect the land of high ecological values from urbanization’s interference. This research also aims to apply the approach in the city of Corvallis as the test-bed to demonstrate its applicability and to evaluate the urban growth form generated by the proposed approach that is oriented by ecological value conservation.
The research outcomes show that Corvallis Comprehensive Plan 1998–2020 featured with compact development is not performing efficiently in conserving the ecological value of purifying storm water and the land use plan featured with spreading mixed-use development generated by the proposed approach conserves 103% more ecological value of retaining storm water nitrogen, 270% more ecological value of retaining storm water phosphorus and 19% more ecological value of storing carbon in the entire drainage basin without compromising the city’s demand of lands for predicted urbanization from 1998 to 2020. This study contributes to land use planning strategies using scientific analysis and the sprawl vs. anti-sprawl debate for the sustainable urban form. It provides assistance for urban planners and decision makers in formulating more rational plans and corresponding policies that direct the development of urban settlement towards sustainability.

2. Materials and Methods

This research used the city of Corvallis as a demonstration. We first quantified the ecological values on local scale through ecosystem service modelling. We then analyzed the effectiveness of the city’s Comprehensive Plan 1998–2020 in conserving ecological values through comparing urbanization’s ecological impacts through the city’s growth history from 1854 to 1997. We further generated the future land use plan through the proposed approach and evaluated its effectiveness with comparison to the Corvallis Comprehensive Plan 1998–2020.

2.1. Area of Interest

The city of Corvallis is located across the Marys River Watershed (Hydrologic Unit Code: 1709000302) and the Willamette River Watershed (Hydrologic Unit Code: 1709000306) in the state of Oregon, U.S. The storm water quality is an urgent issue in the city. The amount of total nitrogen and phosphorus in the Willamette River fail to meet the minimum standard established in EPA (U.S. Environment Protection Agency) Clean Water Act, and Corvallis is required to reduce daily nonpoint pollution nutrients loading into storm water [19]. Oregon implements the most restricting policies on urban growth management in America and cities in Oregon are required to implement a comprehensive land use plan [20]. Corvallis is in the Willamette Valley and encompasses 20 sub-basins (Figure 1) [21]. The city’s Comprehensive Plan was first implemented in 1980 and was updated in 1998 after periodic reviews [22]. According to the Corvallis Comprehensive Plan 1998–2020, 37.3 km2 of land were circumscribed by the City Limit and 72.8 km2 of land was circumscribed by the Urban Growth Boundary (Figure 1). Therefore, the Urban Fringe, referred to the areas between the Urban Growth Boundary and the City Limit, is near 36 km2. In 1998, this areas were covered mainly by natural forest and pasture, and it is planned to be zoned mostly by land uses of residential neighborhoods, public institutes, general industry, commercial centers, public institutes and open space during the city’s urbanization process from 1998 to 2020 [23].

2.2. Ecological Mapping through Ecosystem Service Modelling

Ecological modelling was applied to quantify ecosystem services and map the ecological values of carbon storage and storm water pollution nutrient purification in Corvallis using publicly available GIS datasets collected from various sources. Four types of databases were needed in this research—the climate dataset, the geographic dataset, the urban planning dataset and the biophysical dataset. The datasets were utilized in the well-known ecosystem services modelling program InVEST developed by the Natural Capital Project [25] (Table 1).
InVEST was developed and calibrated in Willamette River area within which the city of Corvallis is located [34], and has been applied well in the other coastal areas in Western North America in previous studies [35,36]. The modelling process in InVEST is referred to the InVEST User Guide [37]. The first parcel in the city of Corvallis was built in 1854, and until 1997, there had been 14,885 parcels [30]. We divided the city’s growth history from 1854 to 1997 into 10 periods (Figure 2) and quantified the nonpoint pollution export (nitrogen and phosphorus) into storm water and the carbon storage in the entire drainage basin for each historical period in InVEST based on the city’s historical land cover data [30]. The city’s Comprehensive Plan 1998–2020 was proposed in the Corvallis 2020 Vision Statement [23]. The nonpoint pollution export into storm water and carbon storage in the entire drainage basin from 1998 to 2020 were predicted in InVEST based on the city’s Comprehensive Plan [23] and the land use land cover data [29]. Through comparing the historical modelling results with the future prediction results, we evaluated the Comprehensive Plan’s performance in alleviating urbanization’s impacts on environmental qualities from 1998 to 2020. The amount of storm water pollution (nitrogen and phosphorus) retained on the parcel level in 1998 was also modelled in InVEST. The combined value of ecosystem services (combined ecological value) provided by the land in purifying storm water and storing carbon was defined in this research by Equation (1).
E c o log i c a l _ V a l u e = N i t r o g e n _ Re t e n t i o n × N i t r o g e n _ P u r i f i c a t i o n _ V a l u e + P h o s p h o r u s _ Re t e n t i o n × P h o s p h o r u s _ P u r i f i c a t i o n _ V a l u e + C a r b o n _ S t o r a g e × C a r b o n _ V a l u e
We used the avoided-cost method to estimate the combined ecological value in this study [38]. EPA reported that the cost of pollution removal in storm water by the municipal waste treatment ranges from $12.5/kg to $23.8/kg for nitrogen and $10.6/kg to $232.54/kg for phosphorus, respectively [39]. Although computing carbon removal cost is controversial and complex, estimates ranging from $2.6/ton to $23.1/ton of carbon released into the atmosphere has been suggested by Nordhaus [40] and Stern [41]. In this research, we set the averages, $18.2/kg as the nitrogen purification value, $121.6/kg as the phosphorus purification value, $12.8/ton as the carbon storage value. GIS was used to summarize and map the combined ecological value on the sub-basin and parcel level based on the quantification results.

2.3. Land Use Zoning through Spatial Matrix

According to the environmental planning principle to conserve ecological value [42] and the Land Conservation Act (LCA) [20], the land use category that has more impacts on the ecological value should be zoned in the areas of less ecological value and the areas of high ecological value should be preserved during urbanization. The alteration of pervious surface to impervious surface including building roofs and pavements has been indicated in previous studies to have negative influence on the environmental quality in various aspects, such as urban hydrology [43], water quality [44], wildlife habitat [45] and land surface temperature [46]. We determined the degree of different land use impacts on the ecological value through exploring the correlation of impervious surface percentage with the combined ecological value defined in this research. Based on the mapping of storm water nutrients retention and carbon storage quantification generated from InVEST and the combined ecological value for each parcel, an original Spatial Matrix P was created to show each parcel’s size, the spatial location identification and its combined ecological value (Figure 3a), and in Spatial Matrix M, the parcels are arranged with the ecological value in the ascending order (Figure 3b).
Based on the principle to conserve ecological value that the land use category that has more impacts on the ecological value should be zoned in the areas of less ecological value and the areas of high ecological value should be preserved during urbanization, Equation (2), Equation (3) and the Spatial Matrix M in Figure 3 were used to determine parcels for different land uses.
n = 1 n M ( Parcel   Size   i ) LU
Output = min ( n )
where M is Spatial Matrix M; n is the first n parcels in Matrix M; LU is the size of the land use to be zoned. Spatial Matrix M informs the amount of the parcels’ ecological value in ascending order. Equation (2) keeps accumulating the parcel size following the ecological value ascending order in Spatial Matrix M until the total accumulation size is bigger than the size of land required by the land use category in future urbanization. In GIS, Equation (3) locates the parcels that are used in the accumulation process in Equation (2) and delineates the urbanization land use pattern on the map.

3. Results and Discussion

3.1. Current Comprehensive Plan 1998–2020 Evaluation

The urbanization’s ecological impacts through exporting nonpoint storm water pollution and losing carbon storage from 1998 to 2020 in the city of Corvallis were summarized in Table 2. Under the Corvallis Comprehensive Plan, the city is modelled to discharge 52% more nitrogen pollution and 159% more phosphorous pollution into storm water, and losing 11% carbon storage in the entire drainage basin due to the urbanization from 1998 to 2020. Within the City Limit, nitrogen and phosphorus pollution exports rise by 44% and 157% respectively, and the carbon storage drops by 9%. The high percentage of nitrogen and phosphorus export is consistent with previous research finding that Willamette Basin is facing increasing risk of water contamination due to nitrogen input and phosphorus input [47,48]. All of these three results are less than the general impacts across the entire drainage basin. This could be explained by the fact that there is less available lands for new urban development within the City Limit and the urbanization rate tends to be slower from 1998 to 2020. The storm water pollution export and carbon storage stay almost the same outside the Urban Growth Boundary because of few land cover alteration in these lands. However, in the Urban Fringe area, storm water nitrogen and phosphorus export are modelled to be increased by more than 80% and 200%, respectively, and carbon storage is predicted to lose by 60% in 2020. All of these three outcomes are much higher than the general impacts across the entire drainage basin and the reason could be the fact that compared with the area within the City Limit, the ongoing urbanization process in the urban-rural fringe is more likely to cause the corresponding environment and biodiversity degradation due to its sensitivity to urbanization interruptions [49].
Based on the Corvallis Comprehensive Plan 1998–2020, 35 km2 land are planned to be urbanized from 1998 to 2020 (Average Urbanization Rate: 35 km2/22 year = 1.6 km2/year) [
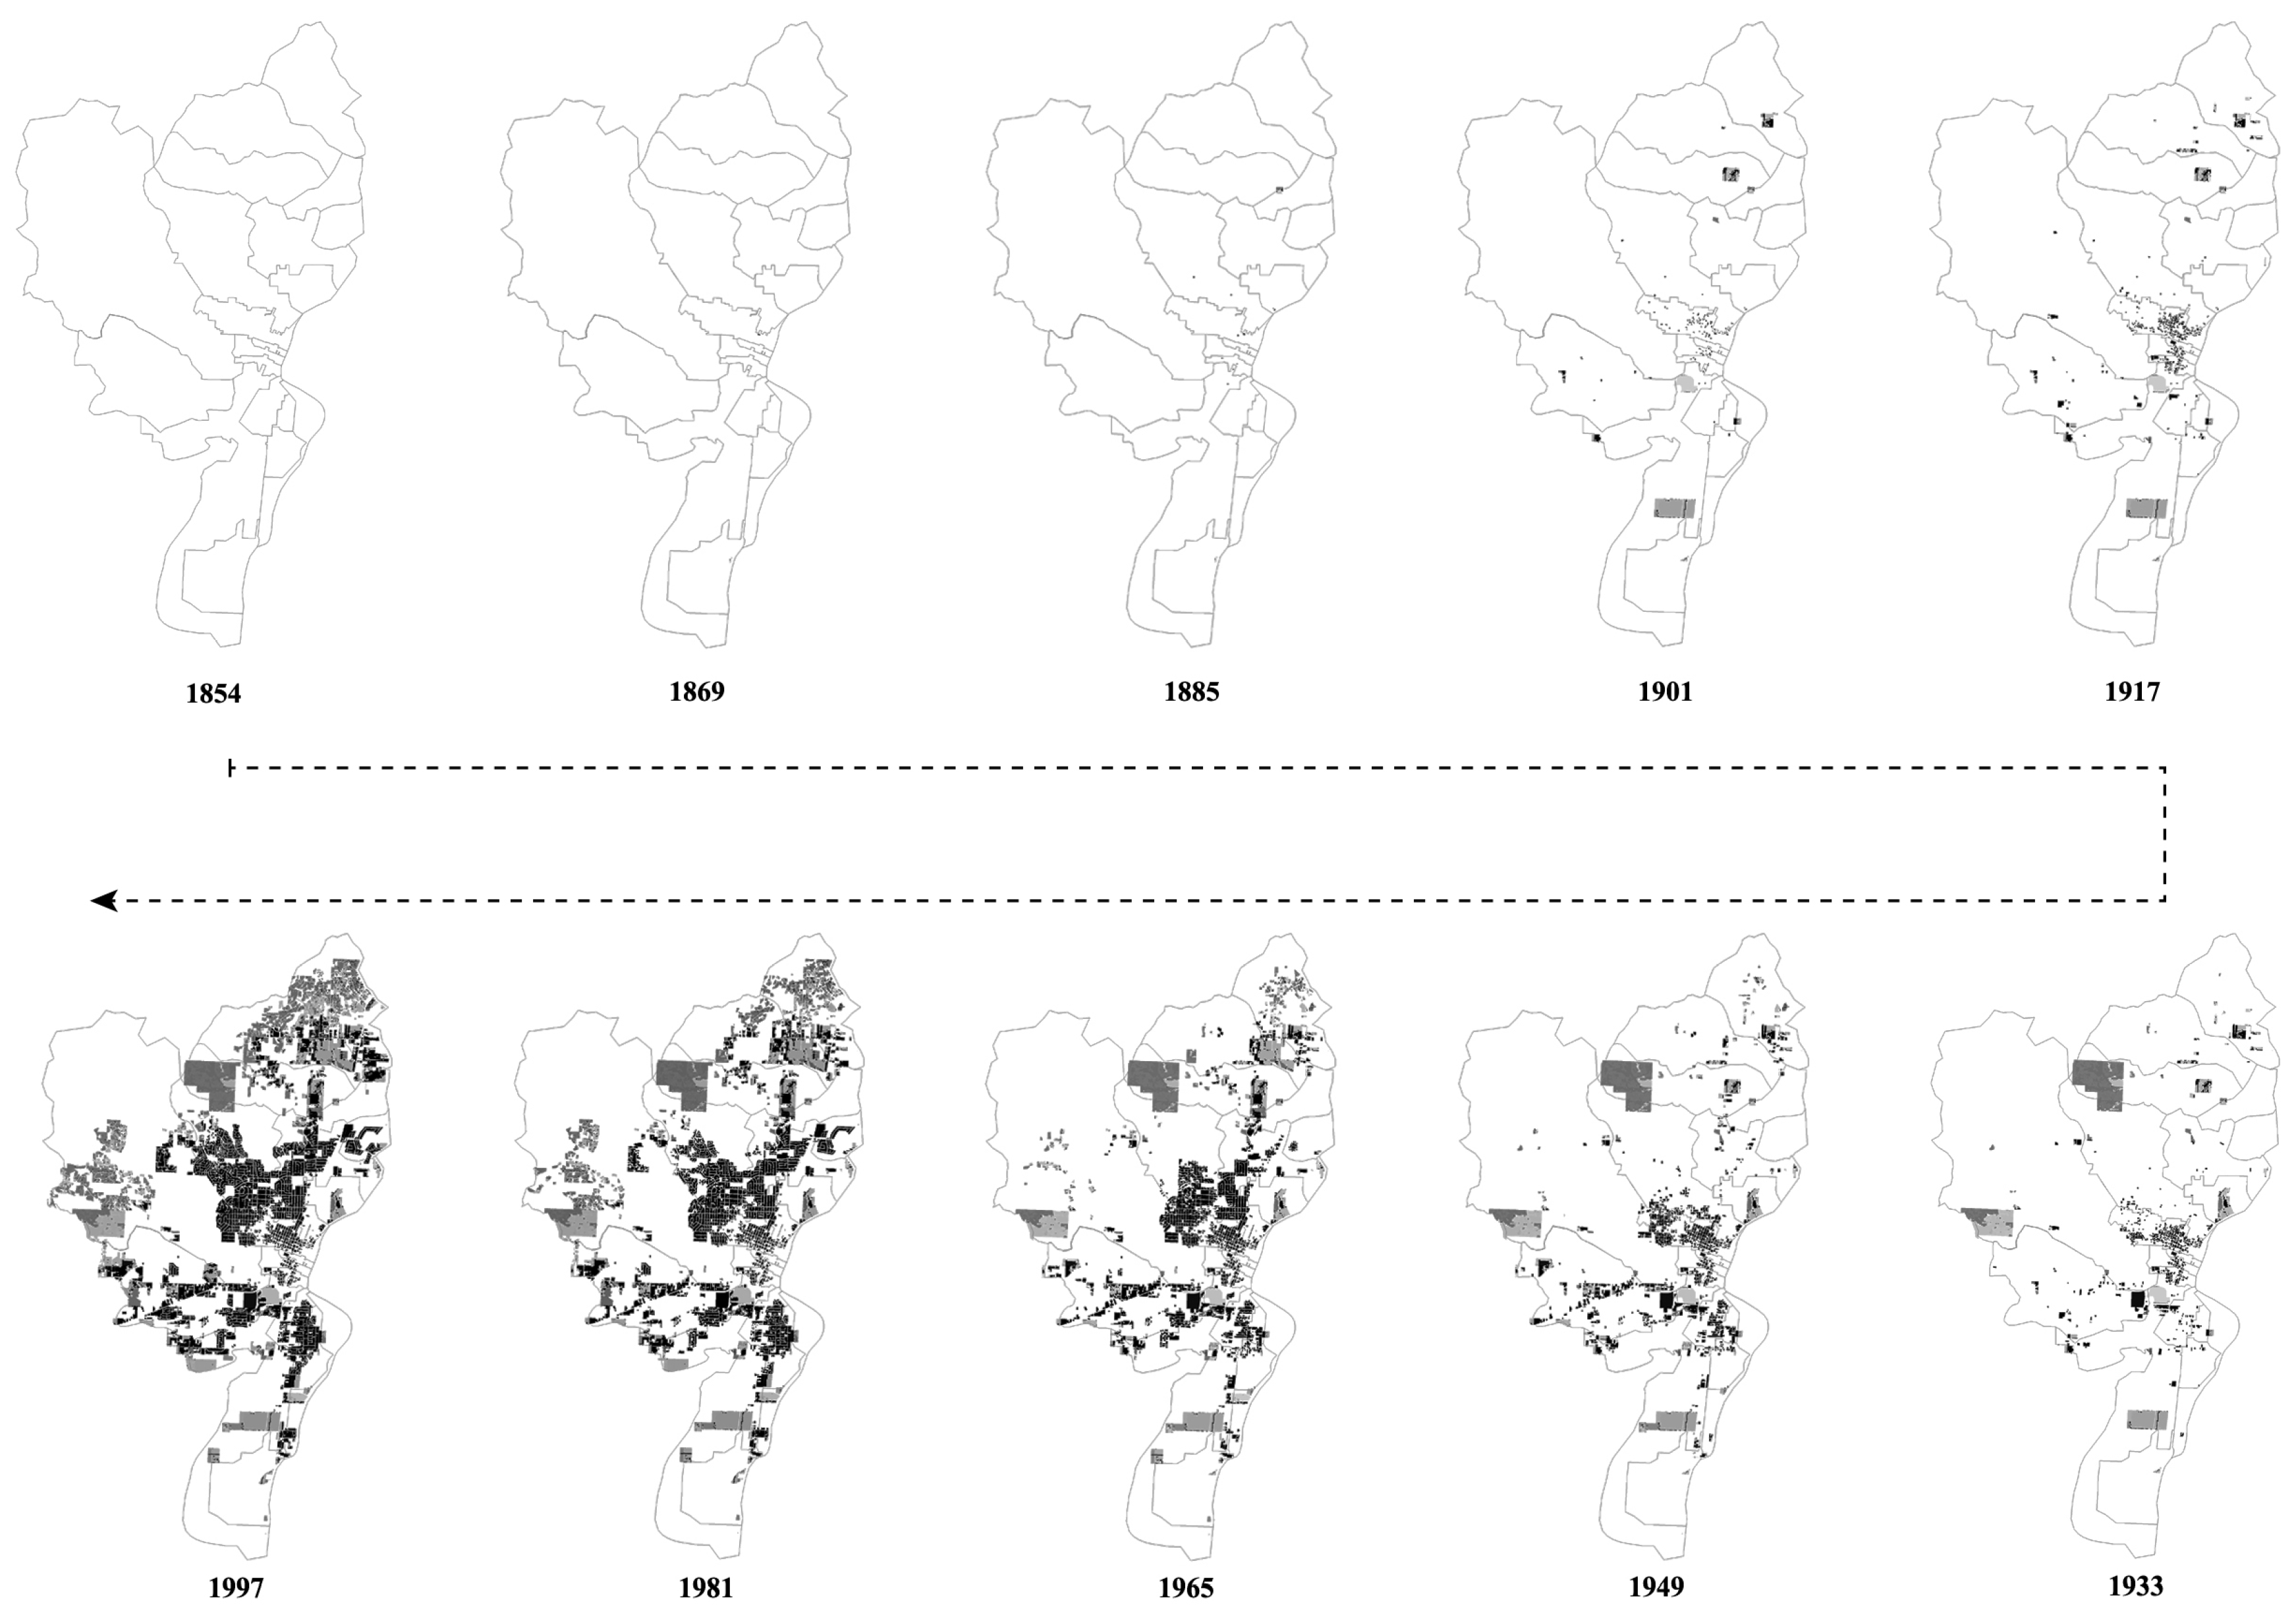
23], this is predicted to result in 3312 kg more nonpoint nitrogen pollution discharge into the urban storm water 1260 kg more nonpoint phosphorous pollution discharge into the urban storm water, and 237,719 Mg carbon storage loss in the terrestrial land. We compared the predicted urbanization’s ecological impact from 1998 to 2020 with it through the city’s historical urbanization process from 1854 to 1997 shown in Figure 2, and the results were listed in Table 3. It is evident that the urbanization rate from 1998 to 2020 is planned to be higher than any previous period in the city’s history. The carbon storage loss rate is projected to be 309 Mg/km2 per year that is slower than the historical average rate (1247 Mg/km2 per year). However, one square kilometer of land developed under urbanization is modelled to export into storm water 4.3 kg nonpoint nitrogen pollution per year and 1.6 kg nonpoint phosphorus pollution per year, both of which are higher than the averages in the city’s history (3.8 kg/km2 per year for nitrogen pollution export and 0.49 kg/km2 per year for phosphorus pollution export). Based on this analysis, the planned Corvallis urban area in 2020 provides more ecosystem service in storing carbon to regulate climate, but the nonpoint storm water pollution is still an issue in 2020 and more green infrastructures are suggested to be implemented in the Comprehensive Plan to purify storm water in the urbanized area. It indicates that there exists ecosystem service trade-offs under the Comprehensive Plan 1998–2020 and the plan performs effectively in enhancing the region’s capacity of storing carbon, but it does not restrain the urbanization’s trend in discharging more nonpoint nitrogen and phosphorus pollution in urban storm water.
Different with previous studies that evaluated the performance of planning strategies and policies through comparing the situation across cities in the same period [50,51], this study analyzed the situation of different historical periods in the same city to rule out the comparison and contrast interfere due to uncontrolled conditional variance from different cities. The results suggest that planning policies and strategies may unintentionally contribute to environmental degradation in one way or another and planners should weigh the ecosystem service trade-offs in making the comprehensive spatial planning.

3.2. Ecological Value Distribution

The ecosystem services provided by the entire drainage basin in purifying storm water nitrogen, purifying storm water phosphorus and storing carbon in 1998 were quantified in InVEST. Based on the quantification result and Equation (1), the ecological value was calculated and summarized by each sub-basin in GIS (Table 4). The combined ecological value of the entire drainage basin in purifying storm water and storing carbon is worth up to 
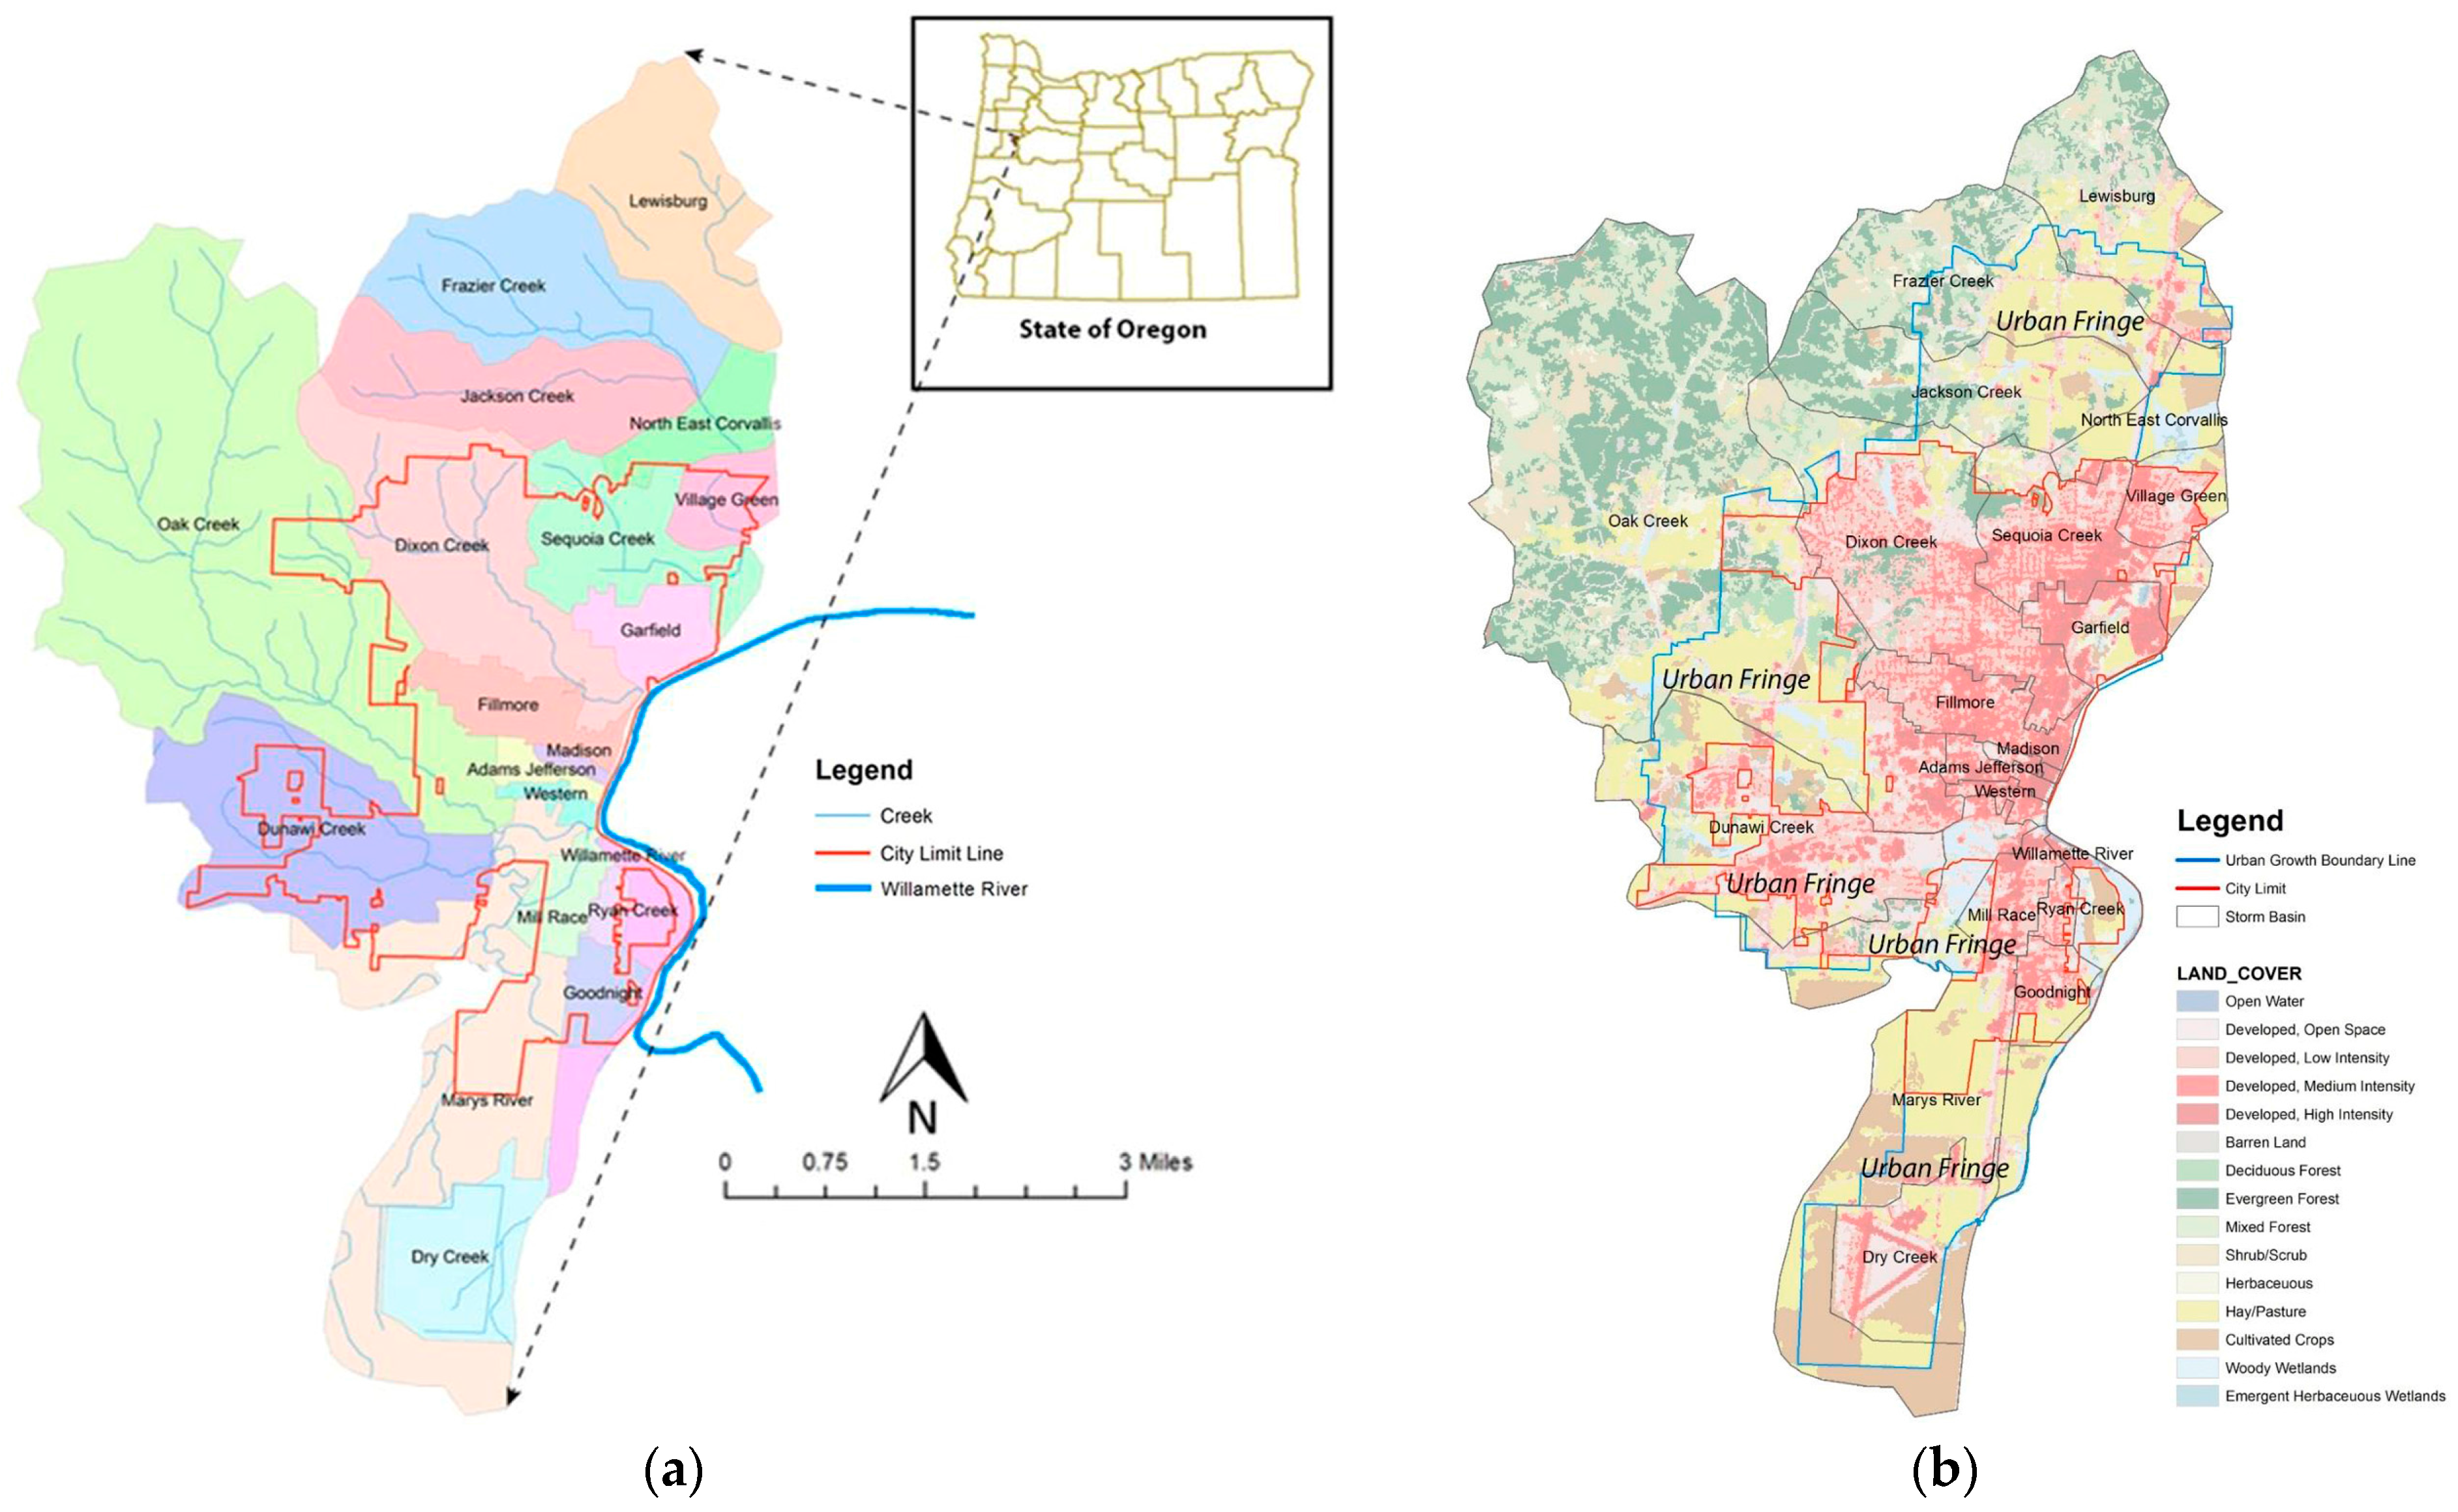
$9 million per year. The sub-basins within the top quartile are Dixon Creek, Lewisburg, Frazier Creek, Oak Creek and Jackson Creek. These are the undeveloped sub-basins located along the northwest edge of the drainage basin (Figure 1a). The sub-basins in the bottom quartile are Fillmore, Garfield, Madison, Western and Adams Jefferson. These five sub-basins intersect with the city’s Downtown area with higher percentage of impervious surface (Figure 1b). This coincides with the finding in previous studies that ecosystem services were offered by the green space with a linear-gradient changing from the urban center to the periphery [52]. The results suggest that the most urbanized watershed has the greatest impact on ecosystem service values. Some basins are smaller in size, but they have higher percentage of impervious pavement, especially within the urban center, and their performance improvements in providing ecosystem services may be larger if low impact development strategies are implemented, such as green roof, pervious pavement and rain garden [53].
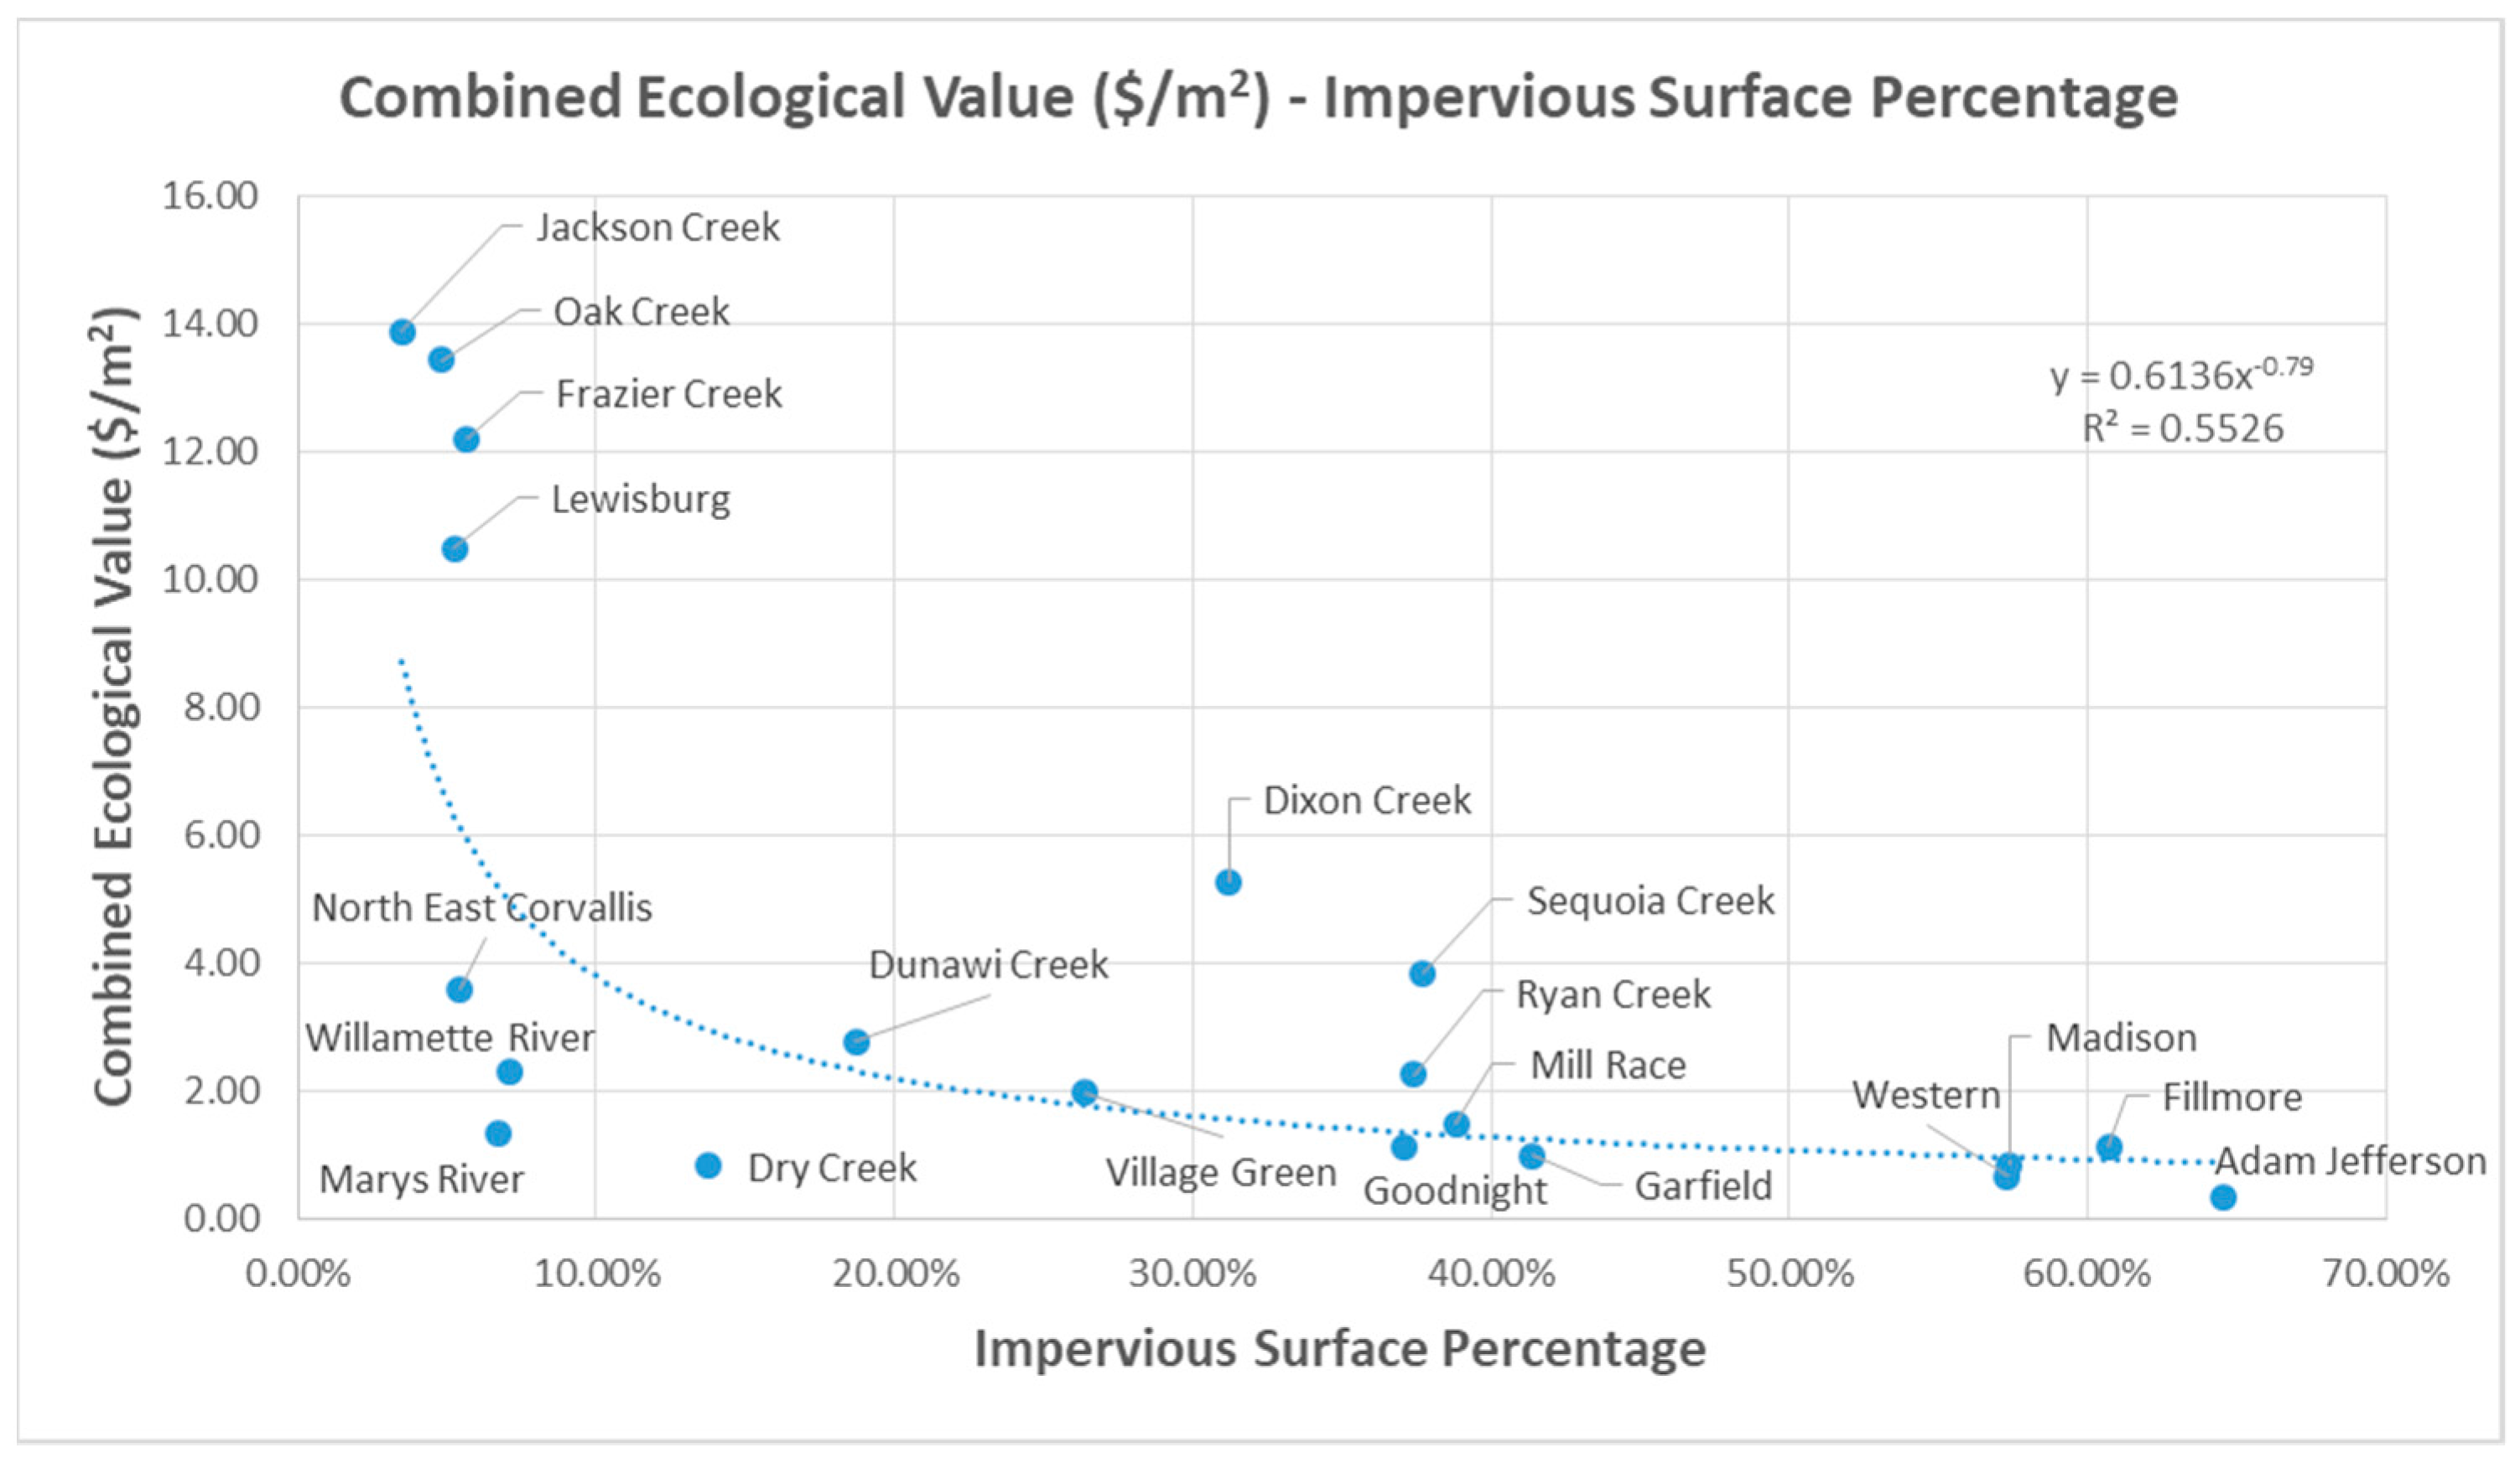
Taking a close-up examination, a strong power regression relationship with the correlation coefficient as 0.74 was established between the impervious surface percentage and the combined ecological value per unit (Figure 4), which confirms that the area with higher impervious surface percentage has more influences on the ecological value estimated on the local level in Corvallis. This also implies that converting the ecosystem service into the combined economic ecological value could be a way to deal with ecosystem services trade-offs [54], and local land owners could lessen urbanization’s ecological impacts by controlling the impervious percentage within their land, even though they may not change environment degradation drivers on the regional scale [55].
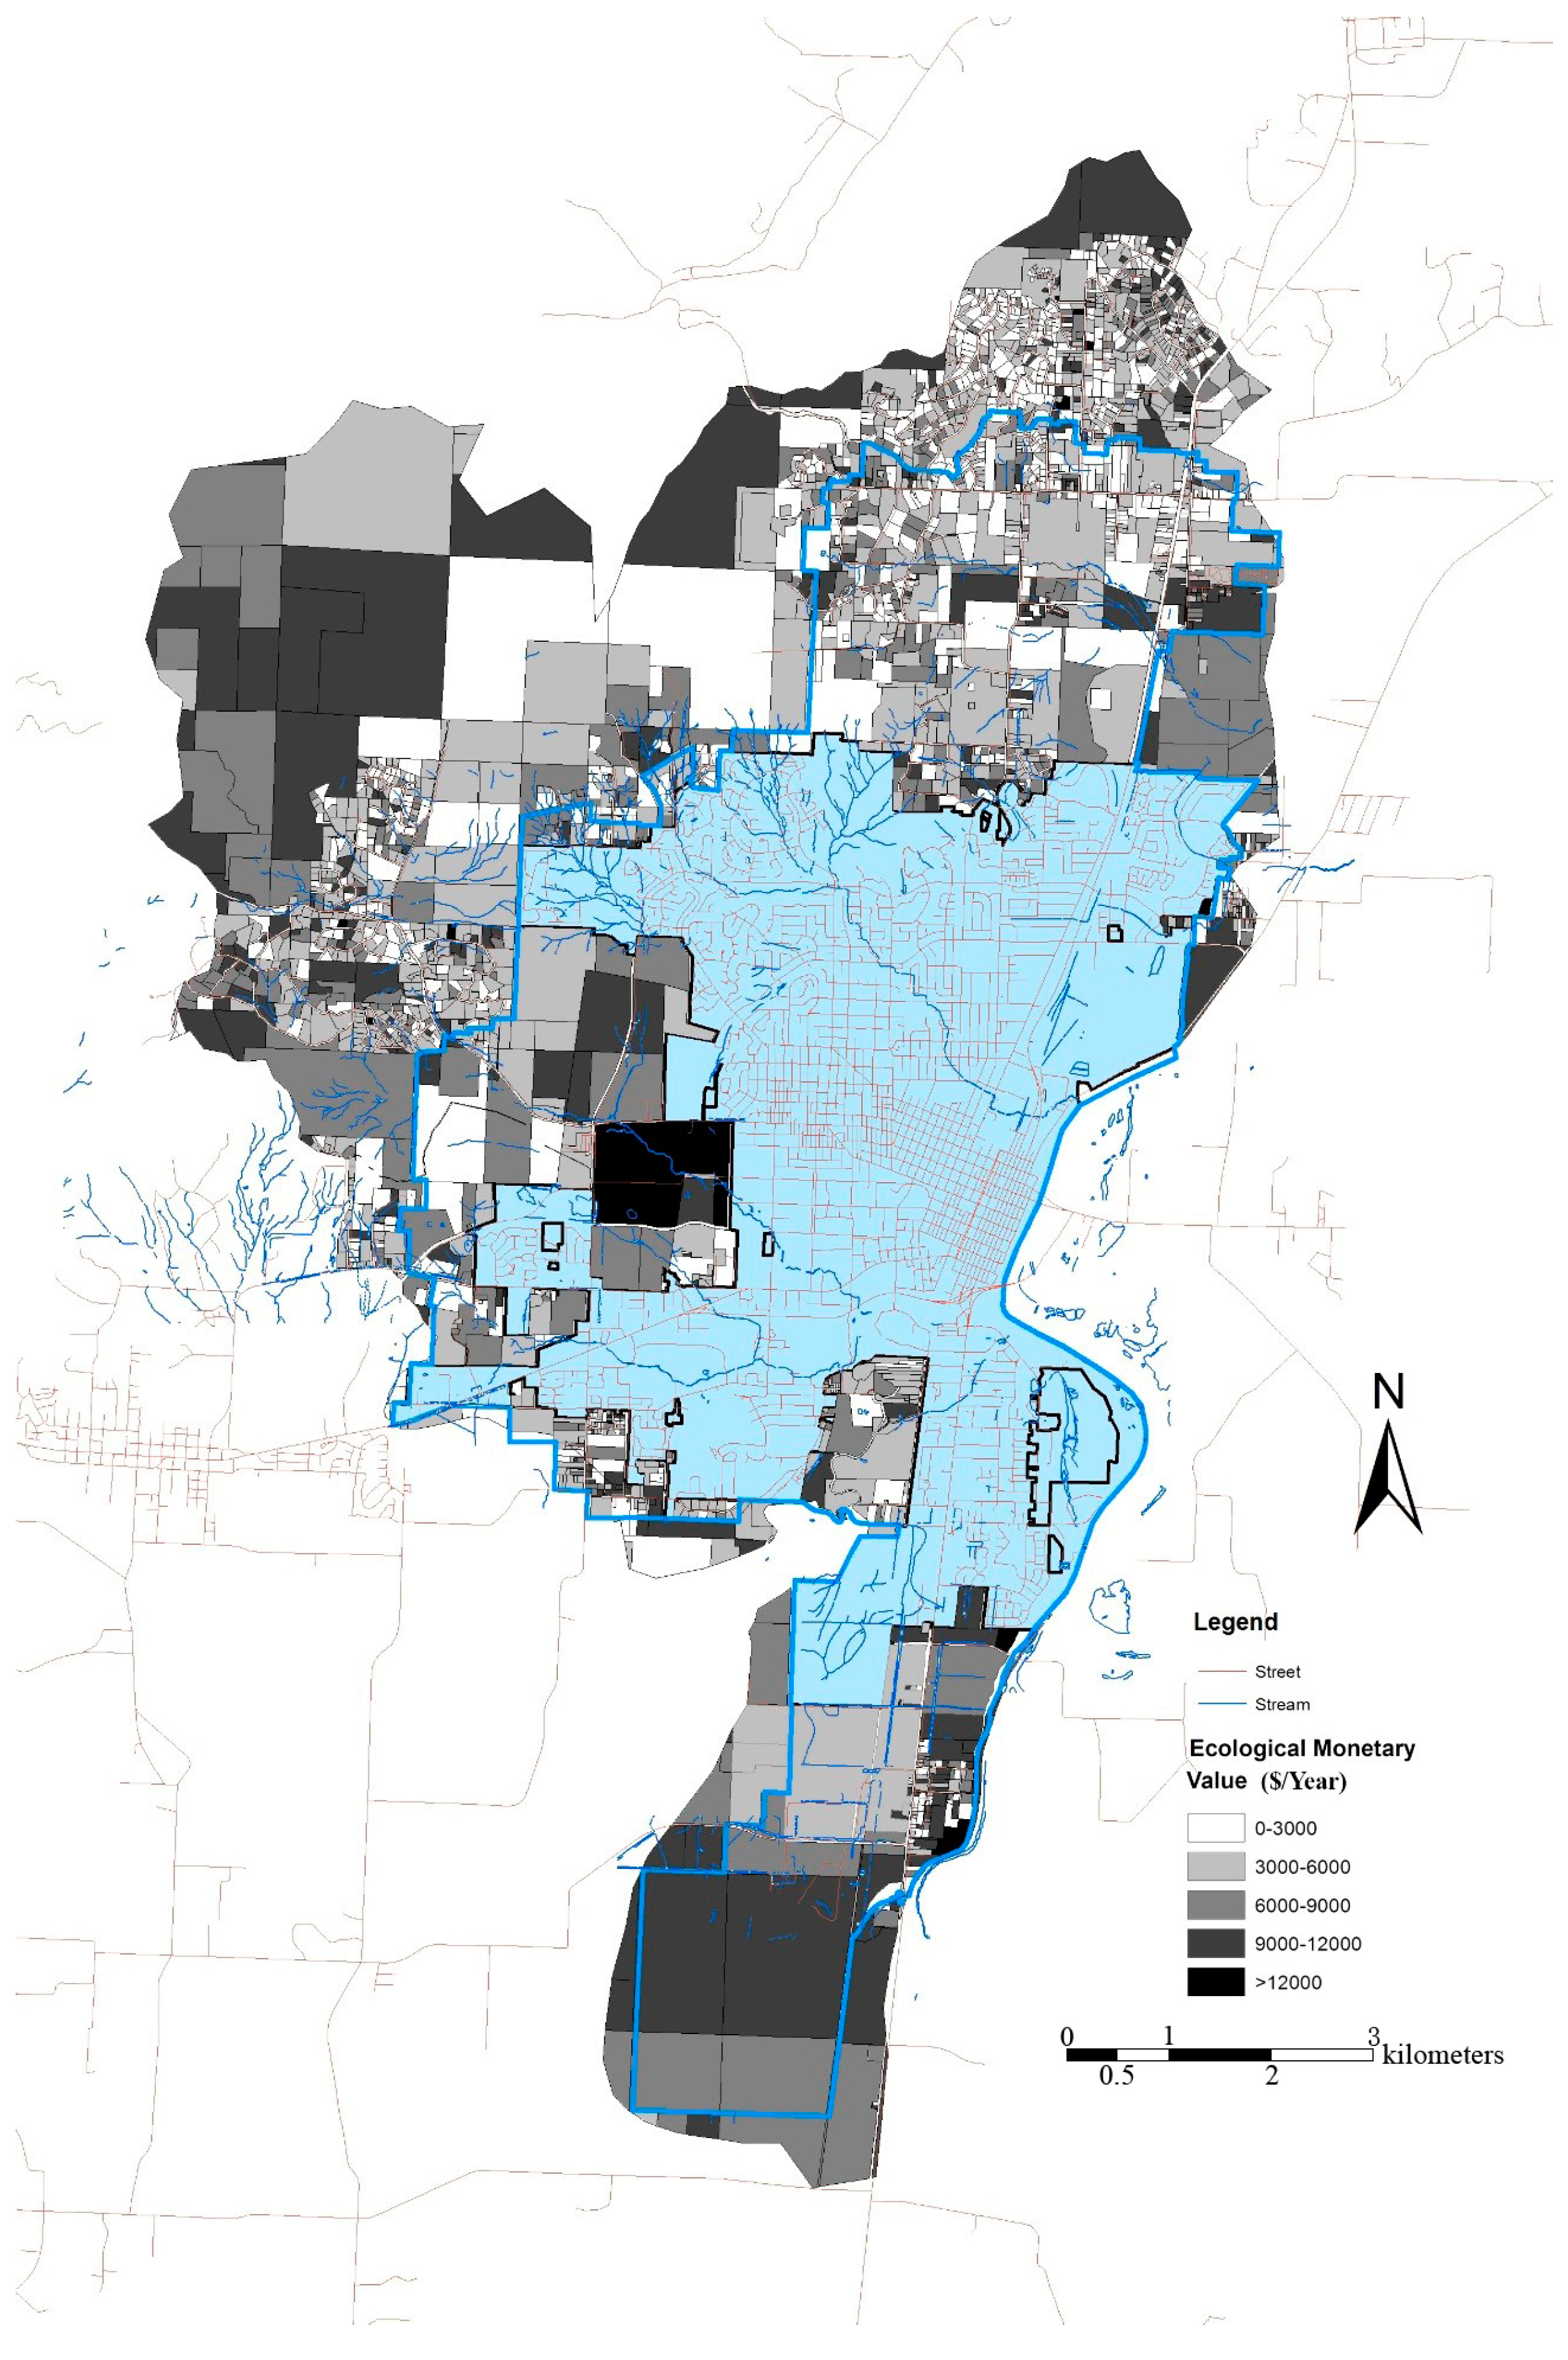
Due to the fact that most urbanization development is planned outside the City Limit from 1998 to 2020 [23], the combined ecological value outside the City Limit was mapped on the parcel level in GIS (
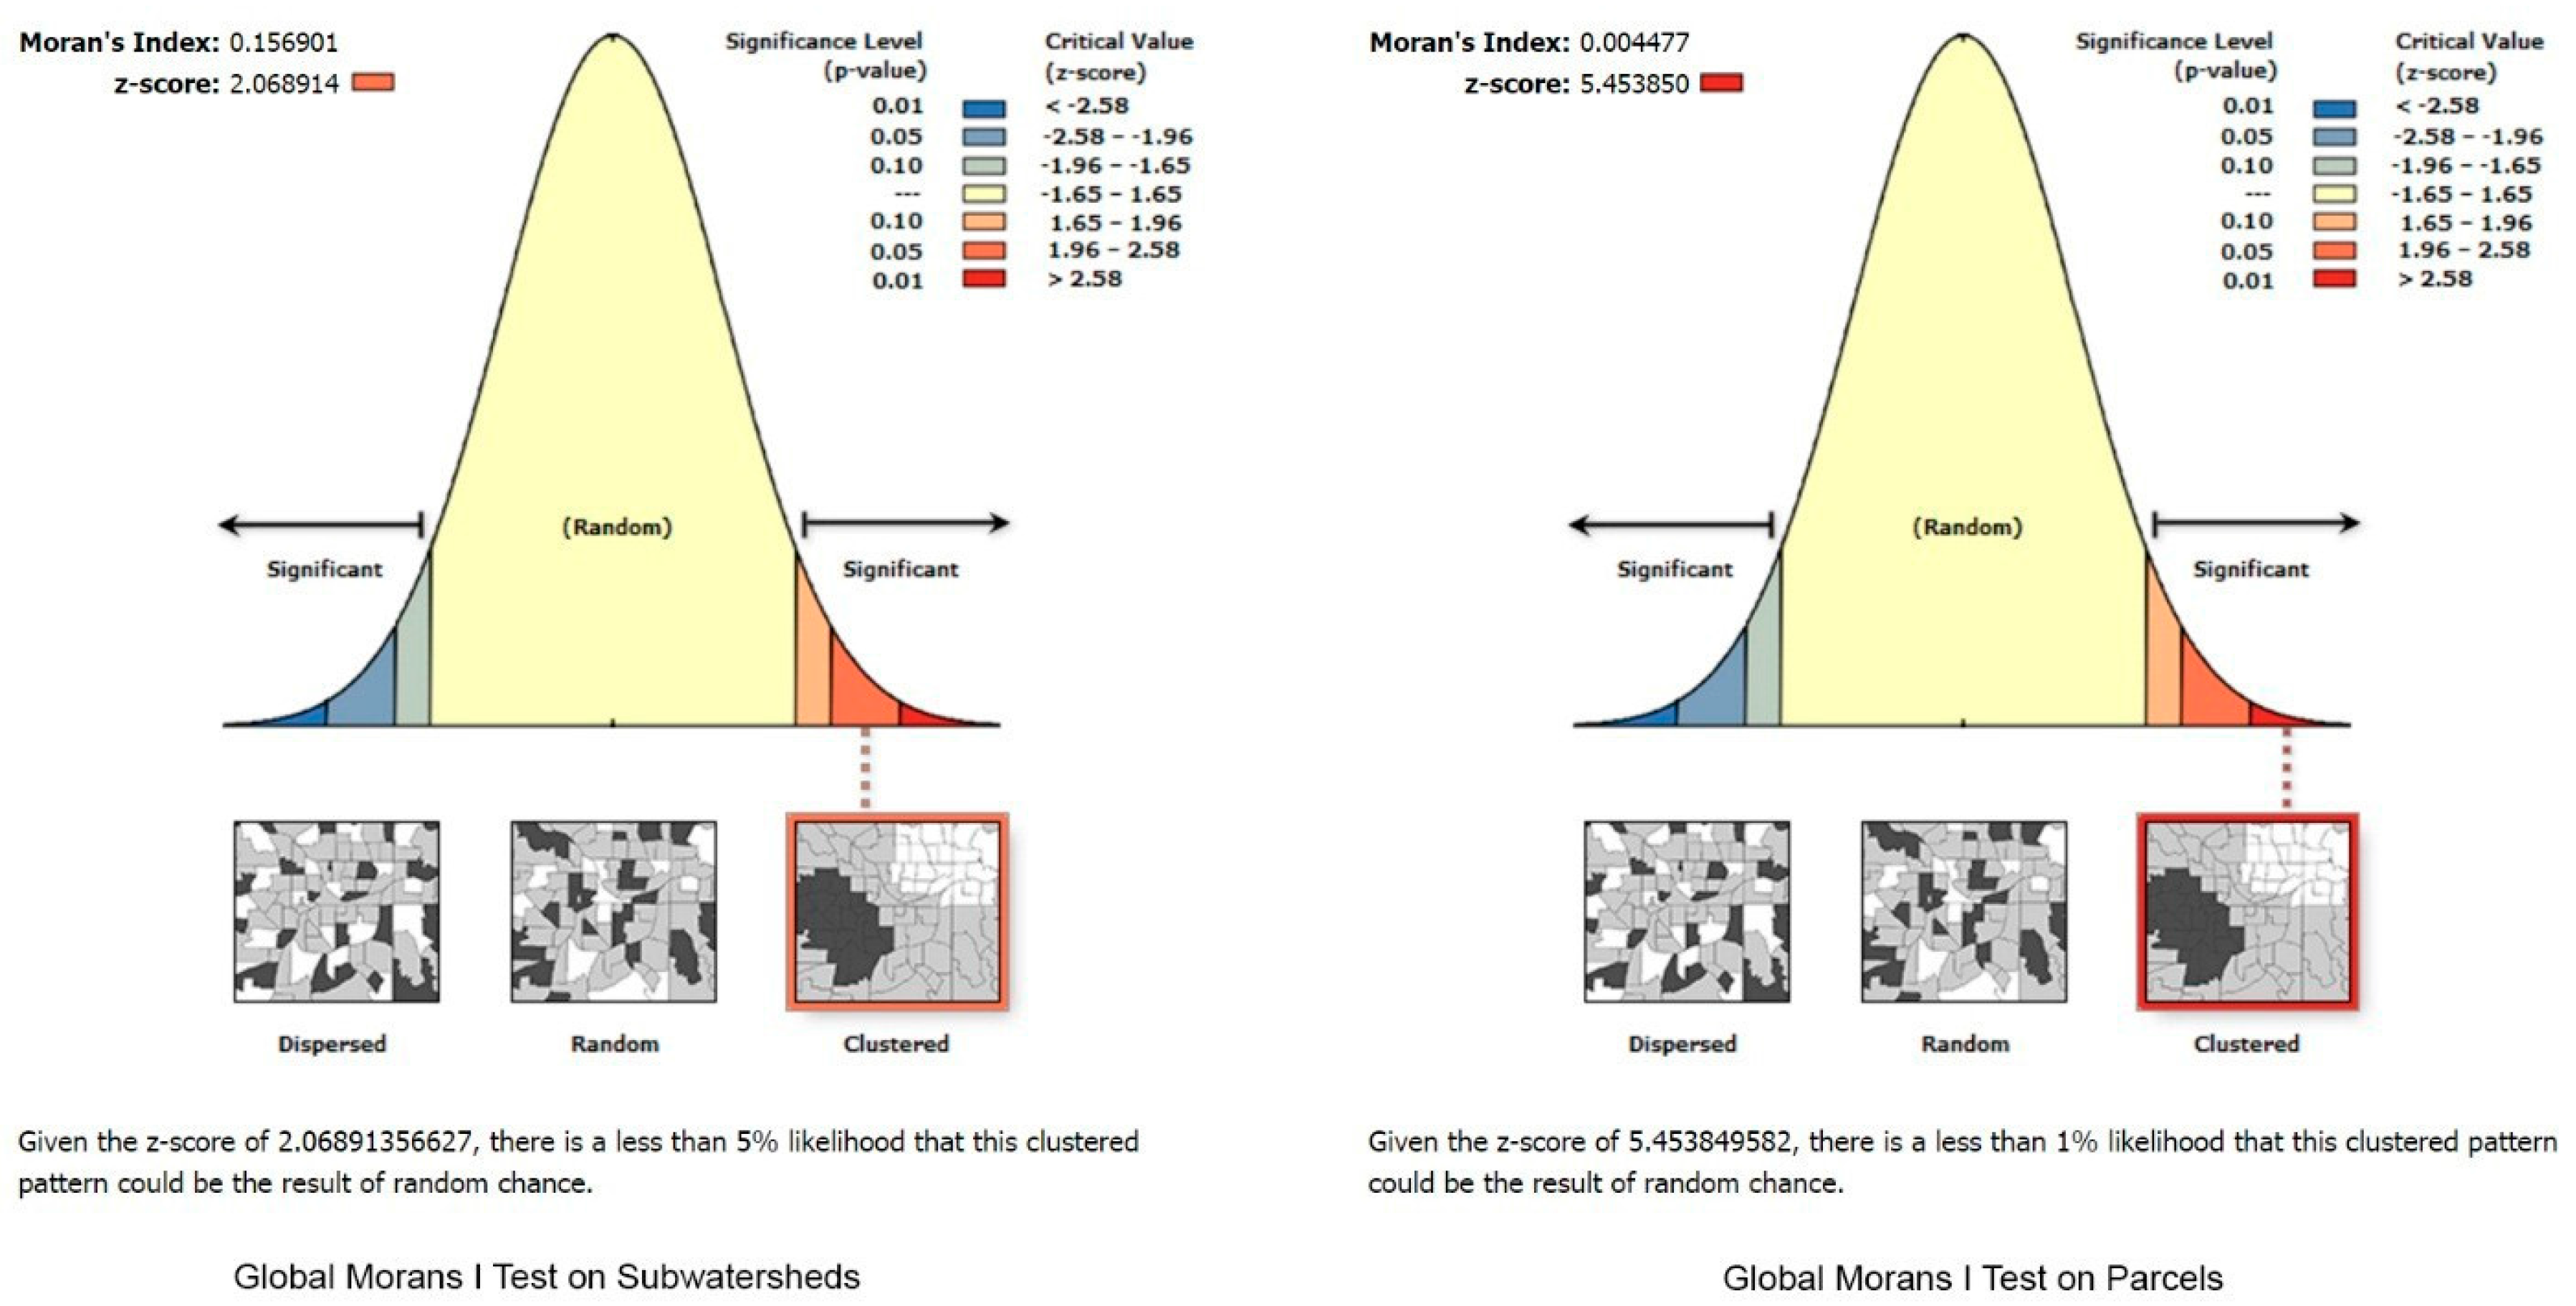
Figure 5). Through the Global Moran’s I test for the combined ecological value distribution, the outcome shows that the z-scores on both the sub-basin level and the parcel level are higher than 1.960, which means that the spatial autocorrelation relationship exists on both local levels (Figure 6). This could be explained by the homogeneity of environmental characteristics across closer spatial patterns [56]. The result shows that the combined ecological value is distributed with assemblage patterns at local scales, which indicates that making the land use plan according to the ecological value distribution patterns is feasible. The z-score on the parcel level is higher than it on the sub-basin level, which means the distribution assemblage pattern on the parcel level is clearer than it is on the sub-basin level. This suggests to probe the land use planning with the goal to preserve more ecological values using the parcel land as the unit of analysis. Therefore the combined ecological value mapping on the parcel level (Figure 5) was utilized to identify priority lands for future land uses to conserve more ecological values in the process of urbanization.

3.3. Priority Lands Identification for Land Uses

According to Corvallis Comprehensive Plan 1998–2020, 31 km2 natural land is planned to be urbanized into 11 urban land use classes outside the City Limit to meet the city’s future development demands. This study set up the assumption that the same land use area is developed with the same percentage of impervious surface as it was in 1998. 
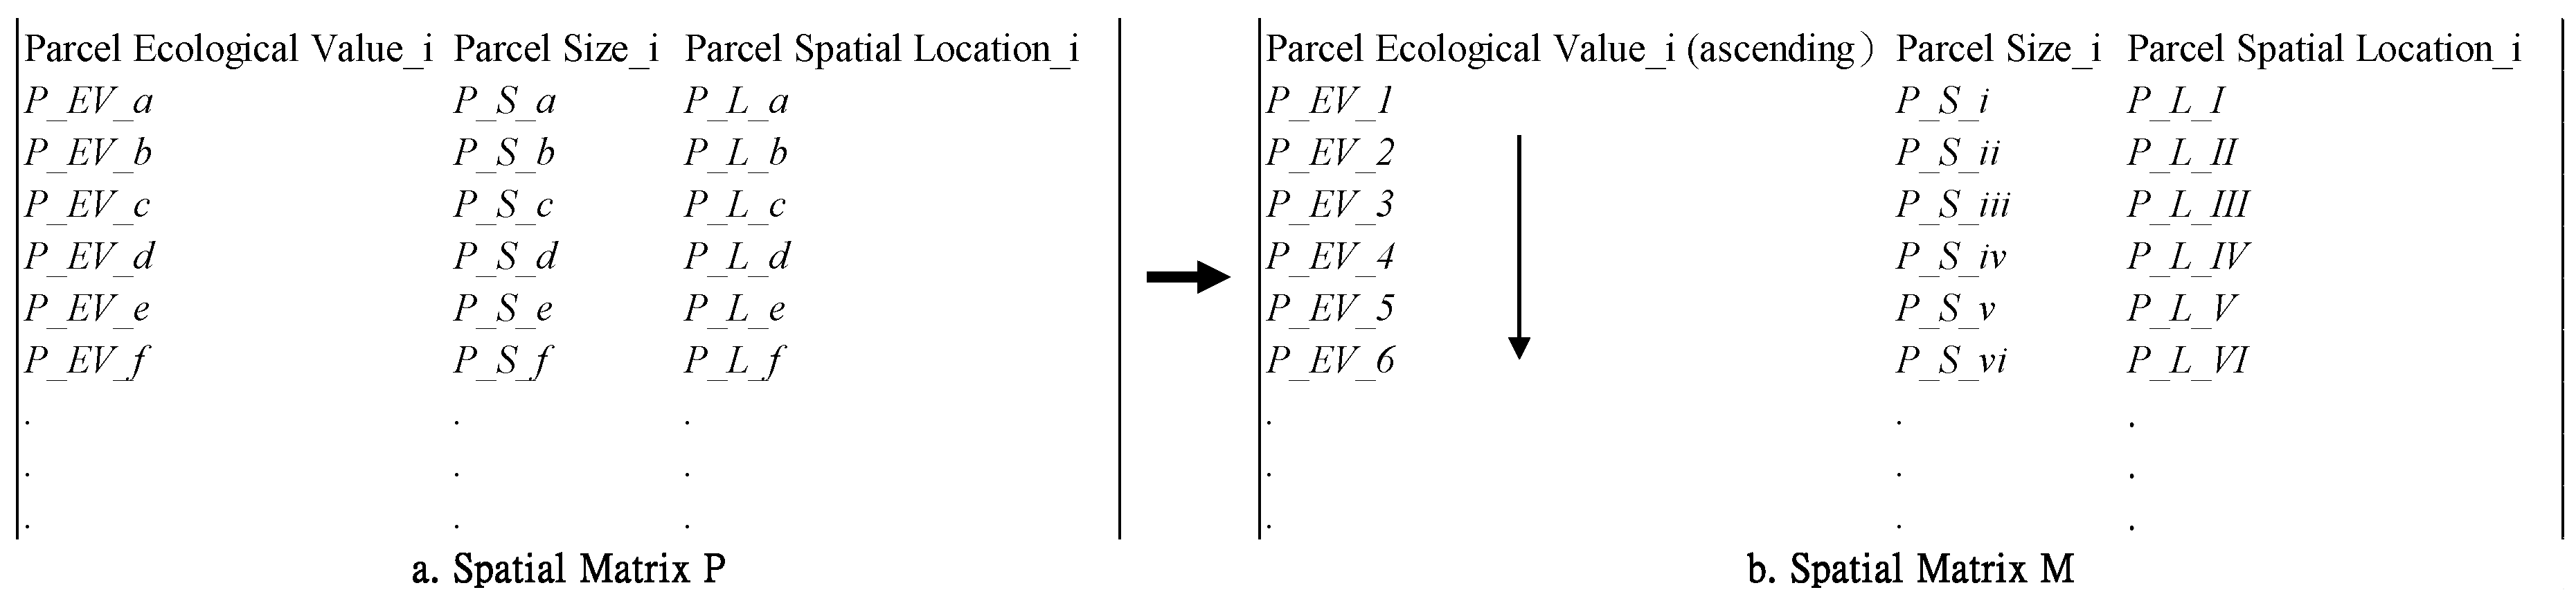
Table 5 summarizes the land use classes to develop, the demanded size and the percentage of impervious surface in each land use category. We identified priority lands for land uses pattern delineation with the goal to accommodate these 11 land use classes as planned to develop and conserve most combined ecological value. The priority lands were identified for each land use zoning grounded on the environmental planning principle that the lands with lower ecological value should be zoned for the land use class impacting more on the ecological value and the lands of higher ecological value should be prevented from urbanization. As discussed in previous sections, the power correlation relationship confirms that the land use class with high impervious surface percentage results in less combined ecological value left in Corvallis. Based on the ecological value map (Figure 5), the Spatial Matrix M described in Figure 3, Equation (2), Equation (3) and the environmental planning principle, priority parcels for each future land use class was zoned in GIS. Corvallis is predicted to need 438,296 m2 of land urbanized for the commercial use and the commercial land use category has the highest percentage of impervious surface. Therefore, the first group of parcels with the accumulating size over 438,296 m2 in the combined ecological value low to high ranking matrix is zoned as commercial land use. Following the order to be zoned (
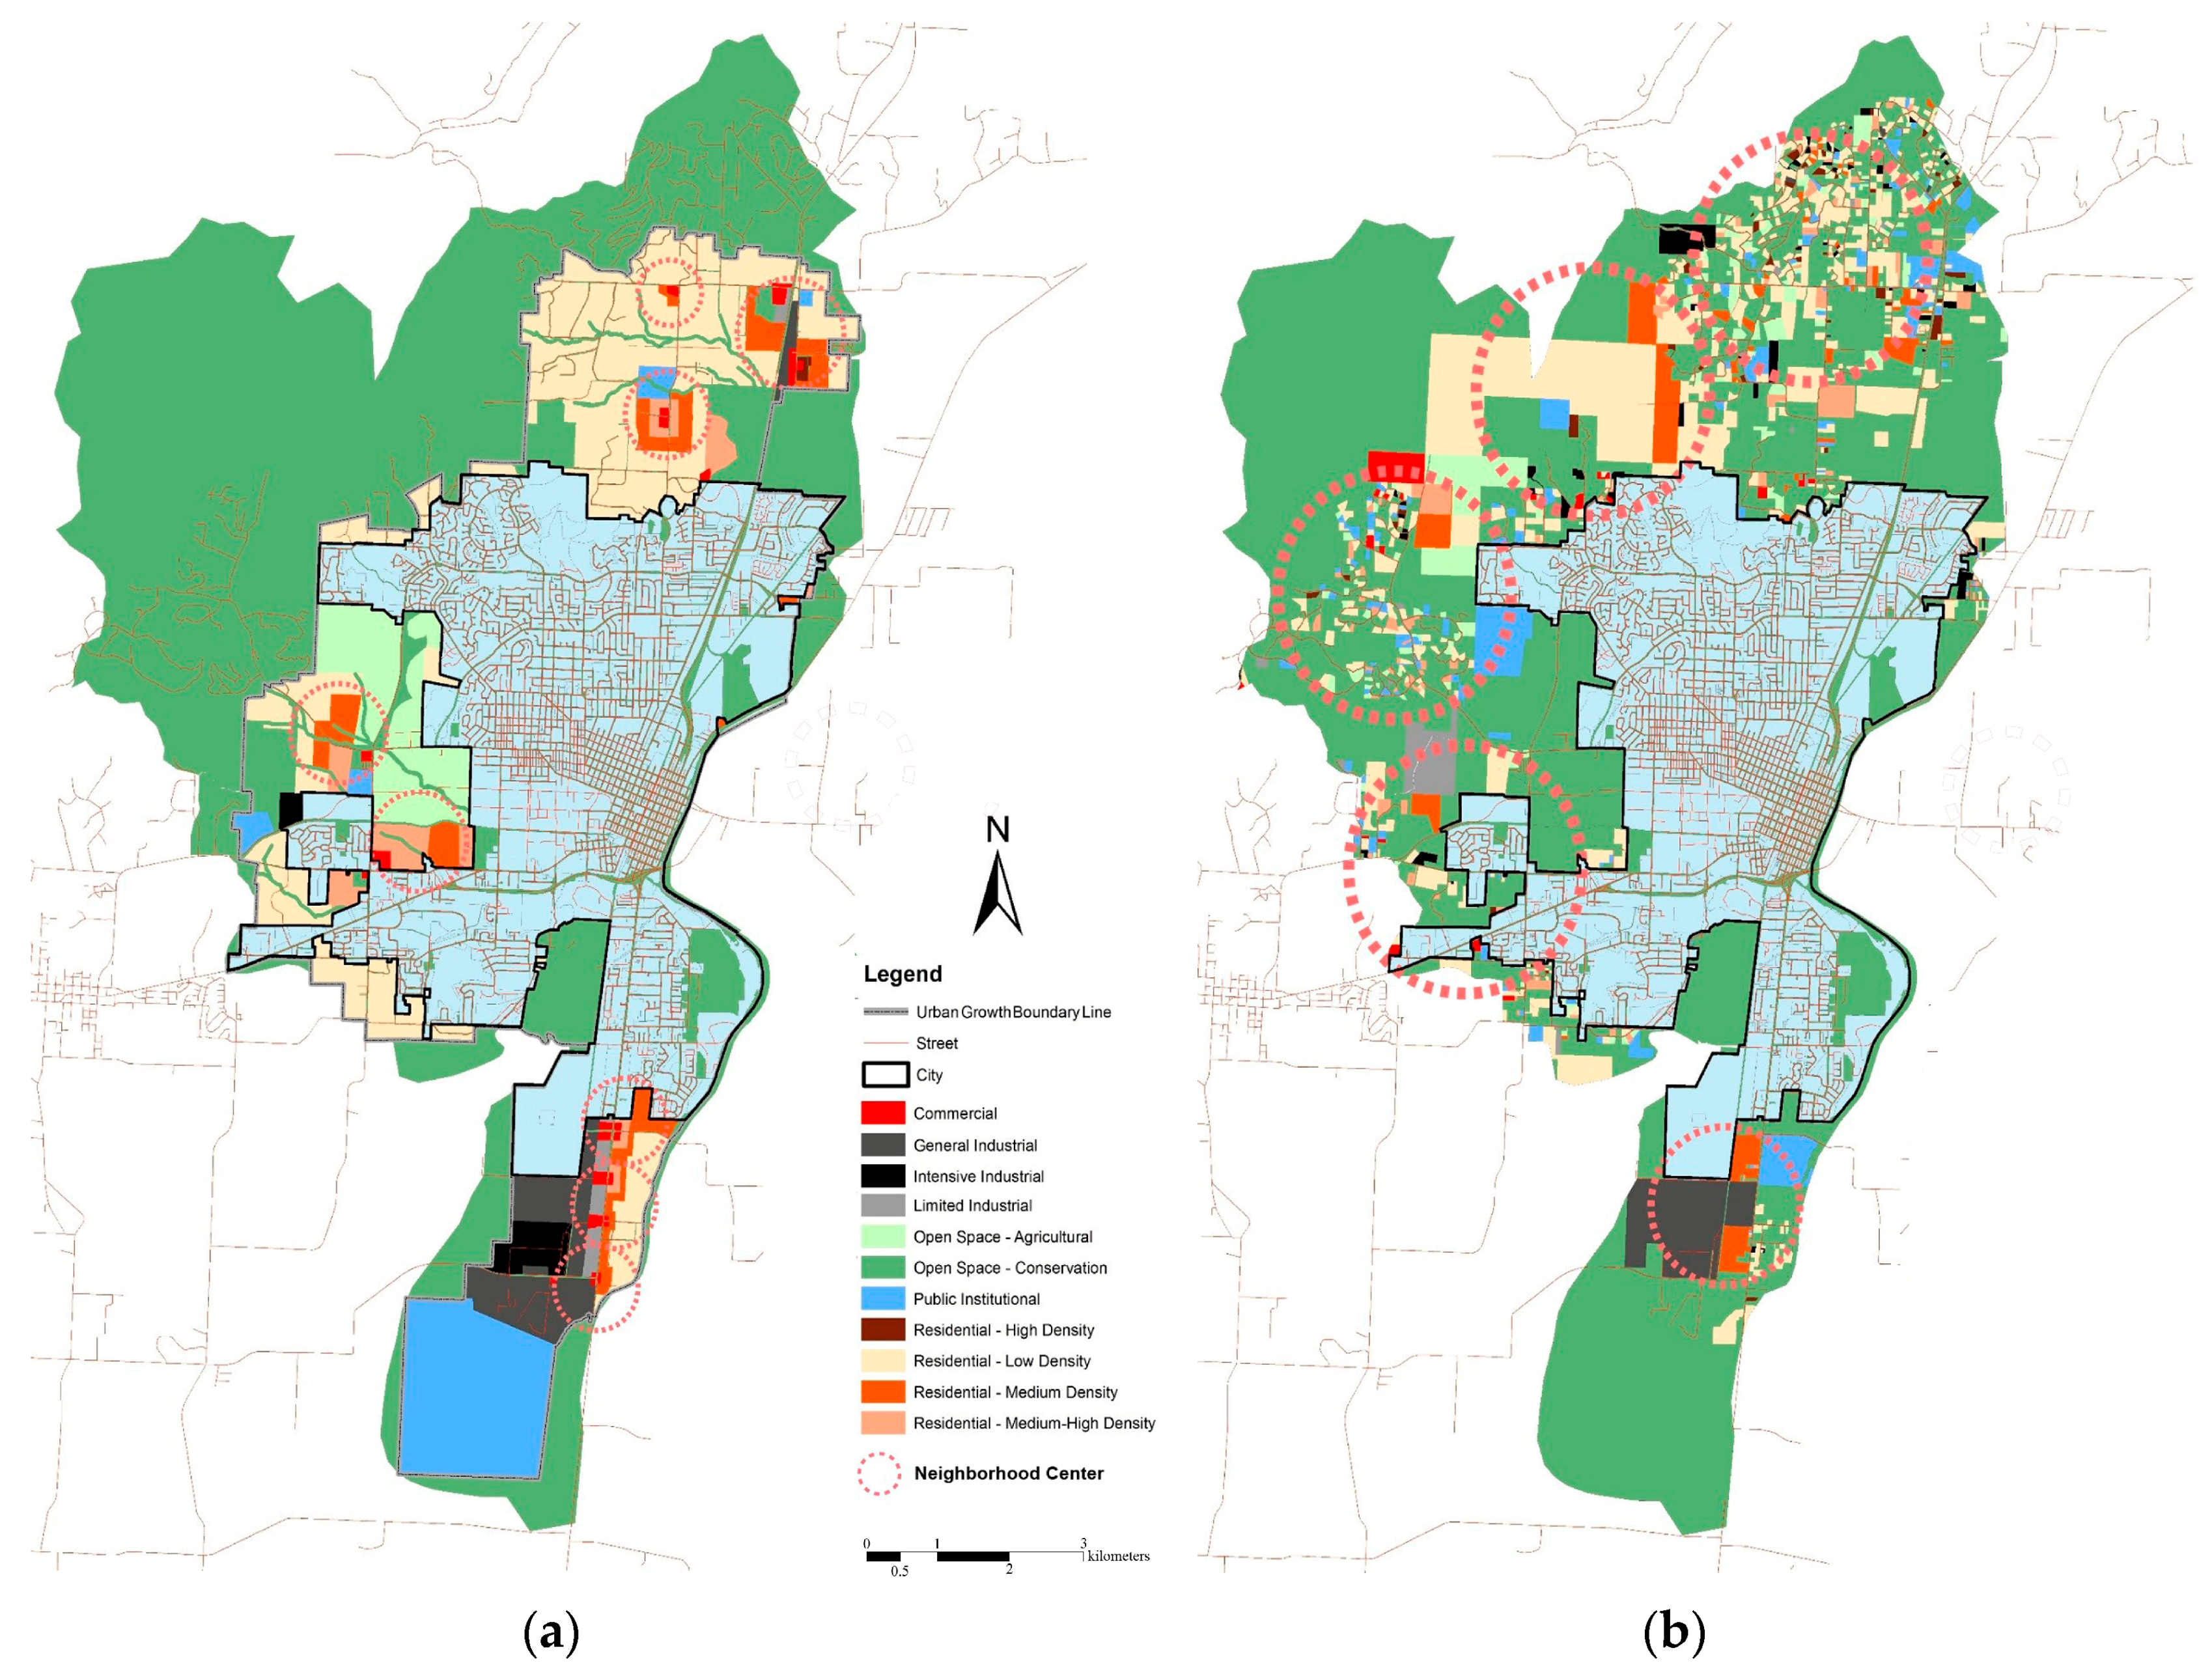
Table 5) and the same step, all the other ten land use patterns are delineated on the map (Figure 7).
As the result, in the proposed land use plan, all parcels with the combined ecological value higher than $6000 per year and more than half of parcels with the combined ecological value between $3000 to $6000 per year are preserved from urbanization (Table 6). In comparison with Corvallis Comprehensive Plan 1988–2020 featured with compact development hubs close to the City Limit, the new land uses plan proposes five bigger mixed-use urban centers spreading outside the City Limit. Similar with the Comprehensive Plan, industrial areas are mainly planned next to the south edge of the City Limit. But differently, commercial areas, various residential types, public institutions are spreading outside the City Limit across the north and west part of the drainage basin.
We also quantified the ecosystem services provided by the conserved parcels under the Corvallis Comprehensive Plan 1988–2020 and the proposed land uses plan. Previous studies claim that compact development leads to less ecological impacts than the spreading development due to the understanding that compact development restrains urbanization within certain area and conserves more natural resources [57,58,59], but our results show that the entire drainage basin under the proposed land use plan featured by spreading mixed-use developments stores nearly 20% more carbon and retains over 100% more storm water nonpoint nitrogen, 270% more storm water nonpoint phosphorus than it under the Comprehensive Plan featured by compact development close the City Limit (Table 7). This could be explained by the finding that compact developments have more severe impacts on the local biodiversity even though it is restrained in certain areas and conserve more natural lands untouched [60].
It is undoubtable that spreading mixed-use developments in the proposed land use plan would require more investment in urban infrastructures construction (e.g., expansion of power facilities, drainage systems and streets) [61]. Also, the spreading urban development far away from the urban center would disturb wildlife habitat and result in biodiversity loss [62], and generate more commuting CO2 emissions as well [63]. Therefore, the land use plan generated in this study could not have been the most practical urbanization plan for the city to implement at this stage. However, as indicated in previous studies, the preserved natural lands distributing among the spreading urbanization play the role of stepping stones to strengthen the regional biodiversity and provide residents more recreational accessibilities to nature [64]. Moreover, the spread of urban development appears to be more able to reduce traffic congestion than the compact development [65]. Preserving the stepping stone natural lands to enhance landscape connectivity and developing public transportation to reduce commuting travel miles might complement the proposed spreading mixed-use developments.

4. Conclusions

Through altering natural lands to urban built-up areas, urbanization has been threatening our environmental quality in multiple dimensions. The comprehensive plan has been implemented in urban growth management and natural resources conservation in some cities. Enacting locally appropriate land uses planning requires a full consideration of various ecological variables, social variables and economic variables. As suggested by previous studies, the ecosystem service framework is an effective tool to analyze and pursue sustainability and urban planners practice an important role in guaranteeing the public welfare gained from ecosystem in managing cities’ urbanization process [66]. However, the lack of methods and data has been the challenge to apply ecosystem service analysis in the field of urban spatial planning [67]. This study proposed a new approach that consists of ecosystem service valuation mapping and land uses zoning in the spatial matrix to evaluate the comprehensive plan and identify priority lands for future land uses to conserve more ecosystem services. Using the city of Corvallis, OR, as the test-bed, the land uses plan developed by the new approach accommodates the city’s future urbanization and conserves more ecological values. This research contributed to land use planning strategies using scientific analysis and the sprawl vs. anti-sprawl debate [68] by demonstrating that if planed with scientific analysis and evidence, the urban spreading development does not necessarily result in more environmental degradation than the recommended compact development in “smart growth” [69].
This study can be improved in several ways. For example, more categories of ecosystem service beyond carbon storage and storm water purification should be measured, such as landscape connectivity, species biodiversity and air purification and so on. The combined ecological value estimation could be more accurate and applicable with more localized site-specific data (for example, local residents’ willing to pay for the ecosystem service [70]). The trade-offs in the spreading development generated by this land use planning approach and its application in practice should be explored with more evidence and analysis. All of these limitations or issues call for future research. Besides, the low impacts development strategies, such as green roofs, pervious pavements and rain gardens, have been widely proven to be effective in providing ecosystem services in the built-up environment [71,72]. Coupled with the preservation of parcels with high ecological values from urbanization, how to implement low impact development strategies in parcels zoned for future urbanization to make the sustainable land use plan more comprehensive calls for further research as well.

Acknowledgments

The research on this paper is funded by the University of Oklahoma Robberson Research Grants, Chinese National Social Science Foundation (No. 51708399 and No. 51408265), Macao Foundation (MF1710).

Author Contributions

Zhou L. provided the initial concept, research design, data collection, analysis approach and wrote the manuscript. Woodfin T., Wu Y. and Zhu R. helped revise the manuscript. Woodfin T. improved the English. All authors read and approved the final manuscript.

Conflicts of Interest

The authors declare no conflict of interest.

References

  1. United Nations. World Urbanization Prospects: The 2014 Revision Highlights; United Nations: New York, NY, USA, 2014; pp. 3–7. ISBN 978-92-1-151517-6. [Google Scholar]
  2. Martin-Mikle, C.J.; de Beurs, K.M.; Julian, J.P.; Mayer, P.M. Identifying priority sites for low impact development (LID) in a mixed-use watershed. Landsc. Urban Plan. 2015, 140, 29–41. [Google Scholar] [CrossRef]
  3. United Nations Population Fund. Urbanization. Available online: http://www.unfpa.org/urbanization (accessed on 16 August 2017).
  4. Hogan, D.M.; Walbridge, M.R. Urbanization and nutrient retention in freshwater riparian wetlands. Ecol. Appl. 2007, 17, 1142–1155. [Google Scholar] [CrossRef] [PubMed]
  5. Loucaides, S.; Cahoon, L.B.; Henry, E.J. Effects of watershed impervious cover on dissolved silica loading in storm flow. J. Am. Water Resour. Assoc. 2007, 43, 841–849. [Google Scholar] [CrossRef]
  6. Liyanage, C.P.; Yamada, K. Impact of Population Growth on the Water Quality of Natural Water Bodies. Sustainability 2017, 9, 1405. [Google Scholar] [CrossRef]
  7. Conte, M.; Nelson, E.; Carney, K.; Fissore, C.; Olwero, N.; Plantinga, A.J.; Stanley, B.; Ricketts, T. Terrestrial carbon sequestration and storage. In Natural Capital: Theory & Practice of Mapping Ecosystem Services; Kareiva, P., Tallis, H., Ricketts, T.H., Daily, G.C., Polasky, S., Eds.; Oxford University Press: New York, NY, USA, 2011; pp. 111–128. ISBN 978-0-19-958899-2. [Google Scholar]
  8. Nelson, A.C.; Moore, T. Assessing urban-growth management—The case of Portland, Oregon, the USAS largest urban-growth boundary. Land Use Policy 1993, 10, 293–302. [Google Scholar] [CrossRef]
  9. Slaev, A.D.; Nedovic-Budic, Z. The Challenges of Implementing Sustainable Development: The Case of Sofia’s Master Plan. Sustainability 2017, 9, 15. [Google Scholar] [CrossRef]
  10. Artmann, M.; Bastian, O.; Grunewald, K. Using the Concepts of Green Infrastructure and Ecosystem Services to Specify Leitbilder for Compact and Green Cities—The Example of the Landscape Plan of Dresden (Germany). Sustainability 2017, 9, 198. [Google Scholar] [CrossRef]
  11. Andersen, C.T.; Foster, I.D.L.; Pratt, C.J. The role of urban surfaces (permeable pavements) in regulating drainage and evaporation: Development of a laboratory simulation experiment. Hydrol. Process. 1999, 13, 597–609. [Google Scholar] [CrossRef]
  12. Choi, H.S.; Lee, G.S. Planning Support Systems (PSS)-Based Spatial Plan Alternatives and Environmental Assessment. Sustainability 2016, 8, 286. [Google Scholar] [CrossRef]
  13. Wu, Y.Z.; Fan, P.L.; Li, B.; Ouyang, Z.T.; Liu, Y.; You, H.Y. The Effectiveness of Planning Control on Urban Growth: Evidence from Hangzhou, China. Sustainability 2017, 9, 855. [Google Scholar] [CrossRef]
  14. Millennium Ecosystem Assessment. Ecosystems and Human Well-Being. Available online: https://www.millenniumassessment.org/documents/document.356.aspx.pdf (accessed on 16 May 2017).
  15. Zhang, L.Q.; Peng, J.; Liu, Y.X.; Wu, J.S. Coupling ecosystem services supply and human ecological demand to identify landscape ecological security pattern: A case study in Beijing–Tianjin–Hebei region, China. Urban Ecosyst. 2017, 20, 701–714. [Google Scholar] [CrossRef]
  16. Mitsova, D.; Shuster, W.; Wang, X.H. A cellular automata model of land cover change to integrate urban growth with open space conservation. Landsc. Urban Plan. 2011, 99, 141–153. [Google Scholar] [CrossRef]
  17. Celio, E.; Ott, M.; Sirén, E.; Grêt-Regamey, A. A prototypical tool for normative landscape scenario development and the analysis of actors’ policy preferences. Landsc. Urban Plan. 2015, 137, 40–53. [Google Scholar] [CrossRef]
  18. Xun, B.; Yu, D.Y.; Wang, X. Prioritizing habitat conservation outside protected areas in rapidly urbanizing landscapes: A patch network approach. Landsc. Urban Plan. 2017, 157, 532–541. [Google Scholar] [CrossRef]
  19. Corvallis OR. NPDES Phase II Storm Water Management Program Plan. 2007. Available online: http://www.corvallisoregon.gov/modules/showdocument.aspx?documentid=4427 (accessed on 8 June 2017).
  20. Oregon Department of Land Conservation and Development. Oregon’s Statewide Planning Goals & Guidelines. 2010. Available online: http://www.oregon.gov/lcd/docs/goals/compilation_of_statewide_planning_goals.pdf (accessed on 6 August 2017).
  21. Corvallis OR. Storm water Master Plan. 2002. Available online: http://www.corvallisoregon.gov/index.aspx?page=128 (accessed on 28 July 2017).
  22. Corvallis OR. City of Corvallis Land Development Code. 2006. Available online: http://www.corvallisoregon.gov/modules/showdocument.aspx?documentid=8772 (accessed on 16 May 2017).
  23. Corvallis OR. The Corvallis 2020 Vision Statement. 1998. Available online: http://www.corvallisoregon.gov/index.aspx?page=51 (accessed on 18 May 2017).
  24. Zhou, L.; Shen, G.Q.; Woodfin, T.; Chen, T.; Song, K. Ecological and economic impacts of green roofs and permeable pavements at the city level: The case of Corvallis, Oregon. J. Environ. Plan. Manag. 2017. [Google Scholar] [CrossRef]
  25. Natural Capital Project. InVEST Integrated Valuation of Ecosystem Services and Tradeoffs. Available online: https://www.naturalcapitalproject.org/invest/ (accessed on 16 May 2017).
  26. Arguez, A.; Durre, I.; Applequist, S.; Vose, R.S.; Squires, M.F.; Yin, X.G.; Heim, R.R.; Owen, T.W. NOAA’S 1981–2010 U.S. Climate Normals an Overview. Bull. Am. Meteorol. Soc. 2012, 93, 1687–1697. [Google Scholar] [CrossRef]
  27. Gesch, D.B. The national elevation dataset. In Digital Elevation Model Technologies and Applications: The DEM Users Manual, 2nd ed.; Maune, D., Ed.; American Society for Photogrammetry and Remote Sensing: Bethesda, MD, USA, 2007; pp. 99–118. ISBN 9781570830822. [Google Scholar]
  28. NRCS (Natural Resources Conservation Service). Soil Survey Geographic (SSURGO) Database. Available online: https://websoilsurvey.nrcs.usda.gov/ (accessed on 28 March 2017).
  29. Pacific Northwest Ecosystem Research Consortium. Willamette River Basin Datasets. Available online: http://www.fsl.orst.edu/pnwerc/wrb/access.html (accessed on 28 March 2017).
  30. Corvallis OR. City GIS Data. Available online: http://www.corvallisoregon.gov/index.aspx?page=163 (accessed on 28 March 2017).
  31. Allen, R.G.; Pereira, L.S.; Raes, D.; Smith, M. Crop Evapotranspiration: Guidelines for Computing Crop Water Requirements. In FAO Irrigation and Drainage Paper No 56; FAO: Rome, Italy, 1998. [Google Scholar]
  32. Parn, J.; Pinay, G.; Mander, U. Indicators of nutrients transport from agricultural catchments under temperate climate: A review. Ecol. Indic. 2012, 22, 4–15. [Google Scholar] [CrossRef]
  33. IPCC (Intergovernmental Panel on Climate Change). 2006 IPCC Guidelines for National Greenhouse Gas Inventories. Available online: https://www.ipcc-nggip.iges.or.jp/public/2006gl/index.html (accessed on 26 March 2017).
  34. Nelson, E.; Mendoza, G.; Regetz, J.; Polasky, S.; Tallis, H.; Cameron, R.; Chan, K.; Daily, G.; Goldstein, J.; Kareiva, P.; et al. Modeling multiple ecosystem services, biodiversity conservation, commodity production, and tradeoffs at landscape scales. Front. Ecol. Environ. 2009, 7, 4–11. [Google Scholar] [CrossRef]
  35. Chang, H.; Bonnette, M. Climate change and water-related ecosystem services: Impacts of drought in California, USA. Ecosyst. Health Sustain. 2016. [Google Scholar] [CrossRef]
  36. Redhead, J.; May, L.; Oliver, T.; Hamel, P.; Sharp, R.; Bullock, J. National scale evaluation of the InVEST nutrient retention model in the United Kingdom. Sci. Total Environ. 2018, 610–611, 666–677. [Google Scholar] [CrossRef] [PubMed]
  37. InVEST User’s Guide. Available online: http://data.naturalcapitalproject.org/nightly-build/invest-users-guide/html/ (accessed on 8 March 2017).
  38. Ecosystem Valuation. Damage Cost Avoided, Replacement Cost, and Substitute Cost Methods. Available online: http://www.ecosystemvaluation.org/cost_avoided.htm (accessed on 26 March 2017).
  39. EPA (United States Environmental Protection Agency). Water Quality Trading Toolkit for Permit Writers. Available online: https://www.epa.gov/npdes/water-quality-trading-toolkit-permit-writers (accessed on 26 March 2017).
  40. Nordhaus, W.D. A review of the Stern Review on the Economics of Climate Change. J. Econ. Lit. 2007, 45, 686–702. [Google Scholar] [CrossRef]
  41. Stern, N. The Economics of Climate Change: The Stern Review; Cambridge University Press: Cambridge, UK; New York, NY, USA, 2007; pp. 324–346. ISBN 978-0521700801. [Google Scholar]
  42. Lathrop, R.G.; Bognar, J.A. Applying GIS and landscape ecological principles to evaluate land conservation alternatives. Landsc. Urban Plan. 1998, 41, 27–41. [Google Scholar] [CrossRef]
  43. Sun, G.; Lockaby, L.B. Water Quantity and Quality at the Urban-Rural Interface. In Urban-Rural Interfaces: Linking People and Nature; Laband, D.N., Lockaby, B.G., Zipperer, W., Eds.; Crop Science Society of America and Soil Science Society of America: Madison, WI, USA, 2012; pp. 29–48. Available online: https://www.srs.fs.usda.gov/pubs/41266 (accessed on 26 May 2017).
  44. Johnston, C.A. Sediment and Nutrient Retention by Fresh-Water Wetlands-effects on Surface-Water Quality. Crit. Rev. Environ. Sci. Technol. 2009, 21, 491–565. [Google Scholar] [CrossRef]
  45. Gardiner, T.; Michelle, P.; Field, R.; Hill, J. The influence of sward height and vegetation composition in determining the habitat preferences of three Chorthippus species (Orthoptera: Acrididae) in Chelmsford, Essex, UK. J. Orthoptera Res. 2002, 11, 207–213. [Google Scholar] [CrossRef]
  46. Van Leeuwen, T.T.; Frank, A.J.; Jin, Y.; Smyth, P.; Goulden, M.L.; van der Werf, G.R.; Randerson, J.T. Optimal use of land surface temperature data to detect changes in tropical forest cover. J. Geophys. Res. Biogeosci. 2011, 116. [Google Scholar] [CrossRef]
  47. Wise, D.R.; Rinella, F.A., III; Rinella, J.F.; Fuhrer, G.J.; Embrey, S.S.; Clark, G.E.; Schwarz, G.E.; Sobieszczyk, S. Nutrient and suspended-sediment transport and trends in the Columbia River and Puget Sound basins, 1993–2003. In U.S. Geol. Surv. Sci. Investig. Rep.; 2007; p. 5186. Available online: https://pubs.usgs.gov/sir/2007/5186/pdf/sir20075186.pdf (accessed on 19 December 2017).
  48. Wise, D.R.; Johnson, H.M. Surface-Water Nutrient Conditions and Sources in the United States Pacific Northwest. J. Am. Water Resour. Assoc. 2011, 47, 1110–1135. [Google Scholar] [CrossRef] [PubMed]
  49. Zhou, K.H.; Liu, Y.L.; Tan, R.H.; Song, Y. Urban dynamics, landscape ecological security, and policy implications: A case study from the Wuhan area of central China. Cities 2014, 41, 141–153. [Google Scholar] [CrossRef]
  50. Lakes, T.; Kim, H.O. The urban environmental indicator “Biotope Area Ratio”—An enhanced approach to assess and manage the urban ecosystem services using high resolution remote-sensing. Ecol. Indic. 2012, 13, 93–103. [Google Scholar] [CrossRef]
  51. Yang, B.; Li, M.H.; Li, S. Design-with-nature for multifunctional landscapes: Environmental benefits and social barriers in community development. Int. J. Environ. Res. Public Health 2013, 10, 5433–5458. [Google Scholar] [CrossRef] [PubMed] [Green Version]
  52. Chang, J.; Qu, Z.L.; Pan, K.X.; Xu, B.; Min, Y.; Ren, Y.; Yang, G.F.; Ge, Y. Assessing the ecosystem services provided by urban green spaces along urban center-edge gradients. Sci. Rep. 2017, 7, 11226. [Google Scholar] [CrossRef] [PubMed]
  53. Vogel, J.R.; Moore, T.L.; Coffman, R.R.; Rodie, S.N.; Hutchinson, S.L.; McDonough, K.R.; McLemore, A.J.; McMaine, J.T. Critical Review of Technical Questions Facing Low Impact Development and Green Infrastructure: A Perspective from the Great Plains. Water Environ. Res. 2015, 87, 849–862. [Google Scholar] [CrossRef] [PubMed]
  54. Lee, J.A.; Chon, J.; Ahn, C. Planning landscape corridors in ecological infrastructure using least-cost path methods based on the value of ecosystem services. Sustainability 2014, 6, 7564–7585. [Google Scholar] [CrossRef]
  55. Nelson, K.C.; Palmer, M.A.; Pizzuto, J.E.; Moglen, G.E.; Angermeier, P.L.; Hilderbrand, R.H.; Dettinger, M.; Hayhoe, K. Forecasting the combined effects of urbanization and climate change on stream ecosystems: From impacts to management options. J. Appl. Ecol. 2009, 46, 154–163. [Google Scholar] [CrossRef] [PubMed]
  56. Cuddington, K.; Hastings, A. Autocorrelated environmental variation and the establishment of invasive species. OIKOS 2016, 125, 1027–1034. [Google Scholar] [CrossRef]
  57. Yin, J.; Yin, Z.; Zhong, H.D.; Xu, S.Y.; Hu, X.M.; Wang, J.; Wu, J.P. Monitoring urban expansion and land use/land cover changes of Shanghai metropolitan area during the transitional economy (1979–2009) in China. Environ. Monit. Assess. 2011, 177, 609–621. [Google Scholar] [CrossRef] [PubMed]
  58. Davies, R.G.; Barbosa, O.; Fuller, R.A.; Tratalos, J.; Burke, N.; Lewis, D.; Gaston, K.J. City-wide relationships between green spaces, urban land use and topography. Urban Ecosyst. 2008, 11, 269–287. [Google Scholar] [CrossRef]
  59. Sushinsky, J.R.; Rhodes, J.R.; Possingham, H.P.; Gill, T.K.; Fuller, R.A. How should we grow cities to minimize their biodiversity impacts? Glob. Chang. Biol. 2013, 19, 401–410. [Google Scholar] [CrossRef] [PubMed]
  60. Chace, J.F.; Walsh, J.J. Urban effects on native avifauna: A review. Landsc. Urban Plan. 2006, 74, 46–69. [Google Scholar] [CrossRef]
  61. Buczkowski, G.; Richmond, D.S. The Effect of Urbanization on Ant Abundance and Diversity: A Temporal Examination of Factors Affecting Biodiversity. PLoS ONE 2012, 7, e41729. [Google Scholar] [CrossRef] [PubMed]
  62. Liu, Y.Y.; Wang, Y.Q.; An, R.; Li, C. The spatial distribution of commuting CO2 emissions and the influential factors: A case study in Xi’an, China. Adv. Clim. Chang. Res. 2015, 6, 46–55. [Google Scholar] [CrossRef]
  63. Hortas-Rico, M.; Solé-Ollé, A. Does Urban Sprawl Increase the Costs of Providing Local Public Services? Evidence from Spanish Municipalities. Urban Stud. 2010, 47, 1513–1540. [Google Scholar] [CrossRef]
  64. Dramstad, W.E.; Olson, J.D.; Forman, R.T. Landscape Ecology Principles in Landscape Architecture and Land Use Planning; Island Press: Washington, DC, USA, 1996; pp. 35–39. ISBN 978-1559635141. [Google Scholar]
  65. Ewing, R.; Tian, G.; Lyons, T. Does compact development increase or reduce traffic congestion? Cities 2018, 72, 94–101. [Google Scholar] [CrossRef]
  66. Hansen, R.; Frantzeskaki, N.; McPhearson, T.; Rall, E.; Kabisch, N.; Kaczorowska, A.; Kain, J.H.; Artmann, M.; Pauleit, S. The uptake of the ecosystem services concept in planning discourses of European and American cities. Ecosyst. Serv. 2015, 12, 228–246. [Google Scholar] [CrossRef]
  67. Niemela, J.; Saarela, S.R.; Soderman, T.; Kopperoinen, L.; Yli-Pelkonen, V.; Vare, S.; Kotze, D.J. Using the ecosystem services approach for better planning and conservation of urban green spaces: A Finland case study. Biodivers. Conserv. 2010, 19, 3225–3243. [Google Scholar] [CrossRef]
  68. Carruthers, J.I.; Ulfarsson, G.F. Urban sprawl and the cost of public services. Environ. Plan. B 2003, 30, 503–522. [Google Scholar] [CrossRef]
  69. Ewing, R. Is Los Angeles-style sprawl desirable? J. Am. Plan. Assoc. 1997, 63, 107–126. [Google Scholar] [CrossRef]
  70. Gomez-Baggethun, E.; Barton, D.N. Classifying and valuing ecosystem services for urban planning. Ecol. Econ. 2013, 86, 235–245. [Google Scholar] [CrossRef]
  71. Benedict, M.A.; McMahon, E.T. Green infrastructure: Smart conservation for the 21st century. Renew. Res. J. 2002, 20, 12–17. [Google Scholar]
  72. Kambites, C.; Owen, S. Renewed prospects for green infrastructure planning in the UK. Plan. Pract. Res. 2006, 21, 483–496. [Google Scholar] [CrossRef]
Figure 1. The city of Corvallis, City Limit, Urban Growth Boundary, Urban Fringe, Willamette River, Drainage Basin, Sub-basin, and Land Use Land Cover [24]. (a) Watersheds in Corvallis; (b) Land Use and Land Cover in Corvallis.
Sustainability 10 00126 g001
Figure 2. The city of Corvallis urbanization history from 1854 to 1997.
Sustainability 10 00126 g002
Figure 3. (a) Spatial Matrix P shows the parcel size, the spatial location identification and the ecological value for each parcel; (b) Spatial Matrix M arranges parcels with the ecological value in the ascending order.
Sustainability 10 00126 g003
Figure 4. Power correlation of the combined ecological value with the impervious surface percentage.
Sustainability 10 00126 g004
Figure 5. Ecological value on the parcel level outside the City Limit.
Sustainability 10 00126 g005
Figure 6. Ecological value distribution autocorrelation test on the sub-basin and parcel levels.
Sustainability 10 00126 g006
Figure 7. (a) Corvallis Comprehensive Plan 1998–2020; (b) Proposed Land Use Plan.
Sustainability 10 00126 g007
Table 1. Datasets used to map ecological values in purifying storm water and storing carbon in the InVEST program.
Data NameSourceFormat
Climate DatasetAverage Annual PrecipitationNational Oceanic and Atmospheric Administration-Climate Prediction Center [26]GIS Raster-Grid
Average Annual Reference EvapotranspirationNational Oceanic and Atmospheric Administration-Climate Prediction Center [26]GIS Raster-Grid
Geographic DatasetDrainage BasinCity of Corvallis, OR [19]GIS Vector-Polygon
Sub-basinCity of Corvallis, OR [19]GIS Vector-Polygon
DEMNational Elevation Database [27]GIS Raster-Grid
Plant Available Water ContentSoil Survey Geographic Database [28]GIS Raster-Grid
Root Restricting Layer DepthSoil Survey Geographic Database [28]GIS Raster-Grid
Land Cover DataPacific Northwest Ecosystem Research Consortium [29]GIS Raster-Grid
Planning Dataset1998–2020 Comprehensive PlanCity of Corvallis, OR [23]GIS Vector-Polygon
1998 Zoning MapCity of Corvallis, OR [30]GIS Vector-Polygon
Impervious SurfaceCity of Corvallis, OR [30]GIS Vector-Polygon
Parcel City of Corvallis, OR [30]GIS Vector-Polygon
Biophysical DatasetPlant Evapotranspiration CoefficientFAO Crop Evapotranspiration [31]N/A
Nutrient Loading CoefficientNatCap Database [32]N/A
Vegetation Filtering CoefficientNatCap Database [32]N/A
Amount of Carbon Stored in Aboveground BiomassNational Greenhouse Gas Inventories Programme [33]N/A
Amount of Carbon Stored in Belowground BiomassNational Greenhouse Gas Inventories Programme [33]N/A
Carbon Stored in SoilNational Greenhouse Gas Inventories Programme [33]N/A
Amount of Carbon Stored in Dead BodyNational Greenhouse Gas Inventories Programme [33]N/A
Table 2. Urbanization’s ecological impacts in 1998 and 2020.
19982020Difference (%)
AreaSize (m2)N_E (kg)P_E (kg)C_S (Mg)N_E (kg)P_E (kg)C_S (Mg)N_EP_EC_S
City Limit41,246,8473195405172,44545851039157,23444157−9
Urban Fringe33,164,0412297282372,0104210906150,27083221−60
Urban Growth Boundary74,410,8885491687544,45587951946307,50460183−44
Area outside of Urban Growth Boundary44,937,4798721071,553,9938801091,553,225110
Storm water basin119,348,36763637952,098,448967520551,860,72952159−11
Note: N_E: Nitrogen Export; P_E: Phosphorus Export; C_S: Carbon Storage.
Table 3. Urbanization’s impacts on environment from 1854 to 1997.
Time PeriodU_S (Acre/Year)N_E (kg)P_E (kg)C_S_L (Mg)N_E (kg/Acre/Year)P_E (kg/Acre/Year)C_S_L (Mg/Acre/Year)
1854–18690.210.290.05226.350.00540.00094.20
1870–18850.741.600.341057.980.00840.00185.58
1886–190127.22109.4615.7346,378.110.01570.00236.65
1902–191710.5266.5613.6019,566.190.02470.00517.27
1918–193384.03145.7523.4016,978.270.00680.00110.79
1934–194948.75289.1629.5483,384.290.02320.00246.68
1950–1965100.52560.8147.43154,578.150.02180.00186.01
1966–1981130.62612.7541.75142,850.440.01830.00124.27
1982–199798.77358.1029.20100,747.000.01420.00123.98
Average55.71238.2722.3462,862.980.01540.00205.05
Note: N_Export: U_S: urbanization size during the period; P_Export: phosphorus export due to urbanization in the period. C_S_L: carbon storage loss due to urbanization in the period.
Table 4. Ecological value for each sub-basin.
Sub-basinSize (m2)I_ PE_V ($/m2)Sub-BasinSize (m2)I_ PE_V ($/m2)
Jackson Creek7,252,6463.49%13.87Dixon Creek10,646,47731.22%5.25
Oak Creek33,565,8694.84%13.41Goodnight1,476,66837.10%1.11
Lewisburg7,549,2645.24%10.48Ryan Creek554,02237.42%2.24
North East Corvallis2,468,8075.43%3.59Sequoia Creek5,316,67237.74%3.83
Frazier Creek8,287,7895.66%12.18Mill Race1,629,51538.83%1.48
Marys River14,165,1476.75%1.34Garfield2,231,94941.39%0.97
Willamette River2,592,3207.07%2.28Western505,83557.31%0.66
Dry Creek4,591,24013.75%0.82Madison256,50457.39%0.83
Dunawi Creek10,722,05518.71%2.76Fillmore2,665,09060.71%1.11
Village Green1,895,54526.39%1.96Adams Jefferson687,24264.57%0.34
Note: I_P: impervious surface percentage; E_V: combined ecological value per year.
Table 5. Projected future land use size, impervious percentage and order to be zoned.
OrderUrbanization Land UseSize (m2)I_POrderUrbanization Land UseSize (m2)I_P
1Commercial438,29676.80%7General Industrial2,352,49231.14%
2Intensive Industrial778,68067.25%8Residential-Low Density12,444,19525.20%
3Residential-High Density309,60853.88%9Limited Industrial 416,22215.79%
4Residential-Medium-High Density1,377,22542.76%10Open Space-Agricultural3,174,0644.26%
5Public Institutional4,966,18737.93%11Open Space-Conservation4,520,1160.00%
6Residential-Medium Density1,987,27337.28%
Note: I_P: impervious surface percentage.
Table 6. Urbanized and Conserved Parcels in the Proposed Land Use Plan.
Combined Ecological Value Parcel NumbersParcel to be UrbanizedParcel to be PreservedPreservation Percentage
<300080180100.00%
3000–600087539847754.51%
6000–90008390839100.00%
9000–12,0001410141100.00%
>12,0001120112100.00%
Table 7. Comparison of Ecosystem Services Provision.
Corvallis Comprehensive PlanProposed Land Use PlanDifference
Nitrogen Retention15,073 kg30,522 kg102.49%
Phosphorus Retention1225 kg4533 kg270.04%
Carbon Storage1,553,993 Mg1,847,725 Mg18.90%

