1. Introduction
The need for the roll-out of a public charging infrastructure in order to facilitate the adoption of both Plug-in Hybrid Electric Vehicles (PHEV) and Battery Electric Vehicles (BEV) has been established unquestionably in literature and formalized by the EU directive 2014/94/EU on the deployment of an alternative fuels infrastructure [
1]. Extensive literature describing charging station planning, design, and location methods is available. Various planning and design methods have been developed for different characteristics and design possibilities for charging infrastructure as summarized by Funke S.A. et al. [
2]. Huang, K. et al. [
3] define the objectives of the various planning and design methods in the literature section of their paper [
3].
To the best of our knowledge, only a small amount of literature is available assessing various roll-out strategies based on real life performance of existing charging infrastructure. Particularly, in the light of the expected growth and uptake of electric vehicles on the road from 2020 onwards, the EU objectives towards a 100% emission-free transport in 2050, and taking into account the uncertainties associated with a transition of this size, it is relevant for policy makers and Charge Point Operators (CPOs) to be able to assess the performance of existing charging infrastructure. Systematic evaluation creates the opportunity to adapt to changes in the field of zero-emission transport.
The aim of this work is to present the development, results, and application of an assessment platform based on a large set of real life and up-to-date charging data. This platform allows stakeholders in the decision-making process of charge point installation to make informed decisions on where and how to expand already existing charging infrastructure. Location specific information about the performance of charging infrastructure is visualized.
The remainder of this paper is organized as follows:
Section 2 provides an overview of relevant literature and the conceptualization of Key Performance Indicators (KPIs).
Section 3 describes the research and development process and its functional units.
Section 4 describes the Data Warehouse architecture and data processing.
Section 5 entails the roll-out process and requirements set for the web-based assessment tool by the practitioners involved in this research.
Section 6 presents the web-based assessment tool.
Section 7,
Section 8 and
Section 9 explains how the assessment tool is being applied by the practitioners.
Section 10 entails the discussion and conclusions.
2. Literature Review
2.1. Charging Infrastructure Planning, Design, and Location
Numerous charging infrastructure (CI) planning, design, and location models have been described in the literature. Estimates of how many charging stations are needed at a national or local level to fulfill future demand are described [
2,
3,
4,
5]. Geographically-oriented models calculate the distribution of charging stations based on GPS driving patterns of non-EV-vehicles or mathematical models [
3,
6,
7,
8,
9]. Liu [
9] conducts an “initial analysis of the charging infrastructure assignment for the early EV market in Beijing” based on the geographical distribution of petrol refueling stations, parking lots and transmission stations, knowledge about petrol refueling behavior, and residential data. Both slow and fast charging infrastructure, including battery swaps, is being conceptualized and aims at minimizing the number of charging stations. The objective of Frade et al. [
5] is to design a slow-charging infrastructure with maximum covered demand. A distinction between daytime and night-time charging is introduced. Daytime and night-time charging demands are estimated based on employment and residential data. The number of charging stations to be placed is given by local authorities. Regression methods are used to estimate the charging demand of predefined traffic zones in Lisbon. An optimization model is being used to maximize the total coverage. Xi et al. [
10] “develop a simulation–optimization model that determines where to locate electric vehicle chargers to maximize their use by privately owned electric vehicles.” The model assumes the availability of tour record data for vehicle trips between regions, defining the times between which trips occur. EV adoption probabilities are estimated based on household demographic and macroeconomic variables of the studied region.
The aforementioned models serve the initial roll-out of charging infrastructure and provide an initial framework for defining key performance indicators once the charging infrastructure has been installed, based on the objectives of the models as described by Huang, K. et al. [
3].
At the initial phase of charging infrastructure roll-out in the Netherlands back in 2010–2011, models based on demographic and macroeconomic variables and estimated charging demand were applied to distinguish where to start installing level one and two charging infrastructure in the city of Amsterdam. Non-EV drivers almost immediately started to complain about empty parking lots due to high parking pressure in the city. A demand-driven approach was adopted in the cities of Amsterdam, Rotterdam, Utrecht, the Hague, and the Metropolitan Region of Amsterdam (MRA-E) to make sure to have at least one user for each charging station built in the initial phase.
By the end of 2017, the Netherlands have Europe’s densest public charging infrastructure in place according to the European Alternative Fuels Observatory [
11].
The models mentioned above tend to focus on the early phase of a charging infrastructure roll-out [
5,
7,
8]. Traffic flow data and GPS data are used to model charging infrastructure locations [
8,
12], not taking into account real-life utilization of the charging infrastructure. Only a few studies use real-life charging data to either model or assess the utilization of the charging infrastructure. Gnann et al. [
13] estimate future fast-charging infrastructure need, based on real-world fast-charging data from Sweden and Norway. Helmus et al. [
14] assess public charging infrastructure push and pull strategies for level one and two “normal” public charging infrastructure in the Netherlands based on real life charge point detail records. Assessment of charging infrastructure utilization requires the definition of key performance indicators, the availability of real life charging data, and the availability of a platform to unlock the knowledge and information enclosed in real-life data.
2.2. Key Performance Indicators
Charging infrastructure roll-out in the Netherlands faces a huge challenge over the coming years. The number of public charging points grew from 7395 public charging points on 31 December 2015, to 17,681 public charging points on 30 June 2018 [
15]. By the end of 2020, the number of public charging points in the Netherlands is estimated to be 42,100 in a mid-range scenario [
16]. A 100% demand-driven roll-out strategy is no longer tenable. Evaluation based on real-life charging data is necessary in order to be able to adapt to current and local situations. Knowledge about the performance of the existing charging infrastructure is invaluable for the stakeholders. Performance Indicators (PI) provide guidance on what to do to increase results [
17]. An exploration of performance indicators to support the optimization of a charging infrastructure roll-out is described by Helmus and van der Hoed [
18]. The paper identifies thirteen performance indicators derived from the objectives of five different stakeholders in the process of a charging infrastructure roll-out: local authorities, (potential) EV users, residents (non-EV users), CPOs, and grid operators.
To our best knowledge there is no body of knowledge defining key performance indicators for a charging infrastructure. Huang et al. [
3] provide a classification of scientific models that aim to optimize a charging infrastructure. As such, it provides an overview of optimization metrics: minimizing various charging infrastructure cost types, minimizing total travel time, minimizing trip failure, maximizing flow captured, maximizing covered demand, maximizing charging post usage, minimizing number of charging stations, and grid management. The objectives of the platform presented in this paper consist of maximizing charging point usage and minimizing the number of charging points, while maximally covering the demand.
Based on the objectives of the various stakeholders [
18], the metrics of charging infrastructure location planning models [
3], and the available real life data, we define five KPI’s relevant for local authorities (policy makers and practitioners) and CPOs involved in the roll-out process of a charging infrastructure (
Table 1).
3. Methodology
The case described in this paper entails the roll-out of a public charging infrastructure since 2012 in the four largest cities of the Netherlands (Amsterdam, Rotterdam, The Hague, Utrecht) and their surrounding provinces (Zuid Holland, Noord Holland, Utrecht, and Flevoland). The development of the assessment platform started in 2014. The development process included two iterations, one in 2015 and one in 2016, upgrading and adapting the results to the current wishes and requirements of the roll-out practitioners. The development process is subdivided into three functional units:
3.1. Processing Charging Data
Data management and big data are an important source supporting the de-carbonization of transport and the development of urban environments [
6,
19].
By the 31st of December 2017, 8650 charging points were in the scope of the project. Since 2014, the most recent charging data including the charging data of recently installed charging points were added each month to the dataset. The total dataset represented 7,371,610 charging sessions up to and including June 2018. A Data Warehouse (DWH) was developed in the initial phase of the research project. The design of the DWH and selected software packages are described in
Section 4.
3.2. Identifying the Practitioners’ Roll out Process and Requirements
The assessment tool was developed in close cooperation with the roll-out practitioners from the four participating municipalities, the Metropolitan Region Amsterdam Electric (MRA-E), and their contracted CPOs. In 2015 and 2016, two workshops were organized. Each workshop was attended by at least two practitioners of each municipality and the MRA-E, be it practitioners employed by the local authorities or employees of the contracted CPOs. In between the general workshops, results of the data analysis were presented to and discussed with each partner individually, involving two to three practitioners per discussion session. Each partner was visited twice during the development process.
3.3. Building a Web-Based Assessment Platform
The web-based assessment platform was built in R Shiny. The selection of this software package is justified in
Section 4. An iterative development and design process was applied, in which the practitioners during workshops and visits gave feedback, and adjustments were being made.
4. Processing Charging Data
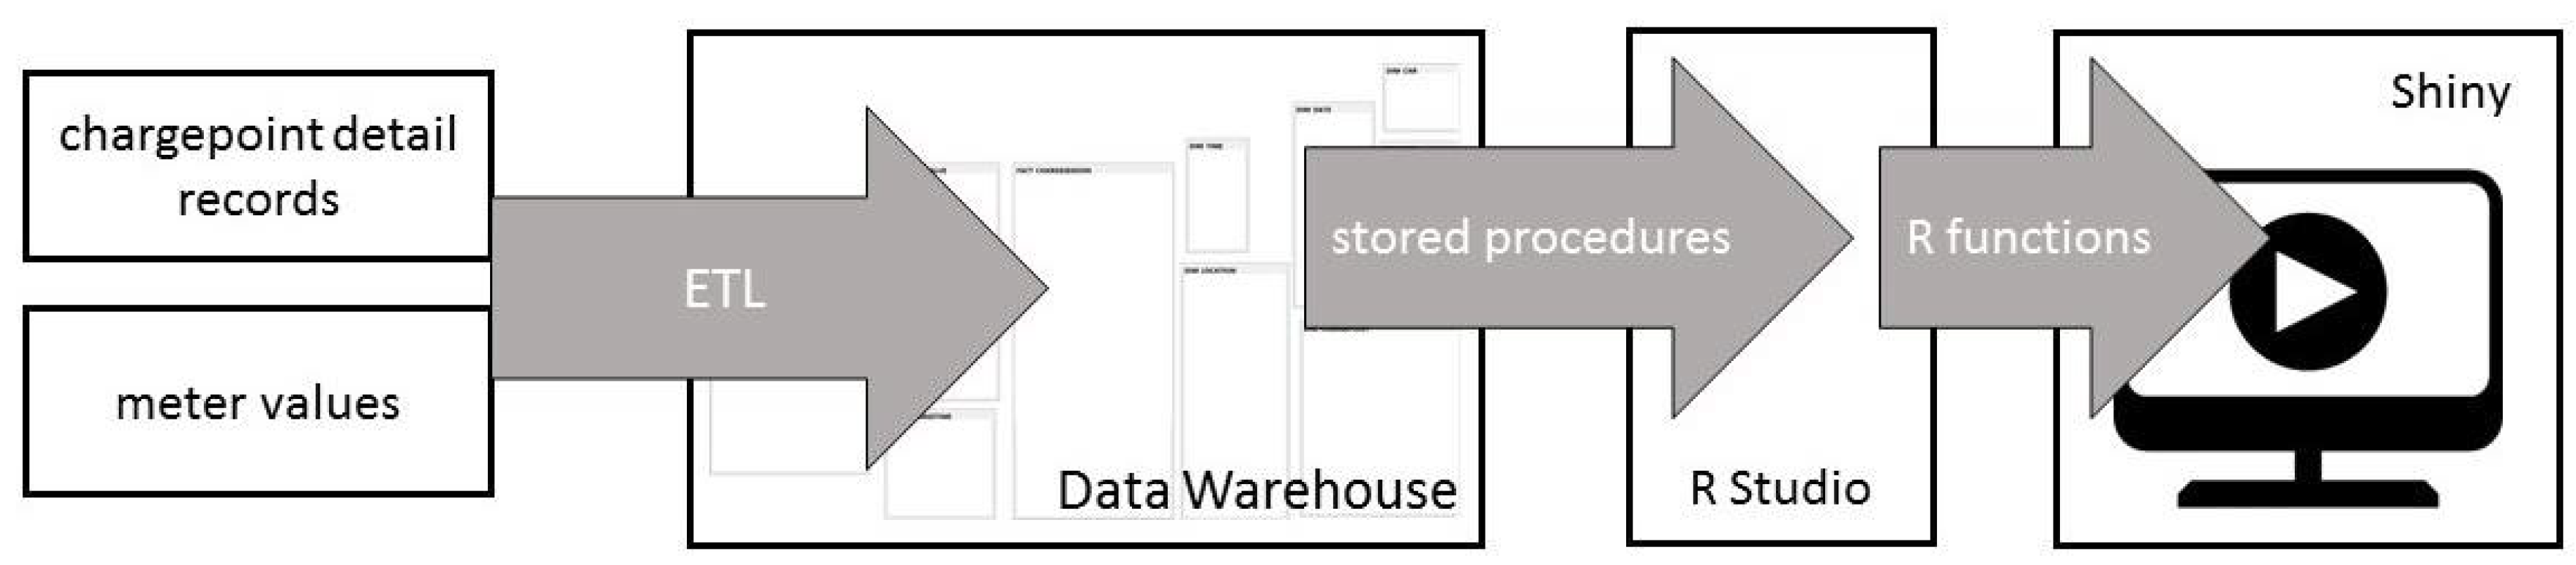
The first step towards the real-life assessment of CI utilization is the gathering and storage of charging data. In the case presented here transaction files consisting of Charge-point Detail Records (CDRs) and Meter Values (MVs) of every public charging location in the major four cities of the Netherlands and MRA-E, were filed periodically in a Data Warehouse (DWH) developed by Amsterdam University of Applied Sciences (AUAS). SSIS (
Table 2) packages Extract, Transform, and Load (ETL) these transaction files into the Data Warehouse. The charging data and other relevant datasets (e.g., location data) had a high relational character. A Microsoft SQL Server was selected as the software package in which to store and retrieve the charging data as it is a relational database management system providing a high capacity and performance.
Table 3 gives an overview of the data table structure of the DWH.
The transaction data of a charging session can be highly volatile. Errors vary from locations spelled differently to improbable session durations, impossible dates, or extremely high charged kWh. In order to diminish error effects on the final reports or visualizations, it was important to distinguish the factual data provided by the CPOs from the data on which the reports and visualizations are being based. The factual data provided by the CPOs were stored in a table named “FACT_CHARGESESSION”. This included variables such as the connection time, the charge point ID, kWh, start and end time of the connection, etc. After filtering and correcting, the clean data were filed in so called “dimension tables” (DIM). For example, locations of the charge points: address, postal code, and city derived from the CDRs and enriched with data such as geo-coordinates and district classifications were stored in the “DIM_LOCATION” table.
R was selected as the main programming language to execute the data analysis. At an early stage in our project, the limitations of what Excel could handle with regard to the size of the datasets were reached. In addition to this, Excel does not easily allow for reproducing previously conducted analyses on new datasets. Statistical software programs like SAS, STATA, or SPSS are developed for very specific uses, and do not have a large community of contributors constantly adding new tools. Programming languages R and Python do provide the desired flexibility, are able to handle large datasets, and are open source and under constant development. The choice for R was based on the fact that R, by origin, is developed for statistical analysis, whereas Python is a more general programming language. R Studio and R Shiny are the R-based intermediate software packages to produce reports and visualizations. R Shiny provides a map-based tool to visualize data. Compared to other mapping tools like Tableau, Google Maps, or ArcGIS, R Shiny provides a one-to-one link to the data-analysis results and the option to set detailed authorization limitations for user-accounts: one of the requirements set by the local authorities in order to be able to control which user-account gets access to which part of the data-analysis results. Based on user-account access authorization, stored procedures extracted reports from the Data Warehouse into R Studio. R-functions were programmed to plot the data in Shiny, the front-end web application, which the EV-infrastructure professional has access to.
Figure 1 shows the data transformation process the charging data underwent before being visualized in the web-based application of R Shiny.
5. Practitioners’ Roll-Out Process
The roll-out process for the public charging infrastructure started with the political decision to facilitate the public charging of electric vehicles, thus leading to the question of where to install the charging infrastructure taking into account the interests of EV-drivers, non-EV-drivers, other users of public space, and the market potential [
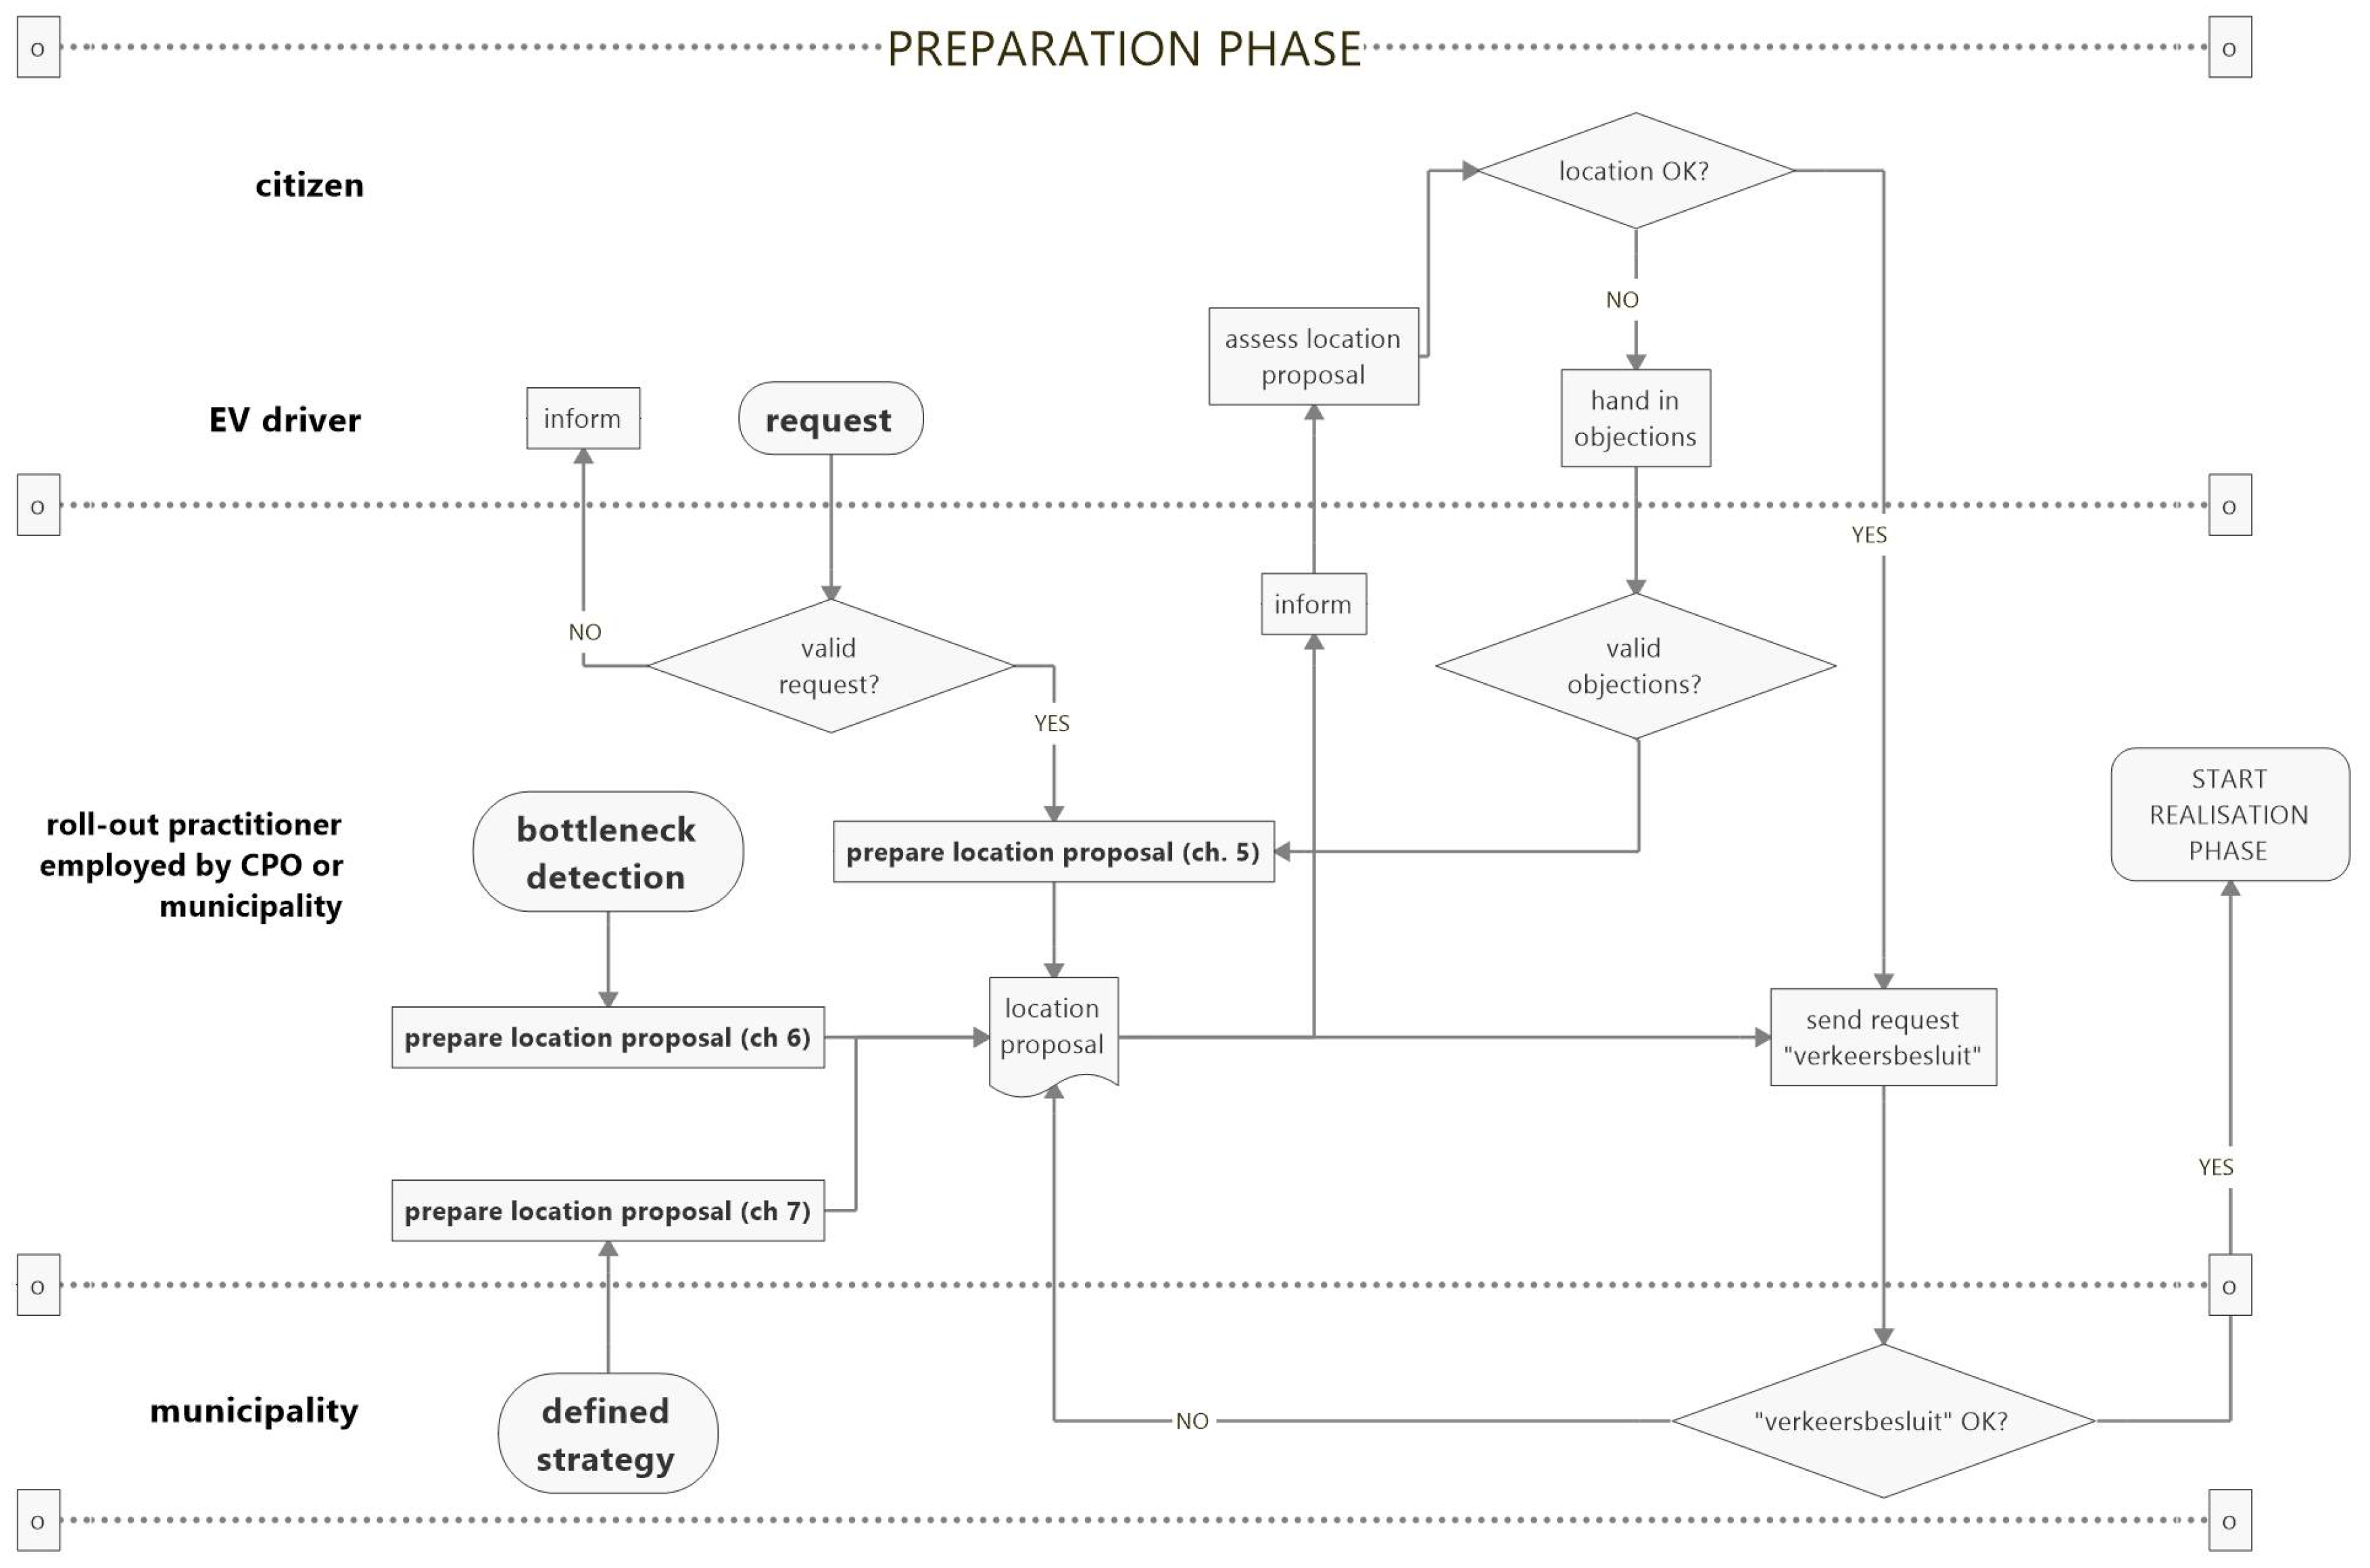
18]. From a decision process point of view, three instigating or kick-off events for the rollout process were defined based on the workshops and discussions with infrastructure roll-out practitioners: (1) an external request (demand driven roll-out); (2) a roll-out strategy based on forecasts, future scenarios, or simulations; and (3) detection of bottlenecks in the performance of the existing infrastructure. Each kick-off event required specific information or knowledge. The roll-out process was subdivided by the practitioners into three phases: preparation, realization, and exploitation.
Figure 2 illustrates the preparation phase, including validation of a request, location selection and assessment, and informing citizens (including an objection procedure). A list of requirements for the assessment platform was co-created by the researchers and practitioners during the workshops and discussions:
Most up-to-date performance of a charging station needed to be accessible for practitioners.
Charging locations easy to find visually and by address, preferably on a map.
Selection of a number of charging locations within walking distance from a certain spot.
Selection of charging locations used by specific user groups.
Graph representation of KPIs of selected charging locations.
Graph representation of KPIs aggregated on municipal, district, and sub-district level.
Export of both the map and KPI graphs for external documentation/communication.
Integration of bottleneck assessment.
Downloadable KPI tables in order to integrate KPIs per location in other back-offices.
The web-based assessment platform was designed according to these requirements and is presented in
Section 6.
6. Assessment Tool
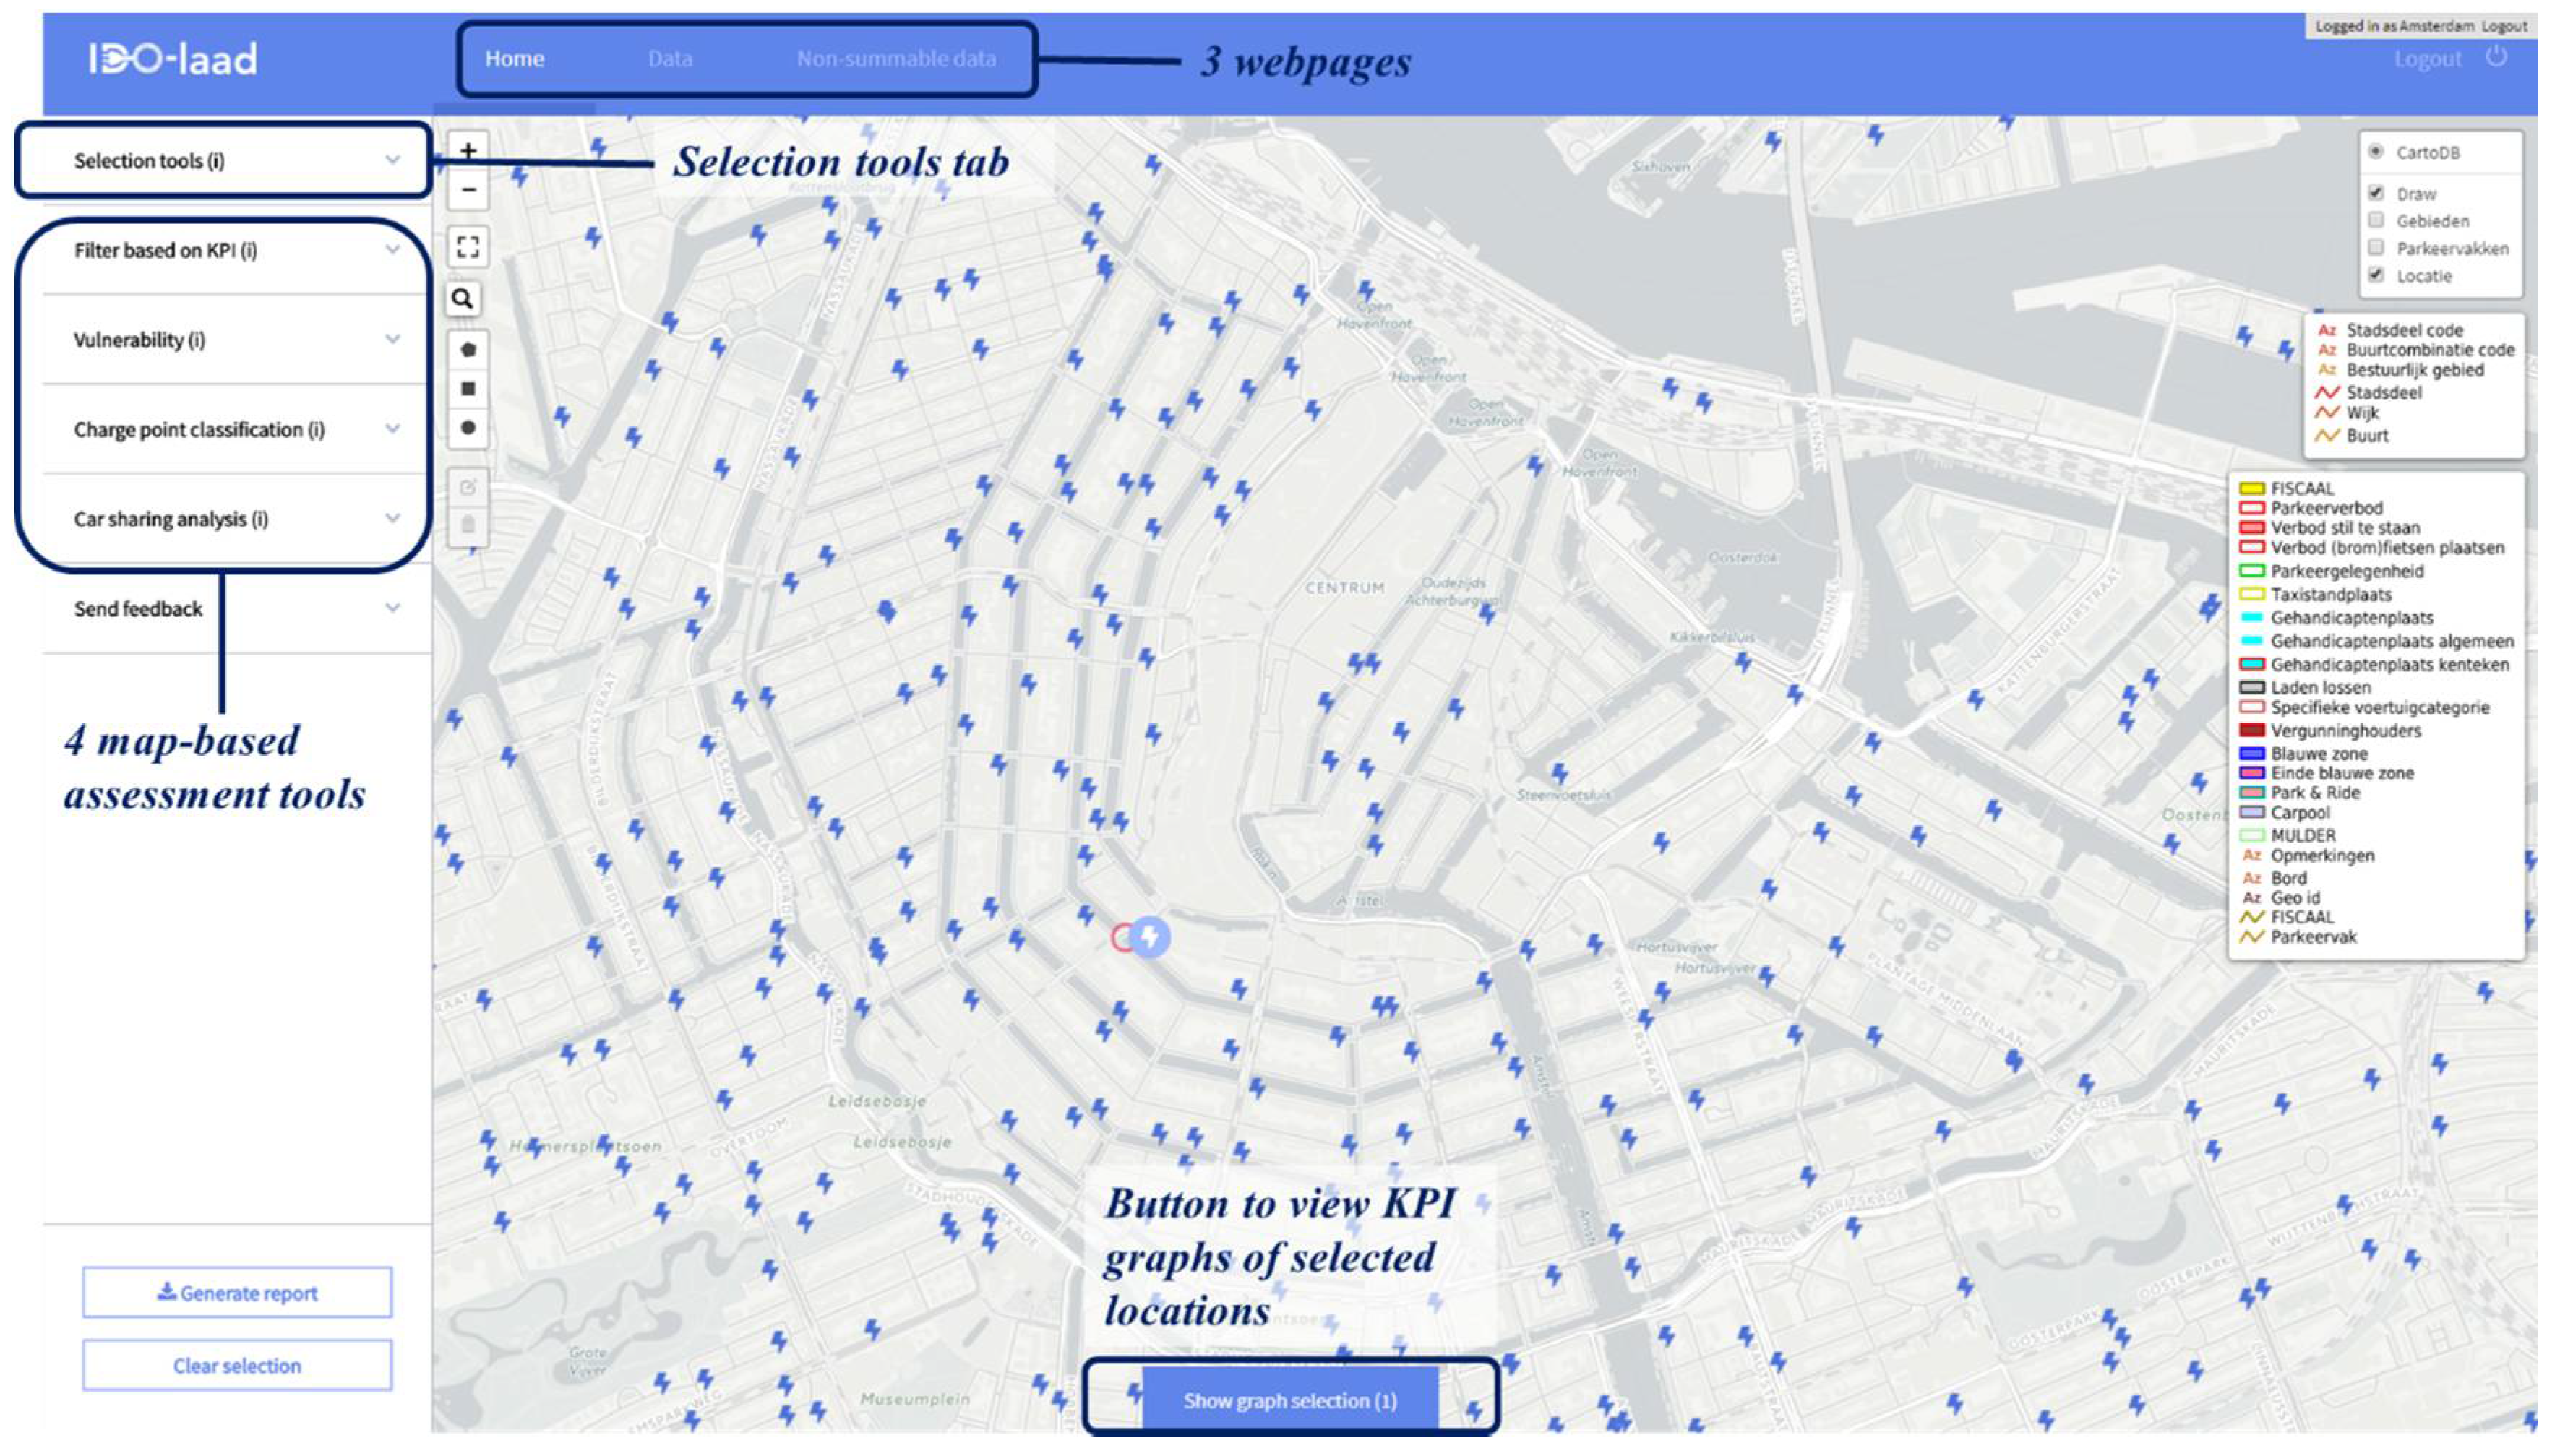
The assessment tool is a web-based application built in the open source R package “Shiny”. Shiny provides a web framework for building web applications using the programming language “R”. The version presented in this paper consisted of three webpages: a map and two KPI tables. Both the map and tables represent the KPIs as described in
Section 2.2.
In addition to this, four assessment tools have been developed and implemented. These assessment tools provided the opportunity to assess the complete infrastructure visualizing the charging locations in various colors depending on KPI thresholds determined by the practitioner.
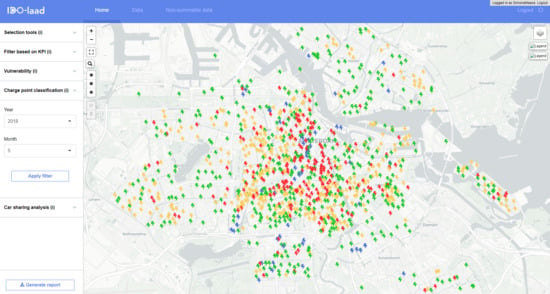
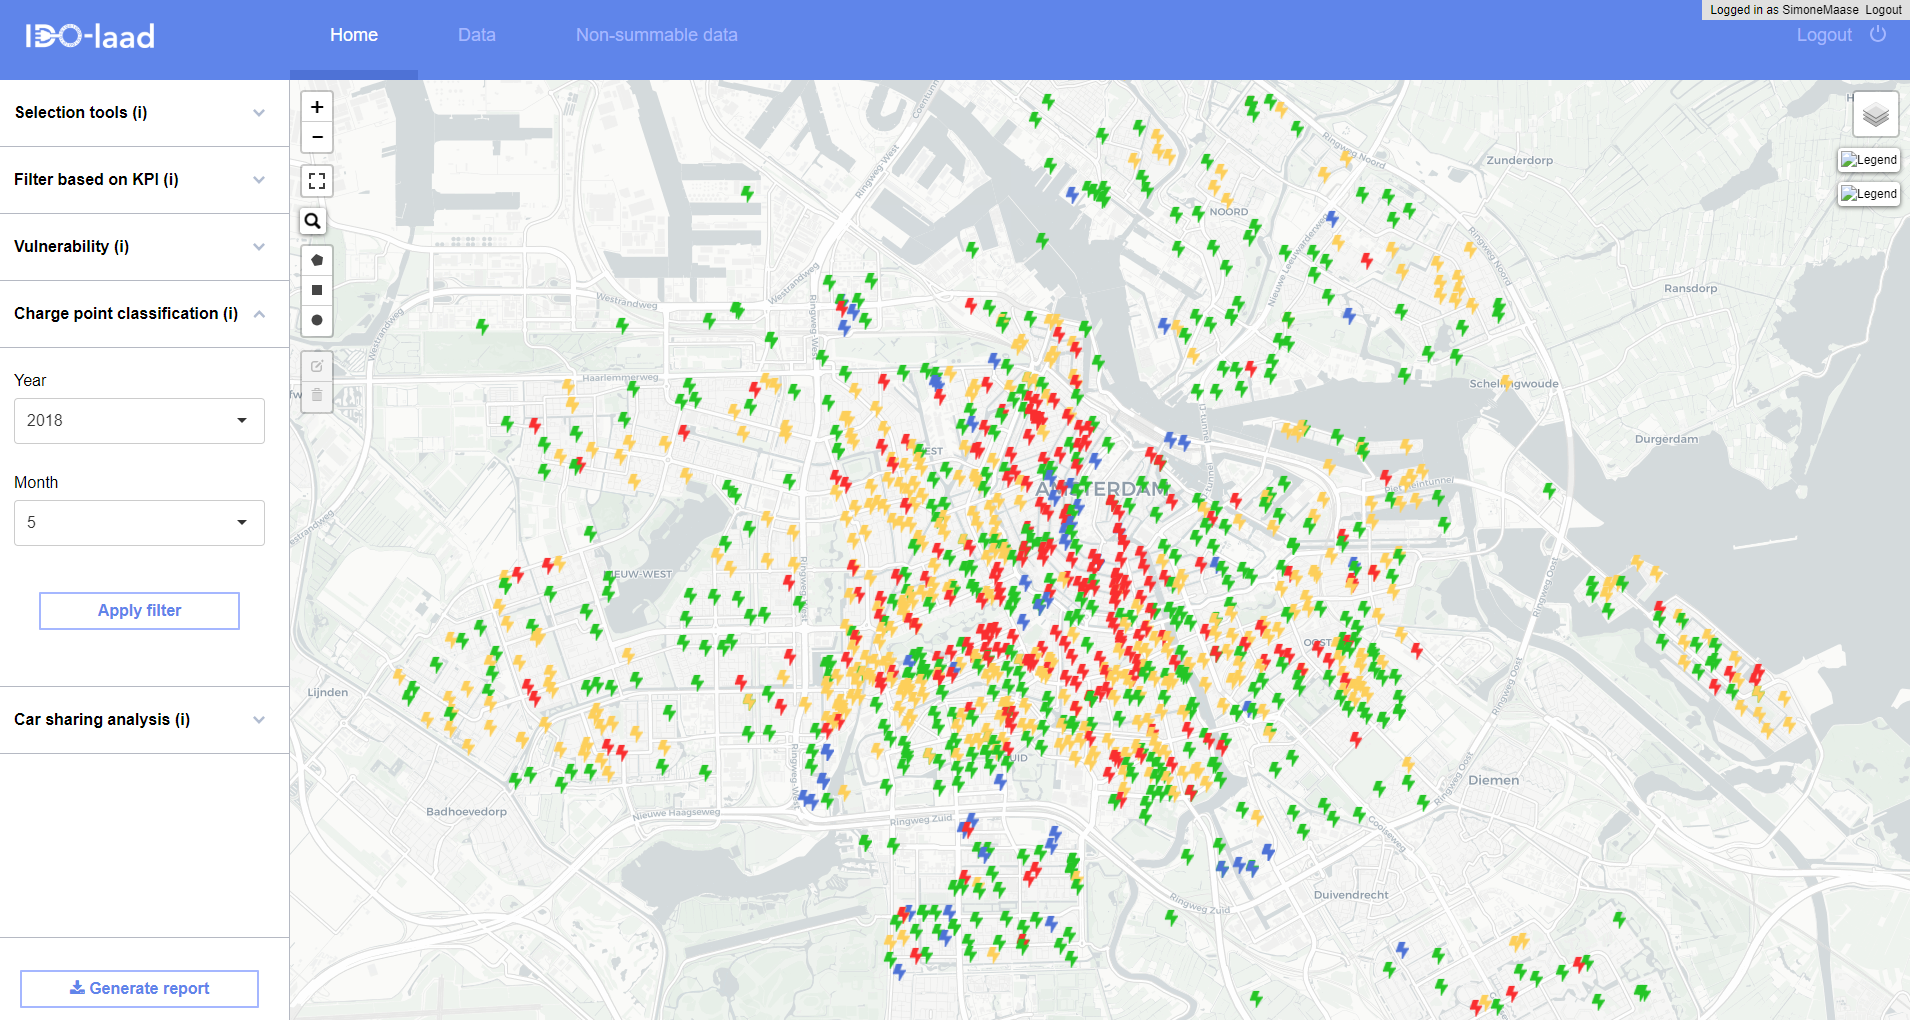
Figure 3 shows the homepage of the platform.
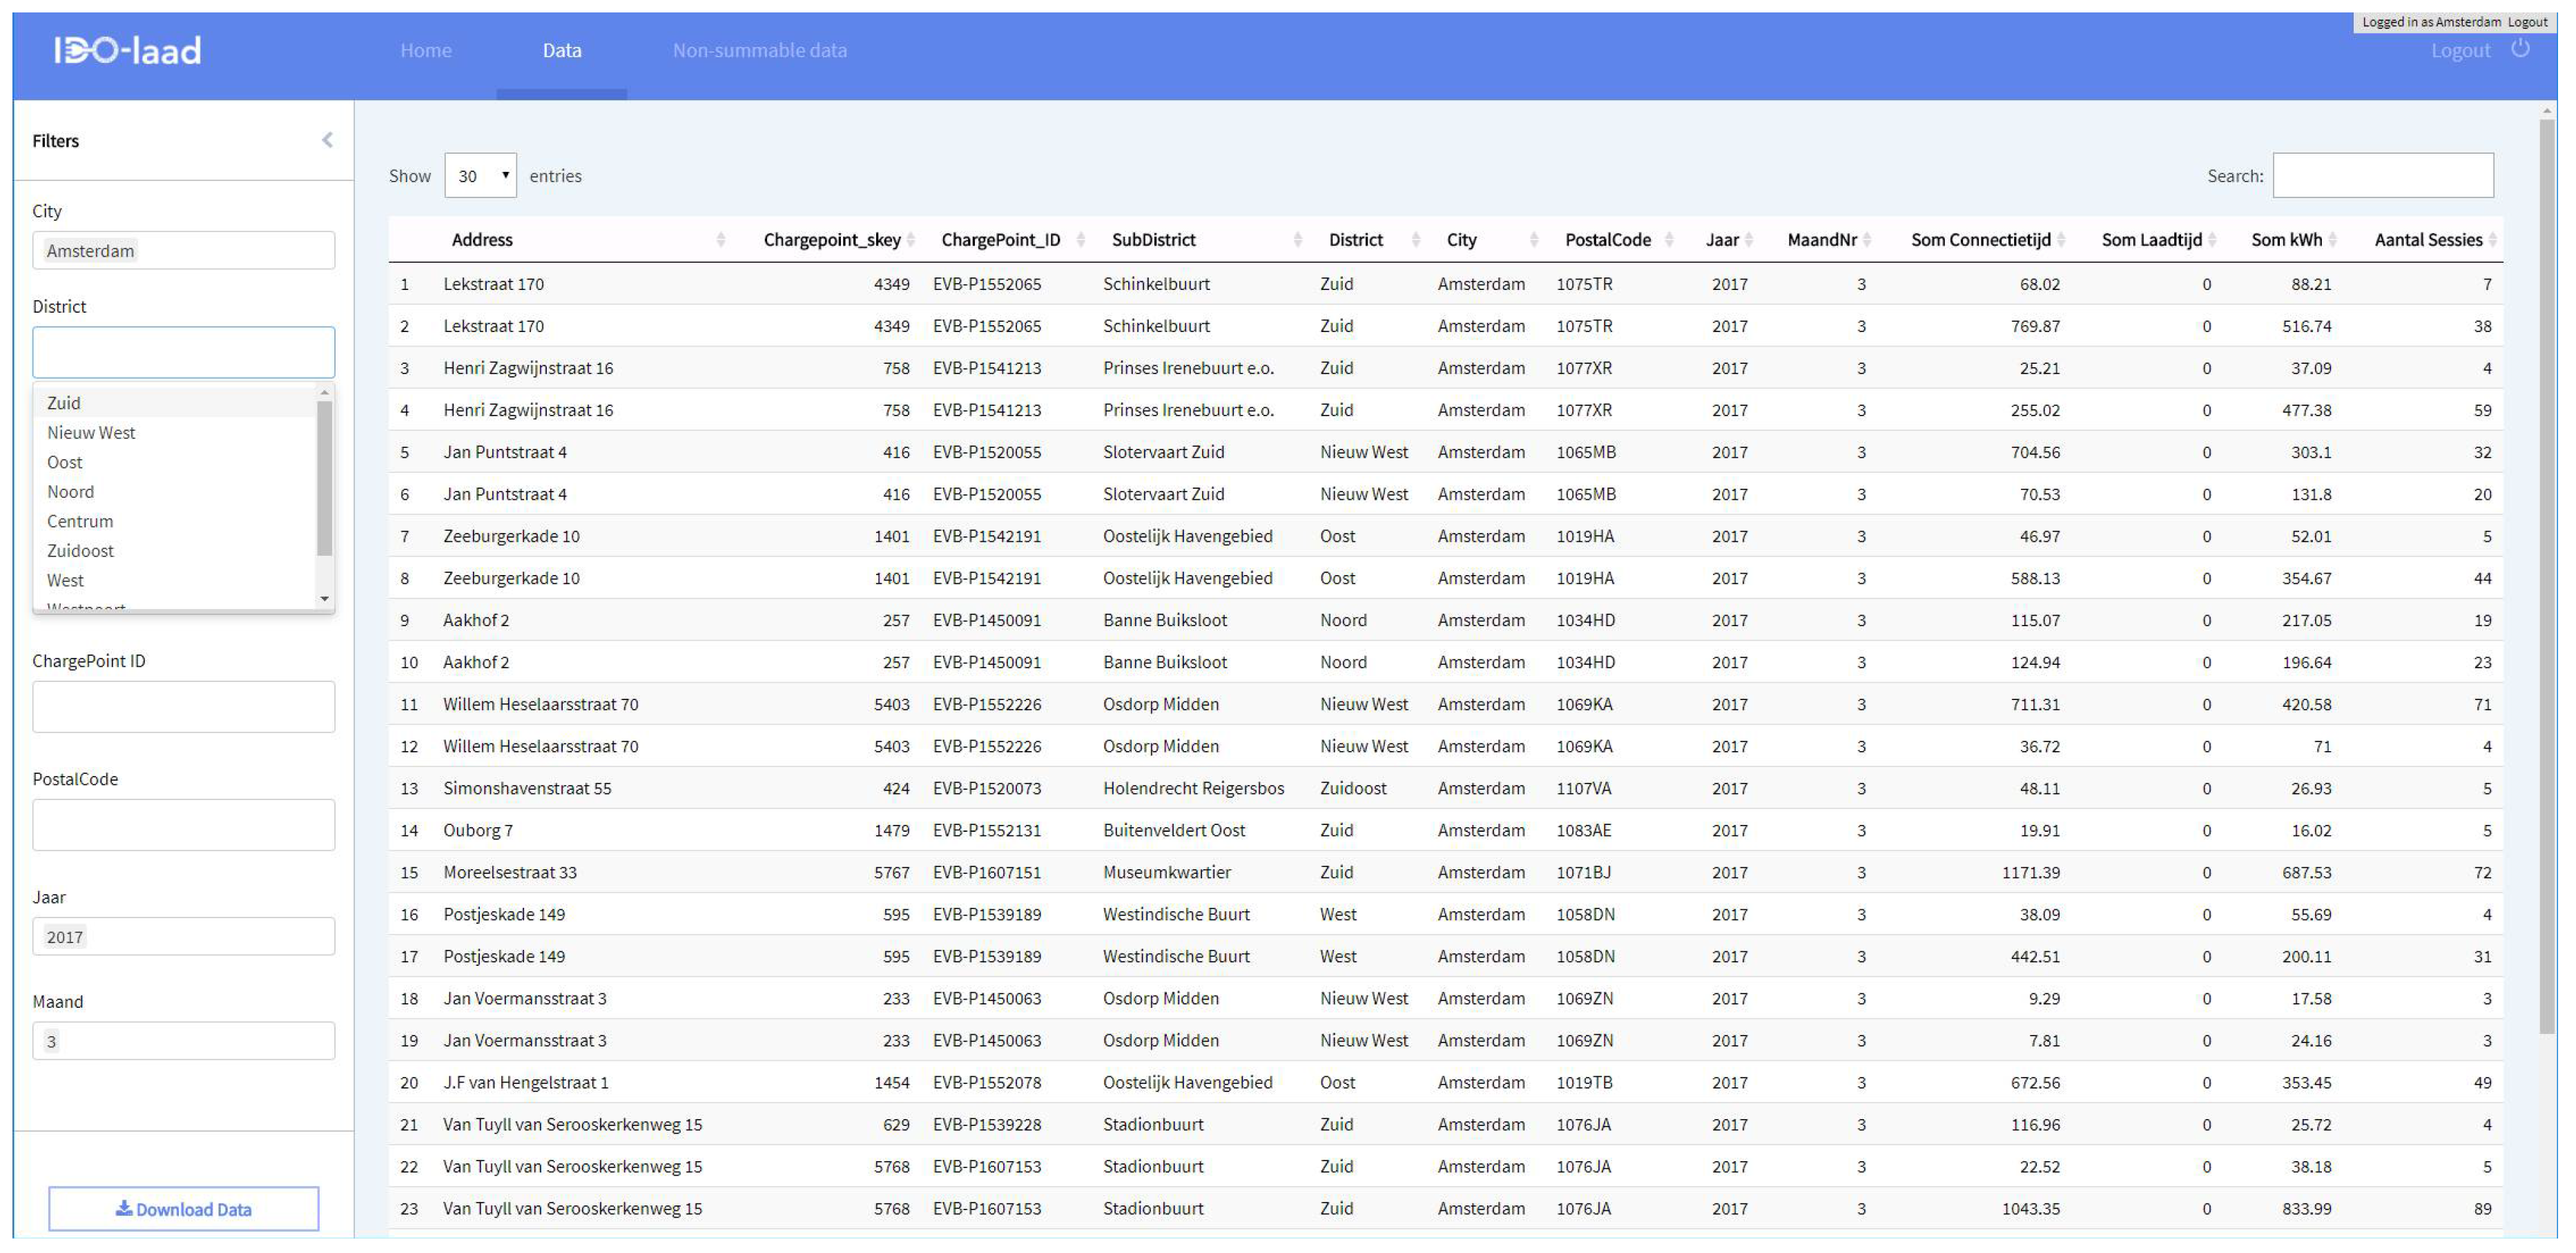
6.1. KPI Tables
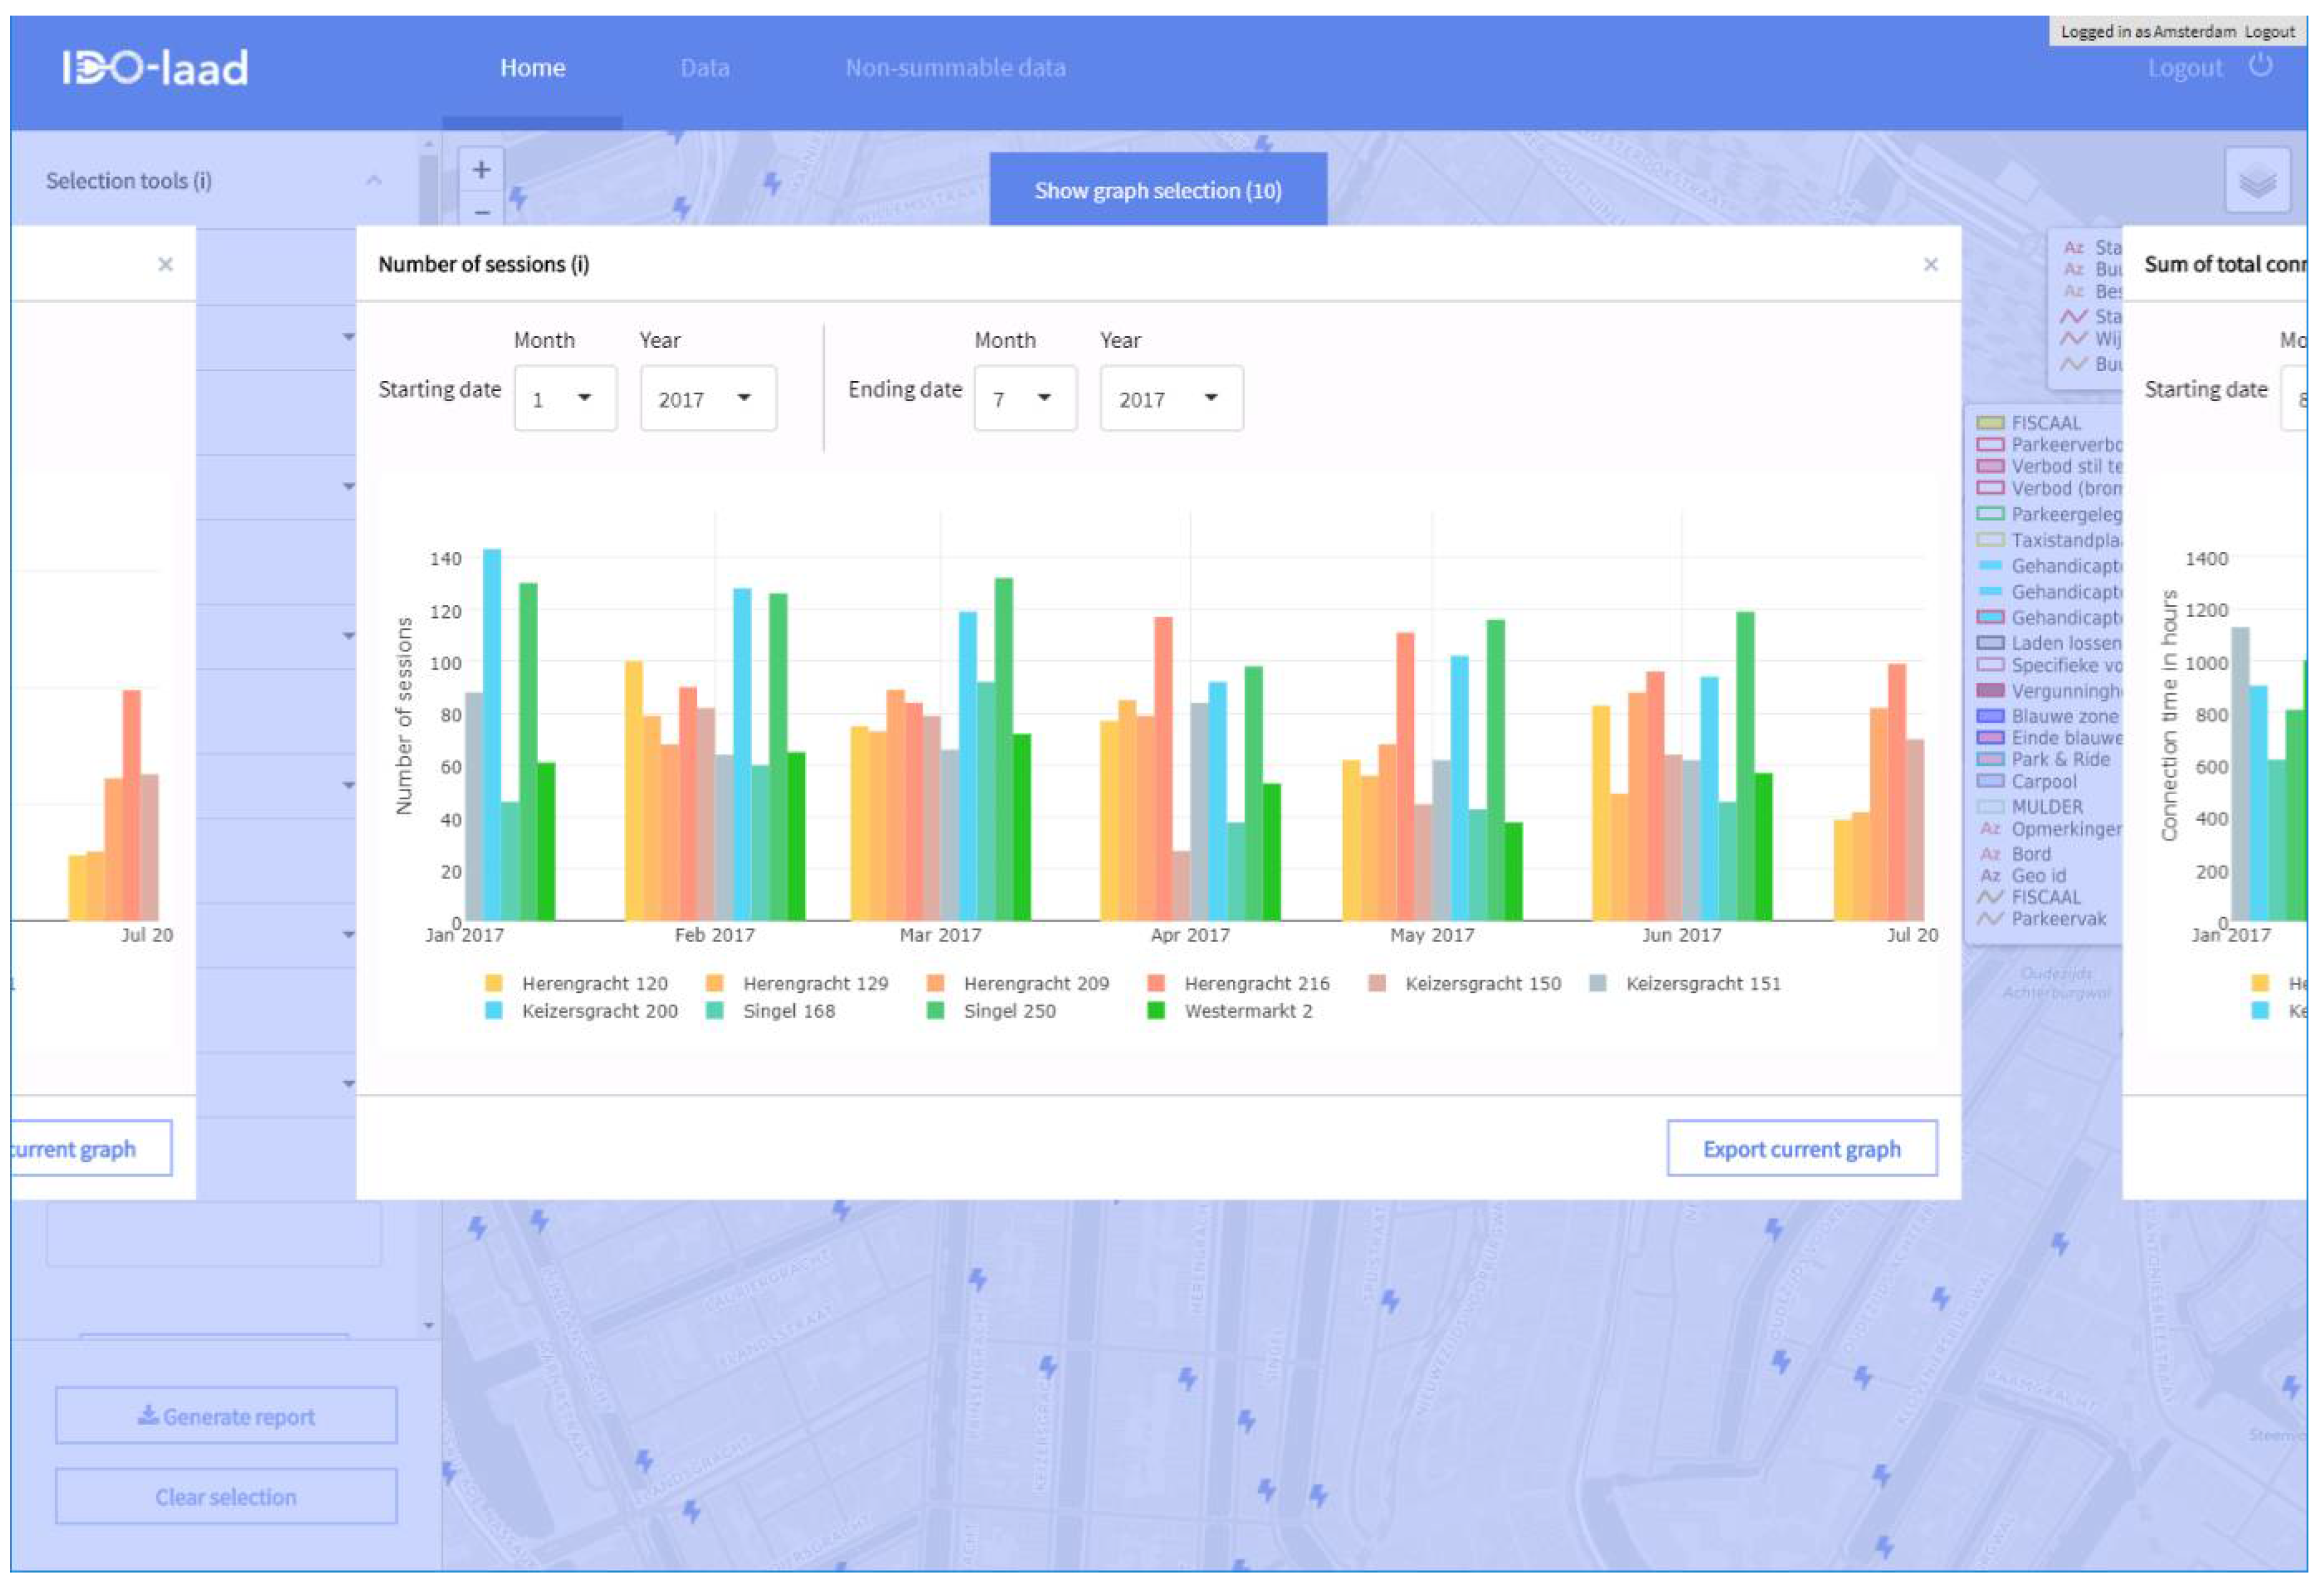
The KPI tables were diverted to one table showing summable KPIs (kWh, connection time, charging time, number of sessions) and one table showing non-summable KPIs (number of unique users per month, average occupancy). KPIs were represented per charging location and per month. By selecting the required time period (year, month) and required location (city, district, neighborhood or address/postal code), a user can compose and export or download specific KPI lists (
Figure 4).
6.2. Map
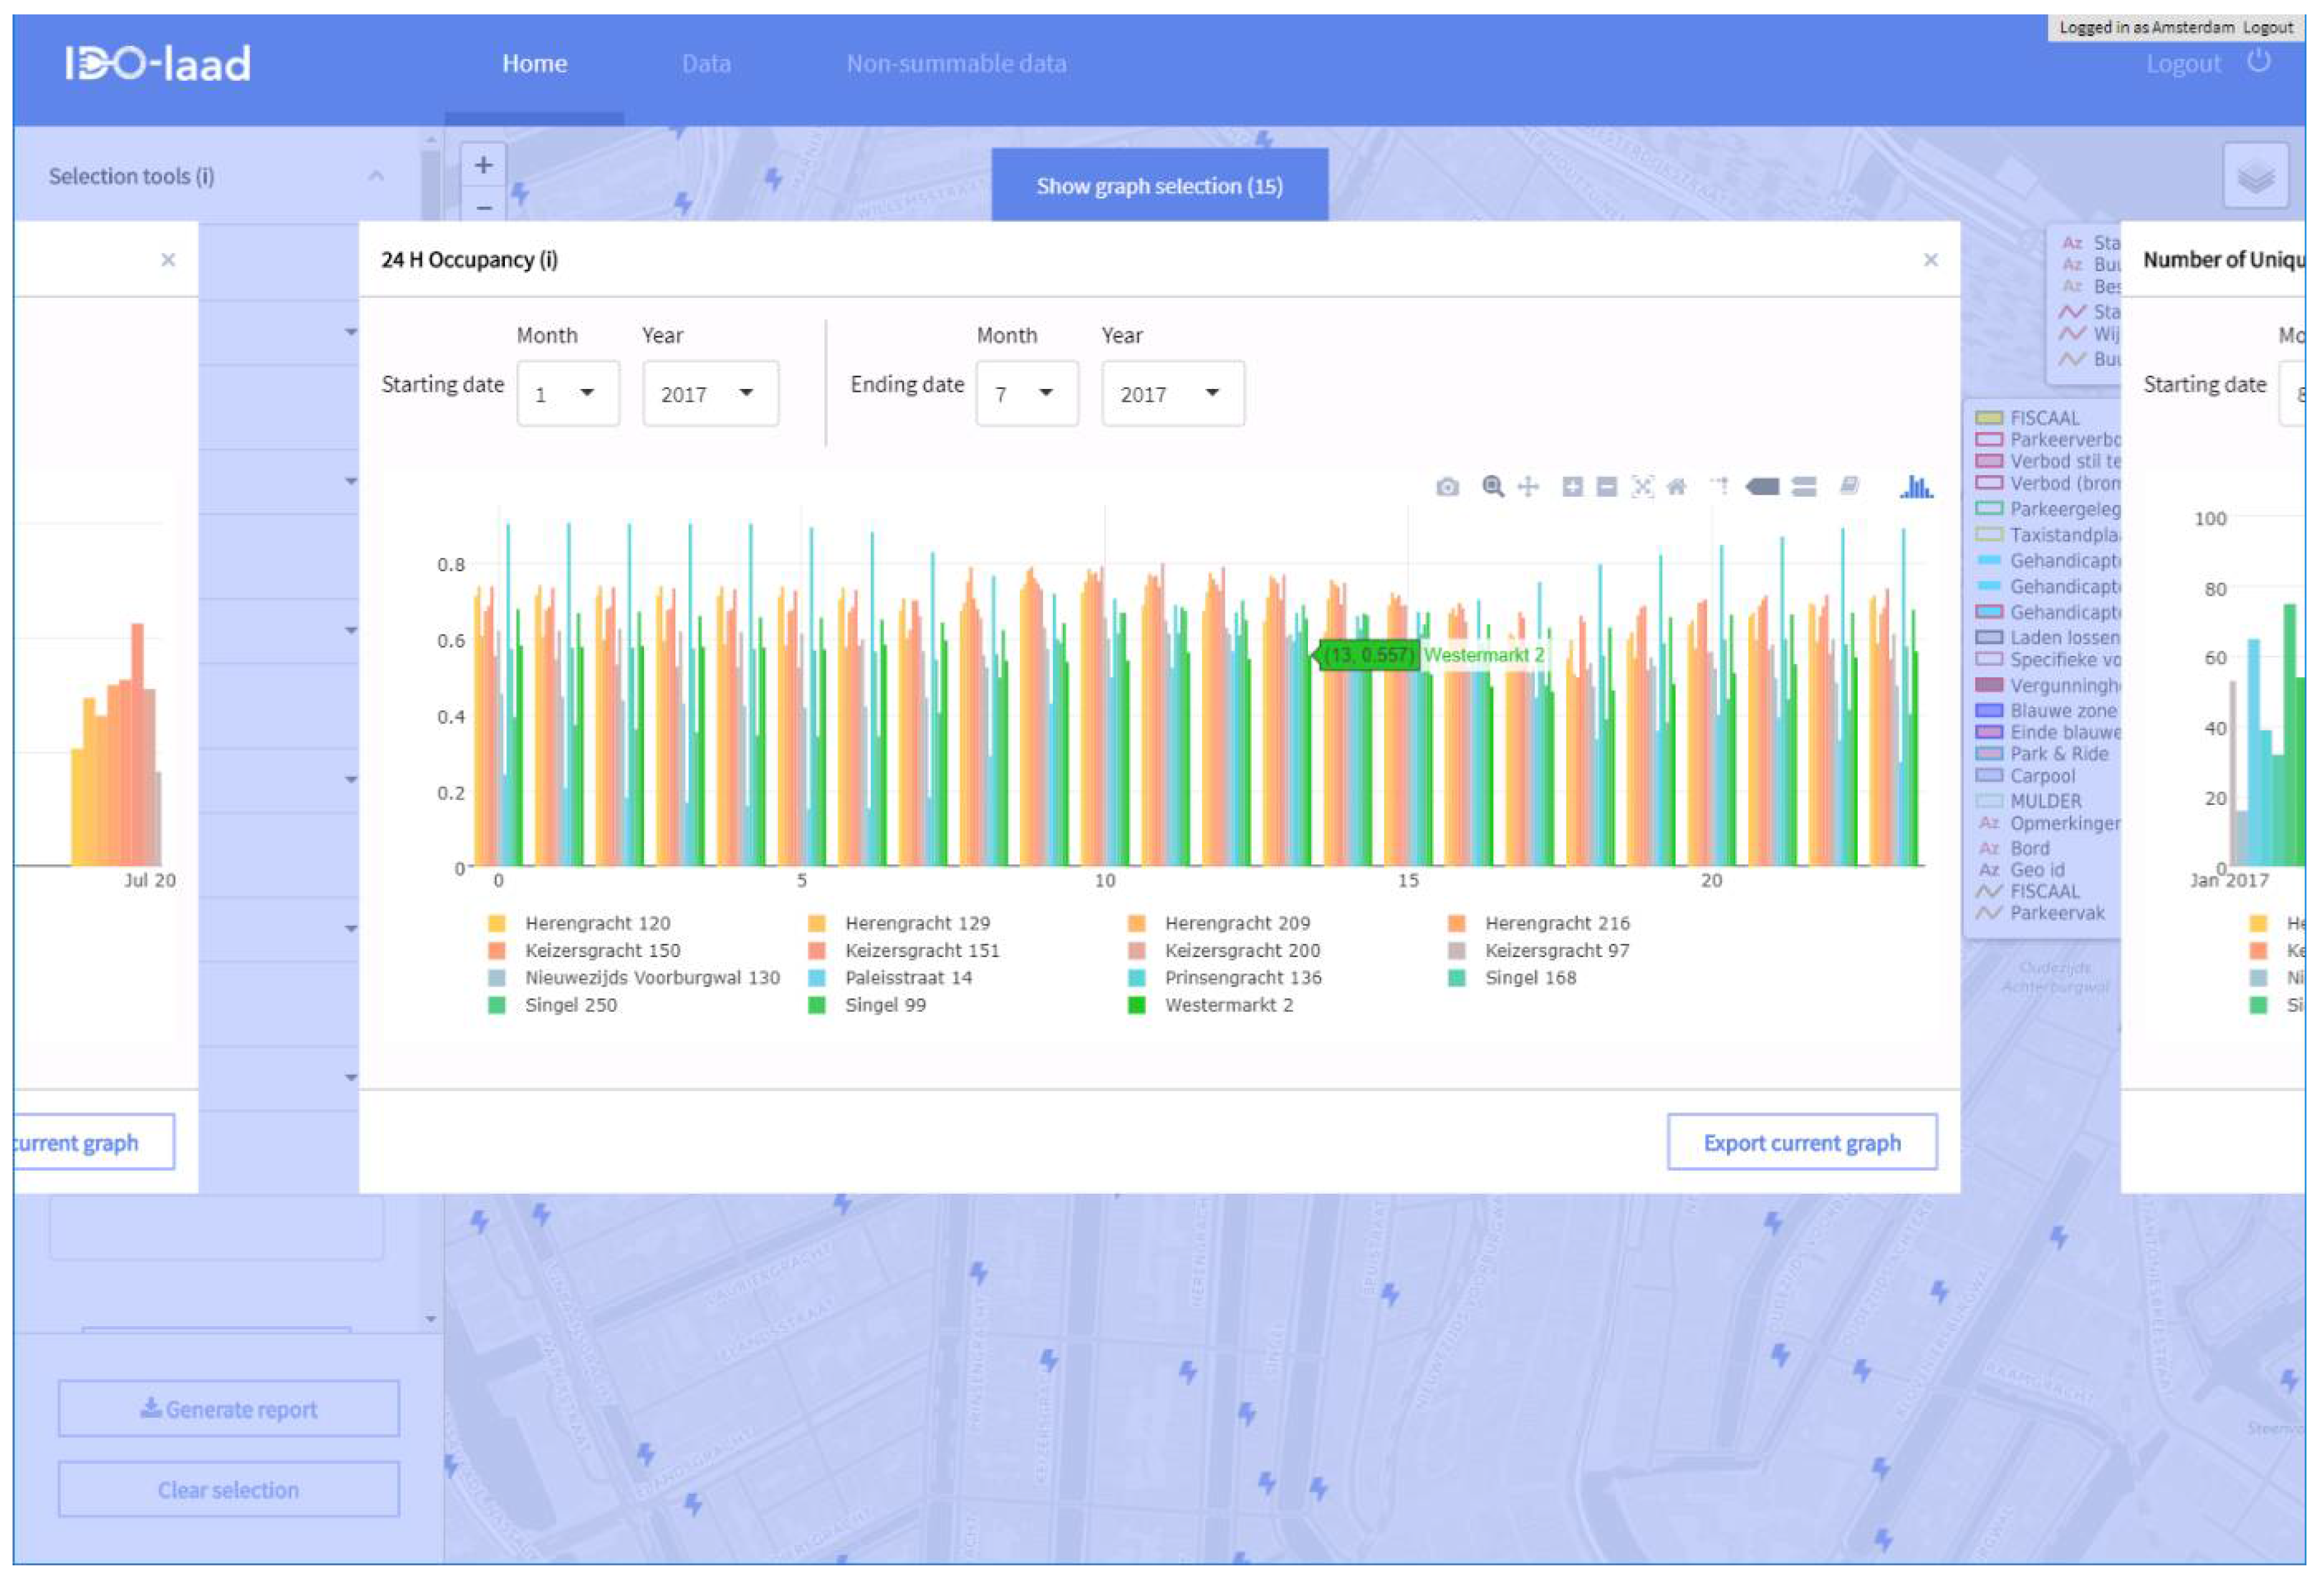
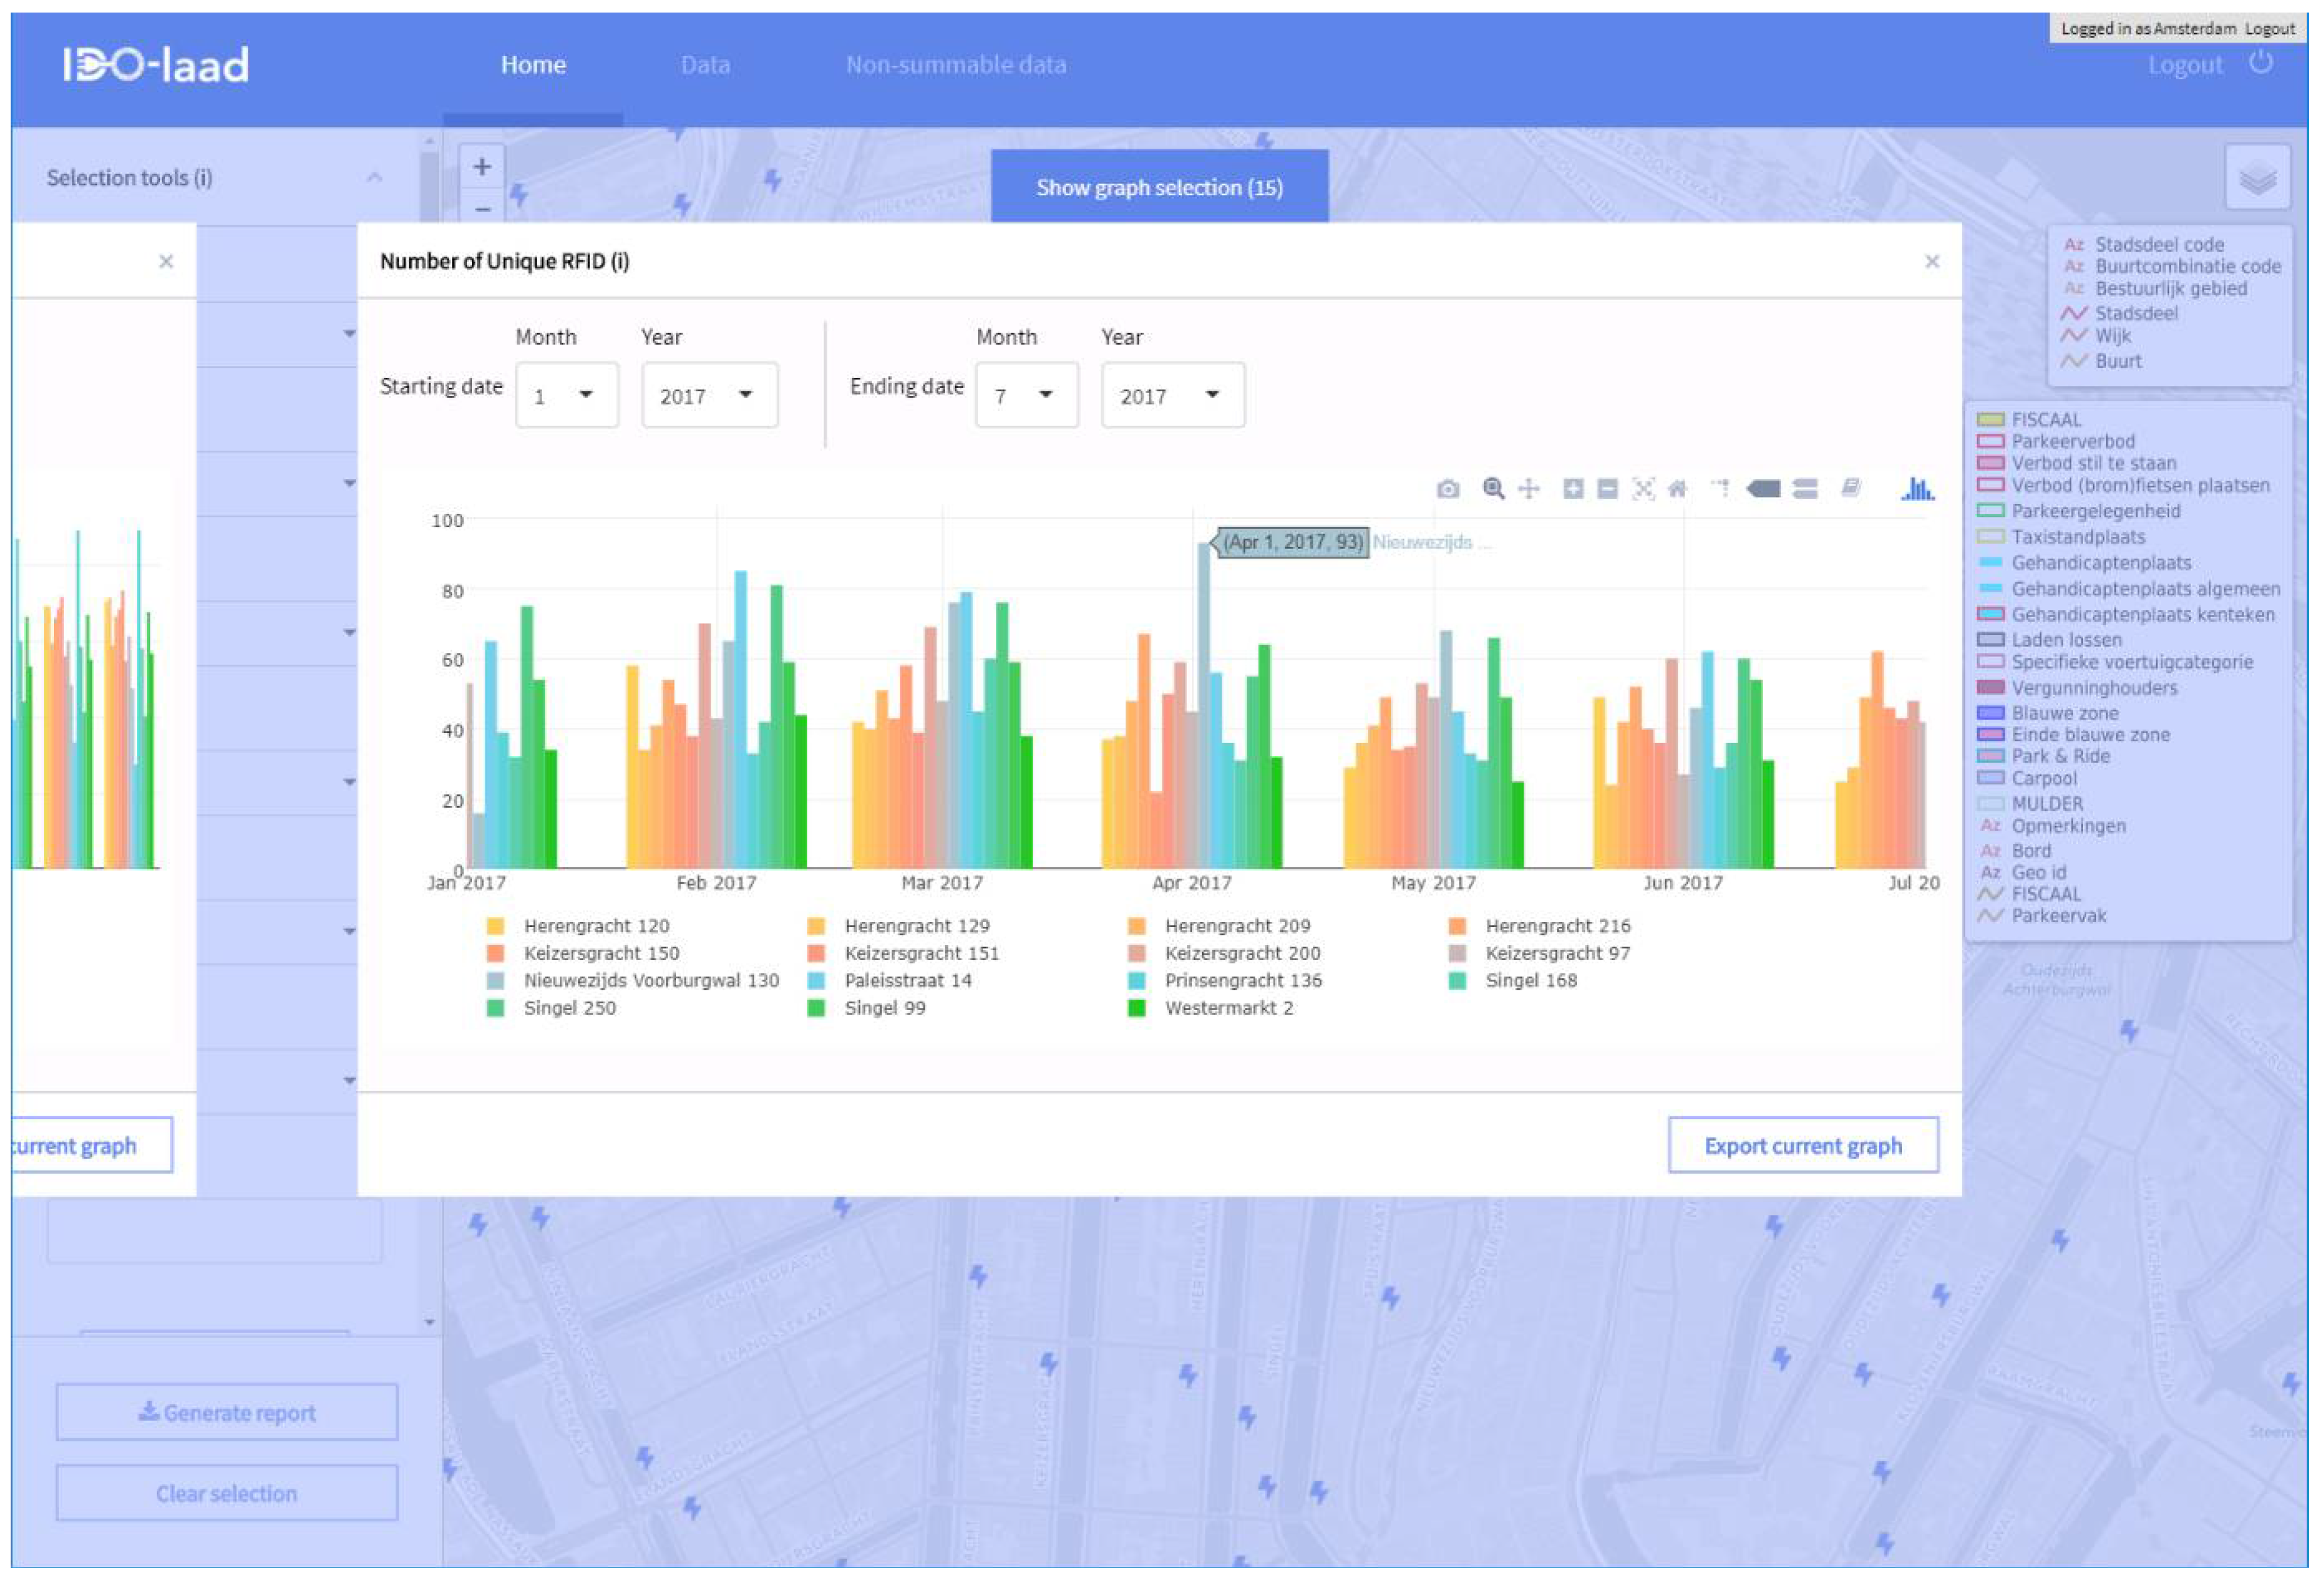
6.2.1. Map-Based Selection of Charging Locations
The map provided an intuitive interface for selecting the desired charging locations quickly to assess and compare performance. The search field facilitated zooming in on the map based on address. Using polygons, circles, rectangles, and mouse-clicks, surrounding charging locations could be selected. Once a charging location had been selected, the “show graph selection” button appears in the center bottom of the map. By clicking this button, the KPI graphs of the selected charging locations appear. The graphs were interactive: the number of selected charging locations could be adjusted by clicking the graph-legend, the timeline can be adjusted using the month and year selection box or the zoom button in the top right corner of the graph, or simply by dragging a rectangle using the mouse. Once adjusted, all KPI graphs adapted to the adjusted values. KPI values for a certain month popped up by moving the mouse-pointer over the graph.
6.2.2. Selection Tools
The selection tools tab in the top-left corner contained six choices for selecting clusters of charging locations. It set on which location level you wanted to calculate KPIs, and which part of the charging infrastructure you wanted to see on the map based on:
Location level (address, neighborhood/sub-district district, or city),
Project (shows all charging locations part of a project/experiment),
Charge Point Provider (shows all charging locations of the selected CPO),
Use type (shows all charging locations used by the selected usergroup),
Fastcharger (shows only fastchargers on the map),
Chargehub (shows only chargehubs—e.g., a clusters of charging points—on the map).
After selecting a level in “location level”, KPIs were calculated based on all charging locations in the cluster, e.g., the district, sub-district, or city in which a selected charging location was situated.
6.2.3. Assessment Tools
“Filter based on KPI”: Changed the color of the charging location markers in the map based on the selected KPI, year, month, and KPI thresholds. Having set the KPI thresholds, the charging locations performing below the minimum threshold color were green, orange if the performance of a location fits the installed range, and red if the location performed above the maximum threshold of the installed range.
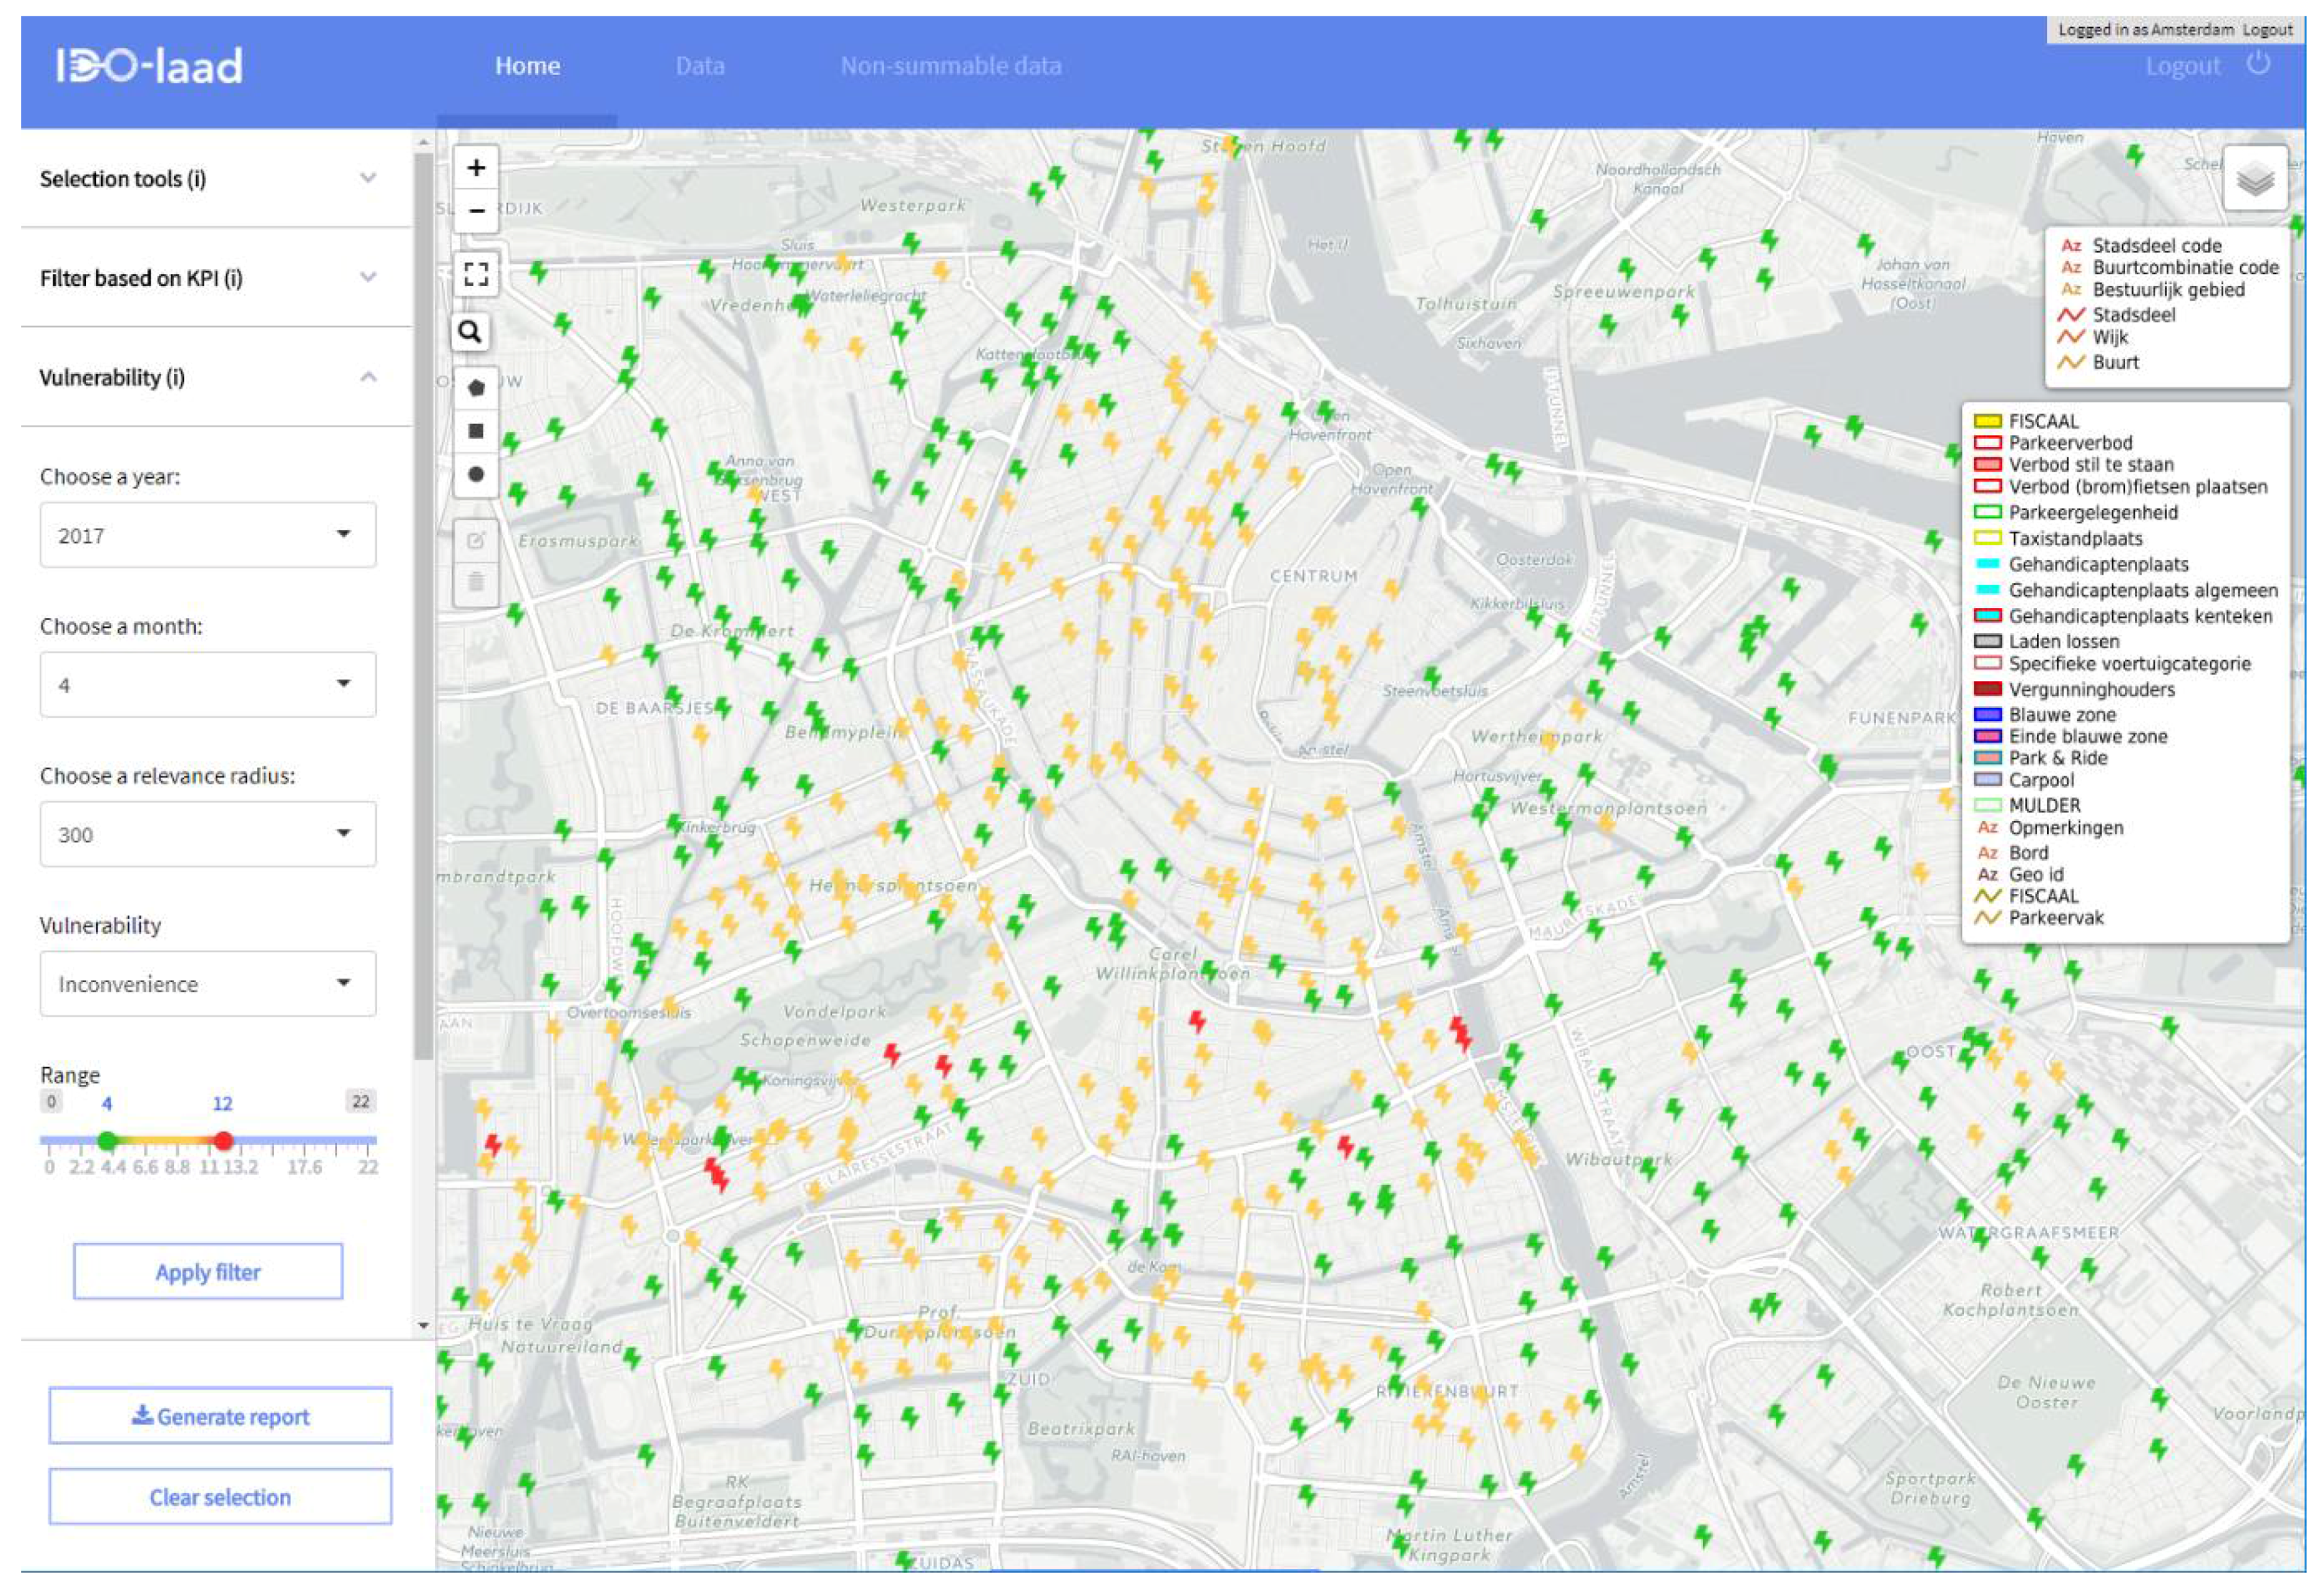
“Vulnerability”: Using the principle of cascading failure, the effect of “competition” for usage of a charging location by EV users was measured by this assessment tool. If a charging location was not available (out of service or occupied), regular sessions could not be fulfilled at the desired location. Users search for an alternative location within a certain walking distance. Based on the historic charging data of a selected month, the vulnerability tool calculated two indicators: service failure and inconvenience. Service failure indicated the fraction of regular sessions of a charging location during the set year and month that could not be transferred to other charging locations within the set radius. Inconvenience counted the number of charging sessions having to transfer to an alternative location within the set radius during the set year and month. The more charging sessions having to be transferred, the more users were being affected.
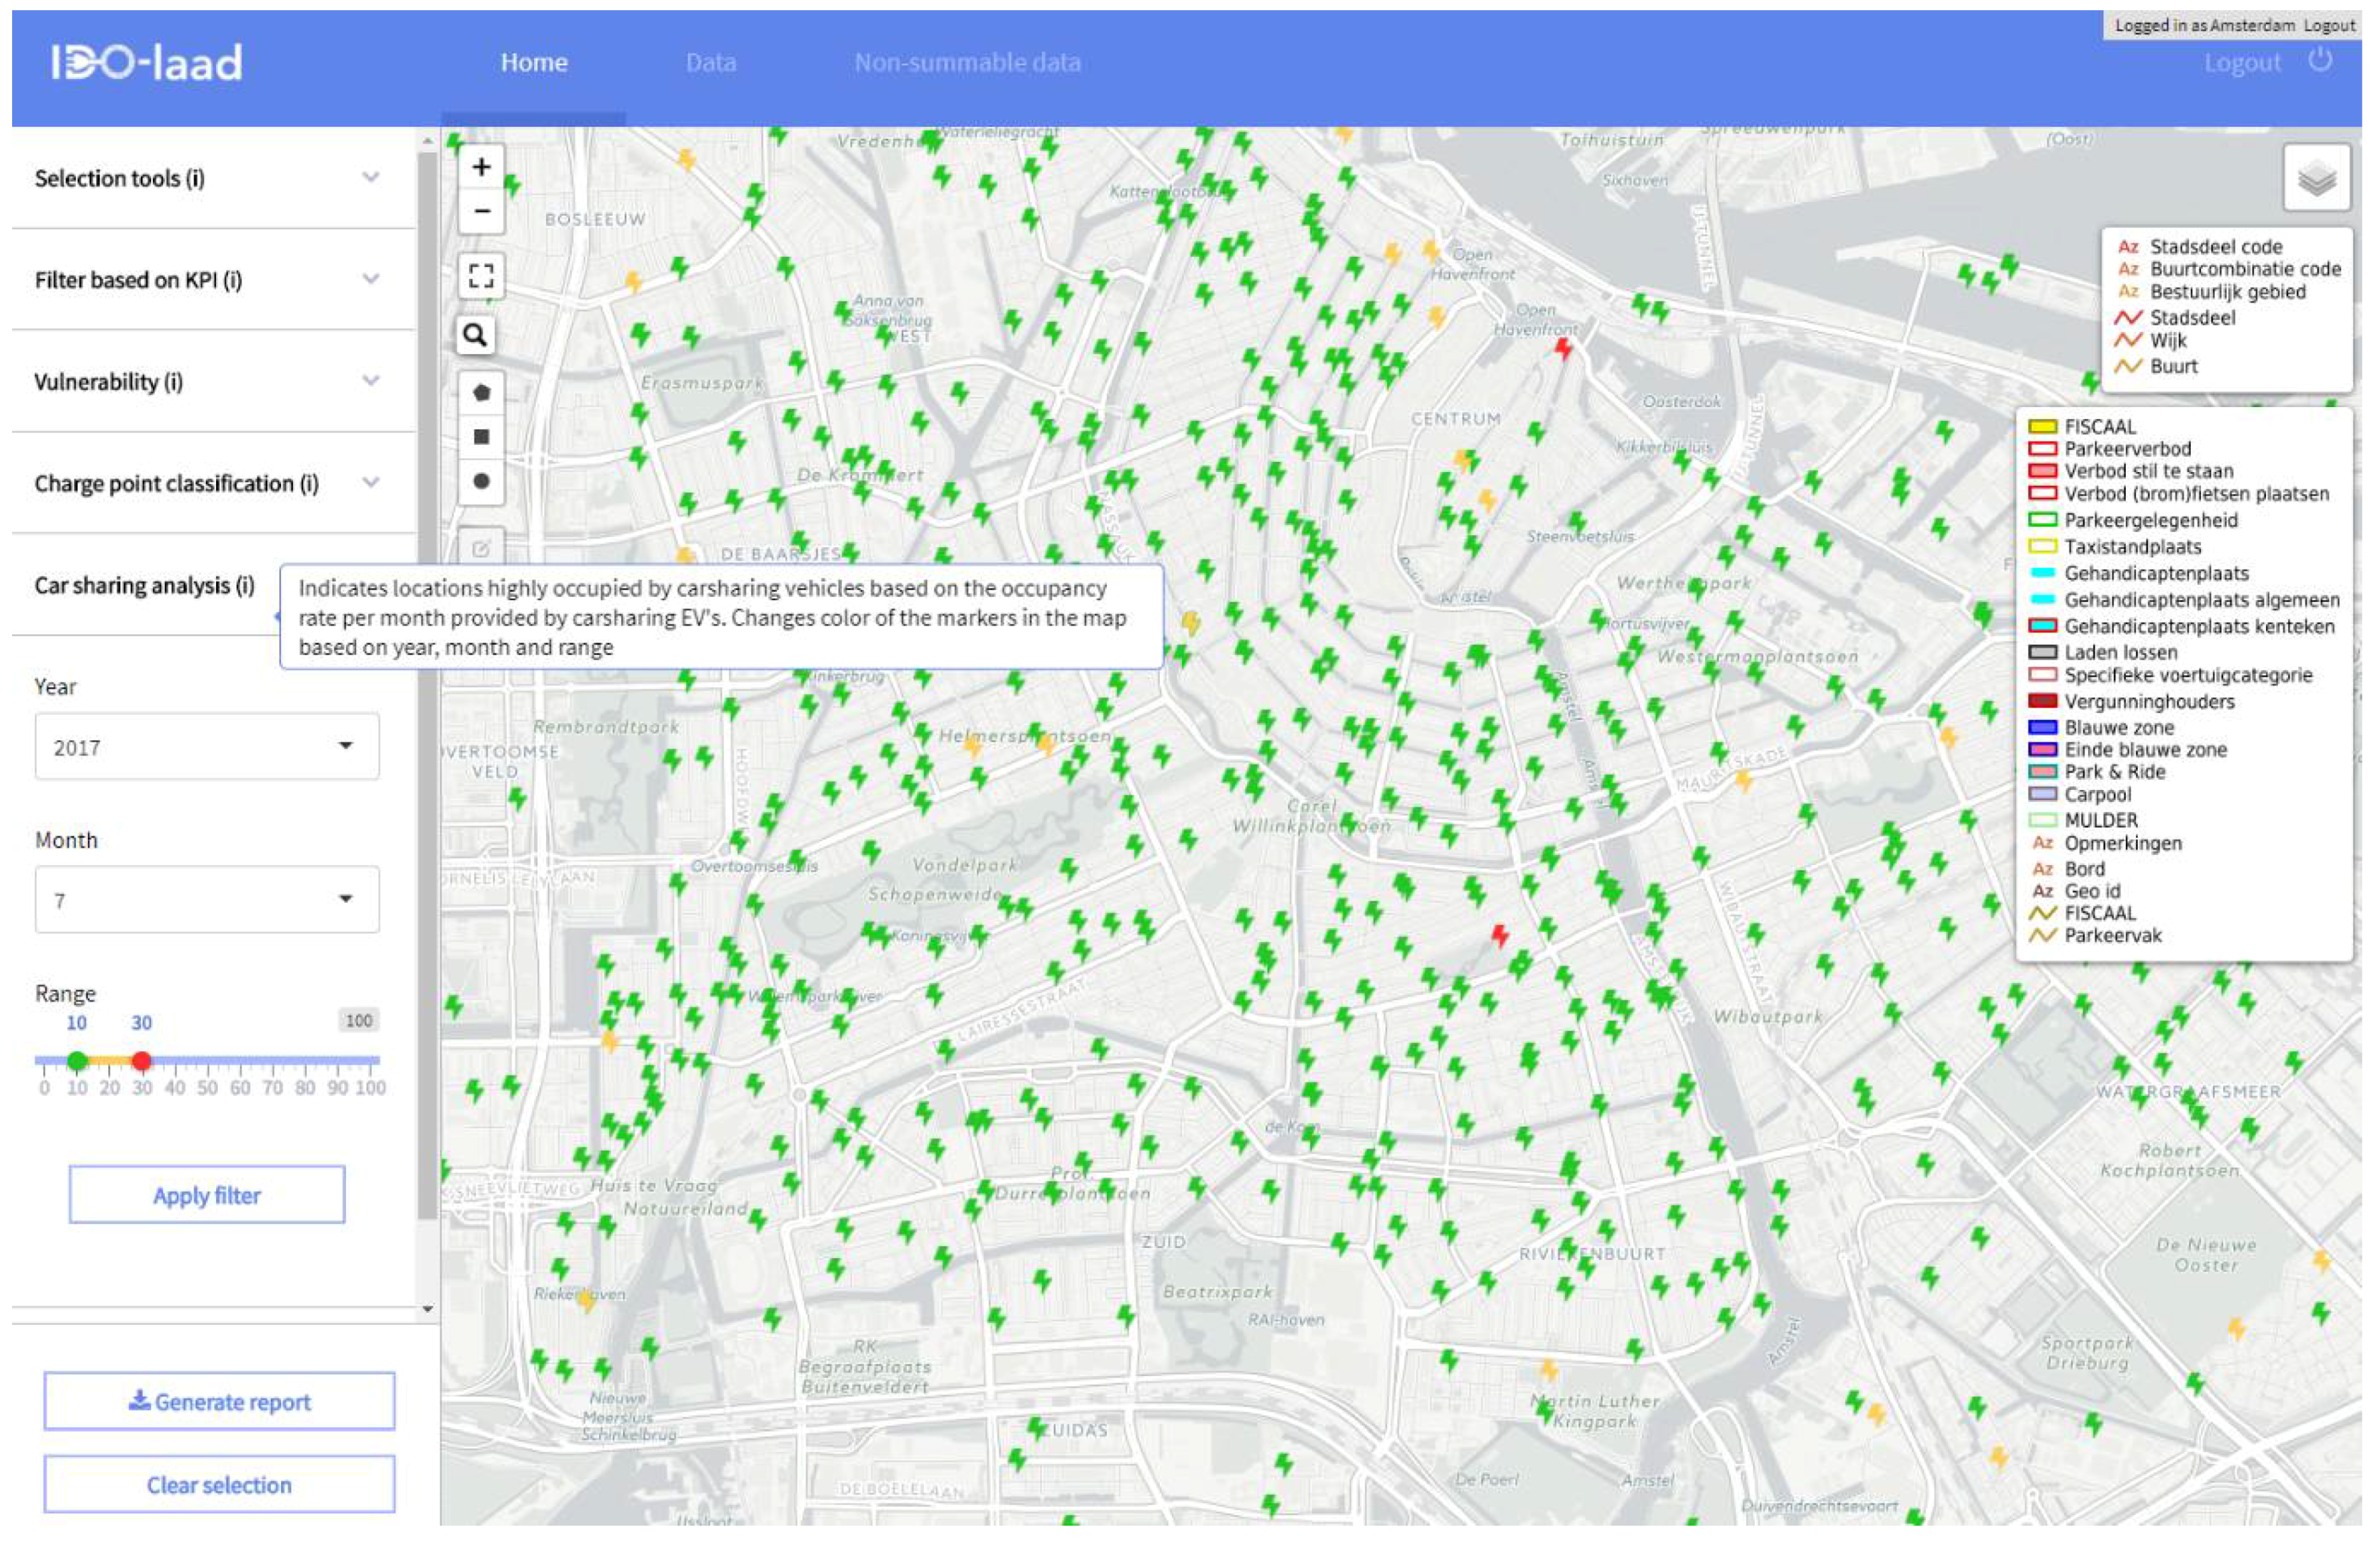
“Car sharing”: Indicated locations that were highly occupied by vehicles as part of a free-floating car-sharing scheme. Depending on the set thresholds for the minimum and maximum occupancy rate caused by free-floating car-sharing at a charging location, the charging locations on the map color green, yellow, or red.
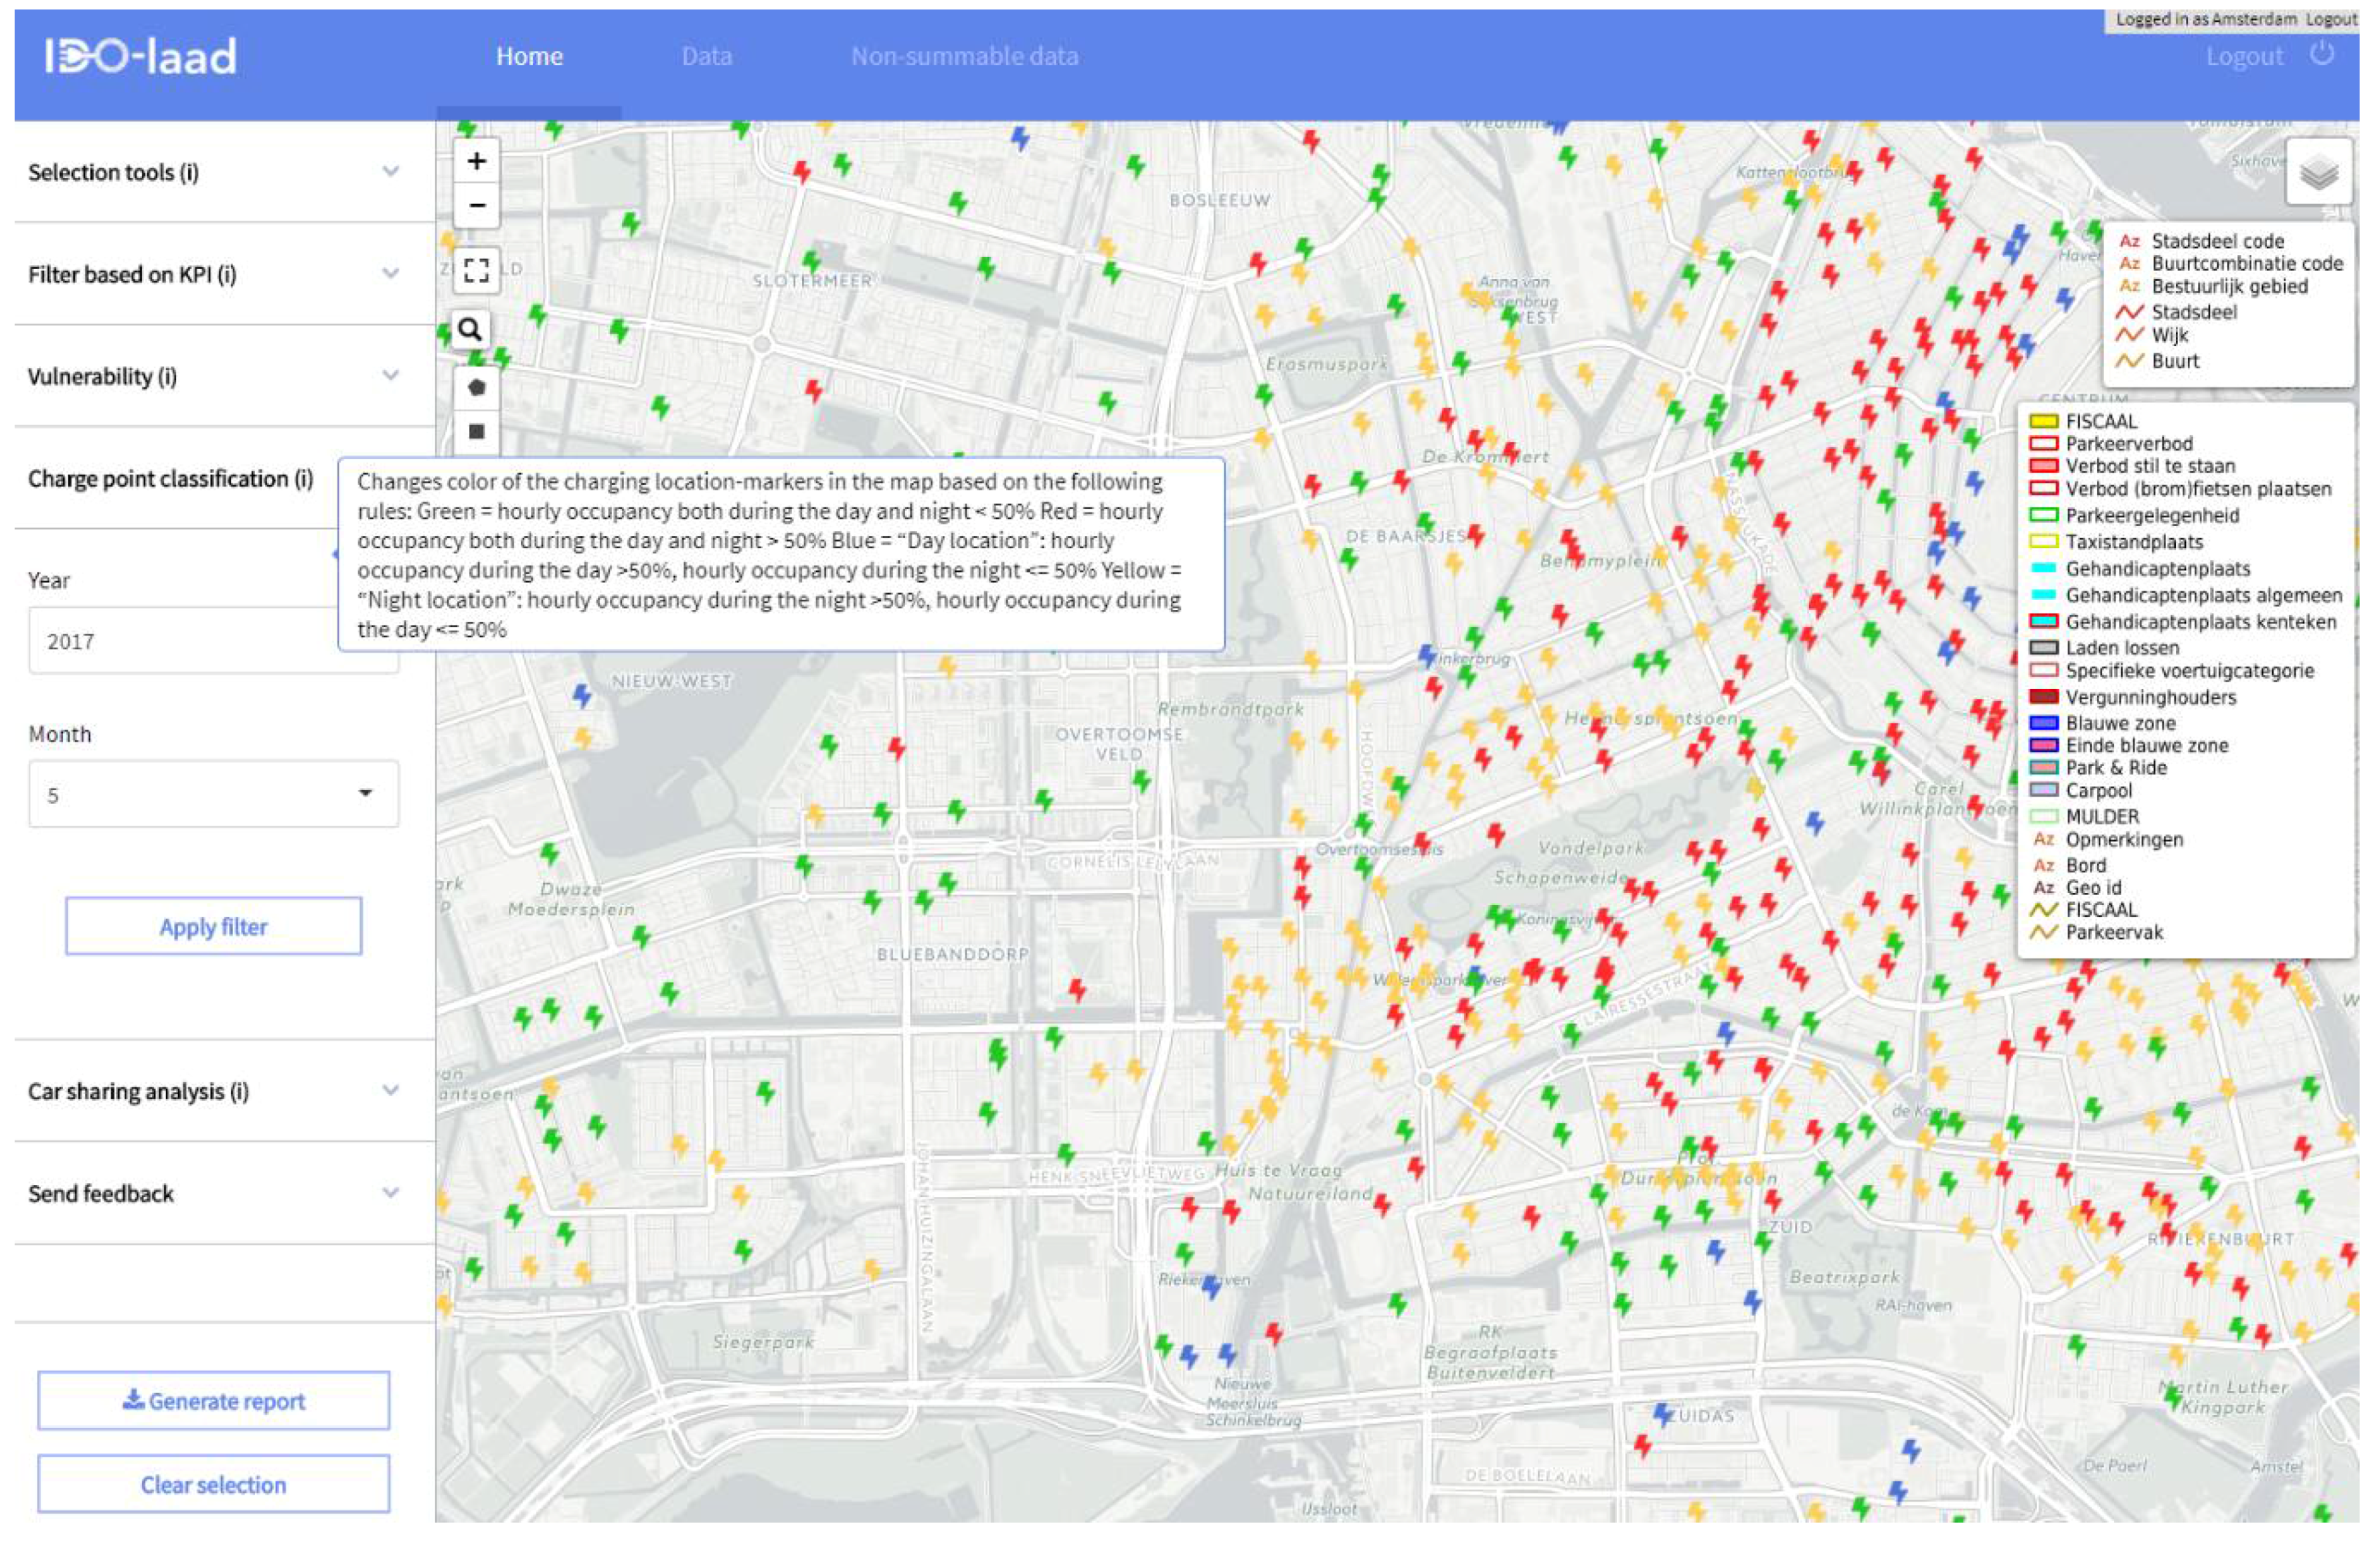
“Charge Point Classification”: Changed color of the charging location markers in the map based on the following rules:
Green = hourly occupancy at the charging location was less than 50% both during the day and night
Red = hourly occupancy at the charging location was larger than 50% both during the day and night
Blue = “Day location”: hourly occupancy during the day was more than 50%, whereas hourly occupancy during the night was less than or equal to 50%.
Yellow = “Night location”: hourly occupancy during the night was larger than 50%, and hourly occupancy during the day was less than or equal to 50%.
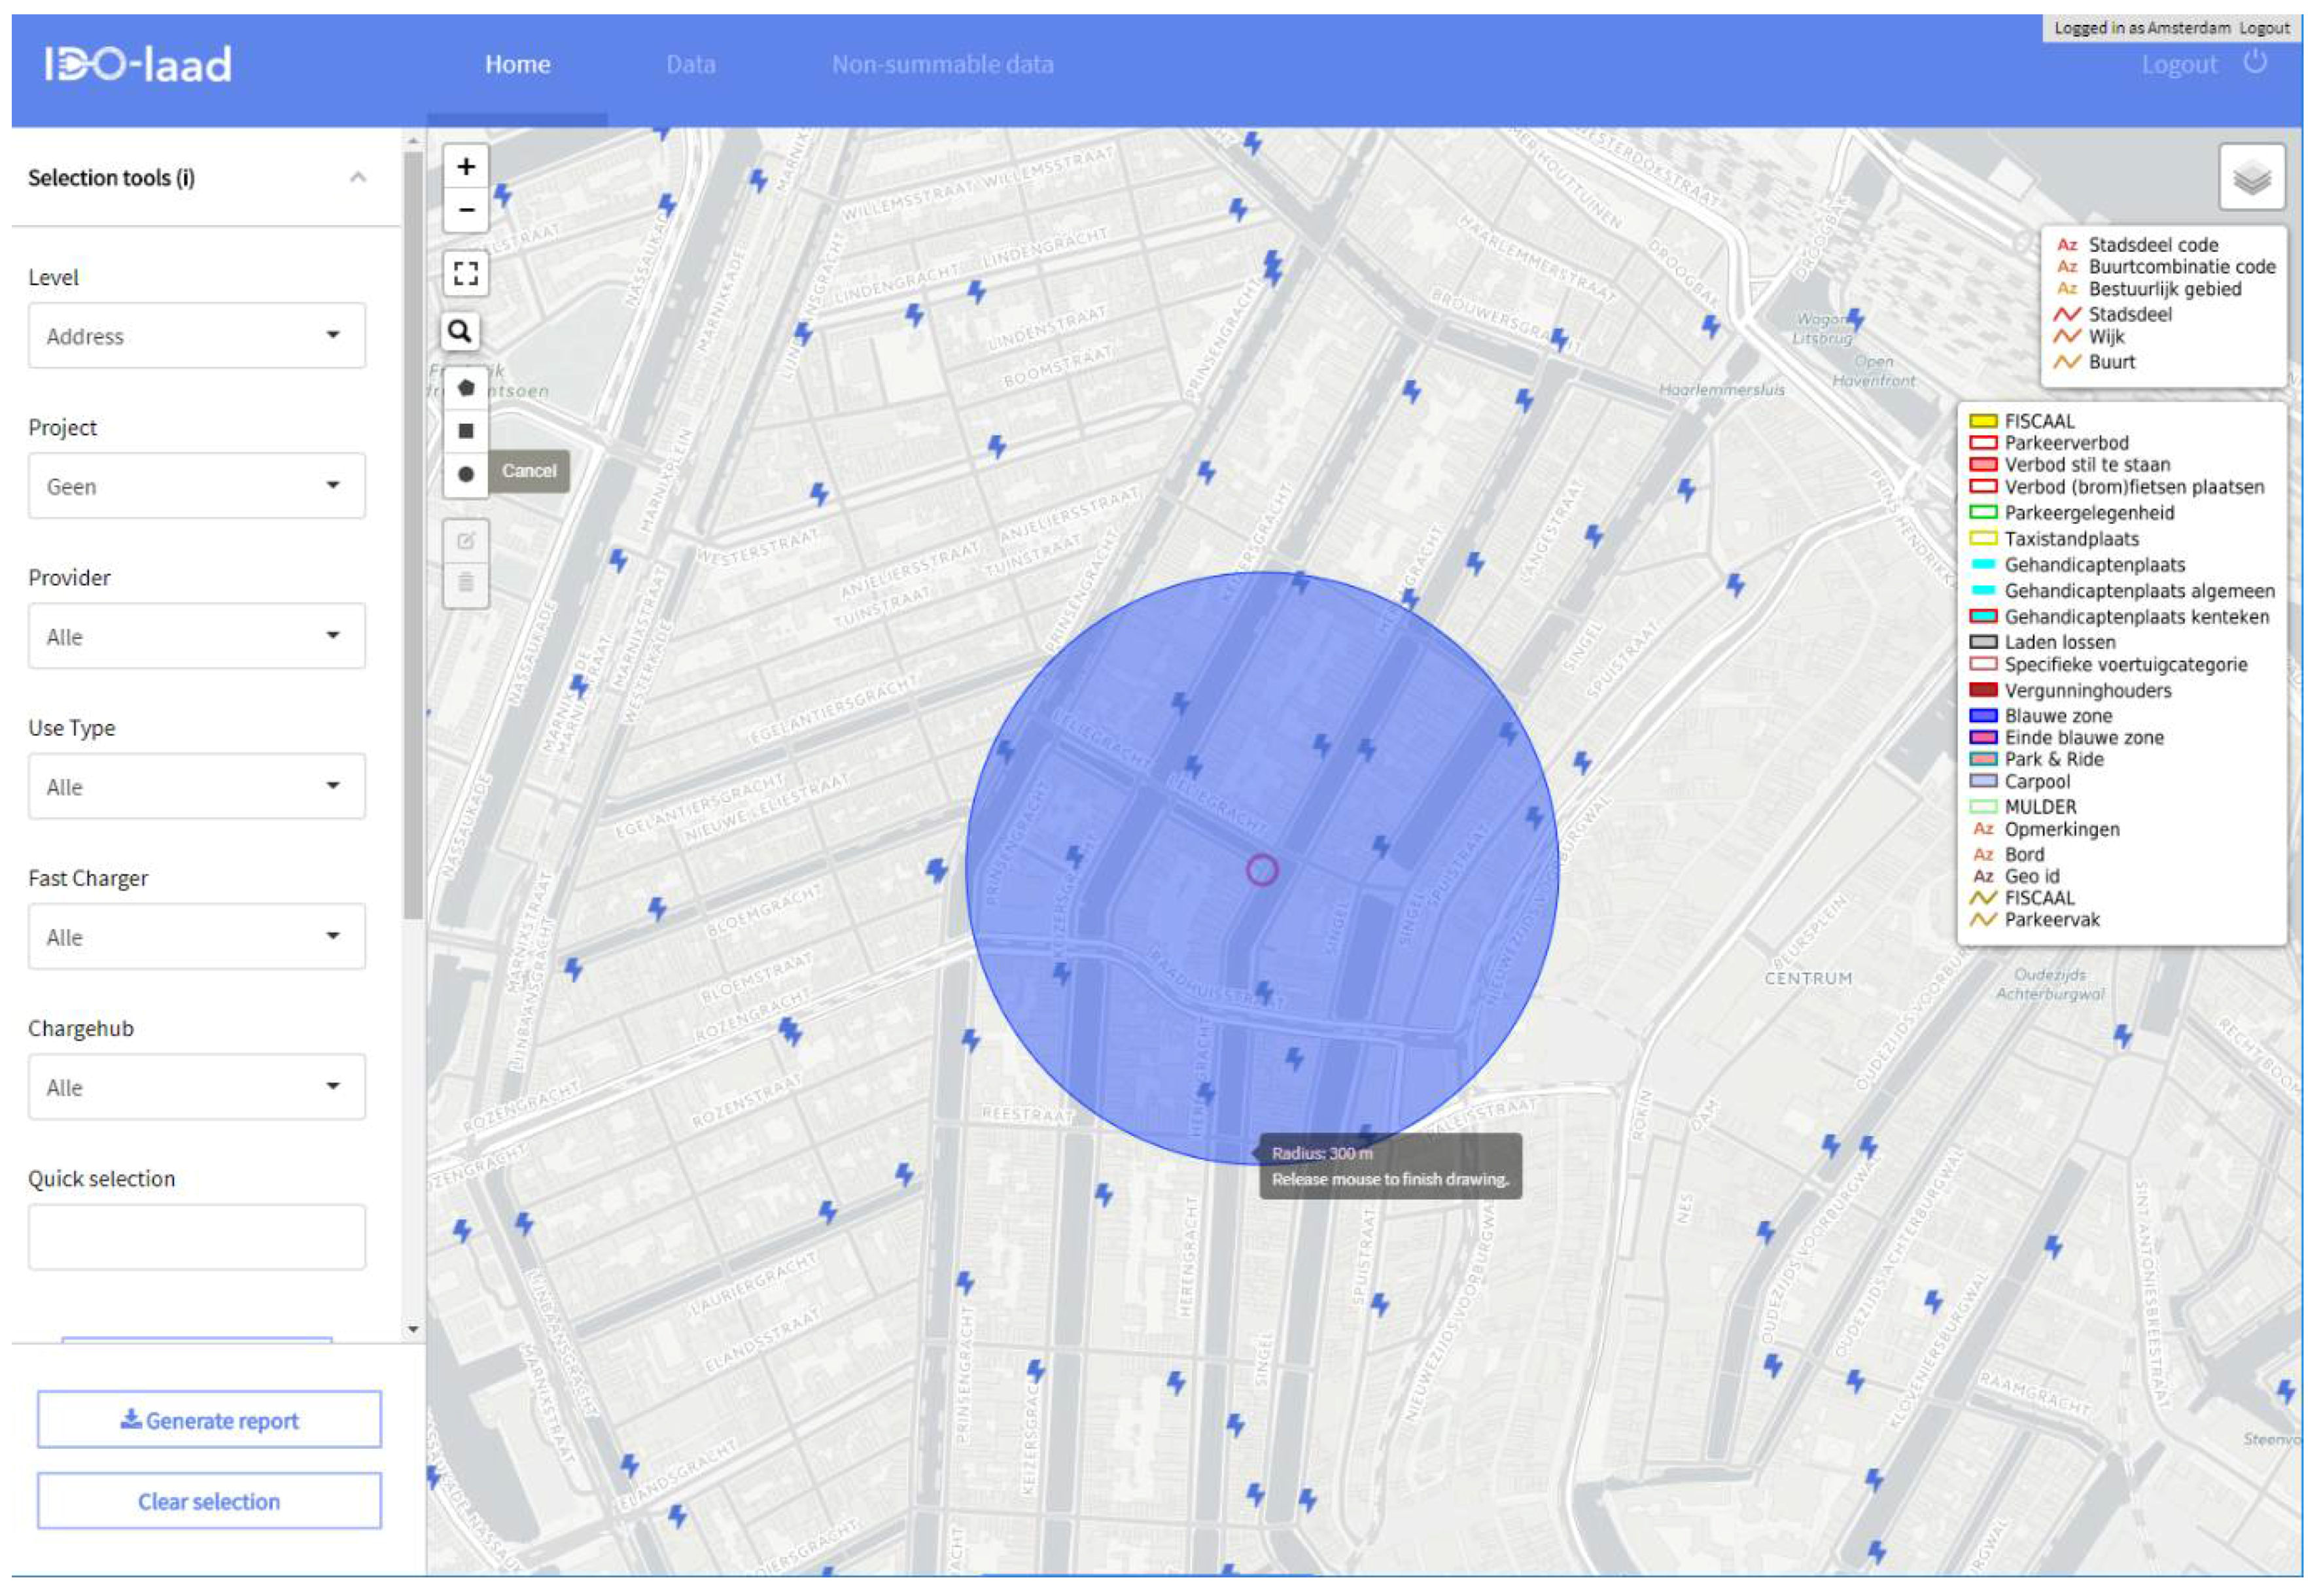
7. Implementation of the Assessment Platform for a Demand-Driven Expansion of CI
Citizens living and companies located in Amsterdam, Rotterdam, and Utrecht could send a request for a public charging point to their municipality. Once a request was received and validated, two main questions had to be answered: (1) Is charging infrastructure present or planned within a radius of X (in most cases a radius of 250 to 300 m meter from the requester’s address was taken into account); and (2) Does the performance of the nearby infrastructure justify expansion of the infrastructure?
Figure 5,
Figure 6,
Figure 7 and
Figure 8 illustrate how the assessment tool was being used by the roll-out practitioner.
After having checked the performance results, as shown in the above figures, the practitioner balanced the various KPIs and either proposed a new location to the various stakeholders or declined the request. In both cases, KPI reports and maps provided important information supporting the decision and convincing the stakeholders. Downloads could be made either by clicking the “generate report” button or using the “export graph” button in graph mode. If stakeholders did not approve the proposed expansion, iterations took place assessing the infrastructure performance and arguments were gathered based on the charging data represented in the assessment tool.
8. Implementation of the Assessment Platform for the Detection of CI Bottlenecks
With a dense charging infrastructure in place and growing numbers of electric vehicles on the road, it became crucial for the roll-out practitioner to regularly assess the charging infrastructure on potential bottlenecks. This was in order to be able to anticipate and keep the roll-out of charging infrastructure in pace with the growing need for it.
8.1. Vulnerability Tool
The vulnerability tool, as described in
Section 6.2.3, provided the opportunity to assess the performance of the infrastructure, add new users, or in case charging locations were out of service. At vulnerable charging locations, expansion might have been considered depending on the number of affected users in case of service failure, whether a new user entered the infrastructure, or the fraction of sessions which could not be fulfilled by the infrastructure.
Figure 9 represents a practical use case for the vulnerabily tool. Further development of the algorithms behind the tool are being considered by the developers: e.g., creating the opportunity to add a charging location in the tool manually and testing the effect on the vulnerability scores.
8.2. Charge Point Classification Tool
Another tool used for the detection of potential bottlenecks in the infrastructure was the charge point classification tool. After selecting the desired year and month and clicking the “apply filter” button, a visual overview was generated on the map indicating the level of average occupation during the day and night of each charging location. The threshold of 50% was set by the practitioners as a relevant trigger in case of a new request. In case all charging locations within 300 m walking distance from the requester’s address showed an average occupancy of more than 50%, a new charging station would be installed. If the charging infrastructure had the capacity to serve a new applicant (in case there was a charging station within walking distance with an average occupancy of less than 50%), the applicant would be referred to this particular charging station. Red highlighted charging locations had an hourly occupancy rate of over 50% both during the day and the night. Once the red locations had been detected (see
Figure 10), the roll-out practitioner could start to evaluate single locations by checking their number of unique users, kWh charged, etc., in order to make an informed decision whether to expand the charging infrastructure in order to avoid problems in the future.
9. Implementation of the Assessment Platform for the Strategic Expansion of CI
Strategic expansion captures a wide range of possible strategies to develop and expand the charging infrastructure. The current version of the assessment platform provides general knowledge to inform a chosen strategy. Assessment tools based on forecasting or simulation models/algorithms can be implemented in the web application on request. The car sharing tool is an example of a tool developed on request in order to evaluate a chosen strategy (
Figure 11). The tool creates insight in at which locations vehicles part of a free-floating car-sharing scheme charge, and to which extent they contribute to the occupation of the charging infrastructure.
10. Discussion and Conclusions
The need for a roll-out of a public charging infrastructure in order to facilitate the adoption of both PHEV and BEV has been established unquestionably in the literature and formalized by the EU directive 2014/94/EU on the deployment of alternative fuels infrastructure [
1]. Concerns in rolling out CI include providing both overcapacity (too many charging points, with a limited business case and scrutiny from local community), as well as under capacity (leading to limited accessibility for EV drivers) [
20,
21]. The roll-out is a balancing act between investing to enable (candidate) EV drivers and to limit costly investments in public CI.
Design and planning methods described in the literature are based on GPS, demographic, or traffic flow data and focus on the early stages of a CI roll-out. Real-life charging data are either not available or limited in both transaction quantity and time-scale. Big data provides infrastructure developers great opportunities to optimize the roll-out of CI [
6]. The case described in this paper resulted in access to knowledge and information for CI roll-out practitioners on the performance of 8650 public charging points installed in the four largest cities in the Netherlands and the four western provinces. The assessment tool represented over 7.3 million charging sessions by June 2018.
The scientific body on the assessment of CI utilization and performance is small. In close cooperation with CI roll-out practitioners, five KPIs for the performance of a CI were developed and integrated in the assessment tool. Assessment of the CI based on these KPIs made it possible to adapt to changes—be it in society, with regard to changes in available technologies, or the behavior of people. This is a crucial act in light of the transition towards emission free transport. One limitation is that the current version of the tool does not integrate all location-specific information required in the decision process, such as the lay-out of the electricity grid, demographic information, spatial planning, and information on current and planned roadworks. Future development and research will be aimed at the elaboration of the tool to cover a larger range of information used in the roll-out process.
Since the assessment platform, its DWH architecture and the assessment tool have been designed specifically to process charging data in the form of CDRs and MVs, and the results are generalizable beyond the case study regions in the Netherlands.
Author Contributions
Conceptualization, S.M. and M.K.; Data curation, X.D.; Funding acquisition, S.M. and R.v.d.H.; Methodology, S.M.; Project administration, S.M.; Resources, S.M. and X.D.; Software, M.K.; Supervision, R.v.d.H.; Validation, X.D. and M.K.; Visualization, X.D. and M.K.; Writing—original draft, S.M. and X.D.; Writing—review & editing, R.v.d.H.
Funding
This research was funded by the Dutch “Nationaal Regieorgaan Praktijkgericht Onderzoek SIA” grant number RAAK-PRO 2014-01-121.
Acknowledgments
The platform has been developed in close cooperation with the municipalities of Amsterdam, Rotterdam, The Hague, Utrecht, and the Metropolitan Region Amsterdam Electric. We would like to thank all practitioners for contributing their knowledge and experience to our case study and the development of the assessment platform. The development could not have been executed without the municipalities of Amsterdam, Rotterdam, The Hague, Utrecht, and the Metropolitan Region Amsterdam Electric providing the charging data. Many thanks to Booreiland Digital Design Amsterdam for their contribution to the front-end design of the tool, thus improving the user experience of the tool. Concept development was supported by the practical experience and knowledge of research partners OverMorgen, Engie, and Nuon.
Conflicts of Interest
The authors declare no conflicts of interest.
References
- European Commission. Directive 2014/94/eu of the European Parliament and of the Council on the Deployment of Alternative Fuels Infrastructure 22 October 2014. Available online: https://eur-lex.europa.eu/legal-content/EN/TXT/?uri=CELEX:32014L0094 (accessed on 6 July 2018).
- Funke, S.A. Addressing the Different Needs for Charging Infrastructure: An Analysis of Some Criteria for Charging Infrastructure Set-up. In E-Mobility in Europe, Green Energy and Technology; Leal Filho, W., Kotter, R., Eds.; Springer: Basel, Switzerland, 2015. [Google Scholar]
- Huang, K.; Kanaroglou, P.; Zhang, X. The design of electric vehicle charging network. Transp. Res. Part D Transp. Environ. 2016, 49, 1–17. [Google Scholar] [CrossRef]
- Huang, Y.; Zhou, Y. An optimization framework for workplace charging strategies. Transp. Res. Part C Emerg. Technol. 2015, 52, 144–155. [Google Scholar] [CrossRef]
- Frade, I.; Ribeiro, A.; Gonçalves, G.; Antunes, A. Optimal Location of Charging Stations for Electric Vehicles in a Neighborhood in Lisbon, Portugal. Transp. Res. Rec. J. Transp. Res. Board 2011, 2252, 91–98. [Google Scholar] [CrossRef]
- De Gennaro, M.; Paffumi, E.; Martini, G. Big Data for Supporting Low-Carbon Road Transport Policies in Europe: Applications, Challenges and Opportunities. Big Data Res. 2016, 6, 11–25. [Google Scholar] [CrossRef]
- Csonka, B.; Csiszár, C. Determination of charging infrastructure location for electric vehicles. Transp. Res. Proced. 2017, 27, 768–775. [Google Scholar] [CrossRef]
- Andrenacci, N.; Ragona, R.; Valenti, G. A demand-side approach to the optimal deployment of electric vehicle charging stations in metropolitan areas. Appl. Energy 2016, 182, 39–46. [Google Scholar] [CrossRef]
- Liu, J. Electric vehicle charging infrastructure assignment and power grid impacts assessment in Beijing. Energy Policy 2012, 51, 544–557. [Google Scholar] [CrossRef]
- Xi, X.; Sioshansi, R.; Marano, V. Simulation–optimization model for location of a public electric vehicle charging infrastructure. Transp. Res. Part D Transp. Environ. 2013, 22, 60–69. [Google Scholar] [CrossRef]
- EAFO. European Alternative Fuels Observatory. Available online: http://www.eafo.eu/electric-vehicle-charging-infrastructure (accessed on 6 July 2018).
- De Gennaro, M.; Paffumi, E.; Martini, G. Customer-driven design of the recharge infrastructure and Vehicle-to-Grid in urban areas: A large-scale application for electric vehicles deployment. Energy 2015, 82, 294–311. [Google Scholar] [CrossRef]
- Gnann, T.; Funke, S.A.; Jakobsson, N.; Plötz, P.; Sprei, F.; Bennehag, A. Fast charging infrastructure for electric vehicles: Today’s situation and future needs. Transp. Res. Part D Transp. Environ. 2018, 62, 314–329. [Google Scholar] [CrossRef]
- Helmus, J.R.; Spoelstra, J.C.; Refa, N.; Lees, M.; van den Hoed, R. Assessment of public charging infrastructure push and pull rollout strategies: The case of the Netherlands. Energy Policy 2018, 121, 35–47. [Google Scholar] [CrossRef]
- Netherlands Enterprise Agency. Statistics Electric Vehicles in the Netherlands; Netherlands Enterprise Agency: Utrecht, The Netherlands, 2018; pp. 1–6. [Google Scholar]
- Hoen, A.; Afman, M.; van Grinsven, A. Uitbreiding Publieke Laadinfrastructuur Tot 2020; RVO: Delft, The Netherlands, 2017; pp. 1–40. Available online: https://www.rvo.nl/sites/default/files/2017/03/Rapport%20-%20Uitbreiding%20publieke%20laadinfrastructuur%20tot%202020.pdf (accessed on 7 July 2018).
- Parmenter, D. Key Performance Indicators (KPI): Developing, Implementing, and Using Winning KPIs; John Wiley & Sons, Inc.: Hoboken, NJ, USA, 2007. [Google Scholar]
- Helmus, J.R.; van den Hoed, R. Key Performance Indicators of Charging Infrastructure. In Proceedings of the 29th ElectronicVehicle Symposium, Montréal, QC, Canada, 19–22 June 2016; pp. 1–9. [Google Scholar]
- Ang, L.-M.; Seng, K.P. Big Sensor Data Applications in Urban Environments. Big Data Res. 2016, 4, 1–12. [Google Scholar] [CrossRef]
- Van den Hoed, R.; Helmus, J.R.; de Vries, R.; Bardok, D. Data analysis on the public charge infrastructure in the city of Amsterdam. World Electr. Veh. J. 2013, 6, 829–838. [Google Scholar] [CrossRef]
- Wolbertus, R.; van den Hoed, R.; Maase, S. Benchmarking charging infrastructure utilization. World Electr. Veh. J. 2016, 8, 754. [Google Scholar] [CrossRef]
© 2018 by the authors. Licensee MDPI, Basel, Switzerland. This article is an open access article distributed under the terms and conditions of the Creative Commons Attribution (CC BY) license (http://creativecommons.org/licenses/by/4.0/).


