Article

Online Multi Chemistry SoC Estimation Technique Using Data Driven Battery Model Parameter Estimation †

ETEC Department & MOBI Research Group, Vrije Universiteit Brussel (VUB), Pleinlaan 2, 1050 Brussels, Belgium
*
Author to whom correspondence should be addressed.
Paper presented at EVS30 International Battery, Hybrid and Fuel Cell Electric Vehicle Symposium, Stuttgart, Germany, 9–11 October 2017.
World Electr. Veh. J. 2018, 9(2), 16; https://doi.org/10.3390/wevj9020016
Submission received: 8 May 2018 / Revised: 15 June 2018 / Accepted: 20 June 2018 / Published: 22 June 2018

Abstract

:
Kalman filters have shown to be a very accurate and robust method for State of Charge estimation. However, their performance depends heavily on the accuracy of the used battery model and its parameters. These battery model parameters have shown to vary with the State of Health, cell chemistry, temperature and load current. This paper studies a data driven battery model parameter estimation technique based on the recursive least squares method as an alternative to extensively characterizing every cell of interest with time-consuming test procedures. The performance of two commonly used electrical models is compared and extensively validated on three different cell chemistries (Nickel Cobalt Manganese, Lithium Iron Phosphate and Lithium Titanate Oxide), under load conditions of varying dynamic nature representative for electric vehicle (EV) applications, using a Dynamic Discharge Pulse Test (DDPT) and the Worldwide harmonized Light vehicles Test Procedure (WLTP). The developed model is able to identify and update battery model parameters online, for three different chemistries, potentially reducing offline characterization efforts and allowing monitoring of battery electrical behavior and state estimation over its entire lifetime.

1. Introduction

For the past few decades, increasing environmental awareness has led to the development and slow adaptation of the electric vehicle (EV) and hybrid electric vehicle (HEV). Naturally, transportation is a target for decarbonisation initiatives since it contributes one-third of total greenhouse gas emissions [1]. The market share of electric vehicles is predicted to increase significantly in the coming decade [2,3], which will demand increasing performance and reliability from the battery pack and battery management system (BMS). While ensuring safe operation of the battery pack by keeping the individual cells within their respective temperature and voltage intervals, another vital aspect of the BMS’s function is state estimation [4,5]. The most important states are the state of charge (SoC), the state of health (SoH) and the state of function (SoF) [5]. However, estimating the SoC of a battery accurately poses a challenge, as it can’t be measured directly and is influenced by various factors such as temperature and cell aging [4]. Furthermore, the very dynamic load profile of batteries in automotive applications adds to the complexity of accurate SoC estimation. Commonly, SoC estimations have been divided into five categories: conventional methods, adaptive filter algorithms, learning algorithms, nonlinear observers and others [4,6]. However, only a few of the proposed methods in the literature are applicable in real time on the BMS, since limitations exist on computational power [4,5,6,7]. Some of the most commonly used real-time SoC estimation methods include coulomb counting, various applications of Kalman filters and model based methods [7,8,9,10,11,12,13]. Coulomb counting, the most straightforward method, has some major drawbacks: it is heavily dependent on the initial SoC accuracy and, being an open-loop method, it is susceptible to accumulated errors due to measurement errors on the load current [14]. Kalman filters, on the other hand, have proven to be a very accurate and robust method for SoC estimation [10,11,12,13]. However, their performance depends heavily on the accuracy of the used battery model and its parameters [7,15]. These battery model parameters have shown to vary with the aging level of the cell, cell chemistry, temperature and load current [6,16]. It is common practice to determine these battery model parameters by performing an extensive Hybrid Pulse Power Characterization (HPPC) test at different ambient temperatures on the desired cell, which will correlate the parameter values to current rate and temperature at a specific SoC [16,17]. This elaborate, time-consuming procedure has to be carried out for every different cell of interest, which can have varying formats, designs, chemistries and aging levels. Previous research has proposed several methods to determine the battery model parameters of equivalent circuit electrical models online, such as Kalman Filters (KF), Genetic Algorithms (GA) and Least Squares (LS) methods [4,5,6,7,18,19,20,21,22,23]. These methods allow model parameterization during battery operation without extensive characterization testing, which allows the model to adapt to variations influential factors such as temperature and battery aging. Even though the conventional LS identification methods are less accurate and robust than others such as the EKF or GA, their required computational effort is low, which makes them suitable for implementation in a BMS [6,21].
The purpose of this paper is to perform a comparative analysis of established battery models and SoC estimation methods across three different cell chemistries. To this end, the extensive characterization procedure is bypassed by implementing an online adaptive parameter estimation technique based on the recursive least squares method with adaptive forgetting factor, which improves the conventional LS methods significantly. This method is hereafter deployed for the parameter identification of two commonly used electrical models: the first order model and second order model. Combined with an EKF, this model allows online SoC estimation independent of cell aging and chemistry. Both the first and second order model with online parameter identification are validated and compared for three different state-of-the-art cell chemistries, which, to the author’s best knowledge, has not been presented in previous literature.
The structure of the paper is as follows: Section 2.1 presents both aforementioned models: the first and second order model. Hereafter, the recursive least squares with the adaptive forgetting factor parameter identification method is constructed for the second order model in Section 2.2. Section 3 then presents the specifications of the tested cells and the validation process of the proposed model. In Section 3.2, the performance of the first and second order model is compared and extensively discussed, and then the SoC estimation accuracy is addressed. Finally, Section 5 contains the conclusions of this research.

2. Data Driven Battery Models
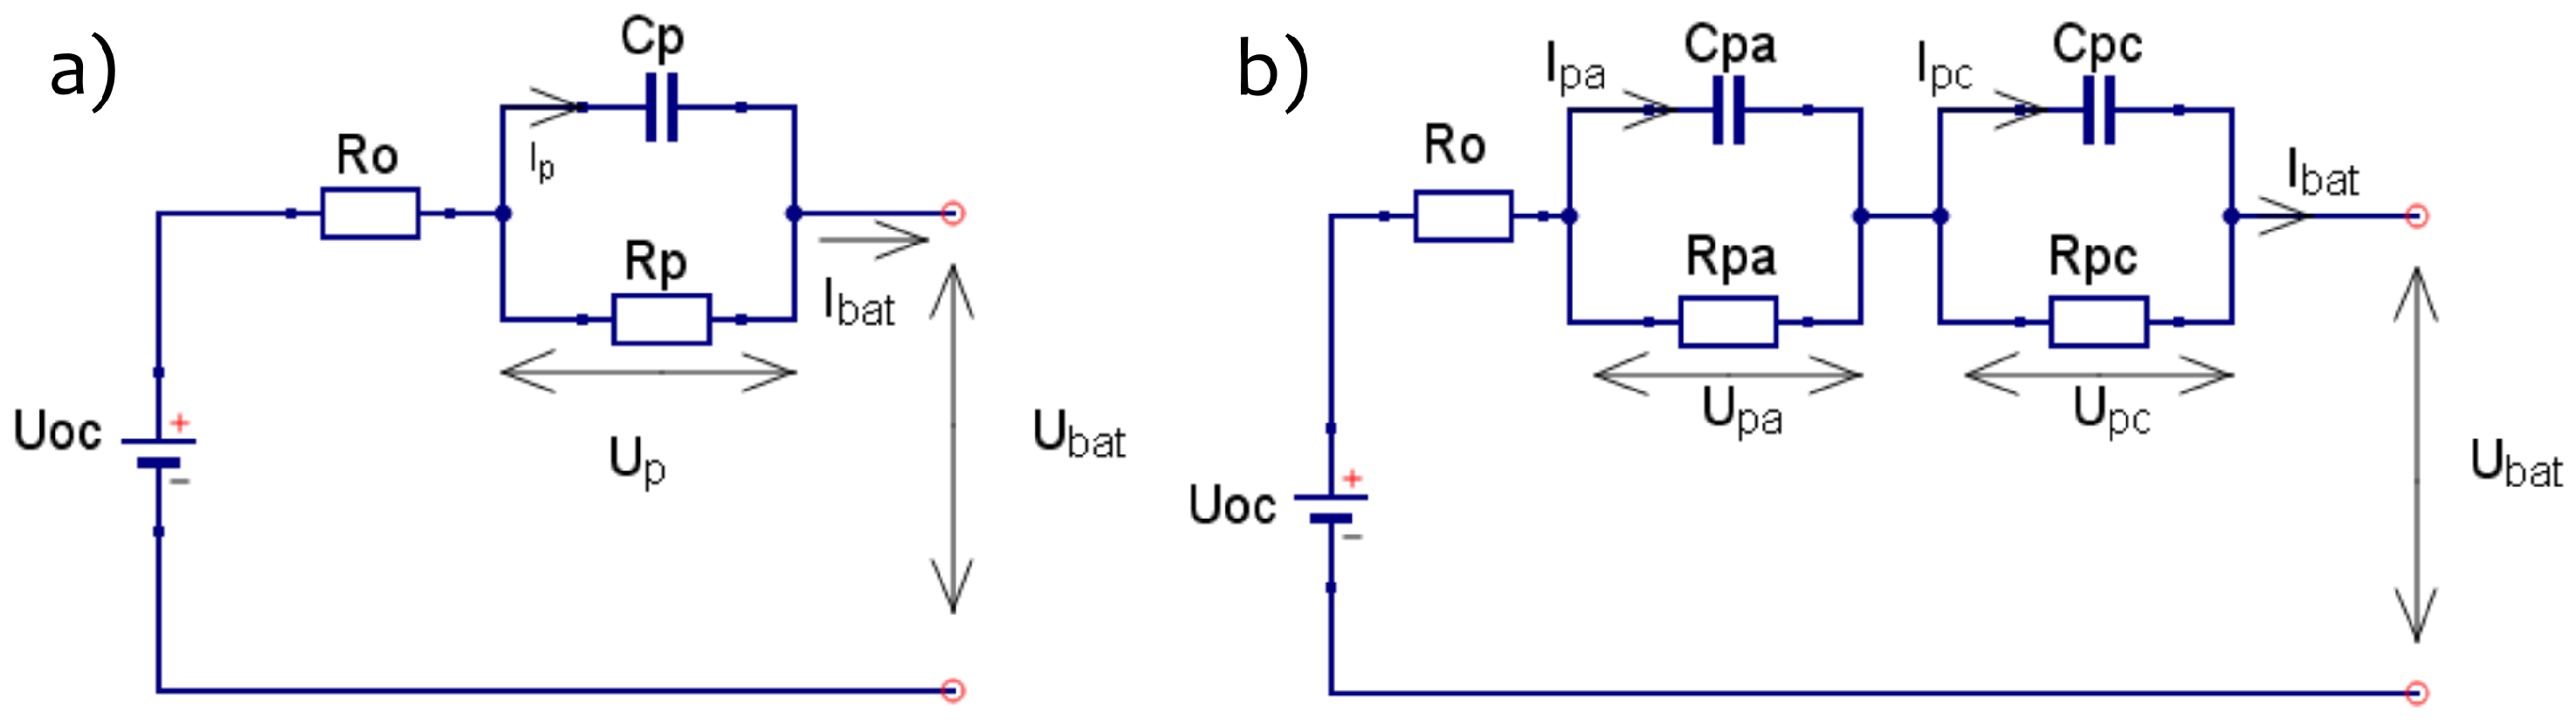
2.1. Battery Models

Modeling the electrical behavior of a battery accurately from its measurable values (i.e., voltage, current and temperature) is paramount for model-based battery management systems, which often implement SoC estimation algorithms based on Kalman filters. While Kalman filters have shown to weaken the influence of white noise and initial SoC error, they cannot eliminate the existing error of the battery model itself. Furthermore, it has been shown that the accuracy of SoC estimation is directly related to the accuracy of the battery model [15]. In order to obtain a sufficient accurate battery model with acceptable complexity, two commonly implemented battery models are investigated in this work: the second order Thevenin model or dual polarization model and the first order Thevenin model. The equivalent circuit diagram of both electrical models is shown in Figure 1.
The first order model is fully described by Equation (1), where U p denotes the polarization voltage over the RC network, U O C represents the open circuit voltage (OCV) and U b a t is the terminal battery voltage. Similarly, the electrical behavior of the second order model is characterized by Equation (2), where U p a denotes the polarization voltage over the first RC network, U p c denotes the diffusion voltage over the second RC network, U O C represents the OCV and U b a t is the terminal voltage.
The values of the aforementioned ideal electrical components (model parameters) define the electrical behavior of the battery and have been shown to vary with cell chemistry, temperature, load current and state of health (SoH). Thus, to captivate the electrical behavior of a cell under all these varying conditions, numerous time-consuming characterization tests have to be performed. In order to drastically reduce testing times, an online model parameter identification method is investigated in this paper.
U ˙ p = U p R p C p + I b a t C p , U b a t = U o c U p I b a t R o ,
U ˙ p a = U p a R p a C p a + I b a t C p a , U ˙ p c = U p c R p c C p c + I b a t C p c , U b a t = U o c U p a U p c I b a t R o .

2.2. Parameter Identification Method
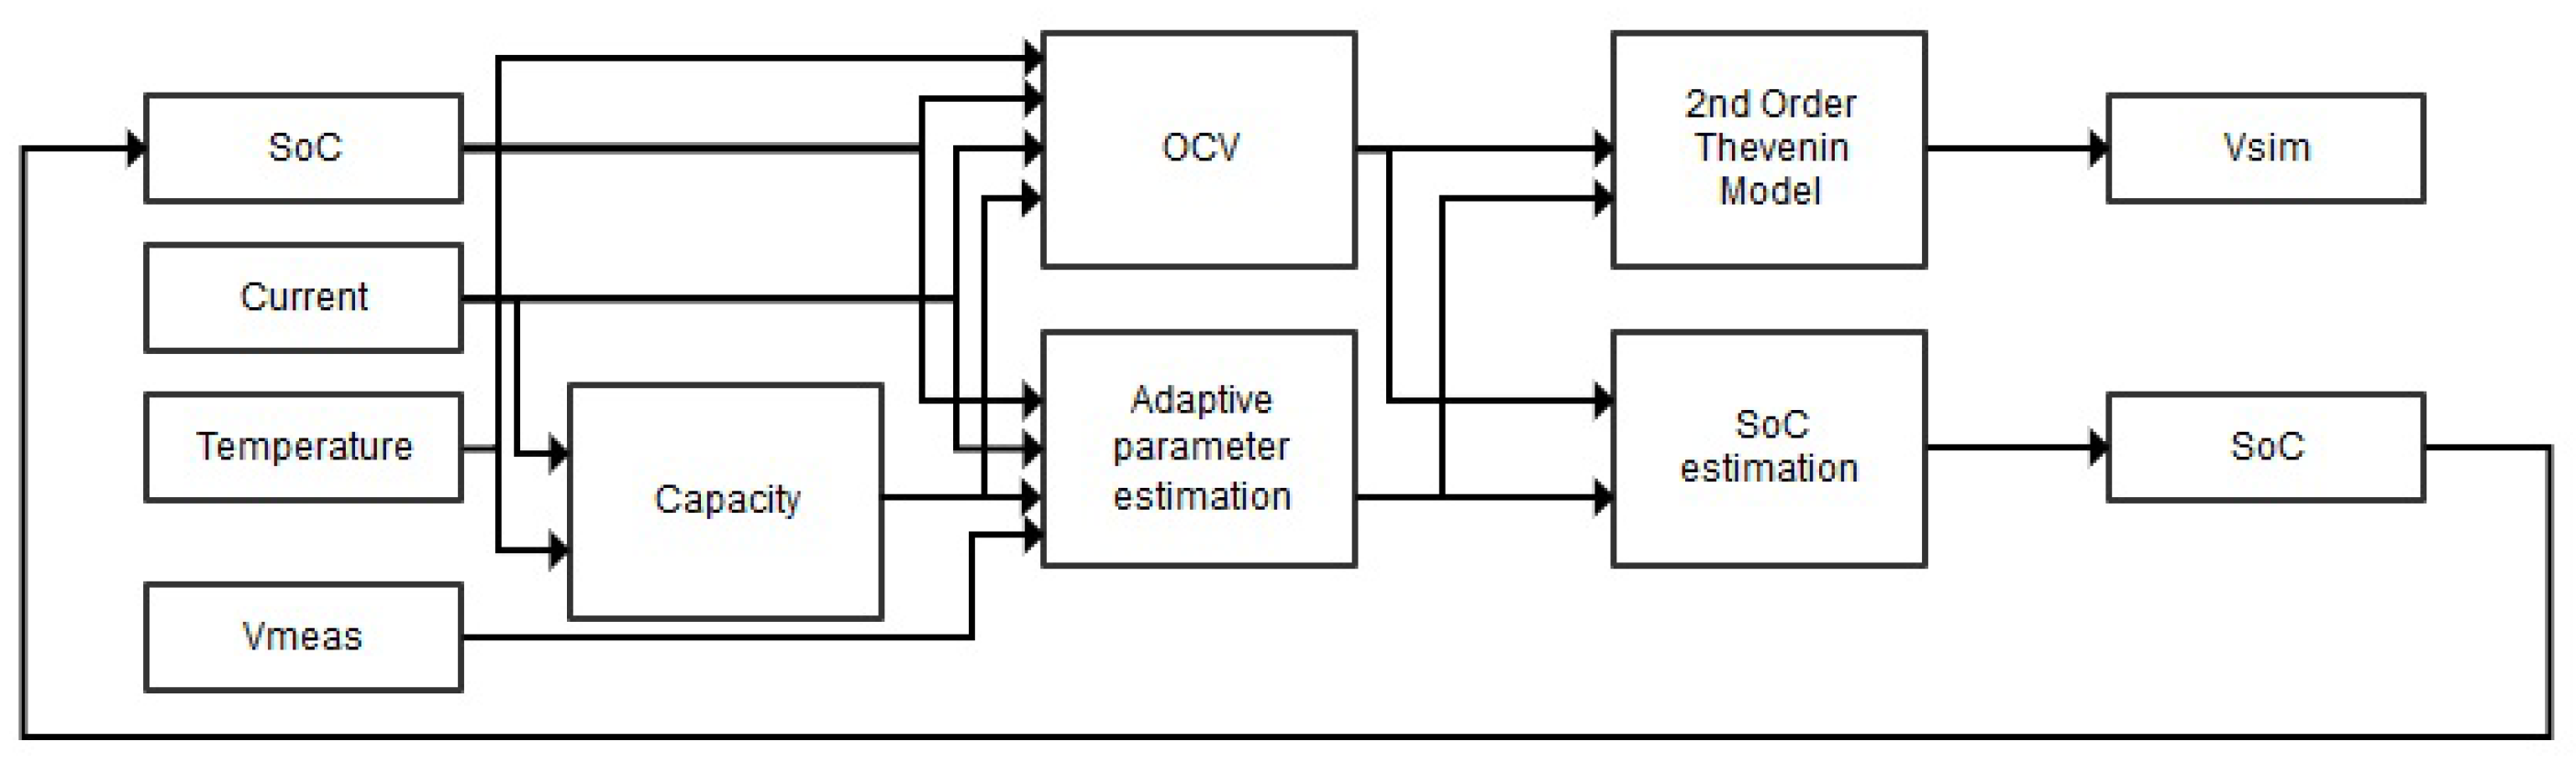
In order to obtain and maintain an accurate SoC estimation over battery lifetime, a data driven adaptive electrical model is developed that is able to identify and update the model parameters from the measurable values, i.e., voltage and current, during operation. The developed data driven model is based on the well-known Recursive Least Squares (RLS) method with adaptive forgetting factor. In order to implement the RLS method on both battery models introduced in Section 2.1, the auto regressive exogenous (ARX) has to be constructed. Since this is more complicated for the second order model, yet very similar for both models, only the second order model equations are shown. Based on Equation (2), the transfer function H(s) of the electrical model in the frequency domain can be obtained [17]:
H ( s ) = R o s 2 + 1 R p a C p a R p c C p c [ ( R o + R p c ) R p a C p a + ( R o + R p a ) R p c C p c ] s + R o + R p a + R p c R p a C p a R p c C p c s 2 + R p a C p a + R p c C p c R p a C p a R p c C p c s + 1 R p a C p a R p c C p c .
The transfer function is discretized using the bilinear transform shown in Equation (4), in order to obtain the discretized transfer function H(z) in Equation (5):
s 2 T s 1 z 1 1 + z 1 ,
H ( z ) = b 0 + b 1 z 1 + b 3 z 2 1 a 1 z 1 a 2 z 2 .
This allows for rewriting Equation (2) as Equation (6), where U t , k is the measured terminal voltage at timestep k and I b a t , k is the measured current at timestep k. Hereafter, we can acquire the ARX form of the battery model in Equation (7), where yk is the simulated terminal voltage at timestep k:
U t , k = ( 1 a 1 a 2 ) U O C + a 1 U t , k 1 + a 2 U t , k 2 + b 0 I b a t , k + b 1 I b a t , k 1 + b 2 I b a t , k 2 ,
y k = θ k T . ϕ k ,
where the measurement data vector ϕ k and the parameter vector θ k at timestep k are given by
ϕ k = [ U O C , U t , k 1 , U t , k 2 , I b a t , k 1 , I b a t , k 2 ] , θ k = [ 1 a 1 a 2 , a 1 , a 2 , b 0 , b 1 , b 5 ] .
The recursive set of calculations of the RLS with adaptive forgetting factor are implemented as shown in Equation (9). Where λ k represents the adaptive forgetting factor at timestep k, c is a constant bigger than one, L k represents the updated gain of the parameter vector at timestep k and P k represents the covariance error of the parameter vector at timestep k. Finally, the battery model parameters can be retrieved from the updated parameter vector θ k :
λ k = 1 1 1 + c ϕ k T P k 1 ϕ k , L k = P k 1 ϕ k λ k + ϕ k T P k 1 ϕ k , P k = P k 1 L k ϕ k T P k 1 λ k + ϕ k T P k 1 ϕ k , θ k = θ k 1 + L k ( y k ϕ k T θ k 1 ) .

3. Methods

3.1. Cell Specifications and Testing

In order to validate the developed model’s capability to be deployed on multiple cell chemistries with totally different characteristics, experimental data is required. To this end, three different cells were selected and tested in this research: a 20 Ah NMC cell, a 14 Ah LFP cell and a 5 Ah LTO cell. The main electrical characteristics of these cells are shown in Table 1. To gather the necessary input data for the model, both capacity tests at five different c-rates and four temperatures are performed and OCV tests are performed at four different temperatures.

3.2. Validation Process

In order to validate the proposed data driven battery model parameter estimation technique, several tests were performed using a 24-channel SBT0550 battery tester (PEC, Leuven, Belgium) on three cells of different chemistries: a 20 Ah NMC cell, a 14 Ah LFP cell and a 5 Ah LTO cell. The battery tester allows voltage measurements between −3 and 5 V DC with a resolution of 100 μ V and an accuracy of ± 0.03 % . Current measurements are possible between 0 and 50 A DC with an accuracy of ± 0.02 % . The performed test cycles for the validation process are a Dynamic Discharge Performance Test (DDPT) and the more dynamic Worldwide harmonized Light vehicles Test Procedure (WLTP). Three variables were accurately logged throughout the duration of these tests using the SBT0550 battery tester: current I, terminal voltage V and temperature T. Hereafter, the variables were used as an input for the data driven parameter estimation model, which estimates the battery model parameters for a second order Thevenin model, as can be seen in Figure 2, and a first order model. Electrical validation is performed by observing the difference between measured and simulated voltage when applying the validation current profiles. Hereafter, the performance of both electrical models is compared. Finally, the performed SoC estimation is validated by comparison to the reference SoC estimated by coulomb counting.

4. Results and Discussion

The implemented SoC estimator during the validation process, of which the results are presented in this section, is based on the well-known Extended Kalman Filter (EKF) [24,25,26]. While the data driven battery model has been shown to work with varying other SoC estimation methods, such as coulomb counting and the Unscented Kalman Filter, it is preferred to show the results of only one SoC method for the sake of clarity and compactness. Analogously, only the simulation results at 25 C are presented. The results shown in this section are structured as follows: Section 4.1 discusses the validation results of the Dynamic Discharge Performance Test (DDPT) for the three tested chemistries, followed by the validation results of the Worldwide harmonized Light vehicles Test Procedure (WLTP). Hereafter, the simulation results of both the first order model and second order model are compared and discussed. Finally, Section 4.2 presents the results of the SoC estimation.

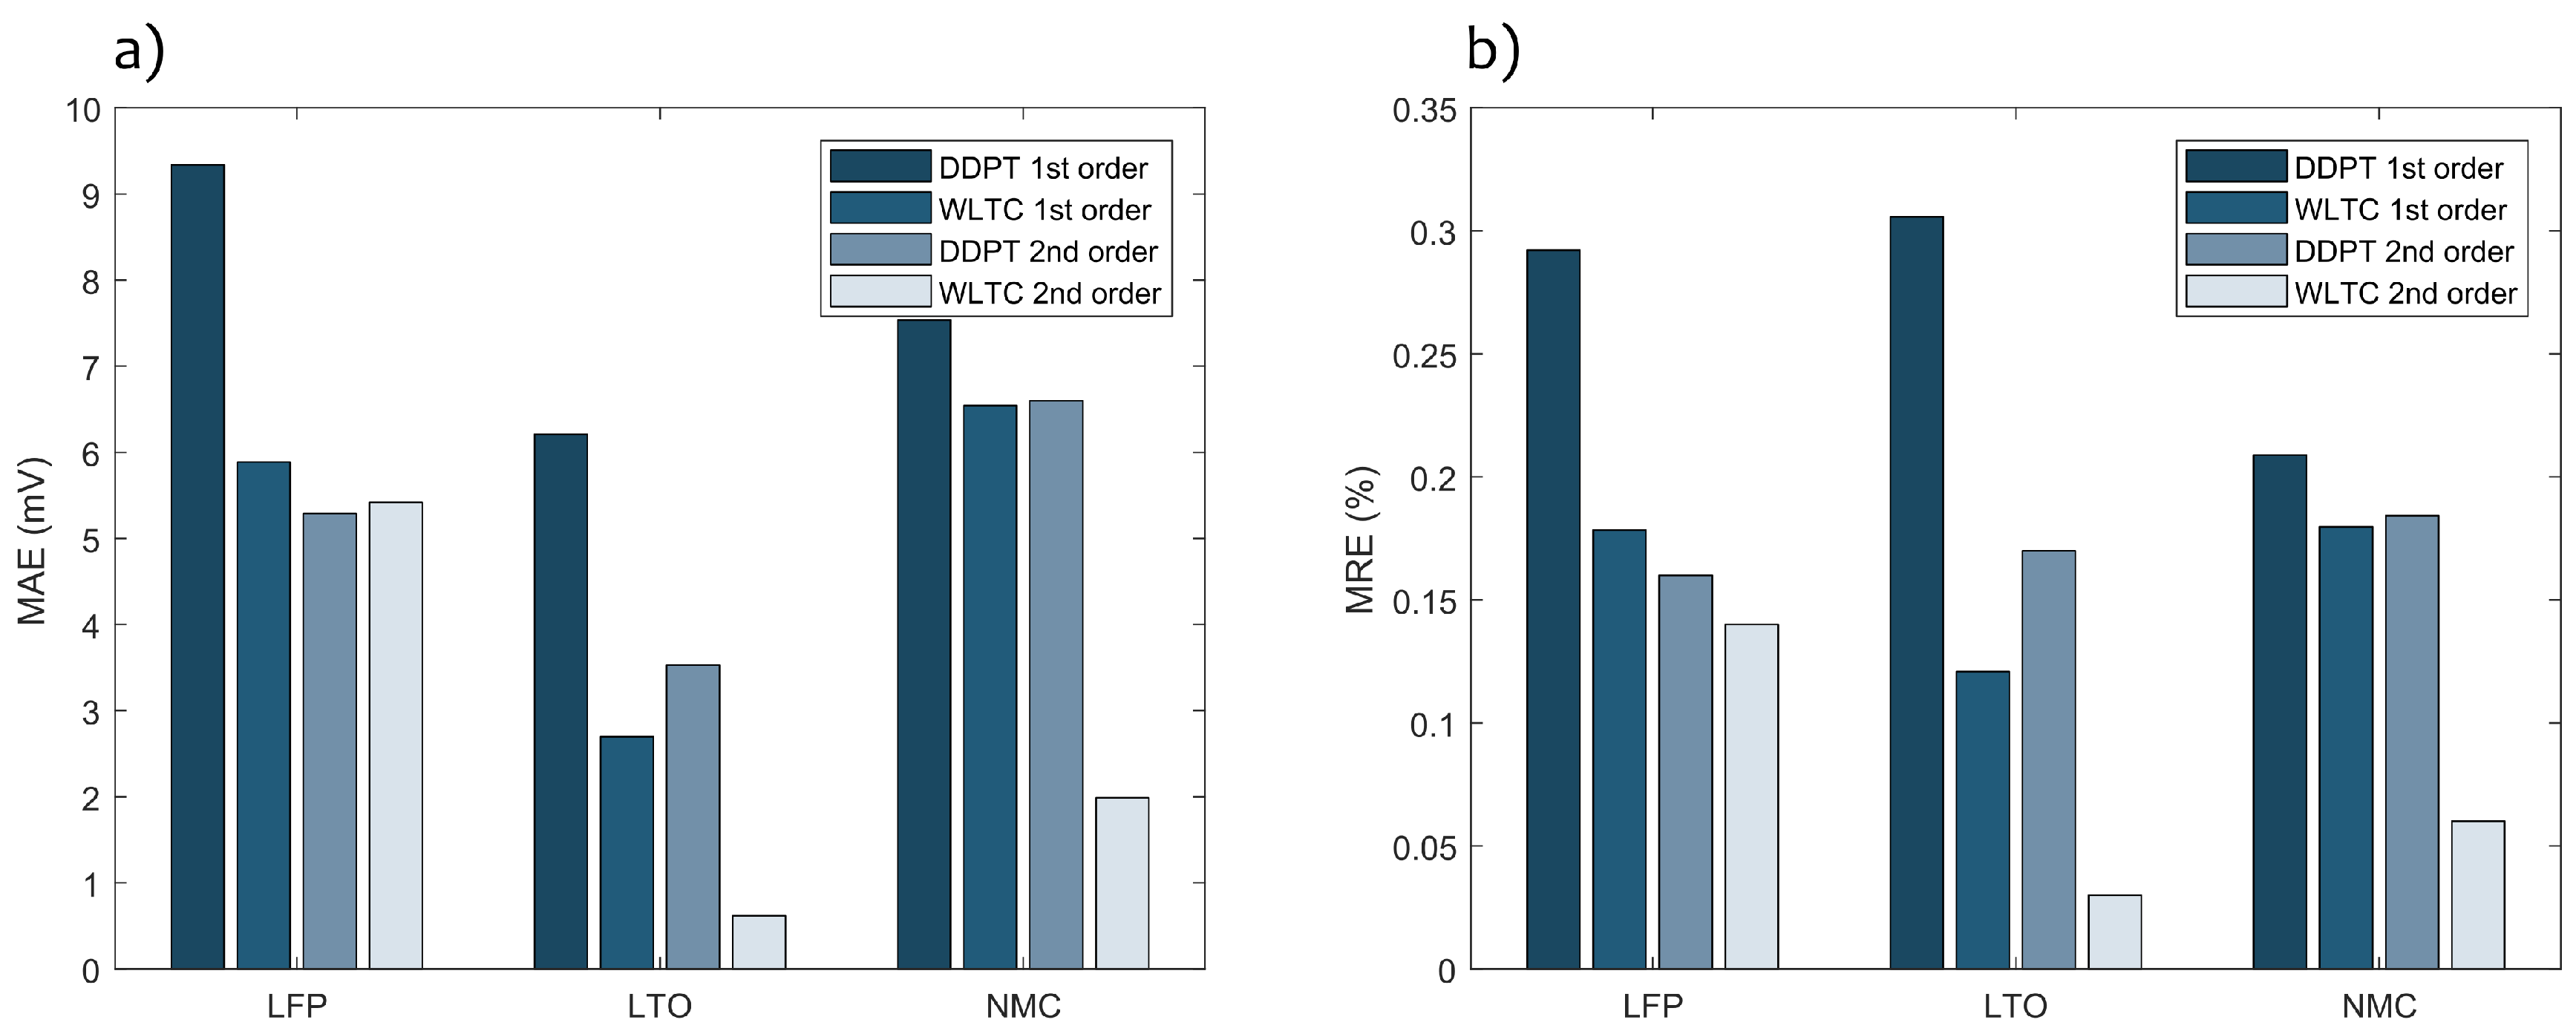
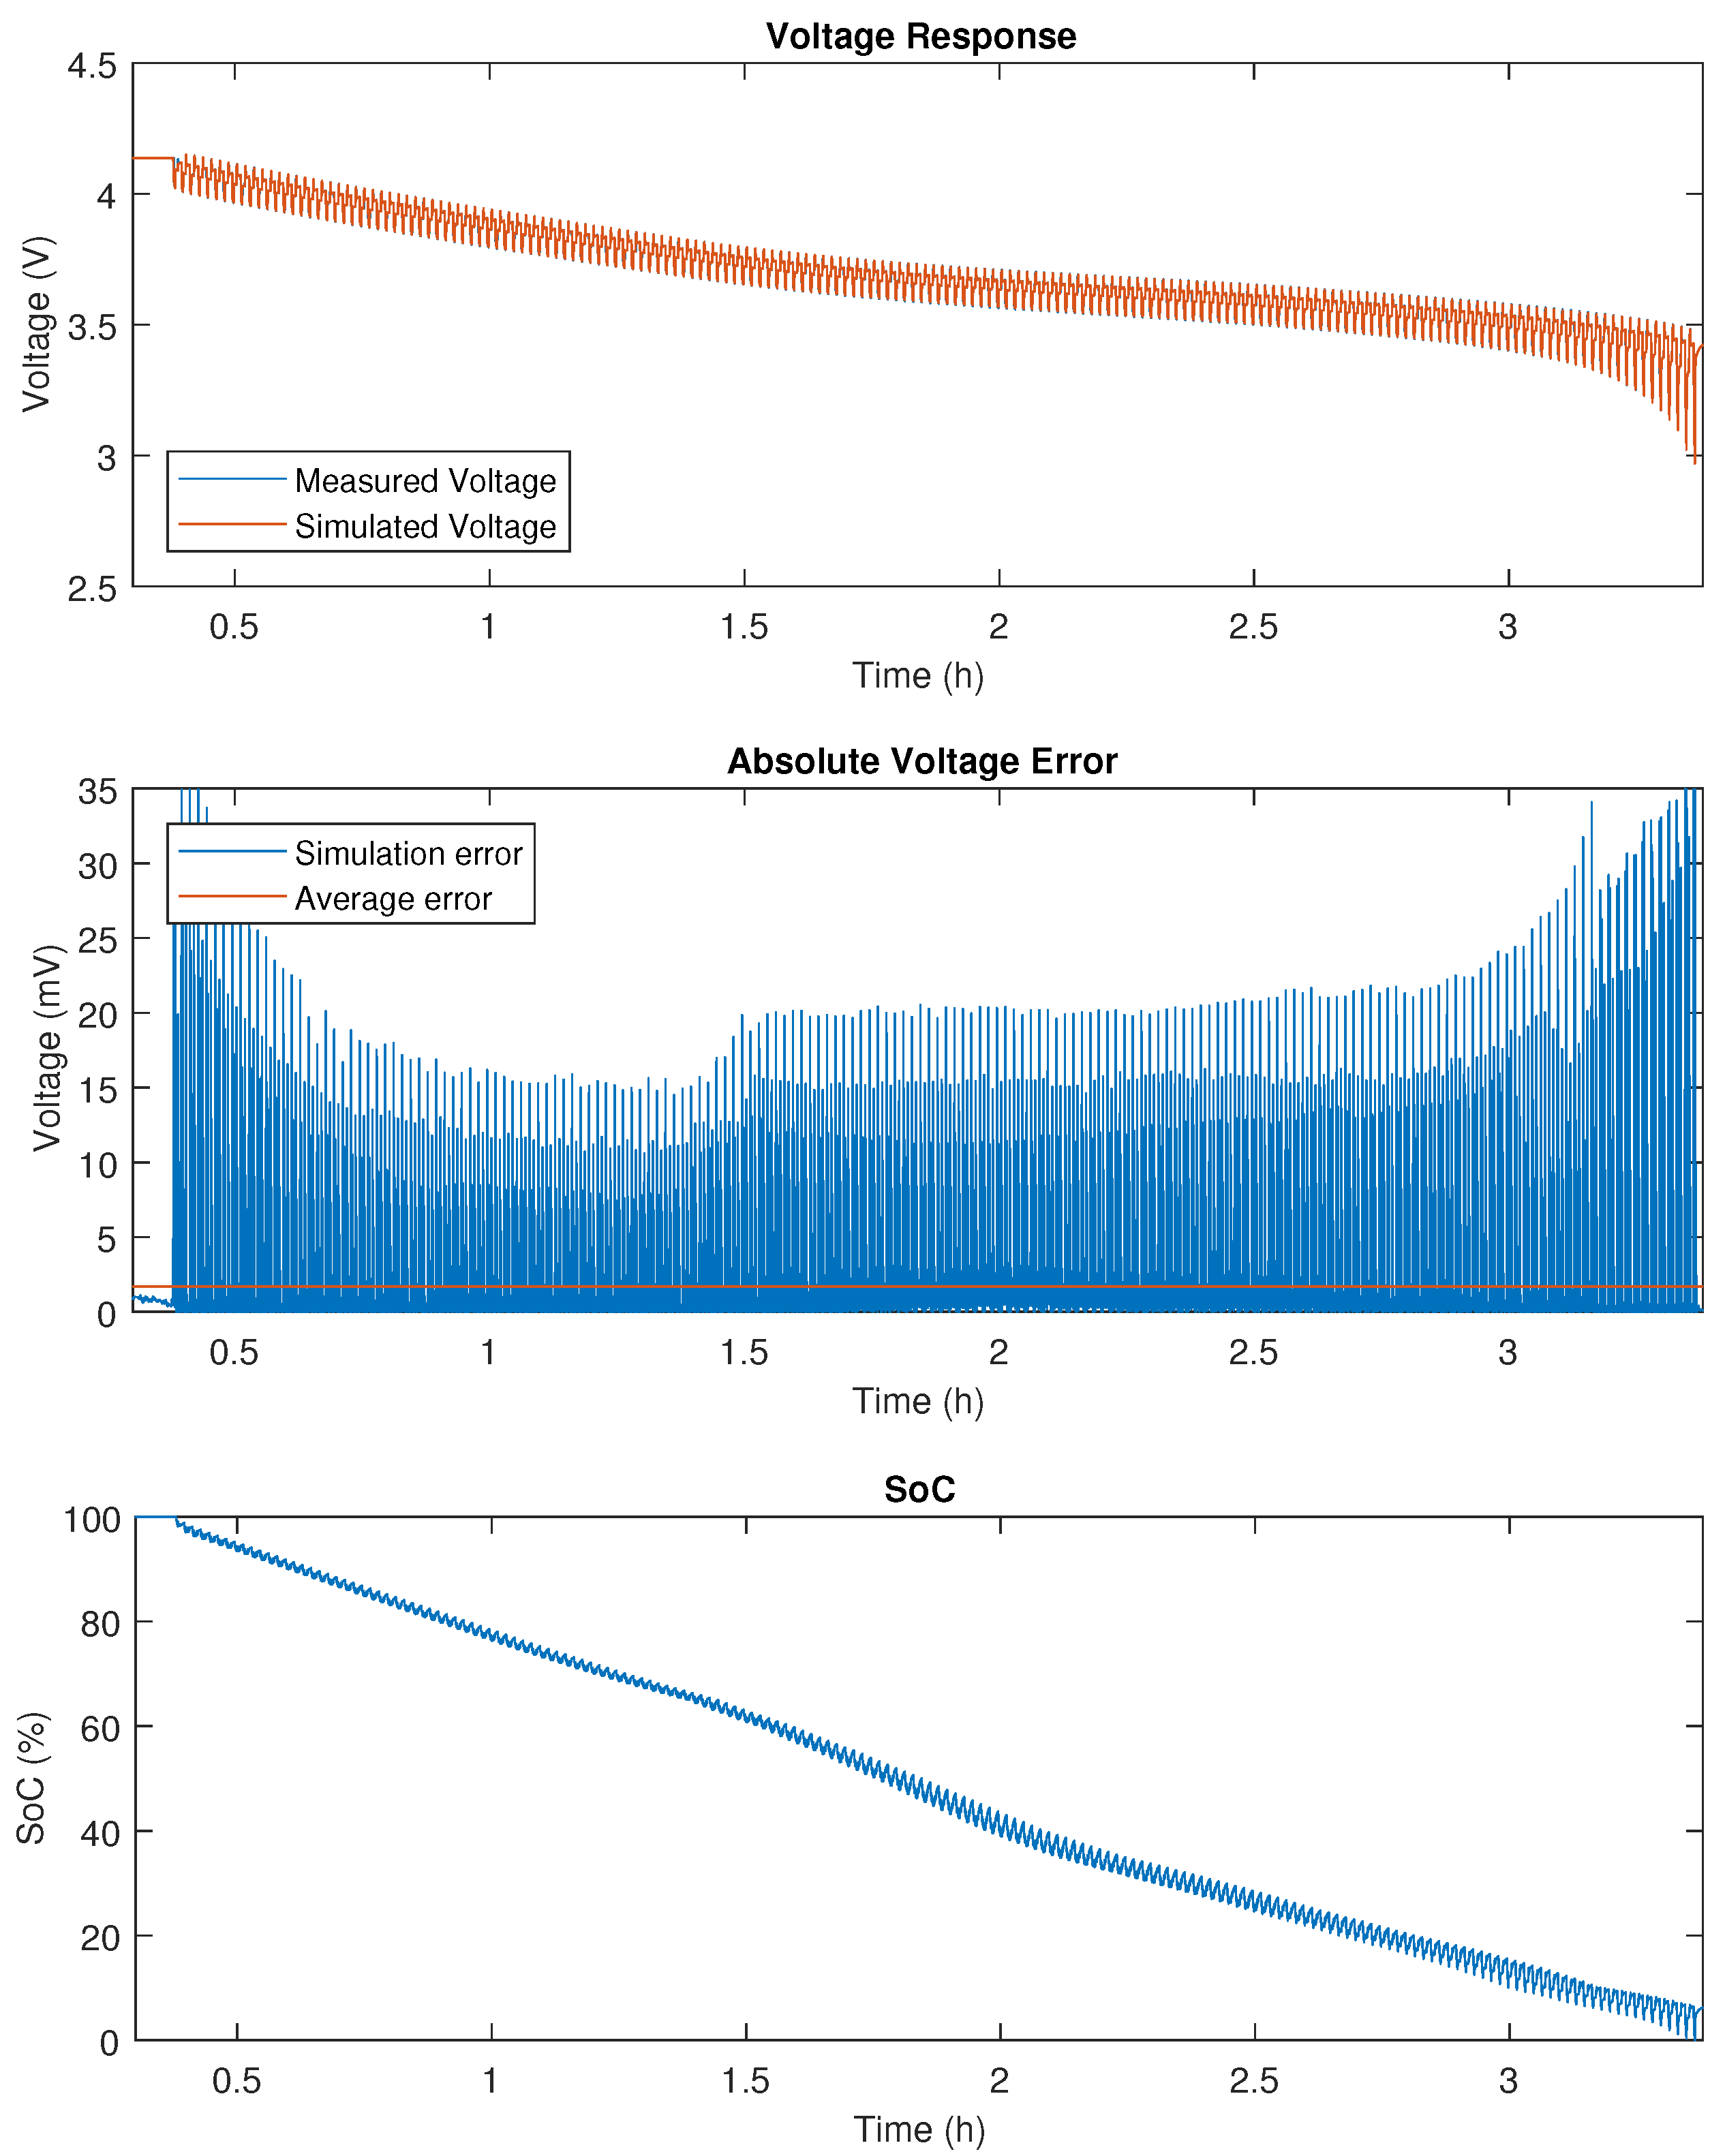
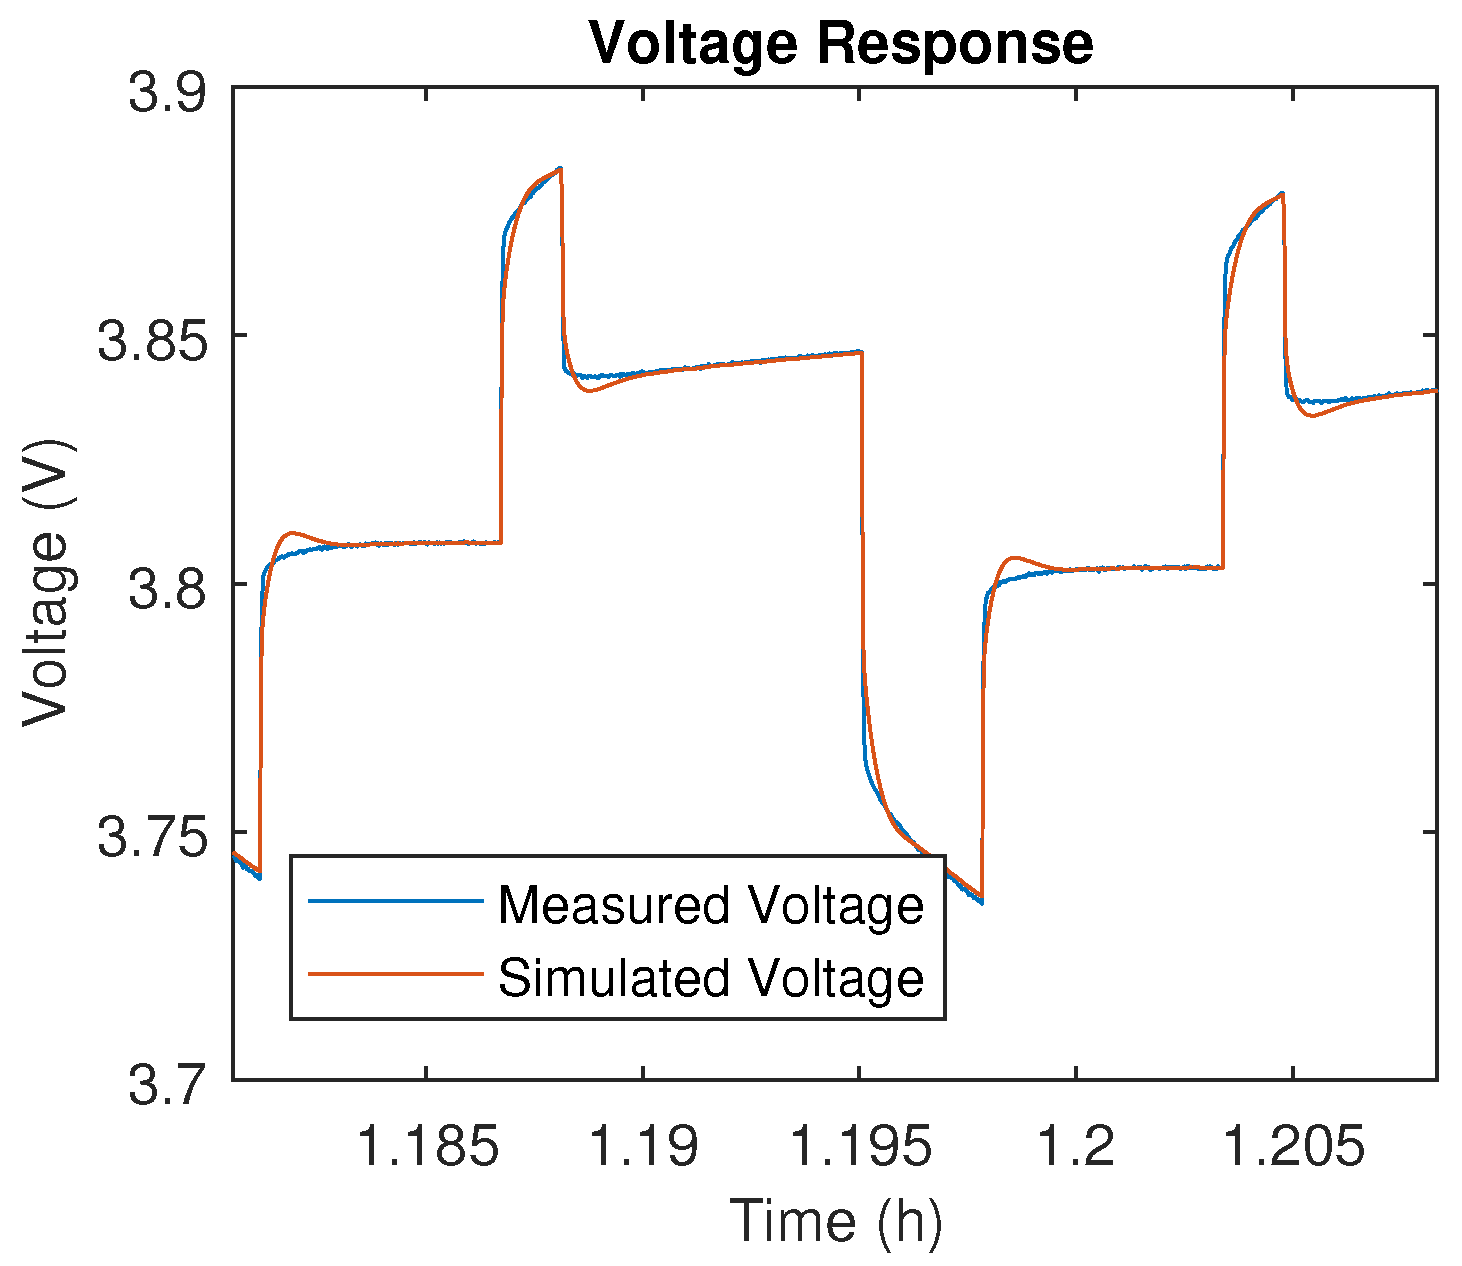
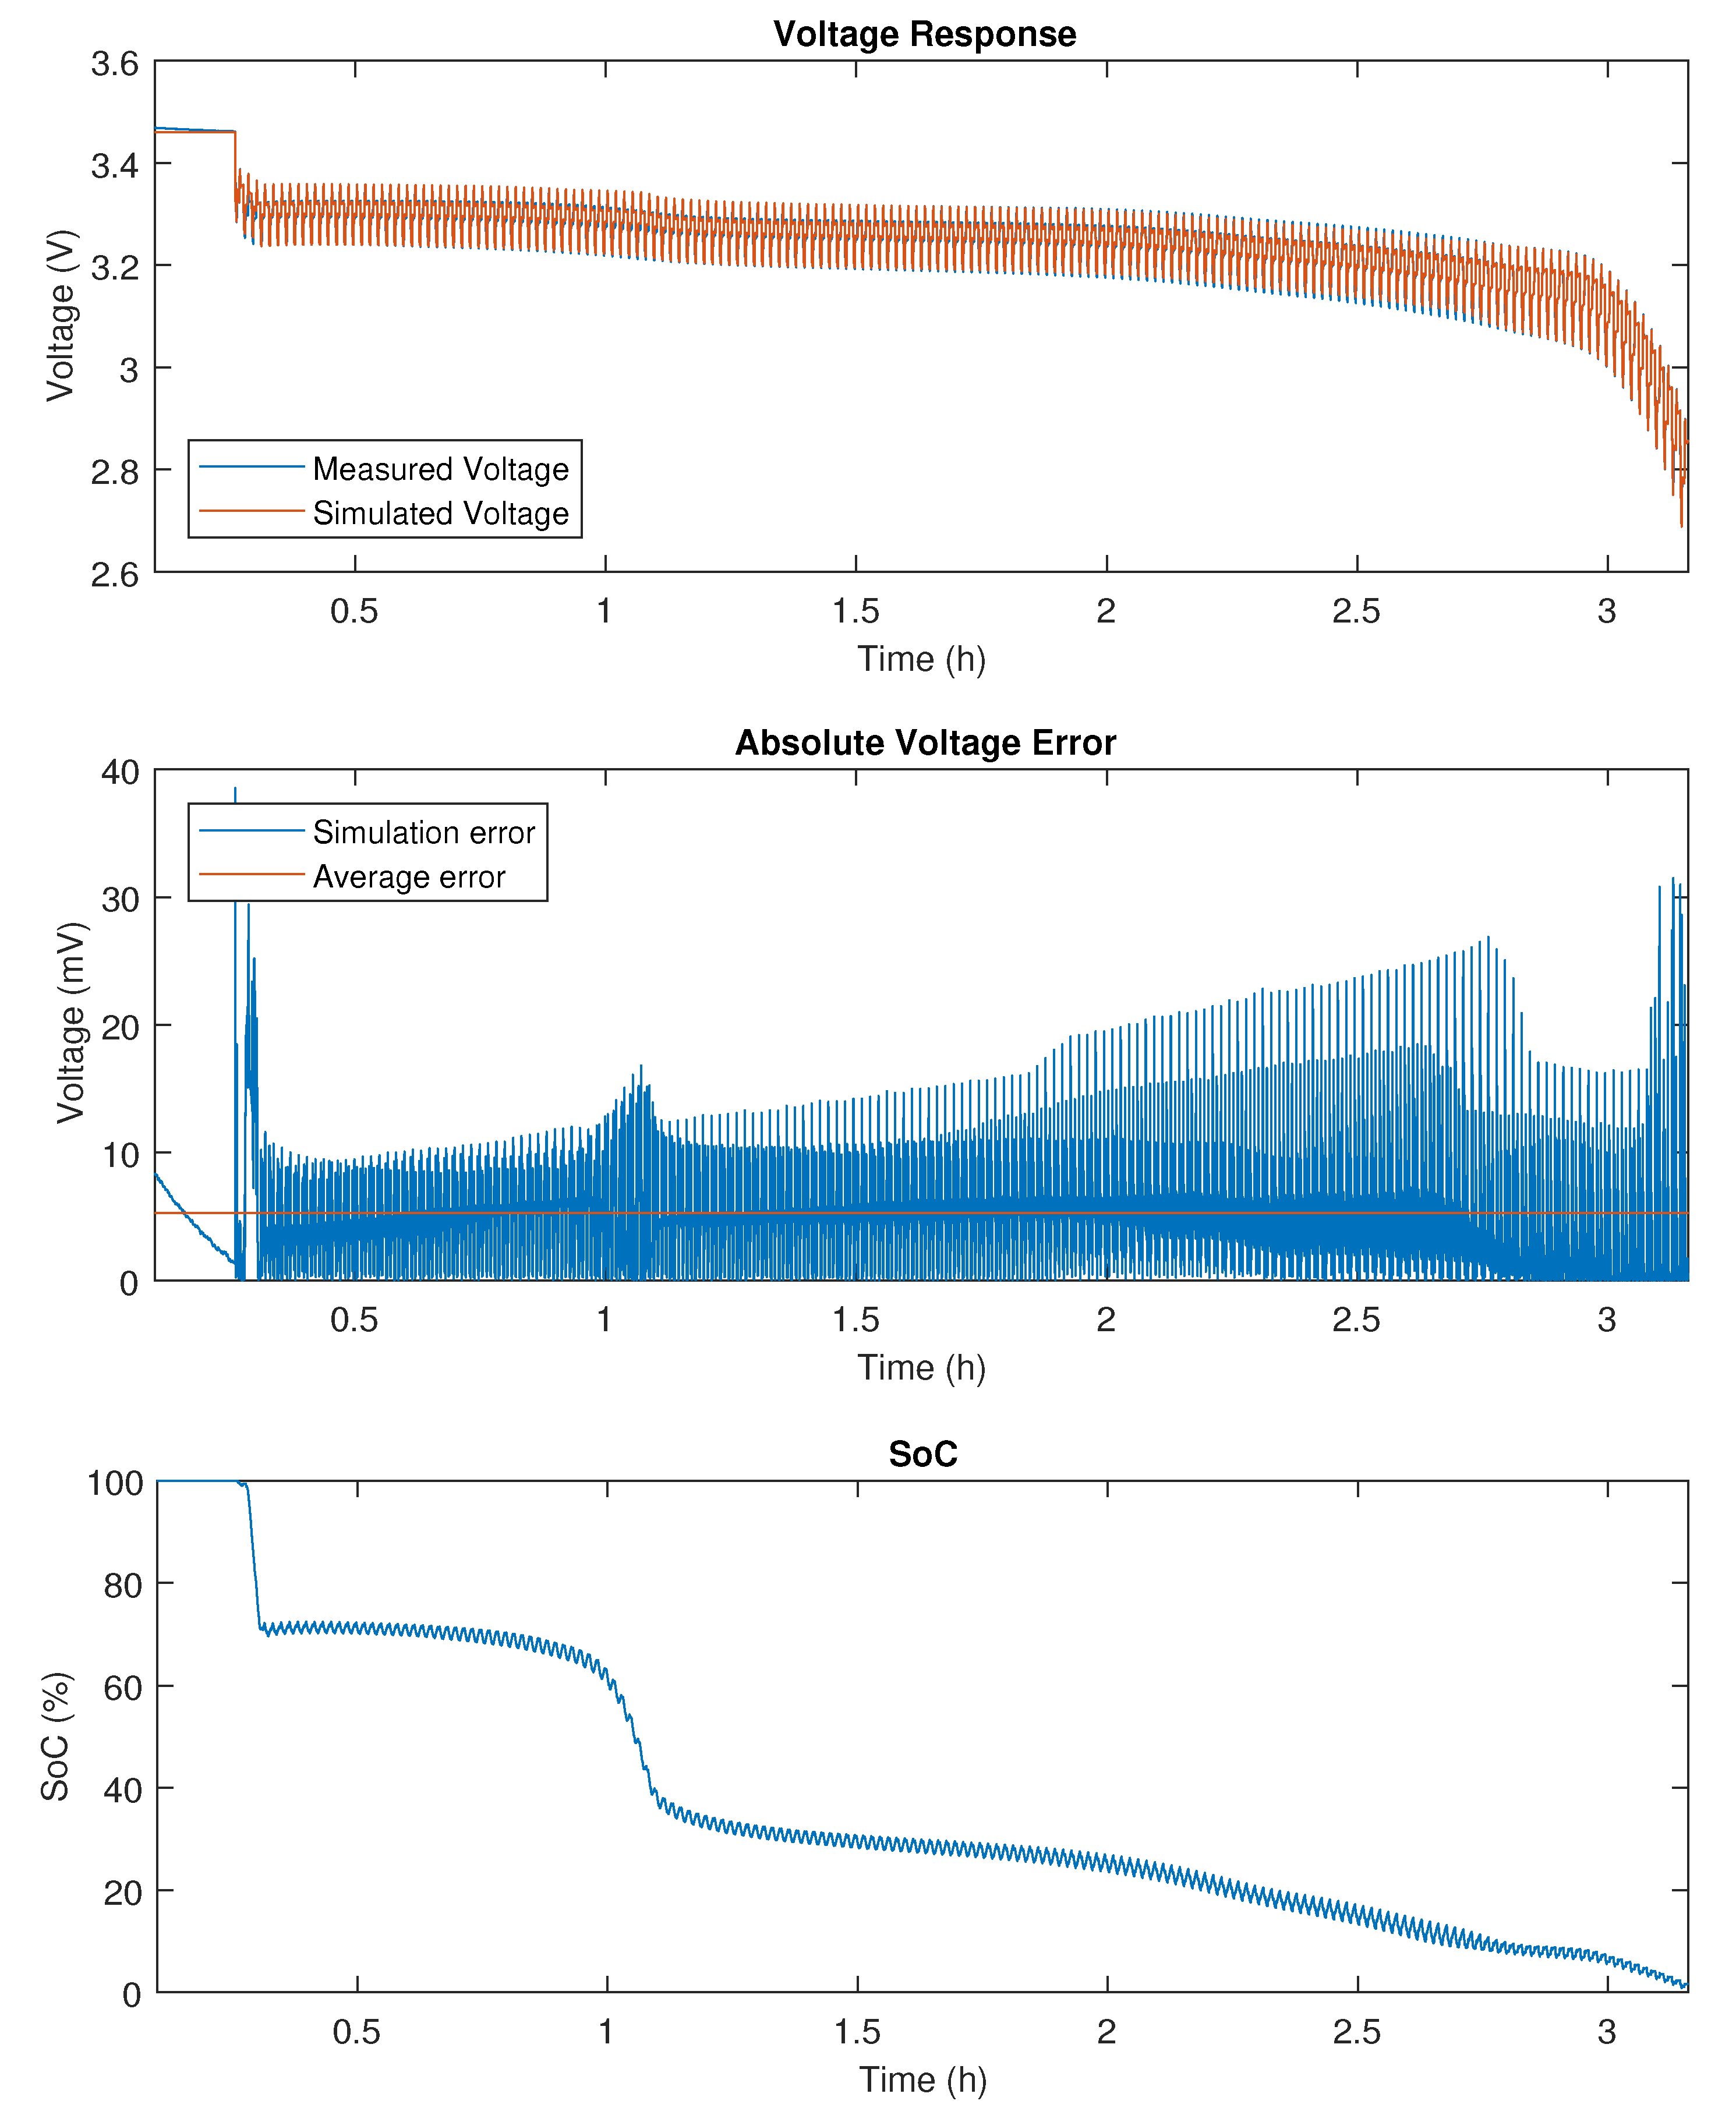
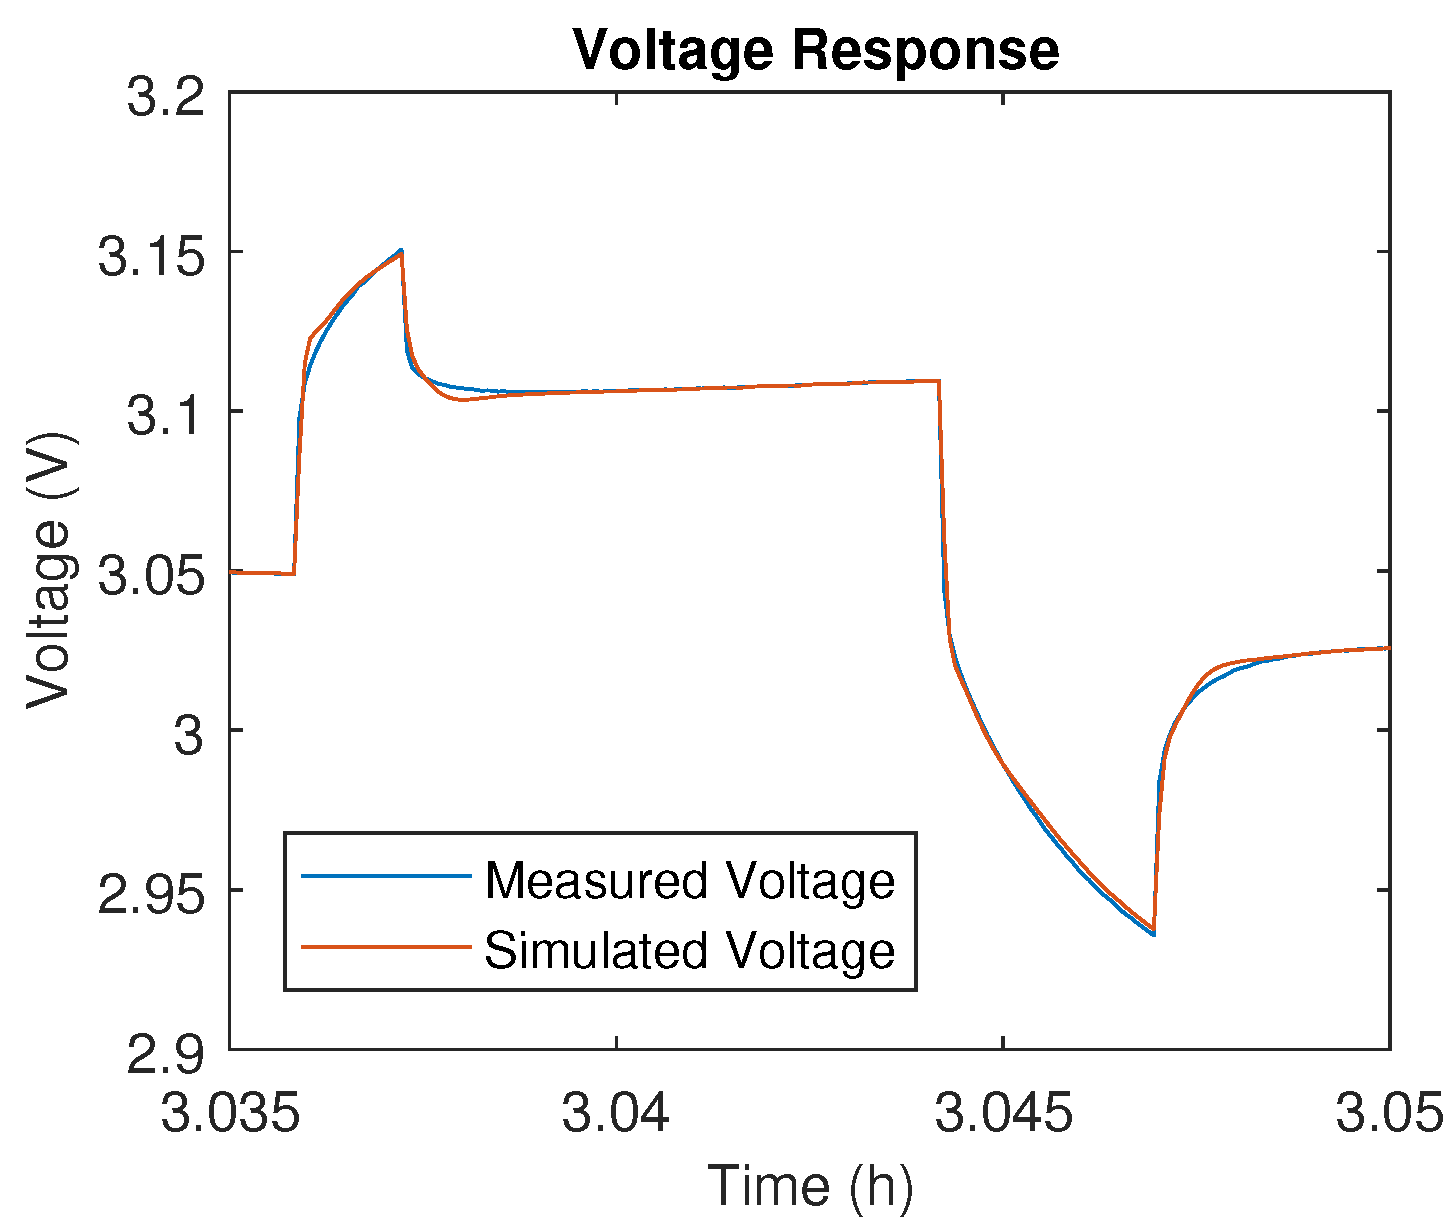
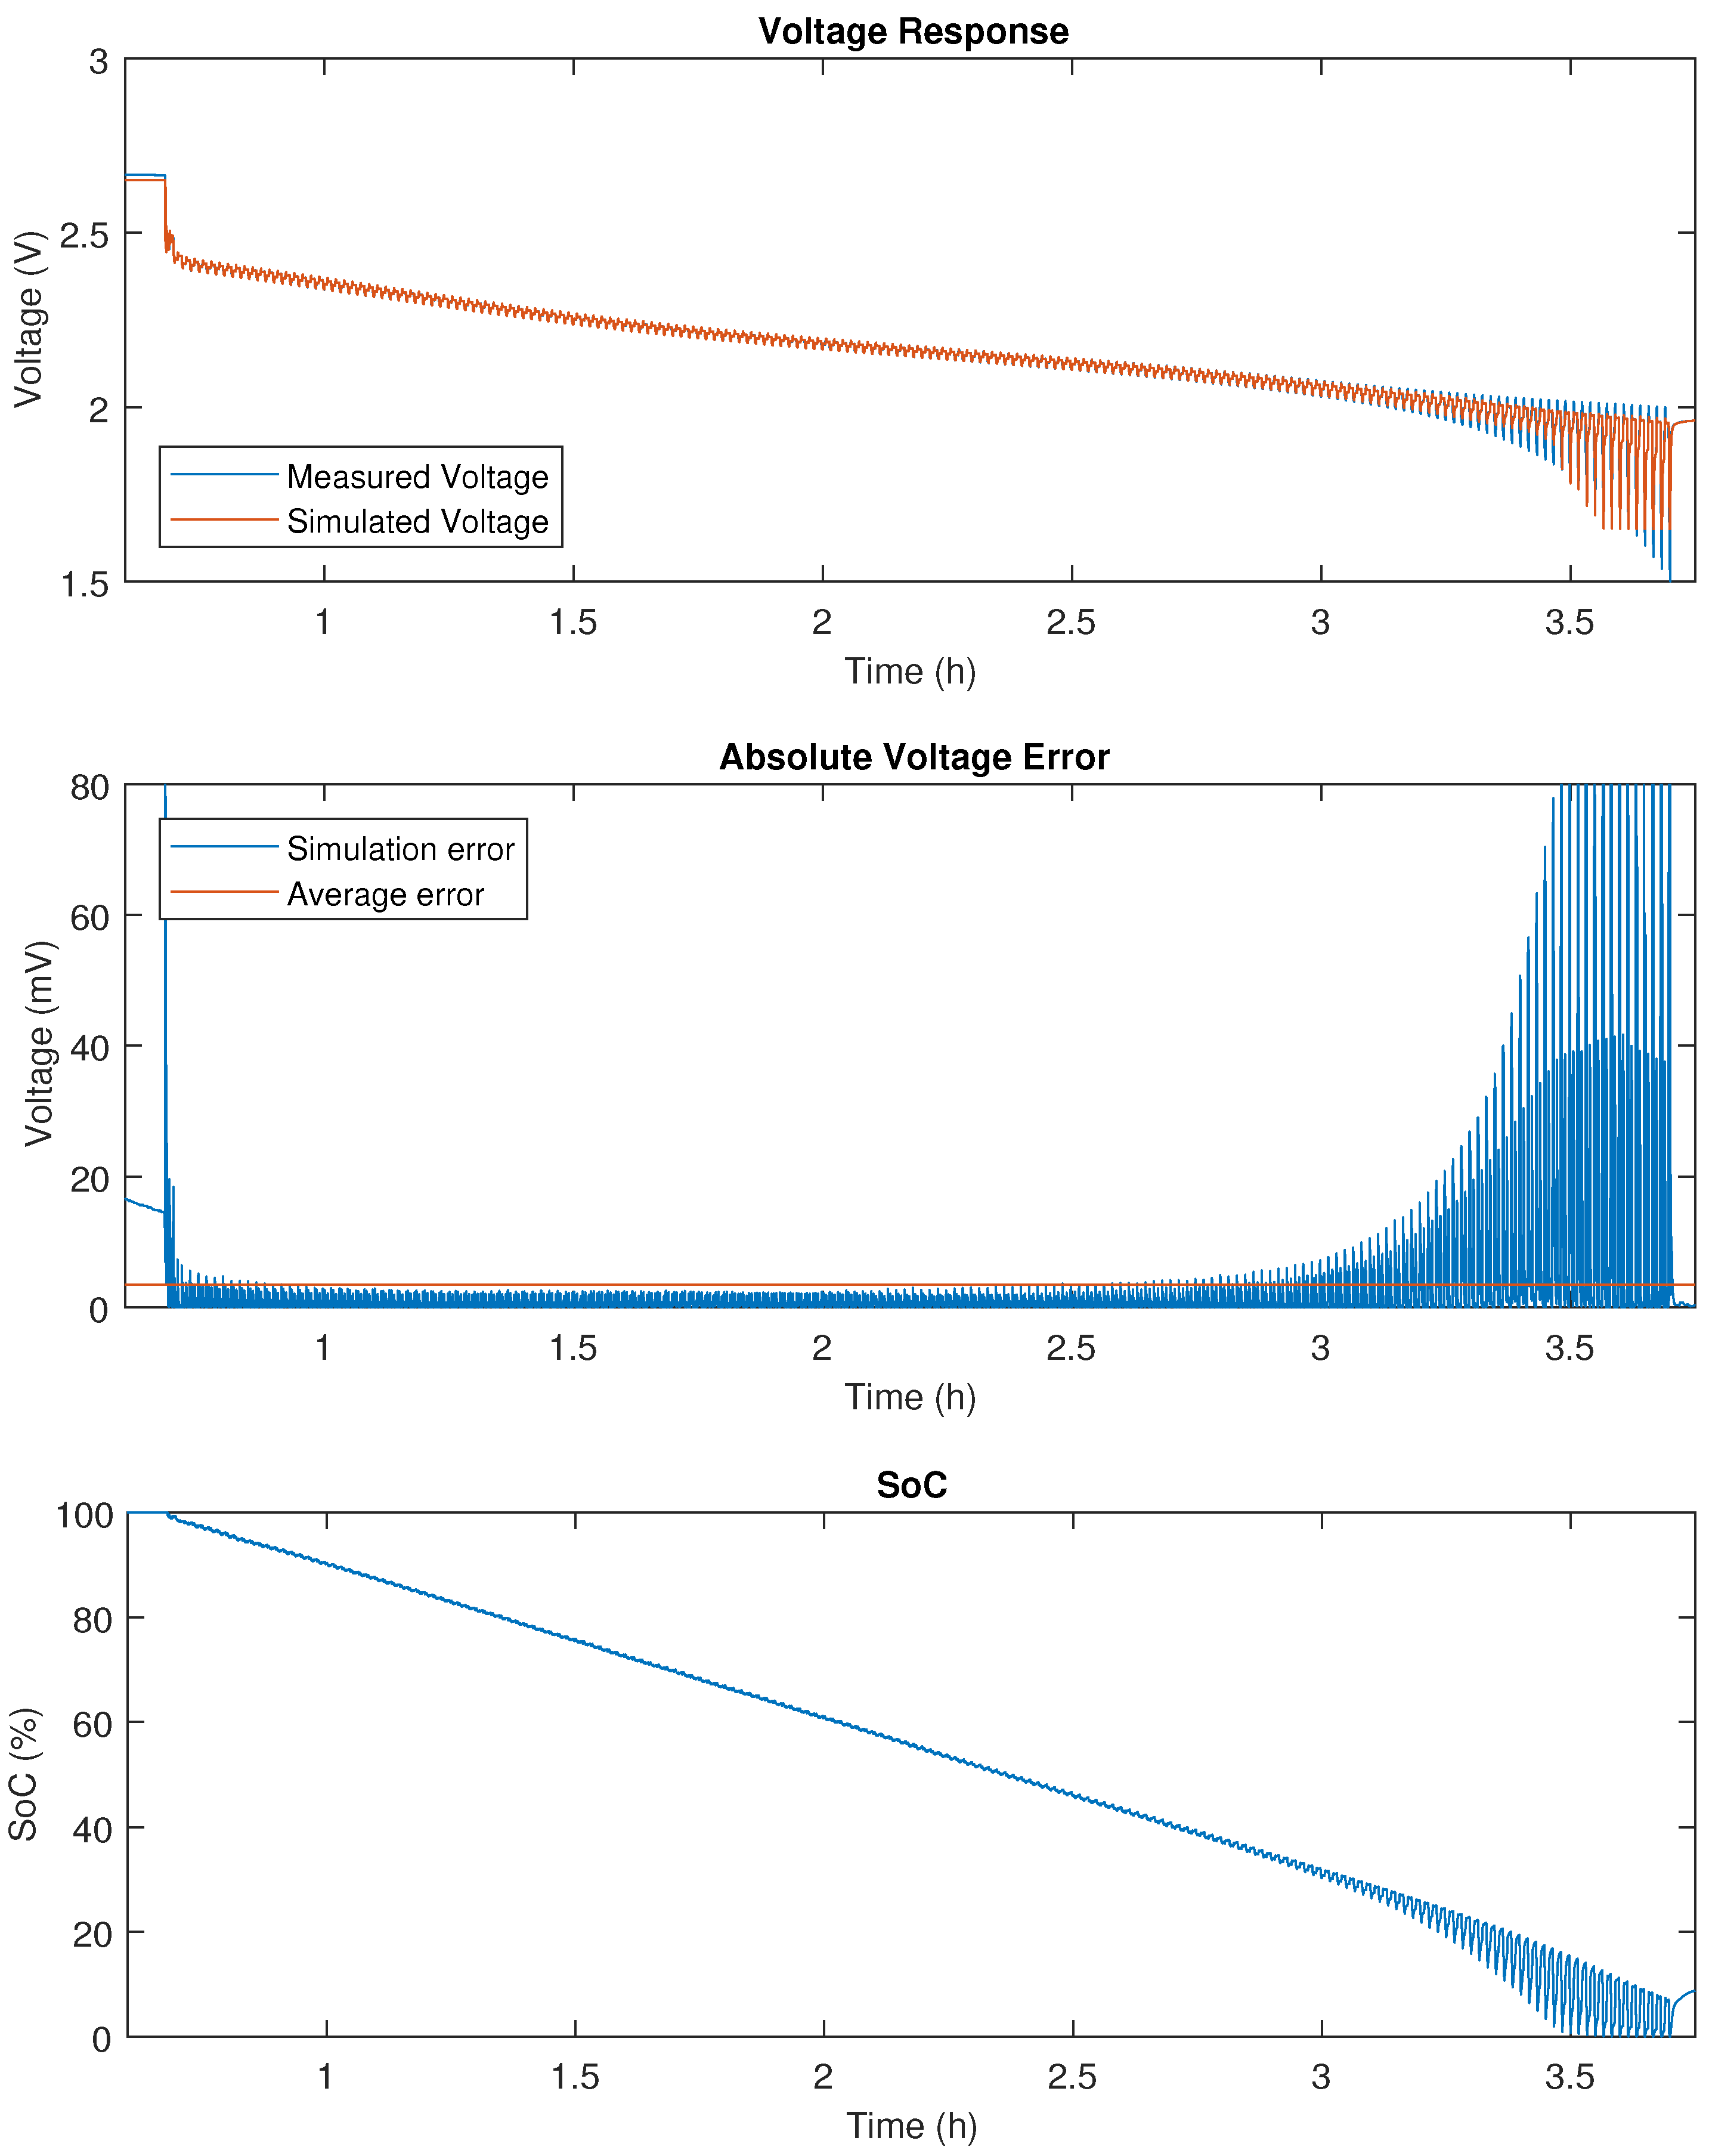
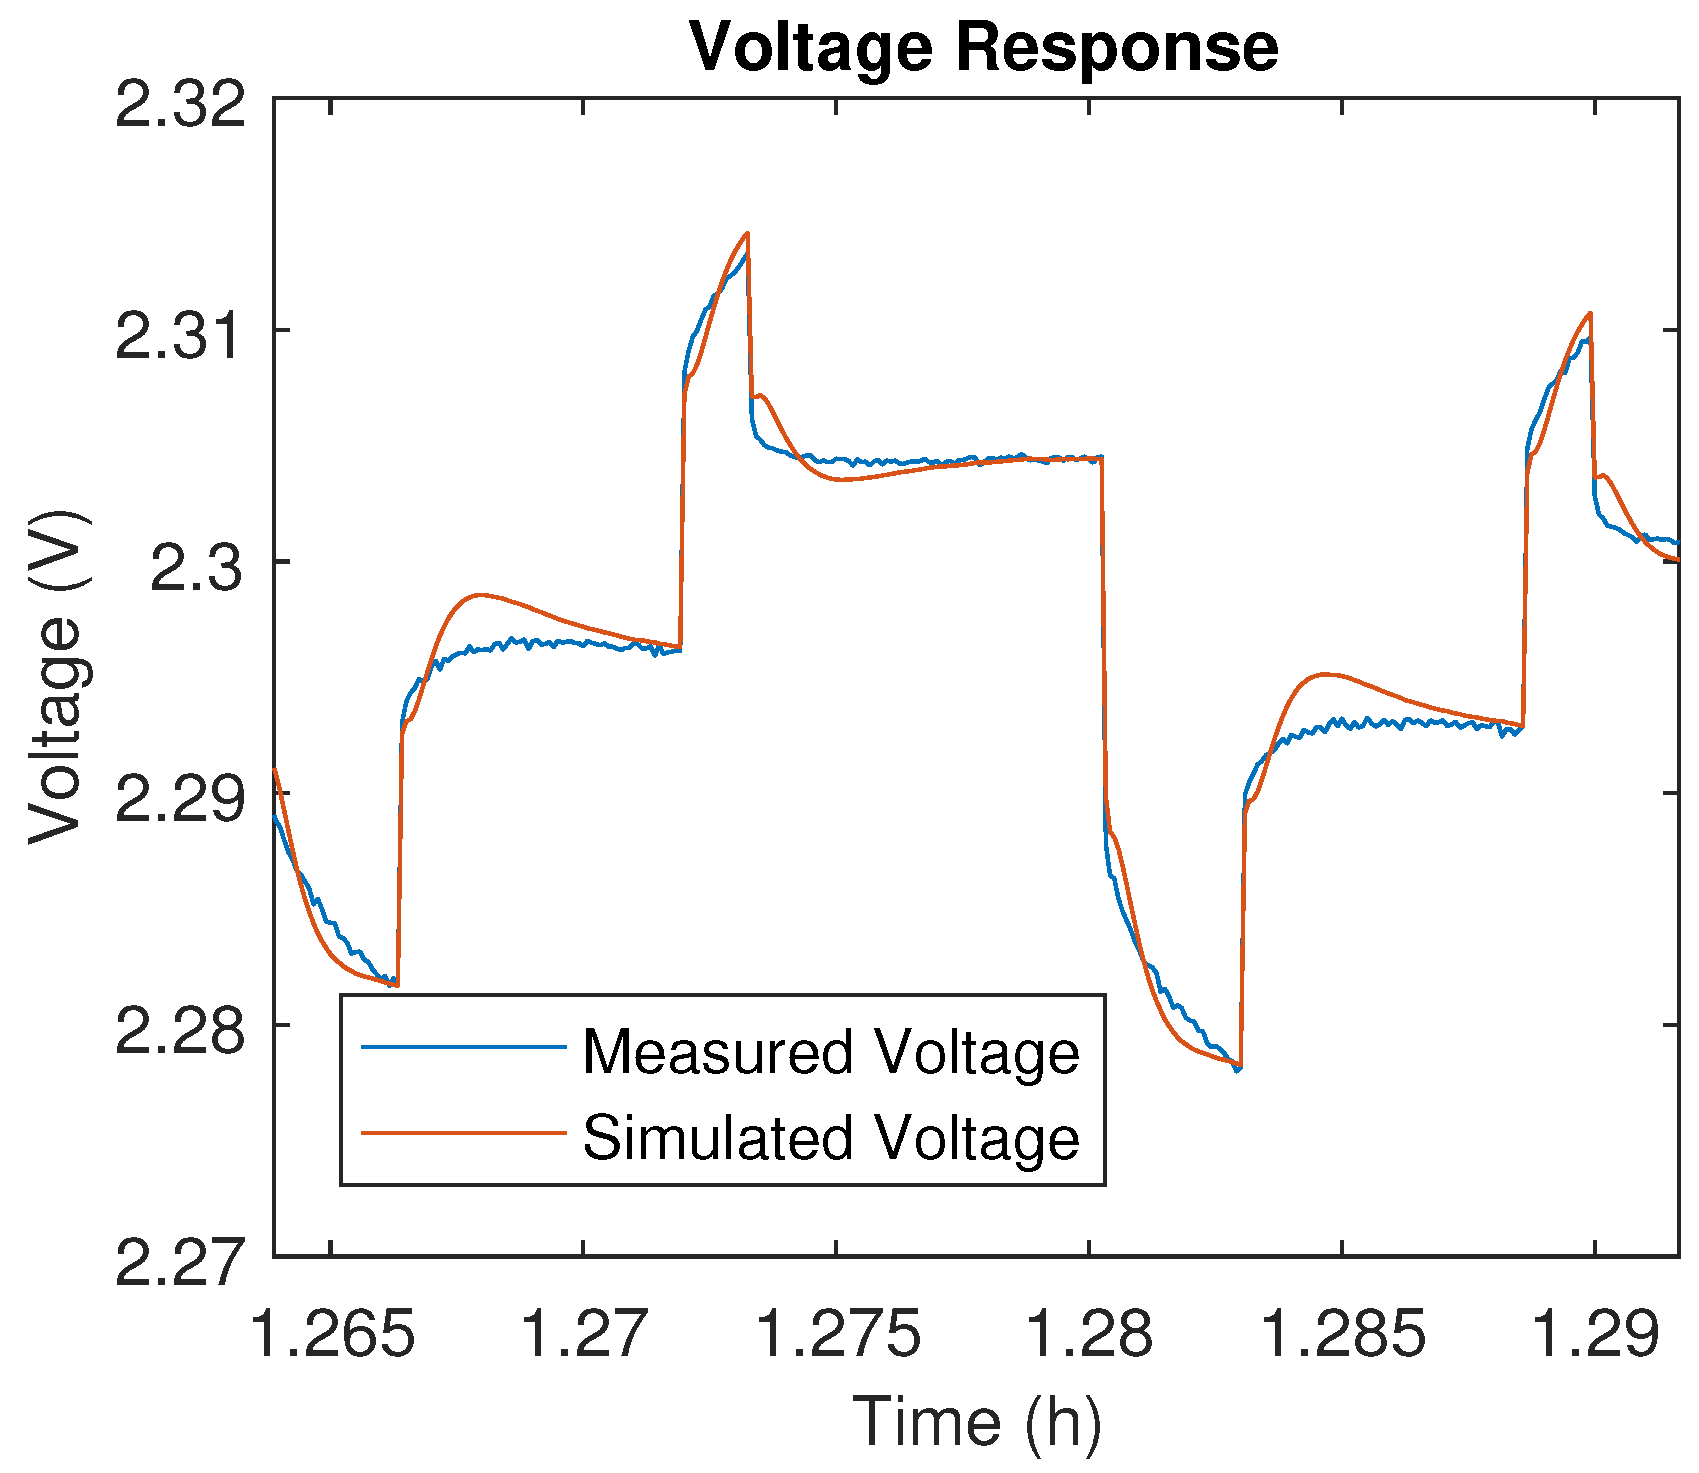
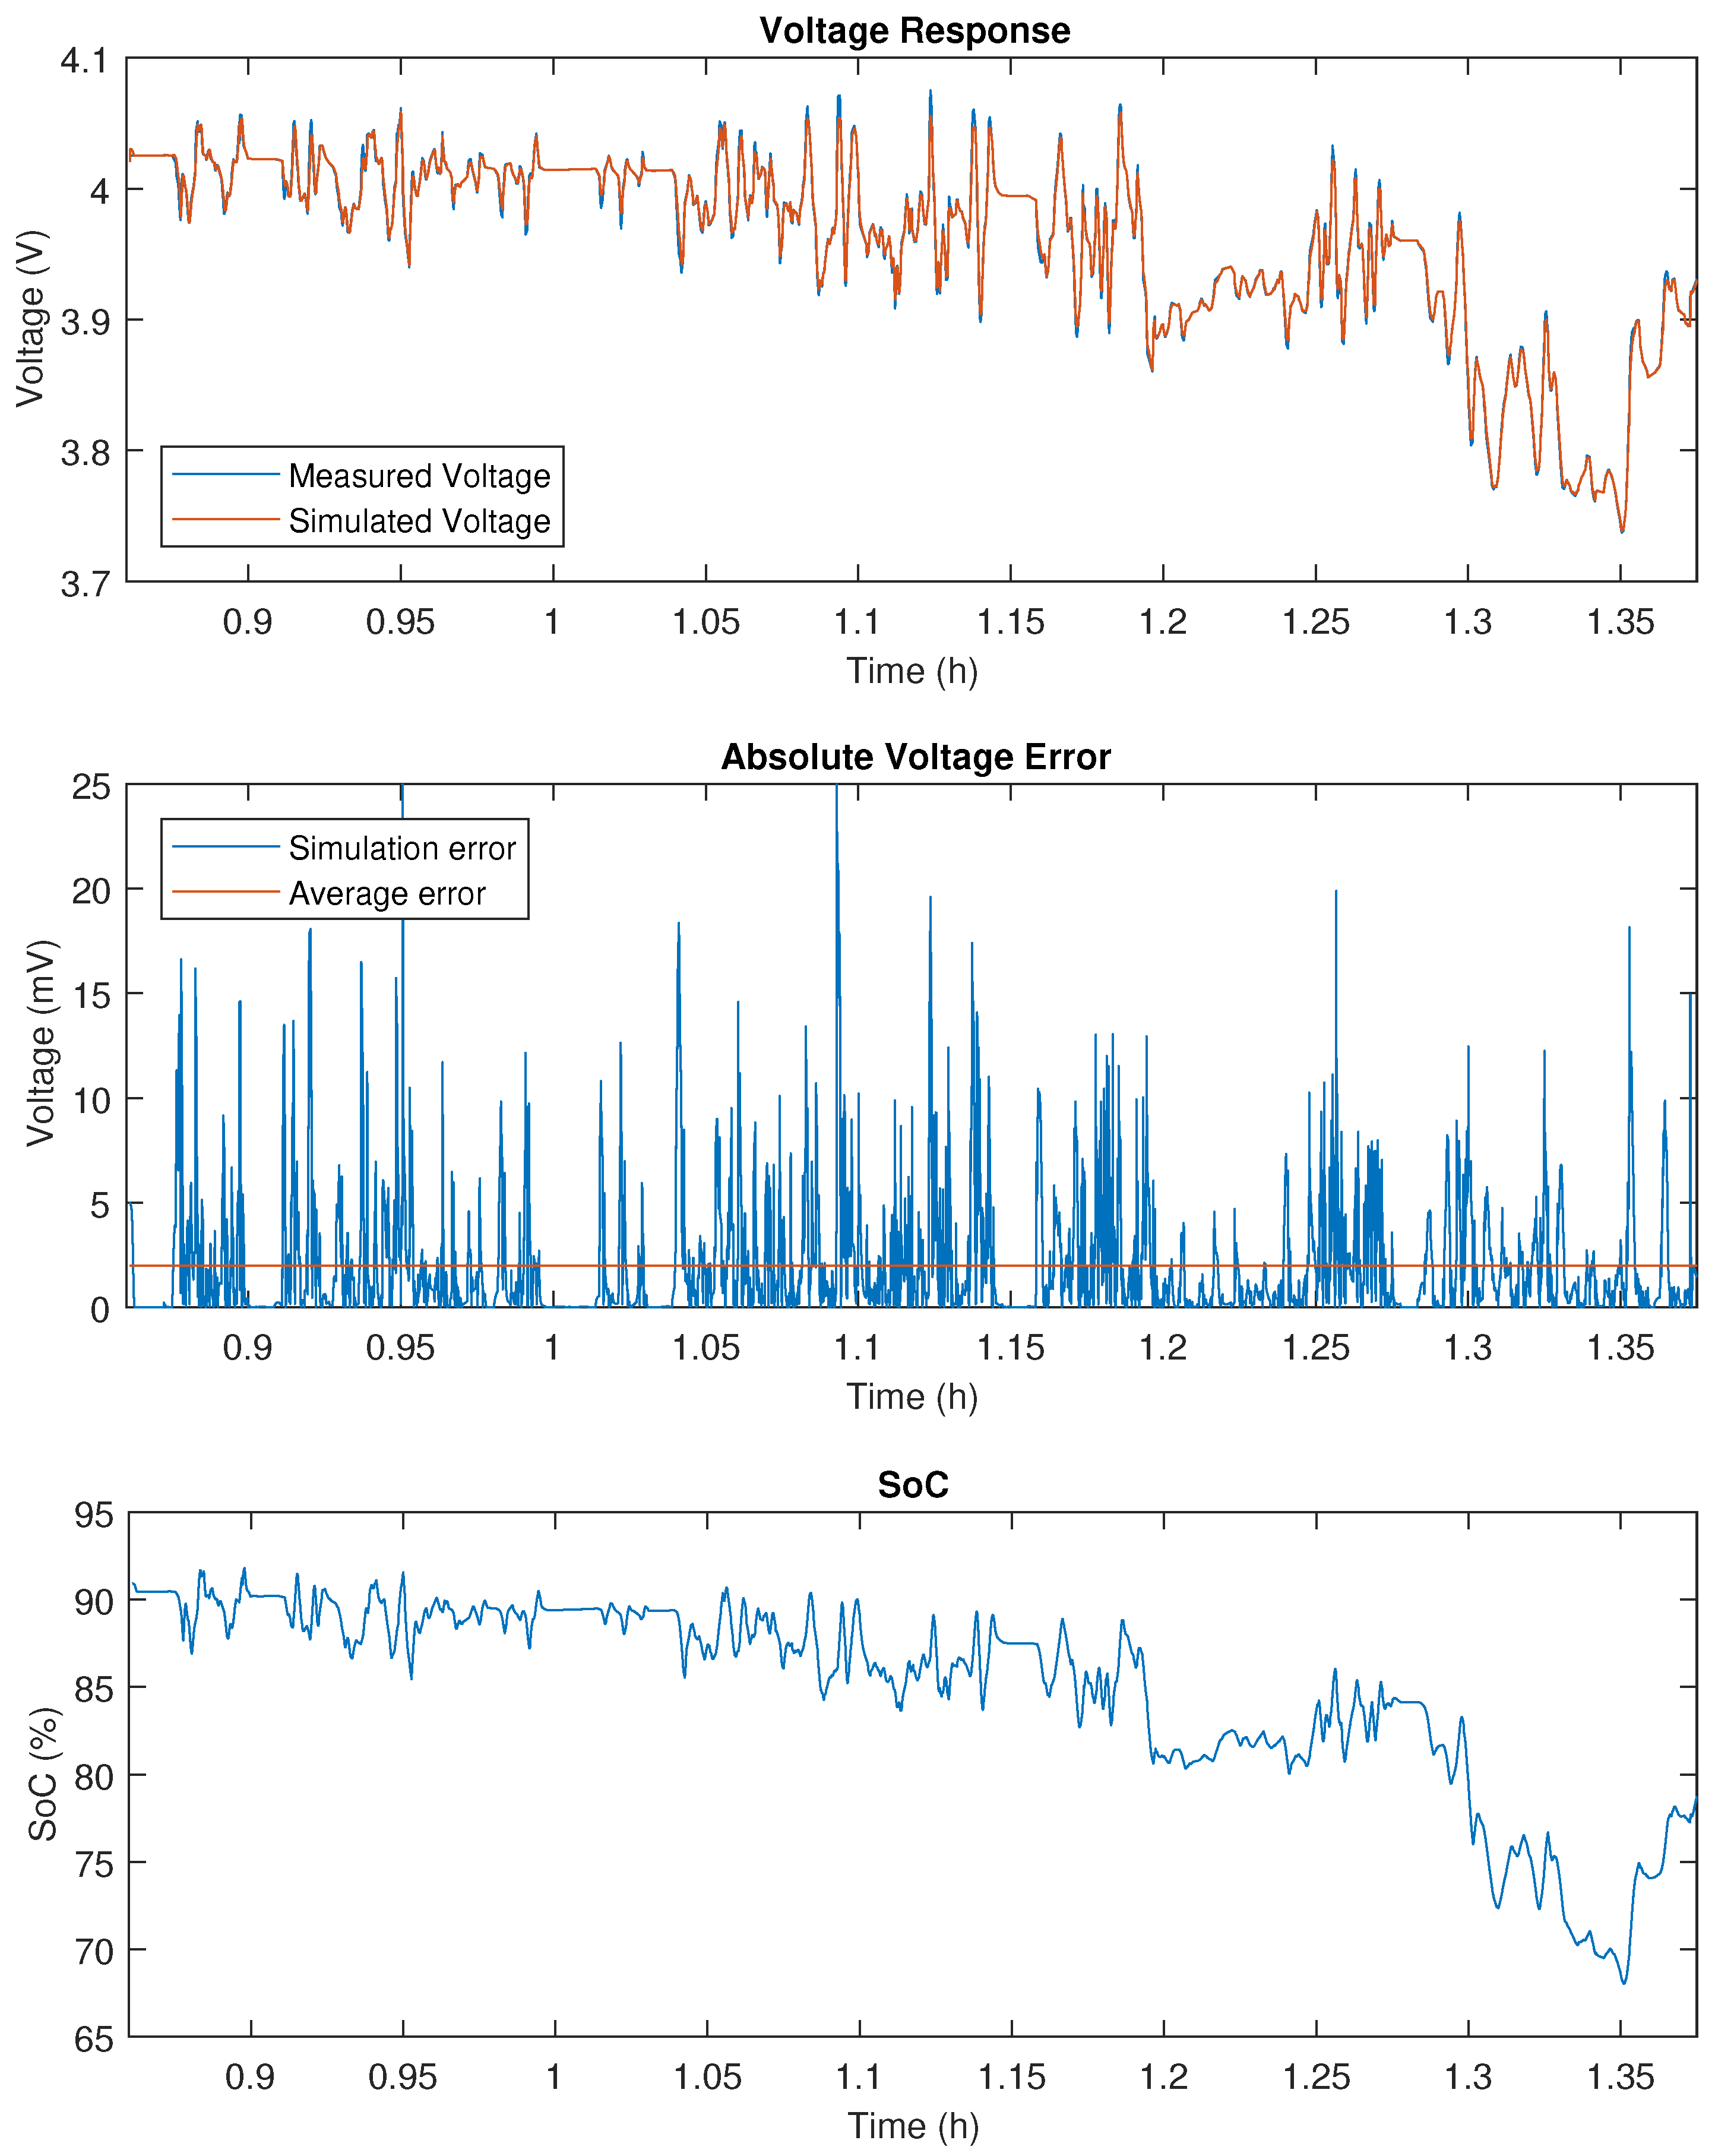
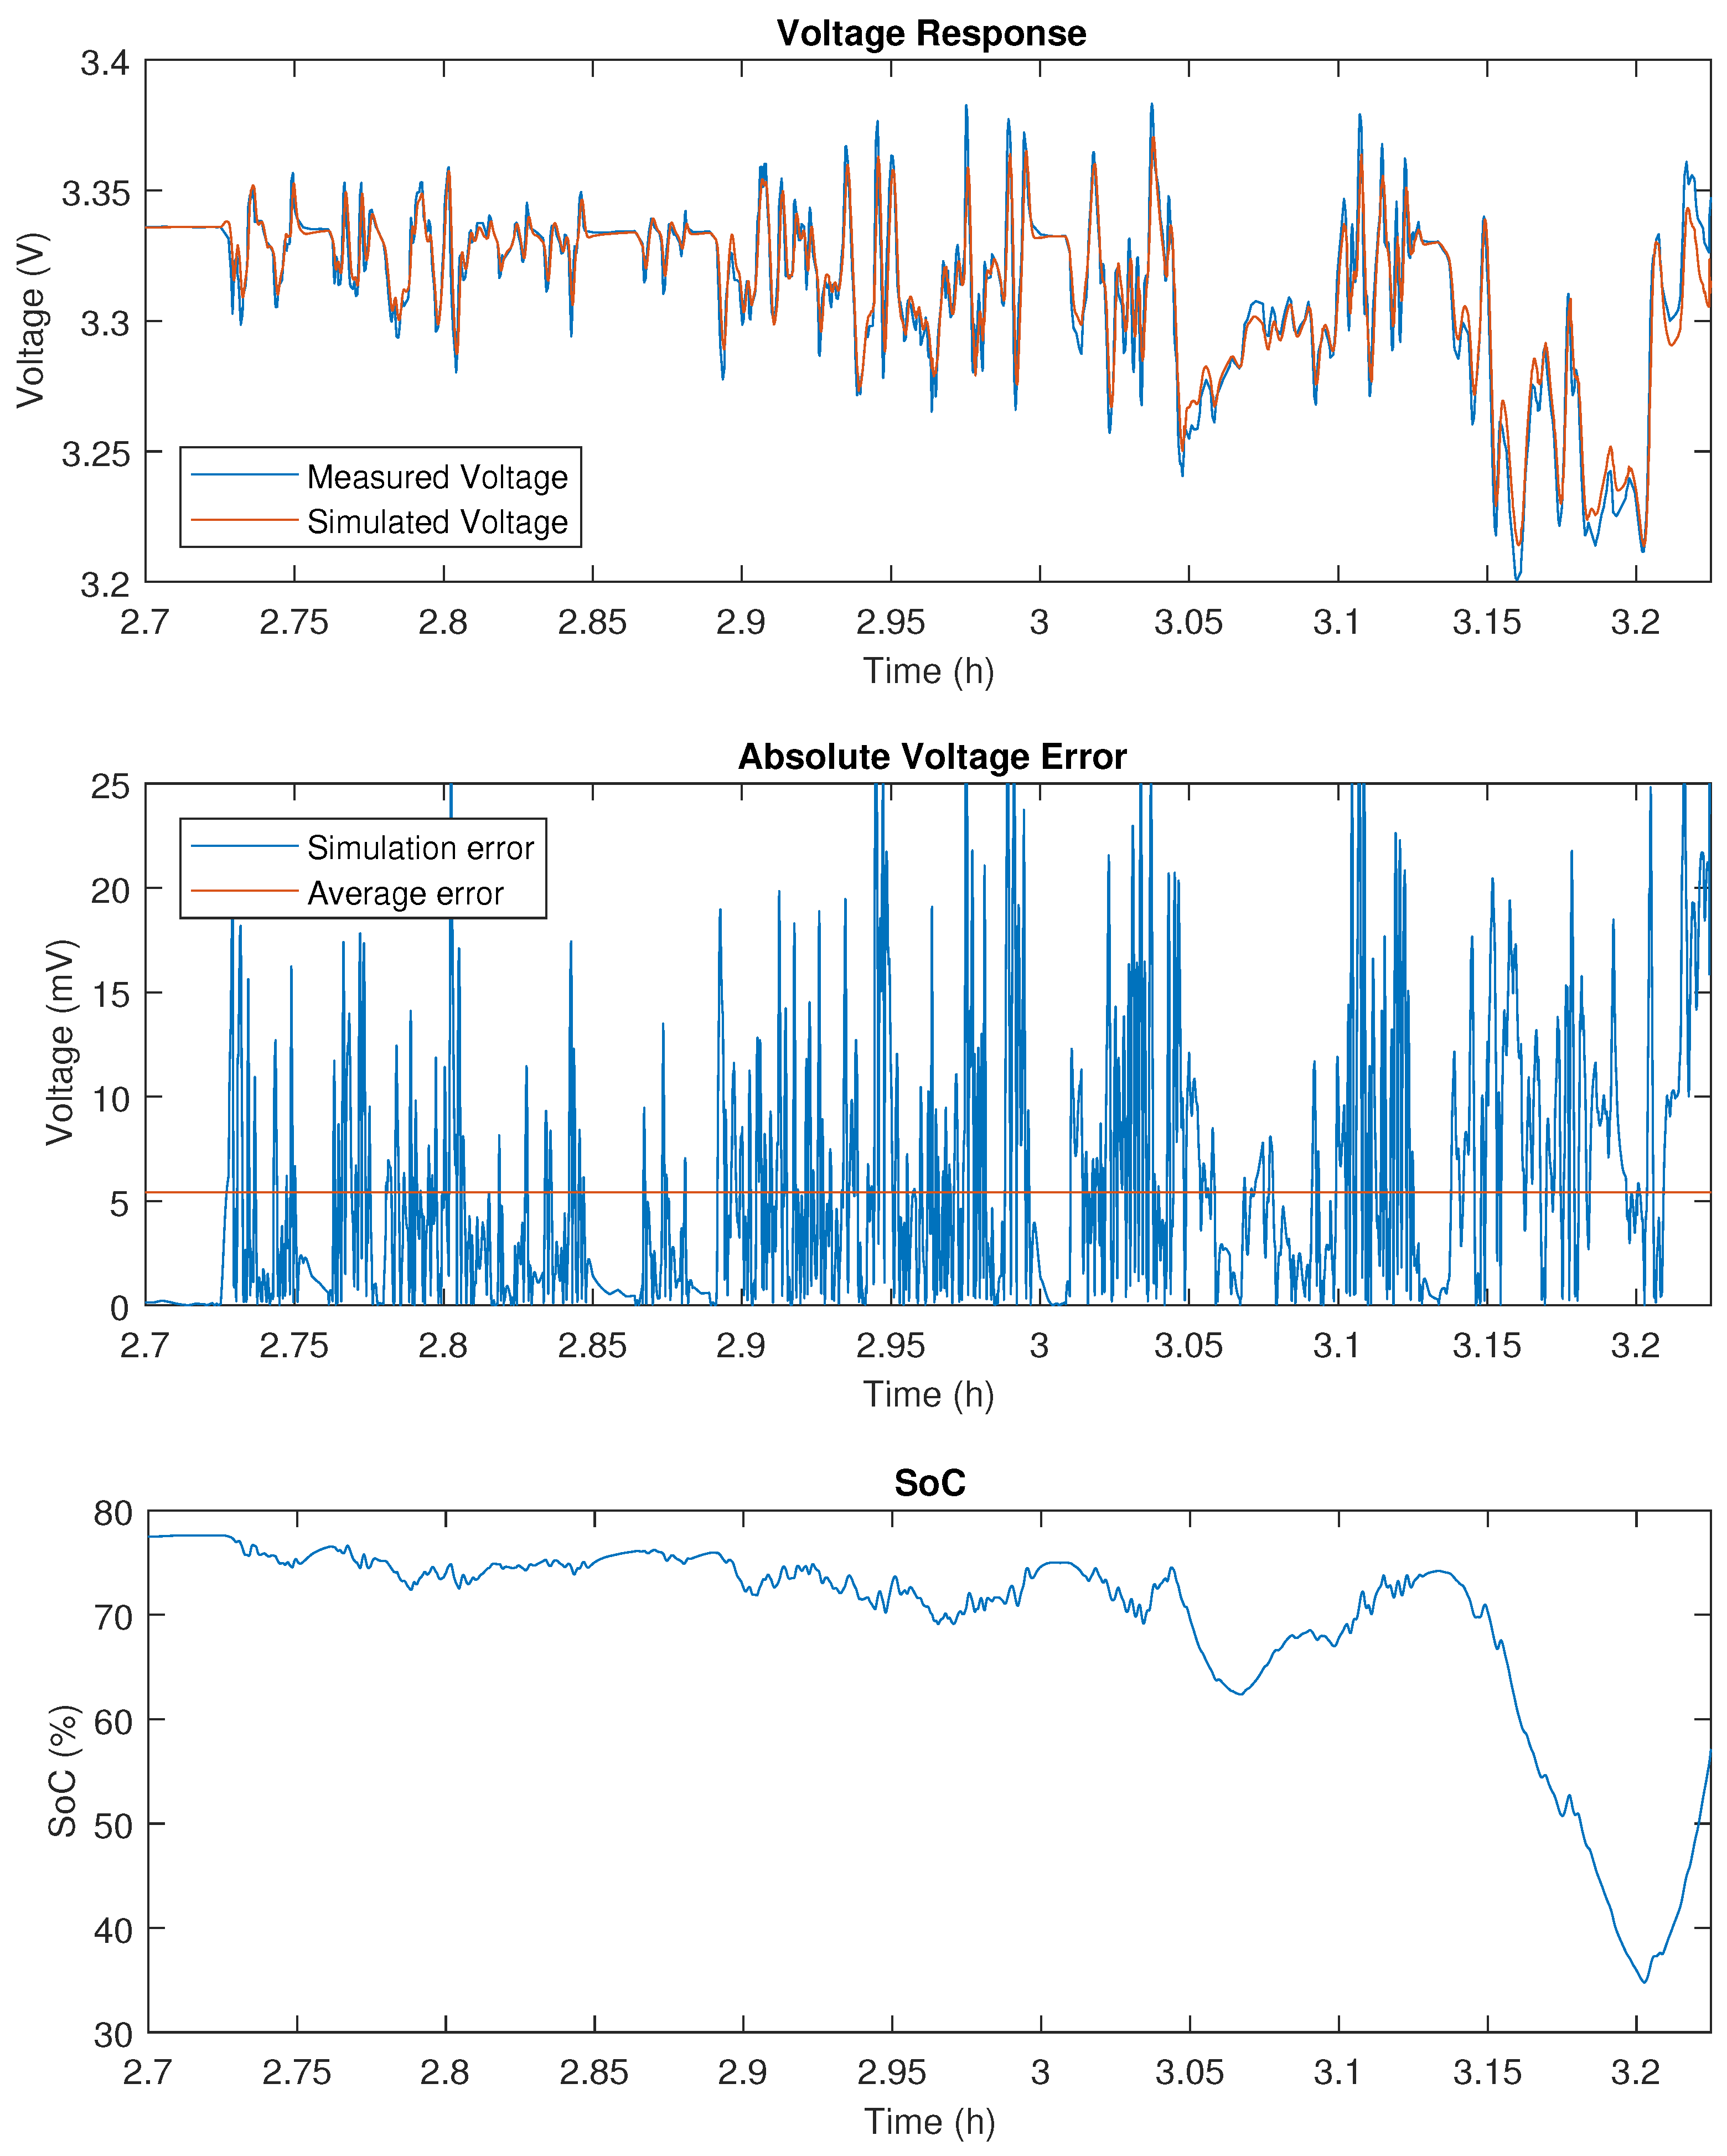
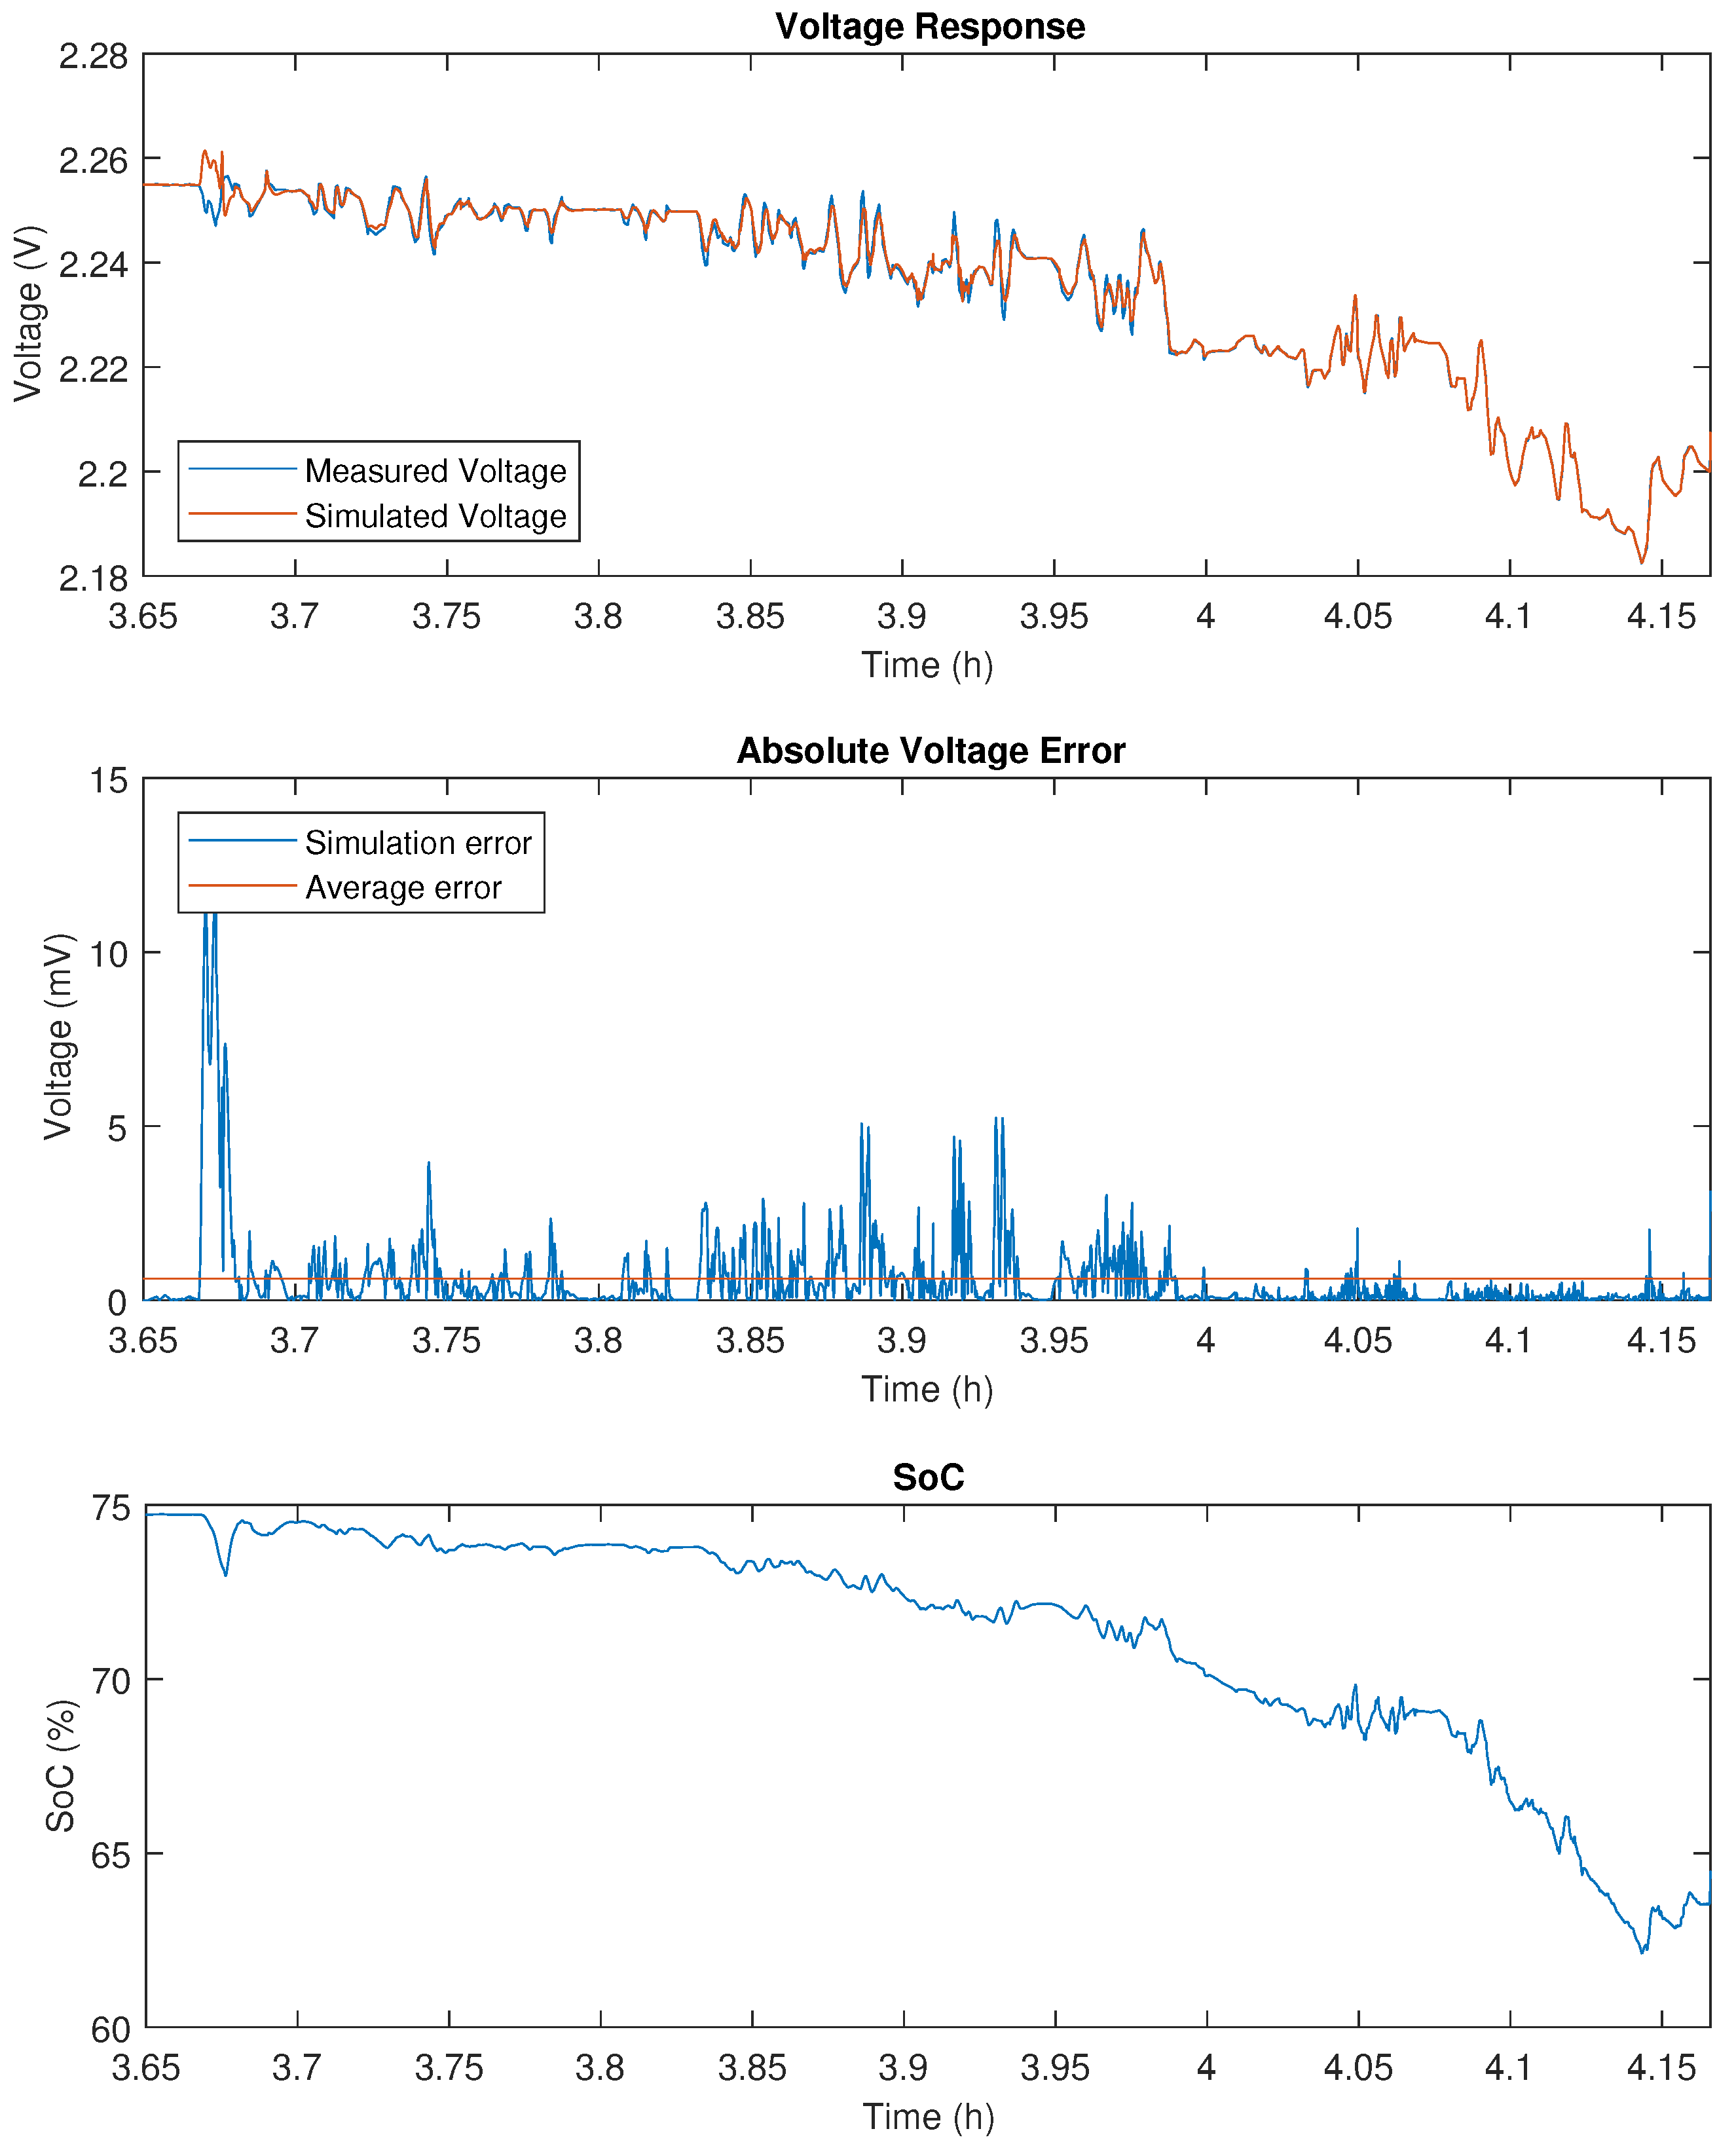
4.1. Comparison of the Battery Model Electrical Performance

Firstly, the Dynamic Discharge Performance Test validation profile at 25 C is performed, of which the simulated voltages and error on these simulations can be observed in the attached Figure A1, Figure A3 and Figure A5 for the 20 Ah NMC, 14 Ah LFP and 5 Ah LTO cell, respectively. Furthermore, detailed simulation results are provided in Figure A2, Figure A4 and Figure A6. While all three chemistries show accurate simulation results with a mean relative error smaller than 0.2%, it is clear that the LFP chemistry poses the biggest challenge to model accurately. This can be attributed to the characteristic flat SoC-OCV relationship of LFP cells in the middle SoC range, which also explains why the estimated SoC shows a less linear trend, as can be seen in Figure A3. It is observed that the simulation for the LFP cells is more accurate in the low SoC range, shown in Figure A4, where the SoC-OCV relationship shows highly linear behavior. Furthermore, the OCV hysteresis is not negligible for LFP cells and should be included in future models to improve simulation accuracy and the reliability of the SoC estimation. Finally, it should be noted that models based on a black box approach, such as the electrical models presented in this paper, have very limited physical meaning. In some cases, this limitation might result in a transient simulated voltage response that is not physically attainable from the cell’s electro-chemistry.
Secondly, the Worldwide harmonized Light vehicles Test Procedure (WLTP) was performed on the three selected cell chemistries at 25 C, of which the simulated voltages and error on these simulations can be observed in the attached Figure A7, Figure A8 and Figure A9 for the 20 Ah NMC, 14 Ah LFP and 5 Ah LTO cell, respectively. All three chemistries show accurate simulation results with a mean relative error smaller than 0.2%. While it is observed that the data driven battery model benefits from a more dynamic load profile to identify and update the model parameters, the more dynamic nature of the profile also poses a bigger challenge to accurately simulate the voltage response. It is observed that the LFP cell shows the least accurate simulation result out of the three tested cell chemistries. This can be attributed to the fact that the WLTP was performed at 75% SoC, where the SoC-OCV relationship for LFP cells is nearly horizontal.
Similarly, both validation profiles were performed for the first order battery model in order to compare their respective performance. A clear overview of the model accuracies for every validation case is presented in Figure 3, where (a) presents the mean absolute error (MAE) on the simulated voltage and (b) presents the mean relative error (MRE) on the simulated voltage. First of all, it should be pointed out that absolute errors can be deceiving when not interpreted correctly—for example, when comparing the MAE from the DDPT with the first order model performed on LTO cells to NMC cells. These results might lead one to believe that the LTO simulation is more accurate, while relatively speaking this is not the case due to the low nominal voltage of the LTO cells.
When comparing the results obtained by the first order model to the second order model, a clear accuracy improvement is realized. For the LFP and LTO cells, the MRE on the DDPT load profile was almost halved—while the NMC cell’s error wasn’t, it still presented an improvement. With regards to the WLTP load profile, both the NMC cell and the LTO cell displayed drastic improvements while the LFP’s improvement was significantly smaller. Overall, it can be concluded that the second order model improves the accuracy significantly for every condition, in accordance with findings in the literature [27]. However, considering the importance of the model’s online implementability in a battery management system (BMS) and the increased computational burden of the second order model, the first order model’s accuracy is deemed sufficient.

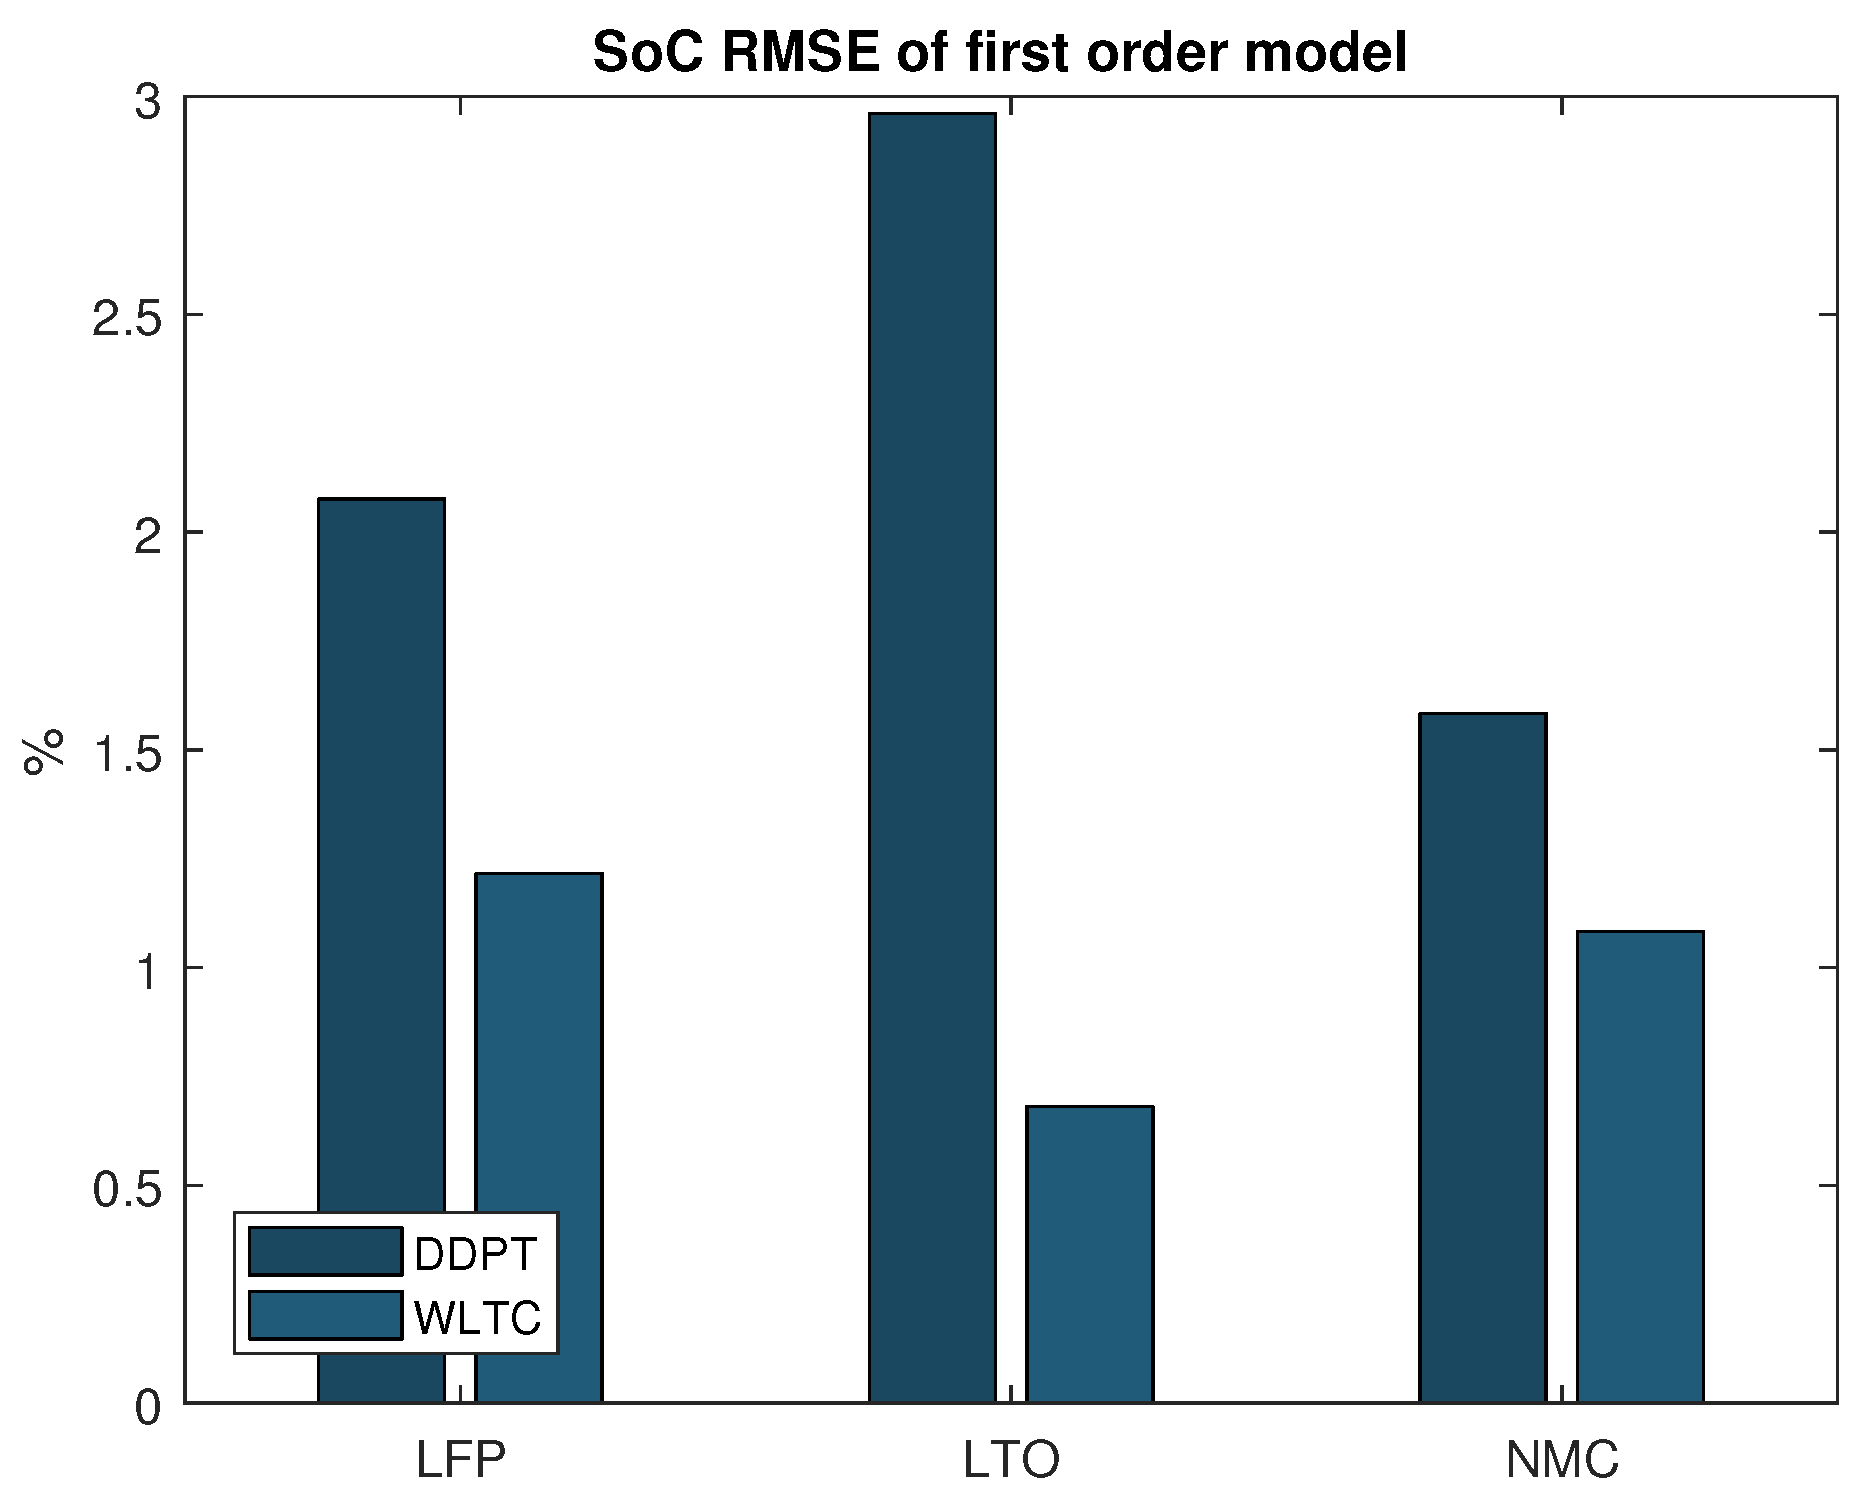
4.2. State of Charge Estimation

To assess the model’s capability to estimate the SoC of the battery accurately, the estimated SoC was studied. It was compared to a reference SoC value, obtained by coulomb counting, which was used to calculate the root mean square error (RMSE) of the estimated SoC. This process is repeated for every cell chemistry and for both validation profiles, the results of which are summarized in Figure 4. The consistently higher error for the DDPT validation profile can be explained by the fact that it contains a complete discharge (100–0% SoC), which includes the highly nonlinear operation ranges. Acknowledging that in real-life conditions these operation ranges are often avoided by car manufacturers and that these conditions are simulated using the WLTP test, it is concluded that the developed model can estimate the SoC of multiple cell chemistries accurately within an RMSE of 1.25%.

5. Conclusions

A general electrical battery model parameter estimation method, based on the recursive least squares identification method with adaptive forgetting factor, was developed for both the first order and second order Thevenin model. The accuracy of these electrical models are paramount for the developed symbiotic State of Charge (SoC) estimation model, which is based on the Extended Kalman Filter. Both models were extensively validated on three different cell chemistries (NMC, LFP and LTO), under load conditions of varying dynamic nature representative for EV applications, using a Dynamic Discharge Pulse Test (DDPT) and the Worldwide harmonized Light vehicles Test Procedure (WLTP). Furthermore, an elaborate comparison of both models’ performance is presented in this research. It is concluded that while the second order model improves the accuracy significantly for every test condition (Mean Relative Error < 0.18%), considering the importance of the model’s online implementability in a battery management system (BMS) and the increased computational burden of the second order model, the first order model’s accuracy (Mean Relative Error < 0.3%) is deemed sufficient. To assess the model’s capability to estimate the SoC of the battery accurately, it was compared to a reference SoC value obtained by coulomb counting, for all three cell chemistries and for both validation profiles. The developed model can estimate the SoC of all three cell chemistries accurately within a root mean square error of 1.25%. In conclusion, the developed model is able to identify and update battery model parameters online, for three different chemistries, potentially reducing offline characterization efforts and allowing monitoring of battery electrical behavior and state estimation over its entire lifetime.

Author Contributions

Conceptualization, L.D.S. and J.-M.T.; Methodology, L.D.S.; Software, L.D.S.; Validation, L.D. S.; Formal Analysis, L.D.S.; Investigation, L.D.S.; Resources, N.O. and J.V.M.; Data Curation, A.N.; Writing—Original Draft Preparation, L.D.S.; Writing—Review & Editing, L.D.S.; Visualization, L.D.S.; Supervision, N.O. and J.V.M.; Project Administration, J.-M.T.; Funding Acquisition, N.O.

Funding

This research was funded by the Flemish Agency for Innovation by Science and Technology (IWT) grant number [IWT130019].

Acknowledgments

This research has been made possible, thanks to the research project “Battle” which was funded by the Flemish Agency for Innovation by Science and Technology (grant number: IWT130019). Further, we acknowledge Flanders Make for the support to our research team.

Conflicts of Interest

The authors declare no conflict of interest.

Appendix A

Figure A1. DDPT validation results on 20 Ah NMC.
Wevj 09 00016 g0a1
Figure A2. DDPT voltage response of 20 Ah NMC at 70% SoC.
Wevj 09 00016 g0a2
Figure A3. DDPT validation results on 14 Ah LFP.
Wevj 09 00016 g0a3
Figure A4. DDPT voltage response of 14 Ah LFP at 5% SoC.
Wevj 09 00016 g0a4
Figure A5. DDPT validation results on 5 Ah LTO.
Wevj 09 00016 g0a5
Figure A6. DDPT voltage response of 5 Ah LTO at 80% SoC.
Wevj 09 00016 g0a6
Figure A7. WLTC validation results on 20 Ah NMC.
Wevj 09 00016 g0a7
Figure A8. WLTC validation results on 14 Ah LFP.
Wevj 09 00016 g0a8
Figure A9. WLTC validation results on 5 Ah LTO.
Wevj 09 00016 g0a9

References

  1. Nava, M. The Road Ahead for Electric Vehicles. BBVA Research. pp. 1–8. Available online: https://www.bbvaresearch.com/en/publicaciones/u-s-the-road-ahead-for-electric-vehicles/ (accessed on 21 June 2018).
  2. Berckmans, G.; Messagie, M.; Smekens, J.; Omar, N.; Vanhaverbeke, L.; van Mierlo, J. Cost Projection of State of the Art Lithium-Ion Batteries for Electric Vehicles Up to 2030. Energies 2017, 10, 1314. [Google Scholar] [CrossRef]
  3. Grunditz, E.A. Performance Analysis of Current BEVs—Based on a Comprehensive Review of Specifications. IEEE Trans. Transp. Electr. 2016, 7782, 1–20. [Google Scholar] [CrossRef]
  4. Hannan, M.A.; Lipu, M.S.H.; Hussain, A.; Mohamed, A. A review of lithium-ion battery state of charge estimation and management system in electric vehicle applications: Challenges and recommendations. Renew. Sustain. Energy Rev. 2017, 78, 834–854. [Google Scholar] [CrossRef]
  5. Lu, L.; Han, X.; Li, J.; Hua, J.; Ouyang, M. A review on the key issues for lithium-ion battery management in electric vehicles. J. Power Sources. 2013, 226, 272–288. [Google Scholar] [CrossRef]
  6. Cuma, M.U.; Koroglu, T. A comprehensive review on estimation strategies used in hybrid and battery electric vehicles. Renew. Sustain. Energy Rev. 2015, 42, 517–531. [Google Scholar] [CrossRef]
  7. Meng, J.; Ricco, M.; Luo, G.; Swierczynski, M.; Stroe, D.; Stroe, A.; Teodorescu, R. An Overview and Comparison of Online Implementable SOC Estimation Methods for Lithium-Ion Battery. IEEE Trans. Ind. Appl. 2018, 54, 1583–1591. [Google Scholar] [CrossRef]
  8. Xing, Y.; Ma, E.W.M.; Tsui, K.L.; Pecht, M. Battery Management Systems in Electric and Hybrid Vehicles. Energies 2011, 4, 1840–1857. [Google Scholar] [CrossRef] [Green Version]
  9. Hu, X.; Li, S.E.; Yang, Y. Advanced Machine Learning Approach for Lithium-Ion Battery State Estimation in Electric Vehicles. IEEE Trans. Transp. Electr. 2016, 2, 140–149. [Google Scholar] [CrossRef]
  10. Chang, W.-Y. The State of Charge Estimating Methods for Battery: A Review. ISRN Appl. Math. 2013, 2013, 953792. [Google Scholar] [CrossRef]
  11. Cheng, Z.; Lv, J.; Liu, Y.; Yan, Z. Estimation of State of Charge for Lithium-Ion Battery Based on Finite Difference Extended Kalman Filter. J. Appl. Math. 2014, 2014, 348537. [Google Scholar] [CrossRef]
  12. Xuan, Y.D.; Gao, Y.X. SOC estimation of Lithium-ion battery based on Kalman filter algorithm. Appl. Mech. Mater. 2013, 347–350, 1852–1855. [Google Scholar]
  13. Huria, T.; Ceraolo, M.; Gazzarri, J.; Jackey, R. Simplified Extended Kalman Filter Observer for SOC Estimation of Commercial Power-Oriented LFP Lithium Battery Cells; SAE Technical Paper 2013-01-1544. In Proceedings of the SAE World Congress, Detroit, MI, USA, 16–18 April 2013. [Google Scholar]
  14. Xiong, R.; He, H.; Sun, F.; Liu, X.; Liu, Z. Model-based state of charge and peak power capability joint estimation of lithium-ion battery in plug-in hybrid electric vehicles. J. Power Sources 2013, 229, 159–169. [Google Scholar] [CrossRef]
  15. Wang, Q.; Wang, J.; Zhao, P.; Kang, J.; Yan, F.; Du, C. Correlation between the model accuracy and model-based SOC estimation. Electrochim. Acta 2017, 228, 146–159. [Google Scholar] [CrossRef]
  16. Nikolian, A.; Firouz, Y.; Gopalakrishnan, R.; Timmermans, J.-M.; Omar, N.; van den Bossche, P.; van Mierlo, J. Lithium Ion Batteries—Development of Advanced Electrical Equivalent Circuit Models for Nickel Manganese Cobalt Lithium-Ion. Energies 2016, 9, 360. [Google Scholar] [CrossRef]
  17. Zhang, X.; Wang, Y.; Liu, C.; Chen, Z. A novel approach of remaining discharge energy prediction for large format lithium-ion battery pack. J. Power Sources 2017, 343, 216–225. [Google Scholar] [CrossRef]
  18. Zhang, X.; Lu, J.; Yuan, S.; Zhou, X. A novel method for identification of lithium-ion battery equivalent circuit model parameters considering electrochemical properties. J. Power Sources 2017, 345, 21–29. [Google Scholar] [CrossRef]
  19. Zhang, C.; Allafi, W.; Dinh, Q.; Ascencio, P.; Marco, J. Online estimation of battery equivalent circuit model parameters and state of charge using decoupled least squares technique. Appl. Energy 2018, 142, 678–688. [Google Scholar] [CrossRef]
  20. Xiong, R.; He, H.; Sun, F.; Zhao, K. Online Estimation of Peak Power Capability of Li-Ion Batteries in Electric Vehicles by a Hardware-in-Loop Approach. Energies 2012, 5, 1455–1469. [Google Scholar] [CrossRef] [Green Version]
  21. He, H.; Zhang, X.; Xiong, R.; Xu, Y.; Guo, H. Online model-based estimation of state-of-charge and open-circuit voltage of lithium-ion batteries in electric vehicles. Energy 2012, 39, 310–318. [Google Scholar] [CrossRef]
  22. Duong, V.; Bastawrous, H.; Lim, K.; See, K.; Zhang, P.; Dou, S.X. Online state of charge and model parameters estimation of the LiFePO4 battery in electric vehicles using multiple adaptive forgetting factors recursive least-squares. J. Power Sources 2015, 296, 215–224. [Google Scholar] [CrossRef]
  23. Vahidi, A.; Stefanopoulou, A.; Peng, H. Recursive least squares with forgetting for online estimation of vehicle mass and road grade: theory and experiments. Veh. Syst. Dyn. 2005, 43, 31–55. [Google Scholar] [CrossRef]
  24. Plett, G.L. Extended Kalman filtering for battery management systems of LiPB-based HEV battery packs Part 1. Background. J. Power Sources 2004, 134, 252–261. [Google Scholar] [CrossRef]
  25. Plett, G.L. Extended Kalman filtering for battery management systems of LiPB-based HEV battery packs Part 2. Modeling and identification. J. Power Sources 2004, 134, 262–276. [Google Scholar] [CrossRef]
  26. Plett, G.L. Extended Kalman filtering for battery management systems of LiPB-based HEV battery packs Part 3. State and parameter estimation. J. Power Sources 2004, 134, 277–292. [Google Scholar] [CrossRef]
  27. He, H.; Xiong, R.; Fan, J. Evaluation of Lithium-Ion Battery Equivalent Circuit Models for State of Charge Estimation by an Experimental Approach. Energies 2011, 4, 582–598. [Google Scholar] [CrossRef] [Green Version]
Figure 1. Equivalent circuit diagram of (a) first order battery model and (b) second order battery model [16].
Wevj 09 00016 g001
Figure 2. Flowchart of complete data driven battery model parameter estimation model.
Wevj 09 00016 g002
Figure 3. (a) Mean Absolute Error (MAE) and (b) Mean Relative Error (MRE) on voltage simulation for the first and second order battery model under Dynamic Discharge Pulse Test and Worldwide harmonized Light vehicles Test Procedure load profile.
Wevj 09 00016 g003
Figure 4. Root mean square error (RMSE) on the State of Charge estimation of the first order model.
Wevj 09 00016 g004
Table 1. Cell specifications of tested cells.
NMCLFPLTO
Cathode MaterialLi(NiCoMn)O 2 LiFePO 4 NiCoMn
Nominal Capacity20 Ah14 Ah5 Ah
Nominal Voltage3.65 V3.2 V2.2 V
Charging/Discharging cut-off voltage4.15 V/2.5 V3.65V/2.0V2.80 V/1.50 V
Energy Density174 Wh/kg120 Wh/kg42 Wh/kg
Power Density *2300 W/kg2500 W/kg2250 W/kg
* (Depth Of Discharge (DoD) 50%, 10 s discharge).

