1. Introduction
The microblogging platform Twitter is rapidly expanding since its official launch in 2006. As of December 2015, the estimated total number of Twitter registered users exceeds 1.3 billion who, in total, post an average of 500 million tweets per day, while hundreds of millions of Twitter users login daily [
1]. Twitter allows users to share information via short messages of 140 characters [
2]. A percentage of 63% of Twitter users say that it is a source of news for them [
1], thus Twitter is becoming an essential part of electronic communication for governments [
3,
4]. Governments may use Twitter to disseminate information, to offer updates about the government, to alert users to emergencies, to connect with the public, to listen to the voice of citizens, to build relationships and to provide access to services [
5,
6]. The dialogic nature of Twitter [
7] that enables real-time, two-way communication among users allows governments to create online communities that defy organizational boundaries and traditional communication, reach and transform citizens from passive recipients of digital information and services to active participants who monitor administrative activities and administrative requests, and take part in the formation of consensus on specific issues [
6,
8,
9]. However, few government organizations are truly embracing all that Twitter and other social media have to offer as they are using them only to provide information and rarely to promote dialogue and consultation [
5,
10,
11]. Content that does not drive comments is ineffective. Therefore, governments, in order to use Twitter effectively and give citizens another way to participate in government, have to realize that they can leverage the power of the crowd to collect real-time feedback and to create and spread messages and shift from using Twitter as one-way information platform to a two-way communication channel [
12].
In the chaos of Twitter and other social networks, a few accounts (opinion leaders, influential people, key players) exist who have a lot of influence on the others’ opinions [
13]; they can act as intermediaries to accelerate or stop the spread of information [
14], they start major conversations, or gather content from many conversations [
15]. Some popular accounts of real-life celebrities, politicians, and news media have enormous numbers of followers while the majority have only a few [
16] and the average number of followers in Twitter is 208 [
1]. The same happens at the following action. Some users follow thousands, while others follow only a few [
17], and a significant percentage of 44% have created a Twitter account and has never sent a tweet [
1]. Thus, the majority of Twitter users have no influence. In previous studies on Twitter, a variety of characteristics, both personal and social, have been used to identify influencers and each study measures influence from different aspects [
18,
19,
20,
21,
22,
23]. In this vein, a question that arises is which Twitter accounts are influential and how influence is measured?
This research proposes a method to assess the influence of e-government agencies, taking into account the concepts of activity of the accounts and community formation among followers. It then uses an idea initially introduced to assess blog influence. It records the accounts of 56 ministries of EU countries. The choice of this level of analysis may provide evidence and a description of a first, nationwide, and more general level of e-government, while analysis could not be limited to this particular level. In this paper, the analysis is restricted to the Twitter accounts of ministries for comparison of several countries with a diverse e-government adoption level.
2. Measuring Influence in Twitter
“
One American in ten tells the other nine how to vote, where to eat, and what to buy. They are the Influentials. They aren’t the richest 10 percent or the best educated 10 percent. They aren’t the early adopters who are always the first to try everything. They are, however, the 10 percent of Americans most engaged in their communities” claimed Keller and Berry [
24]. Bakshy
et al. [
25] mentioned that the “influencers” exhibit some combination of desirable attributes that allows them to influence a disproportionately large number of others. Thus, an emerging question is what influence is and what defines an Influential?
Social influence “
describes the phenomenon by which the behavior of an individual can directly or indirectly affect the thoughts, feelings and actions of others in a population” [
26,
27]. The fluidity of environments, the variations of platforms and the evolving behaviors of users online make difficult the attempts to define the concept of influence on social media [
18]. Ye and Wu [
28] stated that social influence “
occurs when an individual’s thoughts or actions are affected by other people” and Leavitt
et al. [
18] took into consideration that, in Twitter communities, two actions intrinsic to the system can occur: the reply and the retweet, so they defined “
influence on Twitter as the potential of an action of a user to initiate a further action by another user”.
One popular metric of influence on Twitter is number of a user’s followers. This metric implies that the more followers a user has, the more impact the user has, as the user seems to be more popular [
18]. However this metric focuses on Twitter as a broadcast medium and ignores the potential for users’ interactions. Taking this into consideration, Leavitt
et al. [
18] claimed that influence on Twitter depends on the fundamental structure of ideas in the environment and how these ideas move. Thus, they used the actions of a user, tweets-replies-retweets, to measure influence. An account has three different types of influence [
19]: (1) in-degree influence, the number of followers of a user, directly indicates the size of the audience for that user; (2) retweet influence, which indicates the ability of that user to generate content; and (3) mention influence, which indicates the ability of that user to engage others in a conversation. The authors compared the three different measures of influence and found that the most followed users did not necessarily score highest on the other measures [
19]. The three types of influence [
19] will later be taken into account in the analysis of this paper.
Kwak
et al. [
20] also compared three different measures of influence: (1) number of followers (2) page-rank; and (3) number of retweets—finding that the ranking of the most influential users differed, depending on the measure. Rankings based on retweets differ and do not necessarily correlate with user’s social status. According to their findings, retweeting plays an important role in the diffusion of information in the network, as no matter how many followers a user has, any tweet being retweeted is likely to reach an average of 1000 users. Desai
et al. [
29] also used re-tweets (amplified tweets) and the number of tweets authored by each participant of the 2013 Association of Program Directors in Internal Medicine Twitter community, to investigate if experienced individuals are also the most influential members. They developed a multivariate linear regression model to identify any relationship to social media influence, measured by the PageRank. According to their findings, any participant who was able to author the greatest number of tweets or have more of his/her tweets amplified could wield a greater influence on the participants, regardless of his/her authority. A different approach undertaken by Saito [
30], as an alternative method for ranking Twitter users, takes into consideration the number of others that a user follows. Two types of users exist. The first type follows a small number of others while the second type follows almost as equally many others as the number of its followers. They concluded that the number of others that a user follows is as equally important as the number of followers when estimating the importance of a user in the Twitter-sphere. Asghar
et al. [
31] explored some content-based features to evaluate their role for estimating the popularity of an account generally estimated by the number of followers. They tried to find out the co-relation of celebrities’ popularity with a number of other features, like frequency of tweets posted by a celebrity and the relevancy of tweets to their domains. The study revealed many unseen patterns existing in celebrities’ Twitter usage that includes computing per day tweet frequency and finding out how it correlates with number of followers. They found out the correlations of tweets with domains of the celebrities. Zhou
et al. [
32] investigated how the behaviors of individuals in a social network will be influenced by their neighbors, the authorities and the communities in a quantitative way. They proposed a convex optimization approach to discover the hidden network of social influence by modeling the recurrent events at different individuals as multidimensional Hawkes processes, emphasizing the mutual-excitation nature of the dynamics of event occurrence, and took into account the prior knowledge of the presence of neighbor interaction, authority influence, and community coordination in the social network. They claimed that the proposed method can discover the hidden network more accurately and produce a better predictive model than several baselines. Zhai
et al. [
33] questioned the existing ranking methods based on the overall popularity of the authors and the tweets without considering the author’s expertise. They proposed a topical authority-based ranking method for social networks like Twitter and investigated how the underlying topical feature modeling can be optimized for performance boosting. Their experimental results showed the importance of topical authority for ranking microblogs. Finally, Weng
et al. [
26], in analogy with PageRank, defined TwitterRank to rate influential users and compared users’ rankings based on number of followers with TwitterRank. Findings show that ranking depends on the influence measure.
The focus of previous studies on measuring influence on Twitter is based on comparisons between different influence measures and the lack of a method that takes into consideration all of the important features in terms of Twitter function. A measure helps to provide basic information in a social network. In turn, a combination of measures defined as a ranking measure provides a criterion to rank each user of a network [
34]. This paper uses activity and popularity, and followers’ community characteristics on Twitter, to rank the accounts.
3. E-Government Twitter Social Networks
In the e-government context, Twitter and other social media serve as platforms for sharing information on key political developments, engaging the public, exchanging views, increasing participation, and stimulating political debates [
35,
36]. The functions identified by Organisation for Economic Co-operation and Development (OECD) [
37] as the stages in the development of policy making are information, consultation, and active participation. Information flows in one direction, from the government to citizens. Governments disseminate information on policy-making on their own initiative—or citizens’ access information upon their demand. Consultation is a limited two-way relationship between government and citizens. Governments ask for citizens’ views, questions, criticism to bodies of administration and receive citizens’ feedback on policy-making. Finally, active participation is an advanced two-way relation between government and citizens based on the principle of partnership. Citizens themselves take a role in the exchange on policy-making. At the same time, the responsibility for policy formulation and final decision rests with the government.
In Twitter, at the information stage, administrators of governmental accounts should strengthen popularity and activity of the accounts. At the next stage, efforts should focus on strengthening the influence of the account through the increased diffusion and penetration of the messages [
22,
34]. Thus, consultation can be measured by the response of the users to the messages of each government agency through the responses they produce. Through the acts of following, mentioning, replying, and retweeting, discussion may be promoted in Twitter, small or larger networks of users may be constructed, communities may be formed, and consultation may be lead to the next stage of active participation. Communities have the ability to sustain member relations, affect the individual-group interactions [
38] and increase opportunities for citizens to participate and collaborate in government public service delivery. Through the communities that are formed, a message may be distributed and receive attention from an amount of users even though they are not followers of the account that made the tweet [
39]. In this vein Anger and Kittl [
22] noted: “the further the content is spread, the further the influence of the user reaches”.
This paper, in addition to activity and popularity of the accounts, explores whether potential communities of citizens, who follow governmental Twitter accounts, are formed. In this way it takes into consideration the status of the proposed stages of governmental Twitter accounts presence; information diffusion and community formation and discussion. Then, it uses the properties of the formed communities in the ranking system.
Twitter, as any other social network, can be represented by a graph as a set of nodes (accounts) and of directed edges that represent how the nodes are related. The nodes in a network can be connected by very short paths. Two properties of community formation are considered: small-worlds and homophily. Small-worlds and homophily are considered a state of the art methodology to explore community formations. Small-worlds are networks where each actor can practically reach any other actor in a small number of steps. The property of a social network to be so rich in short paths is known as the small-world phenomenon [
40]. Such networks are crucially important for communications [
41] as information spreads far faster than in a network where the paths between nodes are relatively long [
42,
43]. Small-world networks have two properties: the average shortest path length in the network is significantly smaller than the average shortest path length in a random graph of the same size, so most nodes in the network could be reached by any other node in a small number of steps [
44] and the clustering coefficient is large, meaning that the nodes connected to a given node are also likely to be connected to one another [
45]. Additionally, if degree skewness is large, this signifies the property that few accounts are active, while the majority are not. Such a network is known as scale-free network and a scale-free network is also typical of a small-world.
Clustering coefficient, average shortest path, degree skewness, and assortativity of the networks are used to describe community characteristics. The first three are used to study the small-world formation. The clustering coefficient ranges from zero to unity. Large values of clustering coefficient support the existence of small-worlds since they are indicative of high connectivity. If a network has a degree-distribution with a very large skewness, that is, only few users post the most while the large proportion of followers post a little, this also provides evidence that the network has the property of a small-world. Assortativity on the other hand, is the tendency that nodes mostly connect with similar nodes. Homophily is evident when positive assortativity exists. Assortativity may take values between −1 and 1. If assortativity is close to 1 then actors with many connections tend to connect to actors with many connections.
This paper calculates and uses clustering coefficients, average shortest paths, skewness, and assortativity of the mentions/replies networks of the ministries Twitter accounts, to include the properties of small-worlds and homophily in the community formation analysis. On the other hand, it examines the relative placement of the ministry accounts within these networks. Thus, it uses two Social Networking Analysis indexes of centrality to see how central the ministry accounts are in their mention/reply networks.
4. Methodology
This paper proposes a methodology for assessing the performance of e-government Twitter accounts. This research is part of a greater project, which aims to measure the relative placement of Greek ministries’ accounts on Twitter, compared with the relative or similar ministry accounts of EU countries. Thus, at first, a list of the Greek ministries was constructed. Only similar ministries of EU countries were searched and recorded. This exclusion of some EU countries ministries from the study may sound as a limitation, however the objective is to produce a Twitter Authority Index which could be applied in any e-government context and the specific data only serve as an example to demonstrate the proposed method. Similar analyses could be done to produce rankings of all the ministries of EU countries.
The accounts of 56 ministries of EU countries are studied. The paper places special importance in the study of the activity and popularity of the accounts, on one hand, and the potential of the accounts to provide the space within which citizens can form communities, on the other. In these communities the citizens may reproduce the messages originally tweeted by the accounts, and even comment and reply, acting in this way within a context of information diffusion and connectivity.
The 56 accounts of ministries of 17 countries were located during 19–28 February 2013. The search started from the websites of the ministries of Foreign Affairs, Development, Health, Education, Environment, and Finance of EU countries and the links to Twitter accounts were located.
Next, for each account the following were recorded:
number of followers of the account,
followers per day (calculated as an average over a three months period),
number of tweets,
tweets per day (calculated as an average over a three months period), and
famous words total effective reach.
All indexes provide evidence of the popularity and the activity of the accounts plus the growth rate of the activity and popularity of the counts. Total effective reach is an indicator of the potential spread of the information tweeted by the accounts, since it estimated how many people a tweets can reach.
After recording the followers, and the number of tweets of the accounts of the ministries, their mentions/replies (m/r) networks were recorded. By recording how the followers of each ministry account mention or reply, the study tries to describe the activity and involvement of users within a community context.
To record the m/r networks, an extended survey was done: mentions and replies were recorded using NodeXL for Windows, every three days for a three month period following the time of the initial recording of the ministries’ accounts. This is done in order to record not just a random snapshot giving partial picture of the networks. The networks consist of the followers of the ministries who mention/reply to the ministries and their followers who mention/reply. The final networks of followers were constructed in the fashion that if a follower mentions another or replies to another follower for a particular ministry, then the first follower is connected to the second one. Duplicates recorded during the three month period were removed.
NodeXL provided only up to 10,000 nodes per account, so larger m/r networks with many followers mentions/replying, for example for the networks of some UK ministries, could not be recorded. In such cases only up to the 10,000 most recent followers per network replying and mentioning, were recorded. The findings in these cases should be interpreted with caution.
Another set of indexes were also recorded:
the normalized in-degree of the accounts, and
the normalized betweenness of the accounts within the m/r network
were calculated. These two indexes provide evidence of how central the ministry accounts are in m/r networks, which is how central they are and how important they are in the sense that other citizens mention or reply to them. They are indirect measures of the community and information diffusion and discussion commented by the tweets of the involved ministries.
are calculated to serve as indicators of small-worlds formation and homophily. Community formation, discussion, and diffusion of information are desirable properties of citizens’ engagement.
The paper regards two basic axes of Twitter performance:
Activity and popularity of the accounts. This is measured through a series of indexes. Followers, number of tweets, tweets per day, followers per day, and famous words total effective reach, are used in this analysis. Followers and tweets, plus followers per day and tweets per day, are measures of activity and popularity, and they also show the rate of the network expansion. The fifth index that is added in the analysis is the famous words total effective reach. This counts the potential reach to users, and it is measured summing the followers that the fourteen most popular tweets of the accounts reach. Twtrland.com provided the scores for each one of the 14 famous tweets in order to calculate the total index. This index takes account of the retweets to calculate how many accounts the tweets reach. Thus, the first two of the three types of influence (followers, retweets) [
19], are taken into consideration.
It should be noted that more indexes could be included in this first axis, since this application describes a framework that could be modified or expanded to include several indexes that measure activity and popularity. All of the indexes will be summarized later using a Principal Component Analysis into just one principal component. The idea is to include, and then summarize, all the decided indexes in just one factor which will, hereafter, describe activity and popularity. Numbers of followers, followers per day, and total effective reach, were adjusted by dividing them by the population of each country before entering the analysis, for comparison.
Community building. The second main concern of the paper is to include in the analysis the property of community formation among citizens since community formation, discussion and diffusion of information signify a maturity stage of e-government adoption. The mentions/replies (m/r) networks are a suitable context to search for communities of followers who actively read, retransmit, and comment. Two sub-axes can now be proposed: the relative placement of the ministry accounts within the networks, and the potentiality of the networks to form small-worlds or exhibit homophily. Including the mention/replies network in the analysis, the third type of influence (mentions/replies) are taken into consideration [
19]. Thus, the two sub-axes are:
- (a)
Centrality of the ministry accounts within the m/r networks. It is crucial to measure the relative importance of the accounts with regards to the position they have within the m/r networks. That is, how central or how active an e-government account is regarding mentions and replies? Regarding all the mentions and replies within the network of the ministry and its followers, how many of them actually mention and reply to the ministry and not to each other? To measure this, Social Networking Analysis (SNA) centrality indexes are used. Specifically, two measures of centrality are used: the ministry account (ego) normalized betweenness centrality, and the ministry account (ego) normalized in-degree centrality (both calculated using igraph in R). In-degree centrality measures how many mentions/replies the ministry accounts get; it is the total number of followers of the ministries in the m/r networks. Betweenness centrality is equal to the number of shortest paths from all vertices to all others that pass through the ministry node—account. It is considered that a node with high betweenness centrality has a large influence on the transfer of information. These two seem to be the proper centrality measures to use in m/r networks which are networks of messages, while other centrality indexes also exist.
- (b)
Potentiality to form communities in the m/r networks. It is interesting to measure small-world formation and homophily in the mentions/replies networks because these networks have the potential to advance communication among followers of the ministries’ accounts and diffusion of information. It is known, at the moment and at this level of analysis, that small-worlds are generally not formed and homophily hardly exists [
46]. However, if we would like to include the potentiality of m/r networks to form small-worlds and present homophily, given that networks are not generally similar, nor do they have uniform properties, then we could add a third axis in the analysis, the one that measures small-world formation and homophily. We could include the four indexes to this axis: clustering coefficient, shortest average path, skewness, and assortativity.
In a network clustering coefficient of a vertex quantifies “how close the vertex and its neighbors are to being a complete graph” [
47]. In a small world graph the clustering coefficient
C is much larger than that of a random graph with the same number of vertices and average number of edges per vertex [
44]. Teutle [
47] (p. 184) who investigated Twitter network properties, claimed that “users with more clustering coefficient mean that they deploy stronger communities that exchange messages among them. These people are able to know about events happening in the network quicker than those who do not have higher clustering”. Adamic [
48] who investigated the properties of the World Wide Web found that it is a small-world, in the sense that sites are highly clustered, yet the path length between them is small. The structural properties of graphs that hold the small-world phenomenon are also quantified by a second metric: the characteristic path length
L. That is, the number of edges in the shortest path between two vertices, averaged over all pairs of vertices [
49] (p. 653). In a small-world the characteristic path length L is almost as small as
L for the corresponding random graph. Using these two properties Jin and Bestavros [
49] claimed that there is clear evidence for the small-world phenomenon in the Internet topologies. Mislove
et al. [
50] examined four popular online social networks: Flickr, YouTube, LiveJournal, and Orkut. They crawled the publicly-accessible user links on each site, obtaining a large portion of each social network’s graph. Their results confirmed the power-law, small-world, and scale-free properties of online social networks. Skewness describes the degree of asymmetry of a given distribution around its mean. If skewness is close to 0 the distribution of the data is symmetric. Positive skewness indicates a distribution with an asymmetric tail extending toward more positive values and negative skewness a distribution with an asymmetric tail extending toward more negative values [
51]. Skewness has been recorded for many characteristics in online social network. Li
et al. [
52] investigated video requests from online social networks. They found that the skewness of video popularity is so large that about 2% most popular videos account for 90% of total views. Jungherr [
53] investigated Twitter usage patterns by publics, prominent users, and politicians. Highly-skewed activity was recorded with few users posting many messages and many users posting very few. Assortativity index denotes the degree-similarities between neighboring nodes and takes values from −1 to 1. If assortativity is greater than 0 and close to 1 then the nodes in the network tend to connect with other nodes of similar degree while negative assortativity shows that a node is connected with nodes of arbitrary degrees [
54,
55]. Thus, the assortativity index is used to measure homophily [
56]. Kydros
et al. [
54] used the assortativity index to provide some insights in the structure of the Greek Parliament. Their findings indicate that the Greek Parliament Network is a small-world network, rather dissasortative. Bliss
et al. [
57] investigated the assortativity index to investigate “happiness” in Twitter reciprocal reply networks. They supported that “happiness is assortative” and can be detected up to three links away. Al Zamal
et al. [
58] evaluated the extent to which features present in a Twitter user’s immediate neighbors can improve the inference of attributes possessed by the user. Their findings indicate that the attribute of interest has a moderate to high degree of assortativity.
However, it is recently known that clustering coefficient is almost invariant and close to zero, and so is the average shortest path [
46]. Thus, in the present analysis, only skewness and assortativity of the mentions/replies networks are used to produce the third PC.
Karpf [
59] introduced a method for assessing blogs’ influence. The original idea was to use four established indexes of activity, networking, and popularity, and combine them to estimate an overall score of performance. Karpf [
59,
60] suggested using a Blogosphere Authority Index as a combination of the three best scores of the four indexes: Network Centrality Score (calculated within the networks of blogs), Hyperlink Authority Score as measure of the blog’s authority within blogosphere provided by Technorati.com, Site Traffic Score as a measure of the visits to the blog provided by
www.sitemeter.com and Alexa.com traffic rankings, and Community Activity Score as a measure of participation calculated by the blog comments.
Using the idea originally introduced by Karpf [
59,
60], we define a new index which is adjusted to fit Twitter and its specifications and peculiarities. We use the three indexes that describe activity/popularity, m/r network centrality (ego), and m/r community formation to include two main aspects of an e-government maturity procedure: reach to the citizens and citizens’ participation. For each one of the three sets of initial variables a Principal Component Analysis (PCA) was done. Each one of the three PCA was forced to result to one PC. So, at this stage, three PC were constructed, one from each PCA on each index set, to summarize the variables of the three index sets. The factor scores of the three PC were then ranked in a descending order so that the larger would take the first ranks.
The total rank is the sum of the three ranks minus the largest of the three (the worst rank). Next, the rank of the total rank is calculated. This is the overall performance score of the accounts on Twitter, a Twitter Authority Index:
A calculation such as this eliminates the problem of the cases with missing values for some of the three indexes; this sometimes happens in small networks and in cases that the accounts have little activity. In these cases the rank of the relative index is assigned the largest value 56. Next, in the calculation of the final rank, the worst value is taken out.
The three ranks of the PC join the calculation have equivalent weights, since besides the activity of an account the potential of the account to form communities where discussion and diffusion of information is taking place is significant.
In order to calculate the final score some conditions should apply. The three indexes activity/popularity, centrality, and community formation should by inter-correlated, form a unidimensional overall index, and have a high reliability coefficient, otherwise an overall index calculated as the sum of the three indexes might be meaningful. Thus, in the analysis three steps were taken to ensure that the three conditions hold: a correlation matrix of the three ranked indexes was constructed (correlations should be high enough and statistically significant), a PCA should result in the formation of only one PC (for unidimentionality), and Cronbach’s alpha was calculated for the three ranks and it should be larger than 0.70 to ensure internal consistency.
5. Findings
The frequencies of the recorded ministries per country are as follows: England 6, Poland 4, Romania 2, Greece 6, Finland 3, Sweden 2, Latvia 6, Germany 3, Bulgaria 1, Spain 6, Ireland 3, Estonia 1, France 4, Belgium 2, Slovenia 1, Netherlands 4, and Italy 2.
Three PCA are done, each one forced to produce one PC.
Table 1 presents the factor loadings for the three applications. The factor scores of every PC summarize the three axes of activity/popularity and participation, respectively.
All factor loadings are positive. Activity/popularity PC has a higher factor score when followers of the account are more, tweets are higher and effective reach is large. The centrality PC has high factor scores when centralities are high; that is, accounts are central and influential in the m/r networks. The community PC has higher factor scores when skewness is high and assortativity is also high; that is, when there is more evidence that small-worlds and homophily are apparent.
These three PC scores are ranked in a descending order; the larger value is placed first. To ensure that conditions for calculating an overall rank are met, the correlation matrix of the three ranks is calculated using Spearman’s rho (
Table 2). All ranks are intercorrelated having positive and statistically significant correlation coefficients. Unidimentionality is ensured though a PCA which, without prior limitations, produces only one PC.
Table 3 presents the factor loadings of this PC. Finally, Cronbach’s alpha for the three ranks is equal to 0.725. Since it is greater than 0.70, internal consistency is ensured.
After calculating Rankfinal and then ranking the final score, we can produce the final ranking of the 56 ministry accounts. This is equivalent to the Blogosphere Authority introduced by Karpf [
59,
60] and could be named Twitter Authority Index.
Table 4 presents the ranked accounts along with the partial ranks and
Table 5 presents the original values in order to better understand the differentiations among the accounts.
As mentioned in the methodology section, due to technical restrictions, the findings regarding some of the UK ministries should be read with caution because m/r networks are large and NodeXL do not provide the whole networks in cases like these. Instead, the l0,000 latest followers were recorded.
In
Table 4 the ministry of environment of Spain is placed second especially because of the ranks of centrality and community formation. It is not activity or popularity that distinguishes this network, but mainly community formation among followers. Several UK ministries are placed in the first places.
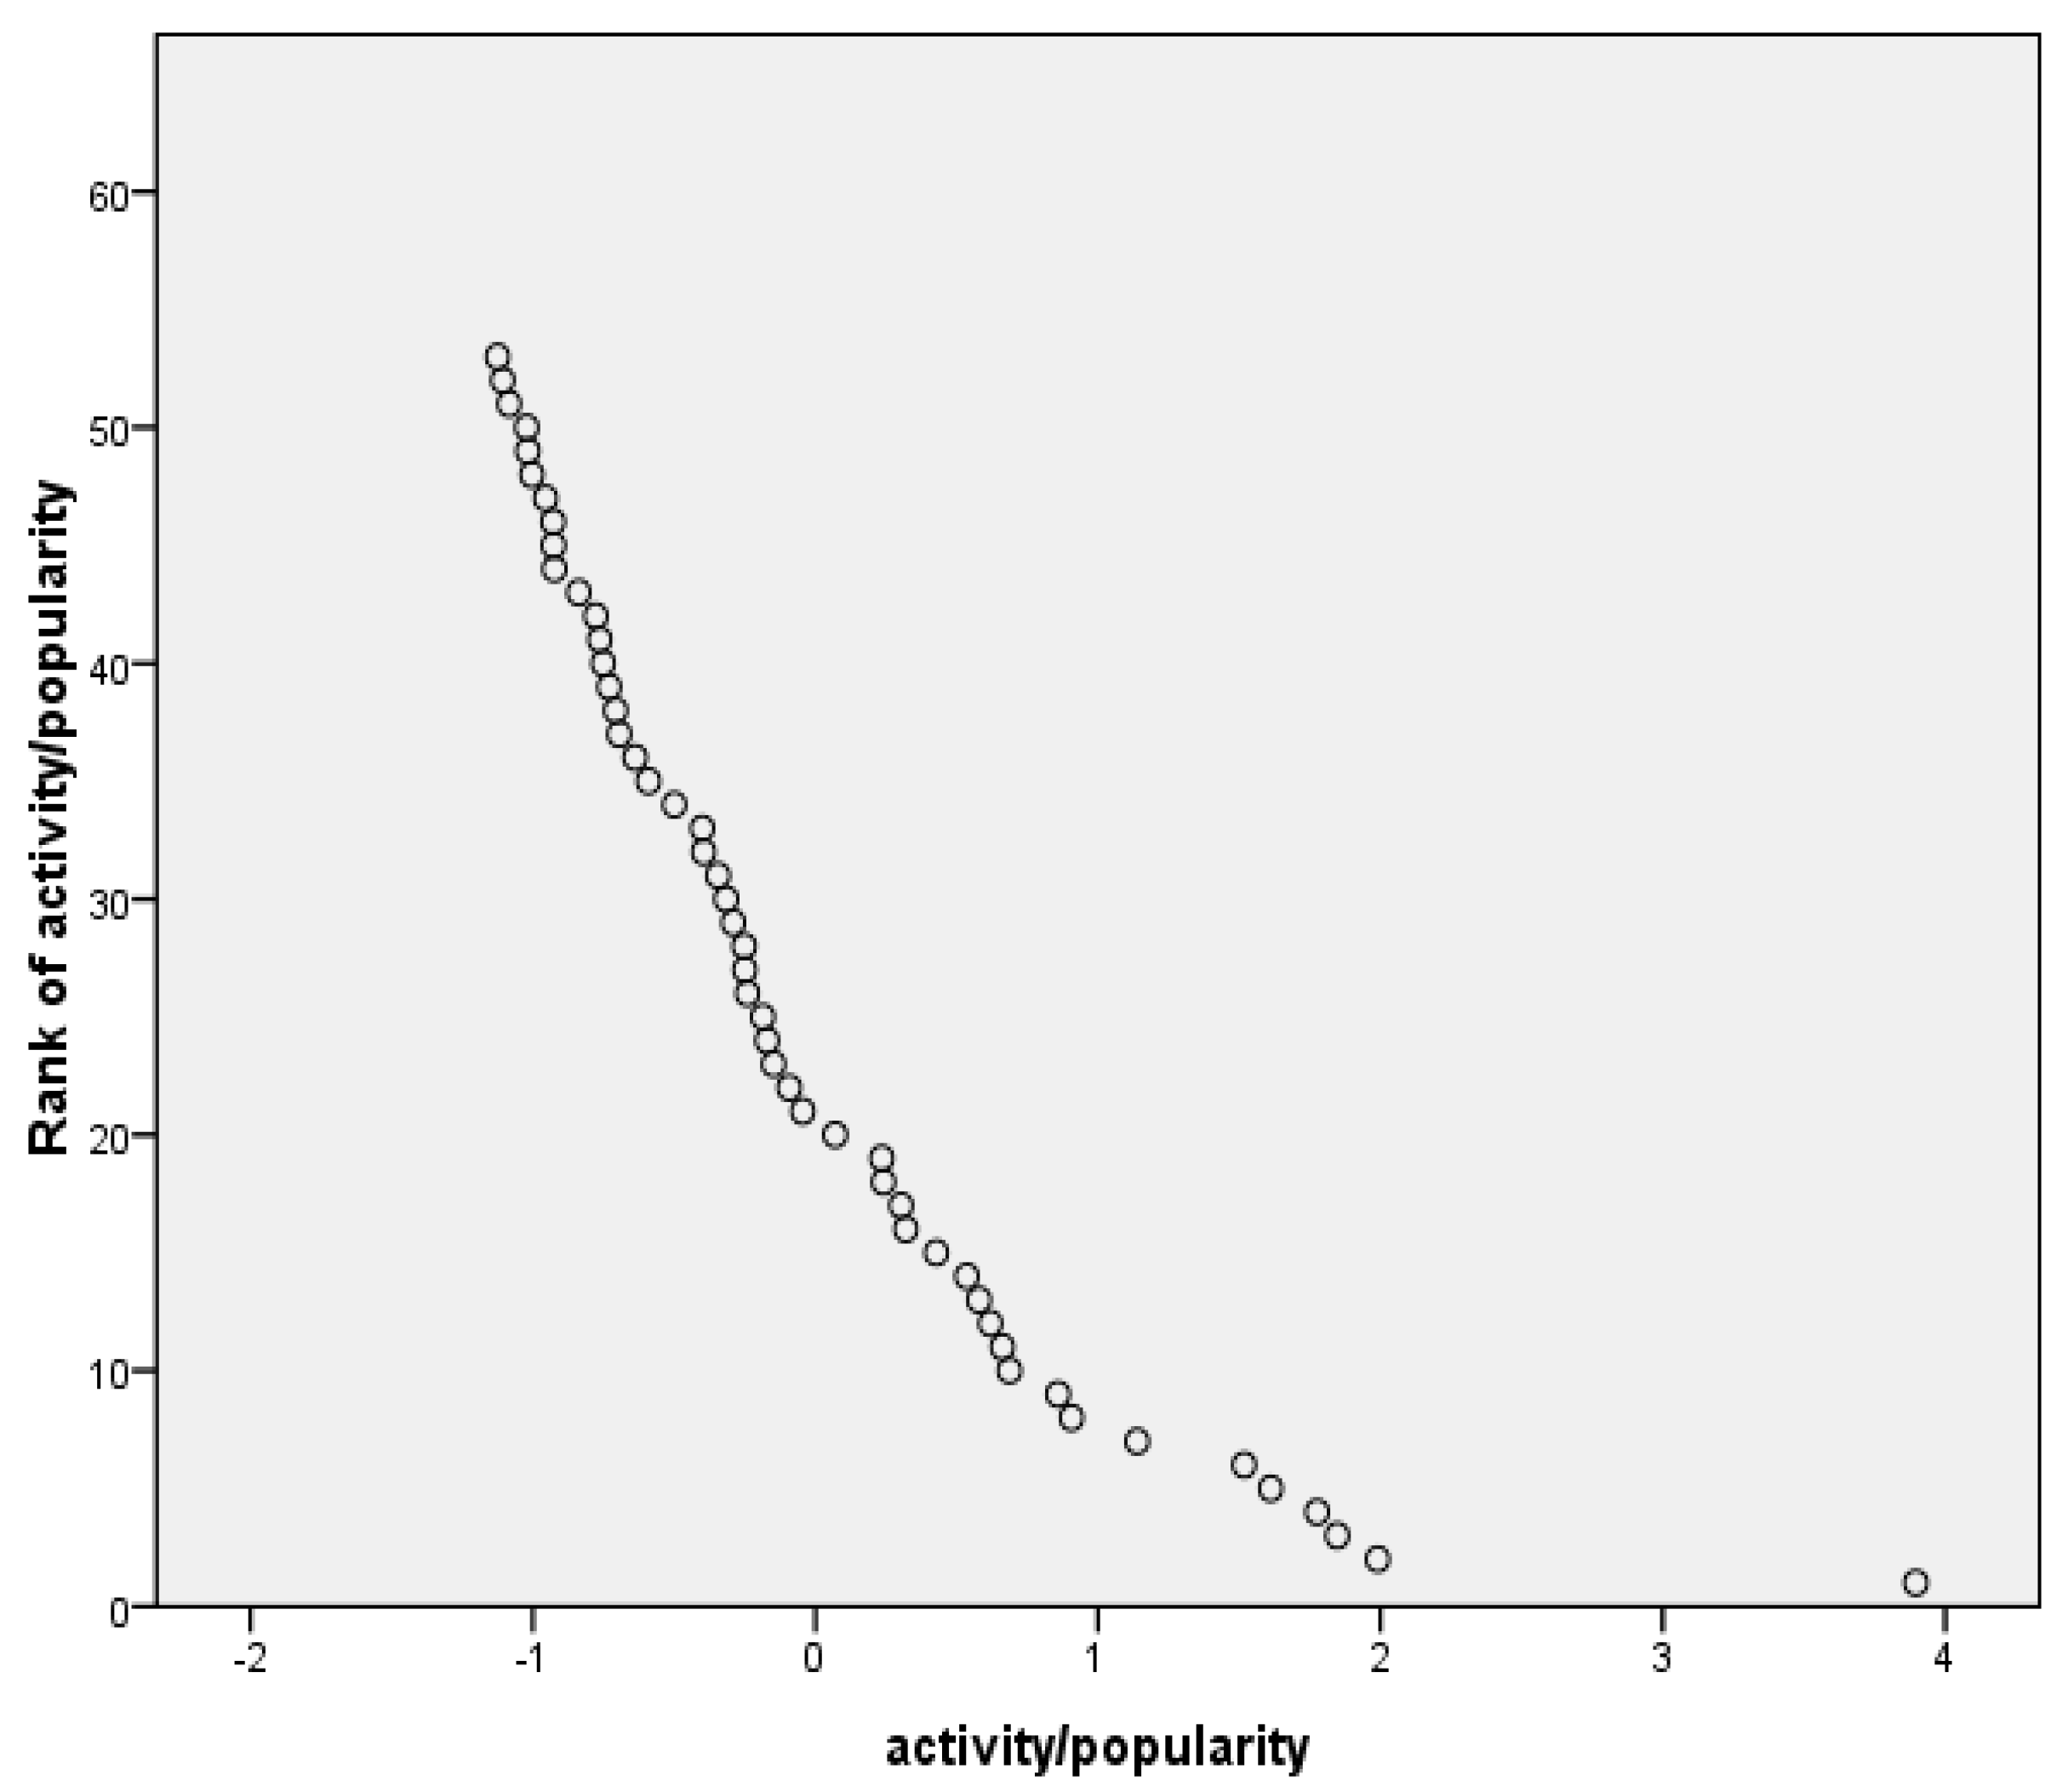
Regarding activity/popularity, the ministries of finance and economy of Latvia and foreign affairs of Finland have better rankings. Regarding community formation, the ministry of environment of Spain, education of Netherlands, foreign affairs of Italy and foreign affairs of Netherlands, come first. To explore how the three PC are distributed, and to distinguish the accounts that excel in every PC, three diagrams are constructed. Each one presents a scatterplot of the relative PC against its ranks. In
Figure 1 the “activity/popularity” PC against its ranks is presented. One account is very distinct and is placed far right on the
x-axis. Next, six more accounts are placed on its left and have the next best ranks. These are the accounts of UK foreign affairs (first), and UK education, UK development, Finland foreign affairs, UK finance, Latvia economy, Latvia finance (see
Table 4). The UK seems to lead on using Twitter services, and Finland and Latvia follow having good scores.
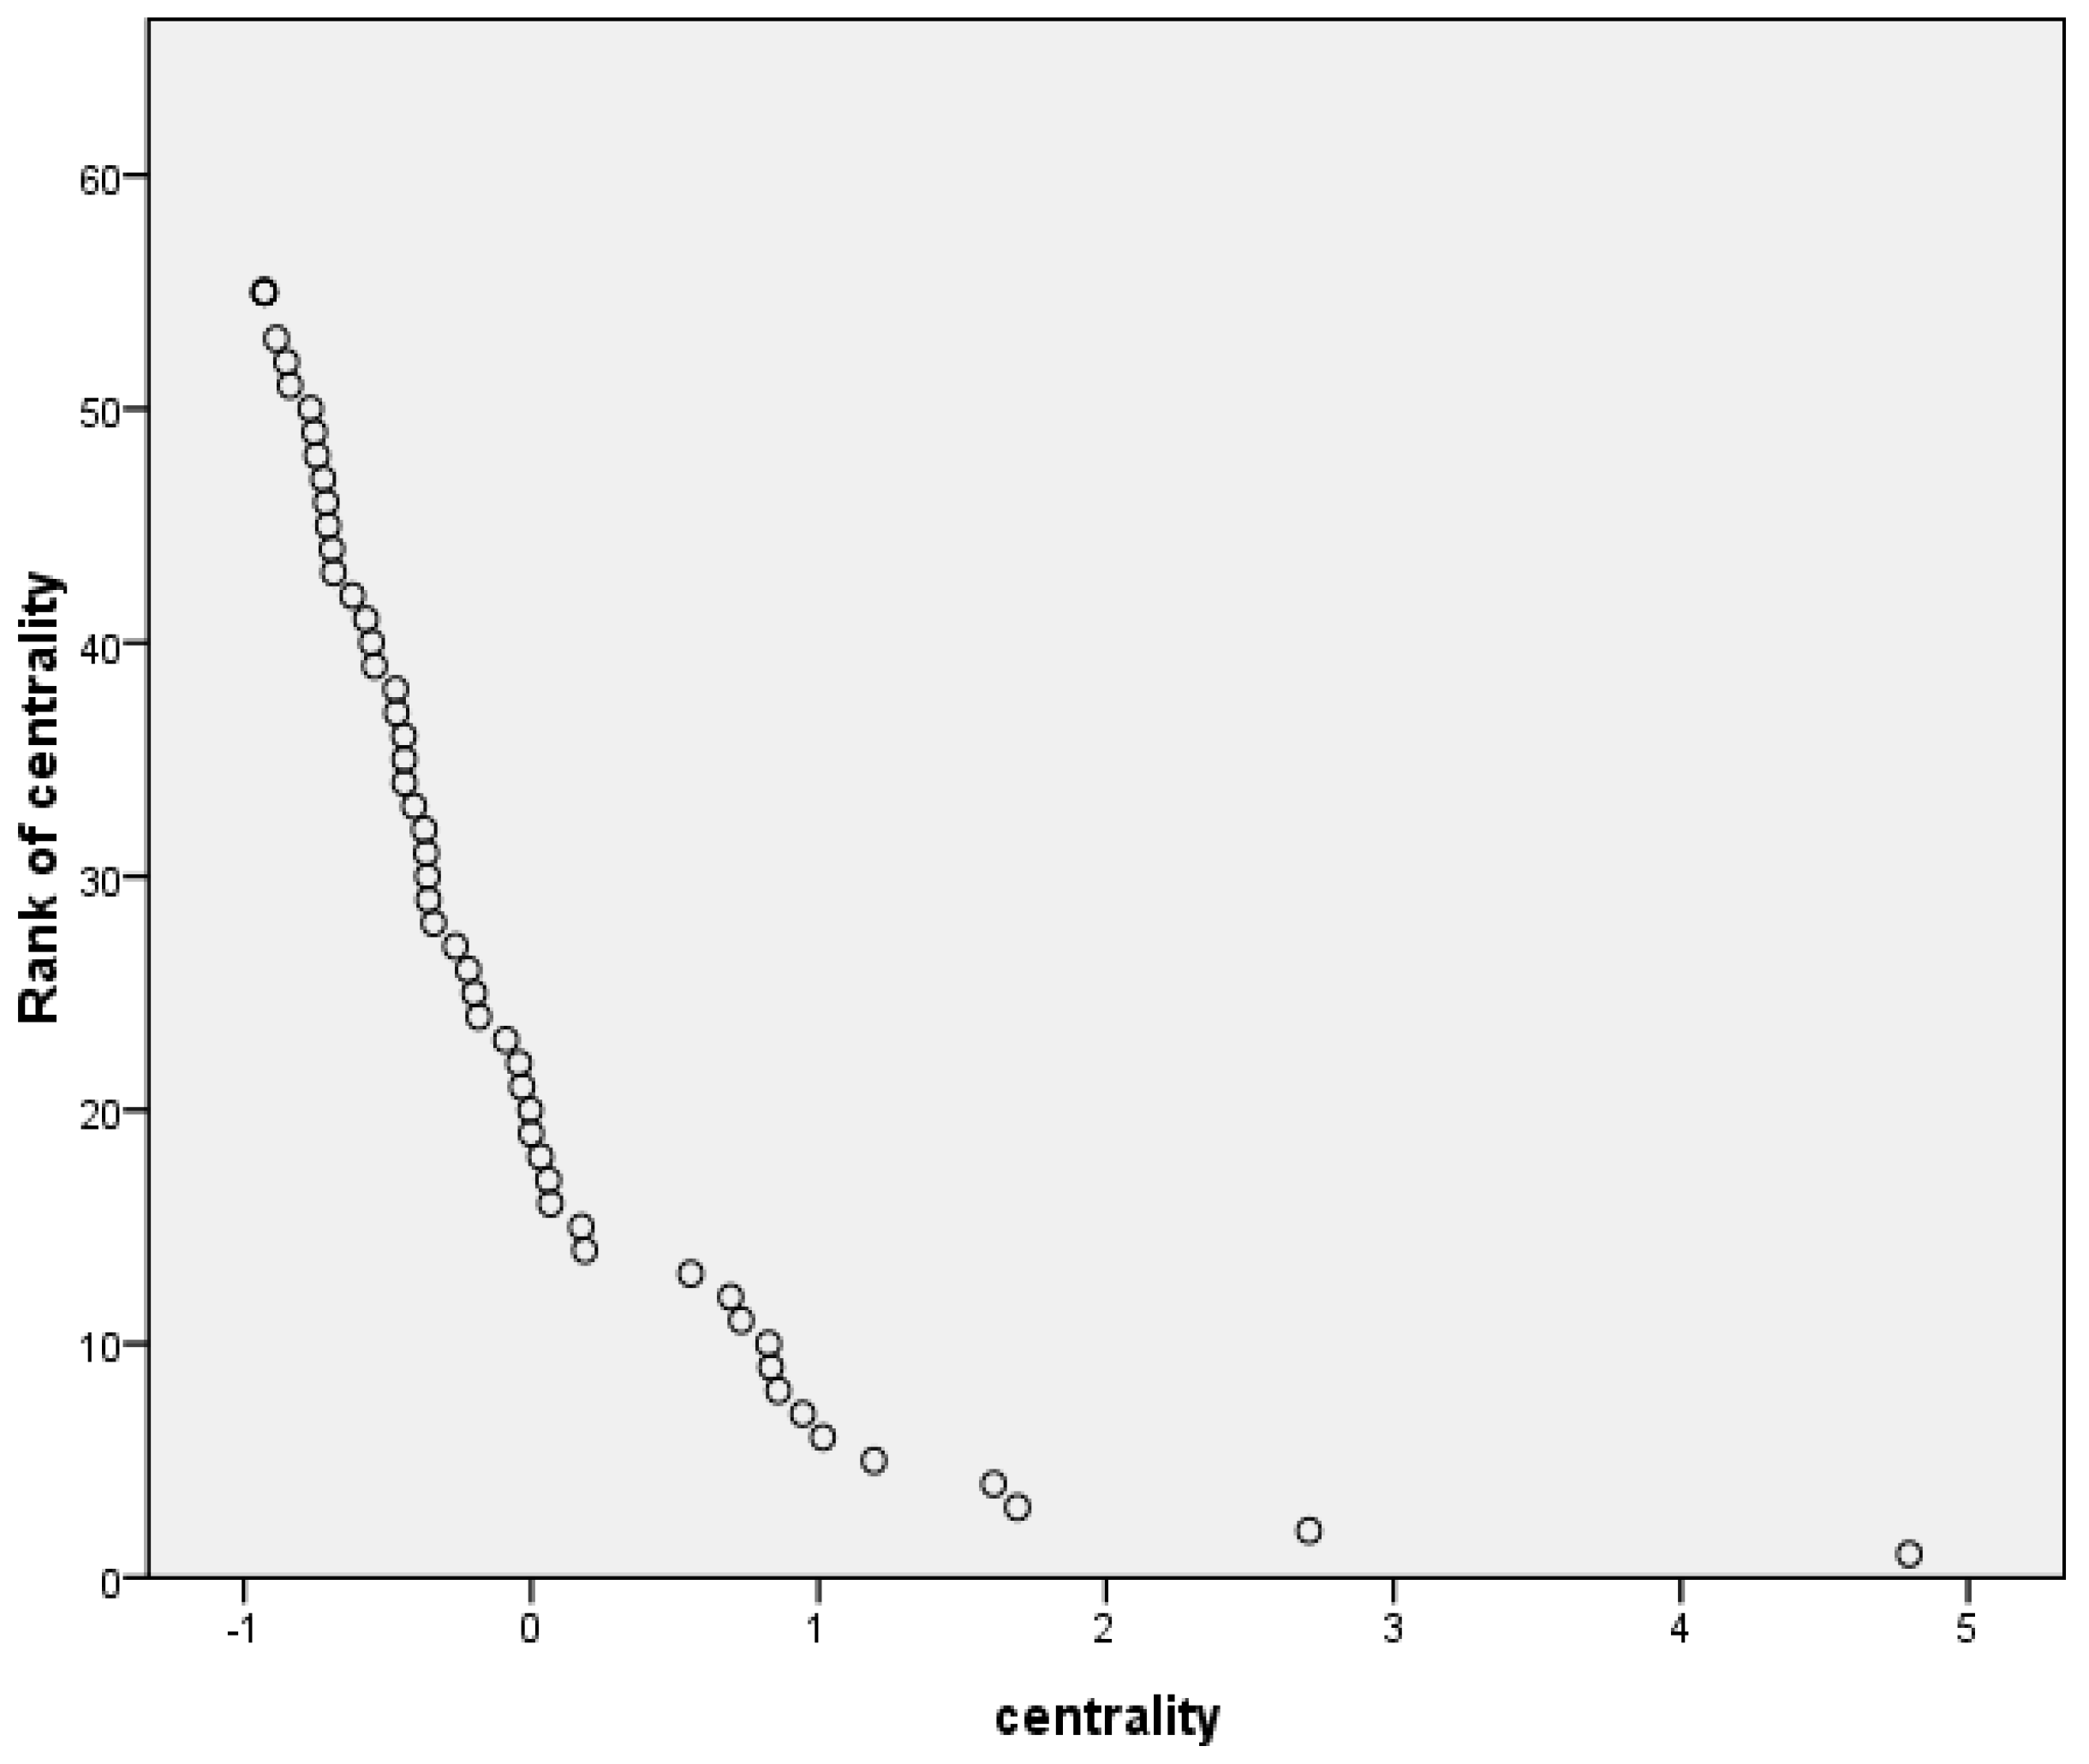
Figure 2 presents the scatterplot of the second PC “centrality” against its ranks. Two accounts seem to be very distinct in the first two places and three more follow. These are Slovenia’s foreign affairs (first) ministry, Latvia’s education ministry, Sweden’s foreign affairs ministry, Ireland’s education ministry, and Italy’s environment ministry. These accounts are placed first regarding how central they are compared to others in the m/r networks, where citizens mention or reply to the ministries to a higher degree in comparison to how much they generally mention or reply.
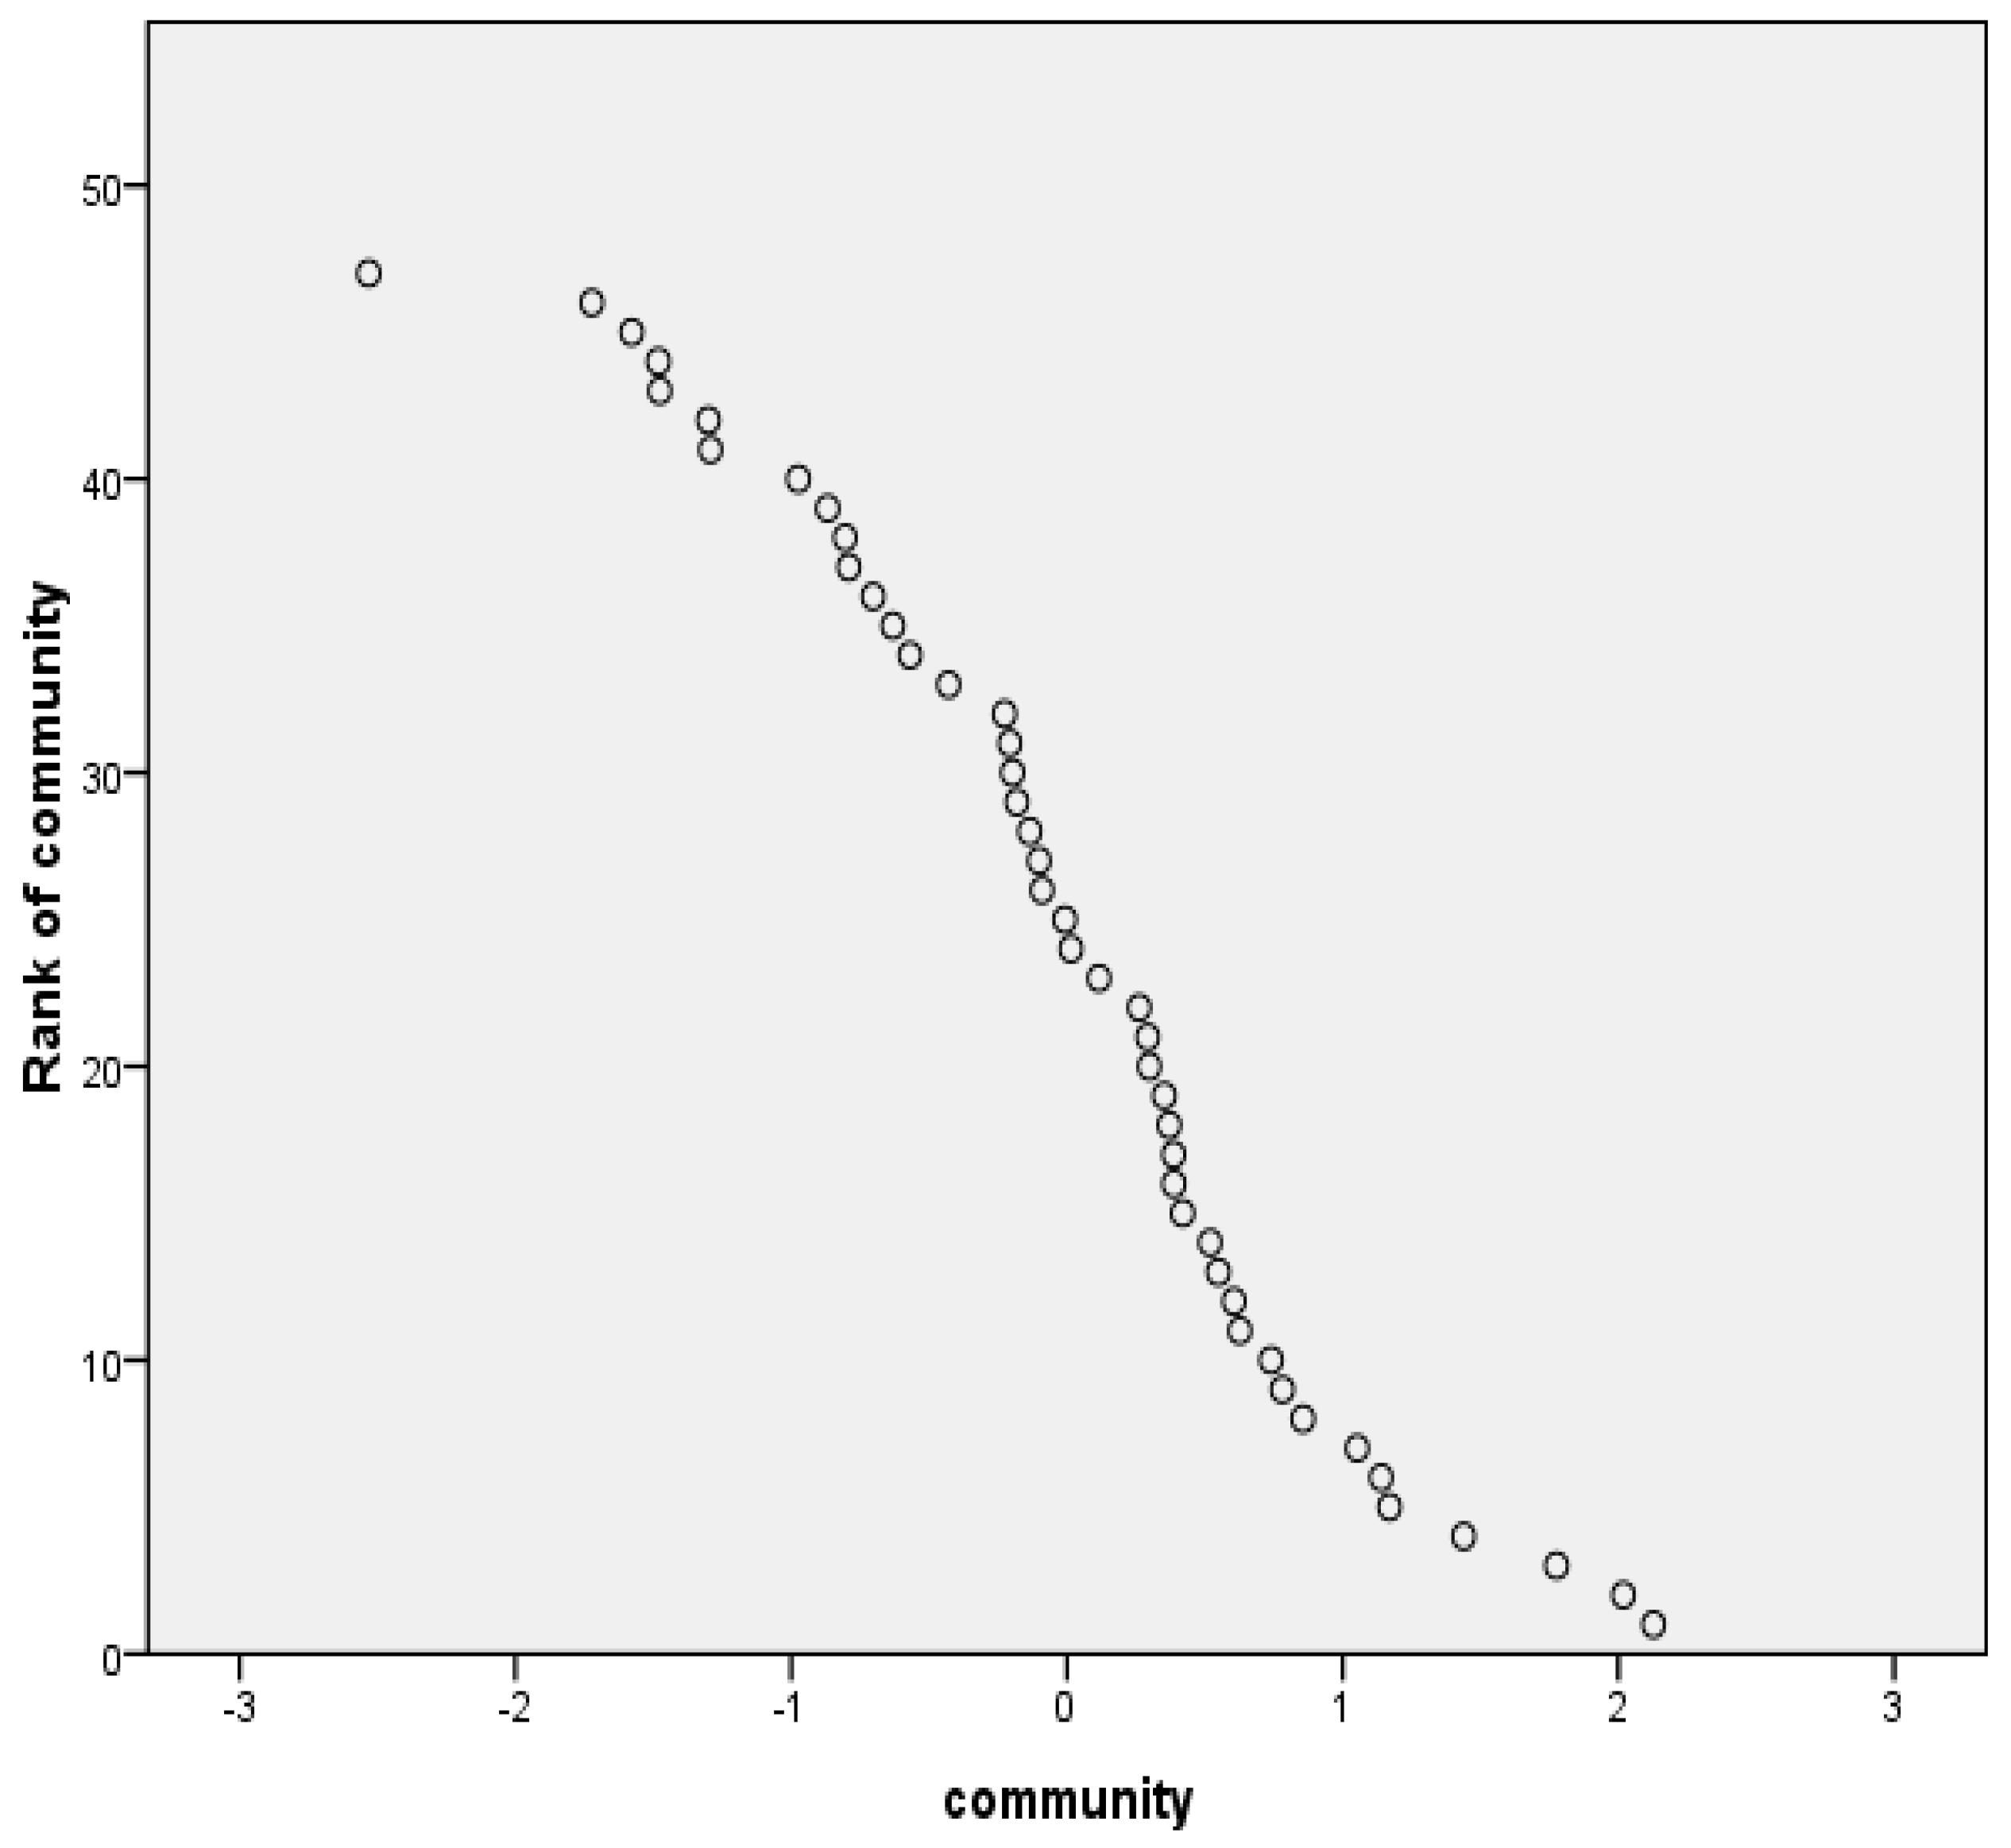
Figure 3 presents the scatterplot of the third PC “Community” against its ranks. Four accounts are the most distinct (see also
Table 4), the UK’s environment ministry, Spain’s environment ministry, the Netherlands education ministry, and the UK’s education ministry. In their m/r networks the conditions to form communities of followers apply to a higher degree than in the rest of the account networks.
Finally,
Table 6 presents the mean Twitter Authority Index per country. The first places are taken by Italy, Slovenia, UK, Netherlands, Ireland, France, Sweden, Latvia, and Spain. It seems reasonable to assume that this ranking per country needs more ministry accounts from each country to have a more robust or reliable ranking; for example Slovenia is represented by only one ministry here. However, the ranking system is reported here as a methodology proposition so a presentation such as this might suffice.


