Article

Output from Statistical Predictive Models as Input to eLearning Dashboards

Business School, University of Colorado Denver, 1475 Lawrence Street, Denver, CO 80202, USA
Future Internet 2015, 7(2), 170-183; https://doi.org/10.3390/fi7020170
Submission received: 1 March 2015 / Accepted: 11 May 2015 / Published: 2 June 2015
(This article belongs to the Special Issue eLearning)

Abstract

:
We describe how statistical predictive models might play an expanded role in educational analytics by giving students automated, real-time information about what their current performance means for eventual success in eLearning environments. We discuss how an online messaging system might tailor information to individual students using predictive analytics. The proposed system would be data-driven and quantitative; e.g., a message might furnish the probability that a student will successfully complete the certificate requirements of a massive open online course. Repeated messages would prod underperforming students and alert instructors to those in need of intervention. Administrators responsible for accreditation or outcomes assessment would have ready documentation of learning outcomes and actions taken to address unsatisfactory student performance. The article’s brief introduction to statistical predictive models sets the stage for a description of the messaging system. Resources and methods needed to develop and implement the system are discussed.

1. Introduction

Massive open online courses (MOOCs) are known for their high dropout rates [1,2,3,4], the meaning of which has prompted debate and commentary [1,5,6,7]. Yet even online courses offered as part of degree-granting programs have lower completion rates than their face-to-face counterparts [8,9,10,11,12]. Importantly, online courses can have substantial costs of development and delivery [13,14]. In such an environment, commentators from across the educational community have pondered the cost, revenue, and profit structure of online education [7,15,16]. Few doubt, though, that distance education is here to stay. What might be done to enhance performance, satisfaction, or completion rates of its customers? A recent review of six major MOOC platforms found that students in online courses typically receive only rudimentary feedback on their performance and progress [17], suggesting that there is room for improvement in the amount and quality of feedback given to students in eLearning environments.
This article advocates microtargeting of students in online courses for the purpose of improving performance, satisfaction, or retention. Education is an industry that cares acutely about the individual: a student’s preparation for academic work, performance in courses, completion of programs, employment after graduation, and satisfaction with faculty and their courses, to name a few. Researchers such as Subban [18] have long argued that different students benefit from different instructional methods, suggesting that instructors, administrators, and students would benefit from wider application of microtargeting technologies to educational settings. Indeed, although microtargeting has enjoyed great successes in diverse industries such as customer relationship management, fraud and terrorism detection, and even politics [19,20,21], education has only begun to embrace the full potential of predictive analytics [22].
We propose that microtargeting of students in online courses be accomplished using an information delivery system based on statistical predictive models. Even though analytics are now finding their way into online course delivery platforms [23], adoption of these methods is not widespread. Perhaps technologists who develop learning management systems (LMSs) aren’t aware of the power of predictive analytics or don’t grasp how to conduct and implement a predictive analytics project. This article hopes to address the gap.
Consider these examples of messages to students that might be delivered via the information system. Suppose that students who begin courses later than others also have lower completion rates. An information system might deliver daily messages to absent students until they begin the course. The message, though, would not be something like, “time to get started”. Instead, the message would be framed numerically—e.g., that a student’s probability of completing the course has now dropped from 73% to 58%. The numerical nature of the message is intended to be striking and, thus, impactful. As another example, perhaps the level or quality of a student’s participation in a threaded discussion predicts performance on a graded assignment [24]; the system could explain that link and encourage students to change behavior or seek help as needed. Or perhaps a message would advise whether a student will learn better working collaboratively or individually [25].
As another example, suppose that a midterm assessment suggests that a student has forgotten foundational concepts from earlier in the course. The system might urge the student to relearn those materials with a message such as: “without revisiting the Chapter 2 materials, your predicted grade in the course will be no better than C−. Relearning these materials improves your projected grade to B+”.
The substance of the message would be aimed at the expected audience. For example, students enrolled in for-credit courses might be interested in course grades whereas others enrolled in MOOCs for the sole purpose of enjoyment of learning might be better served by information about satisfaction or perceived learning. Yet others taking professional certification preparation courses might benefit from learning the probability of being employed within three months of completion of the course.
An effective information delivery system would be automated, accurate, and impactful. Automation is particularly important in large-enrollment online courses. In MOOCs with many thousands of students, instructor feedback to each student, even with teaching assistants, is unrealistic [26,27]. Peer review has been suggested as one way to fill the gap [28]. A mechanized cheerleader like the one envisioned here could be another tool for addressing the student-instructor interaction void. Even when instructors can’t realistically provide one-on-one feedback to all, the imagined system could allow instructors to engage in triage by identifying those students most in need of intervention.
Accuracy means that messages are tailored to each student so that feedback is as individualized and precise as possible. This means foregoing the use of statistical aggregates. Suppose, for example, that a message is to convey the probability that a student with a grade of C on an exam will pass a course. One way to estimate that probability is to calculate, for all previous students with C exam scores, the ratio of those who passed the course relative to the total—a statistical aggregate that fails to recognize individual variation. A more accurate message system would consider the exam score but also whether the student is part-time or full-time, her learning style, undergraduate grade point average, or any other number of predictors of success. This is accomplished using statistical predictive models; with them, it is conceivable that every student who earned a grade of C on the exam would receive different probabilities of passing the course because the prediction mechanism incorporates personal characteristics that more accurately reflects each student’s situation.
An impactful message system draws students’ attentions in ways that positively affects outcomes. Information that intimidates or demoralizes can have unintended consequences. Information that arrives too late for students to adjust behavior is unproductive. Messages that arrive too frequently may be ignored. Careful thought must be given to how, what, how often, and when information is to be delivered if improved outcomes are to be achieved.
Most LMSs have rudimentary messaging capabilities and there are now several publicly-available student signaling or early-warning routines [23]. The system envisioned in this article differs variously from existing products in these ways.
  • Some LMSs have “what if” algorithms that allow students to assess the level of performance needed to achieve a certain course grade. Those “what if” routines are based solely on the algebra of the final grade calculation; i.e., they are deterministic. We propose a messaging system that is probabilistic; it produces predictions using statistical methods that model uncertainty.
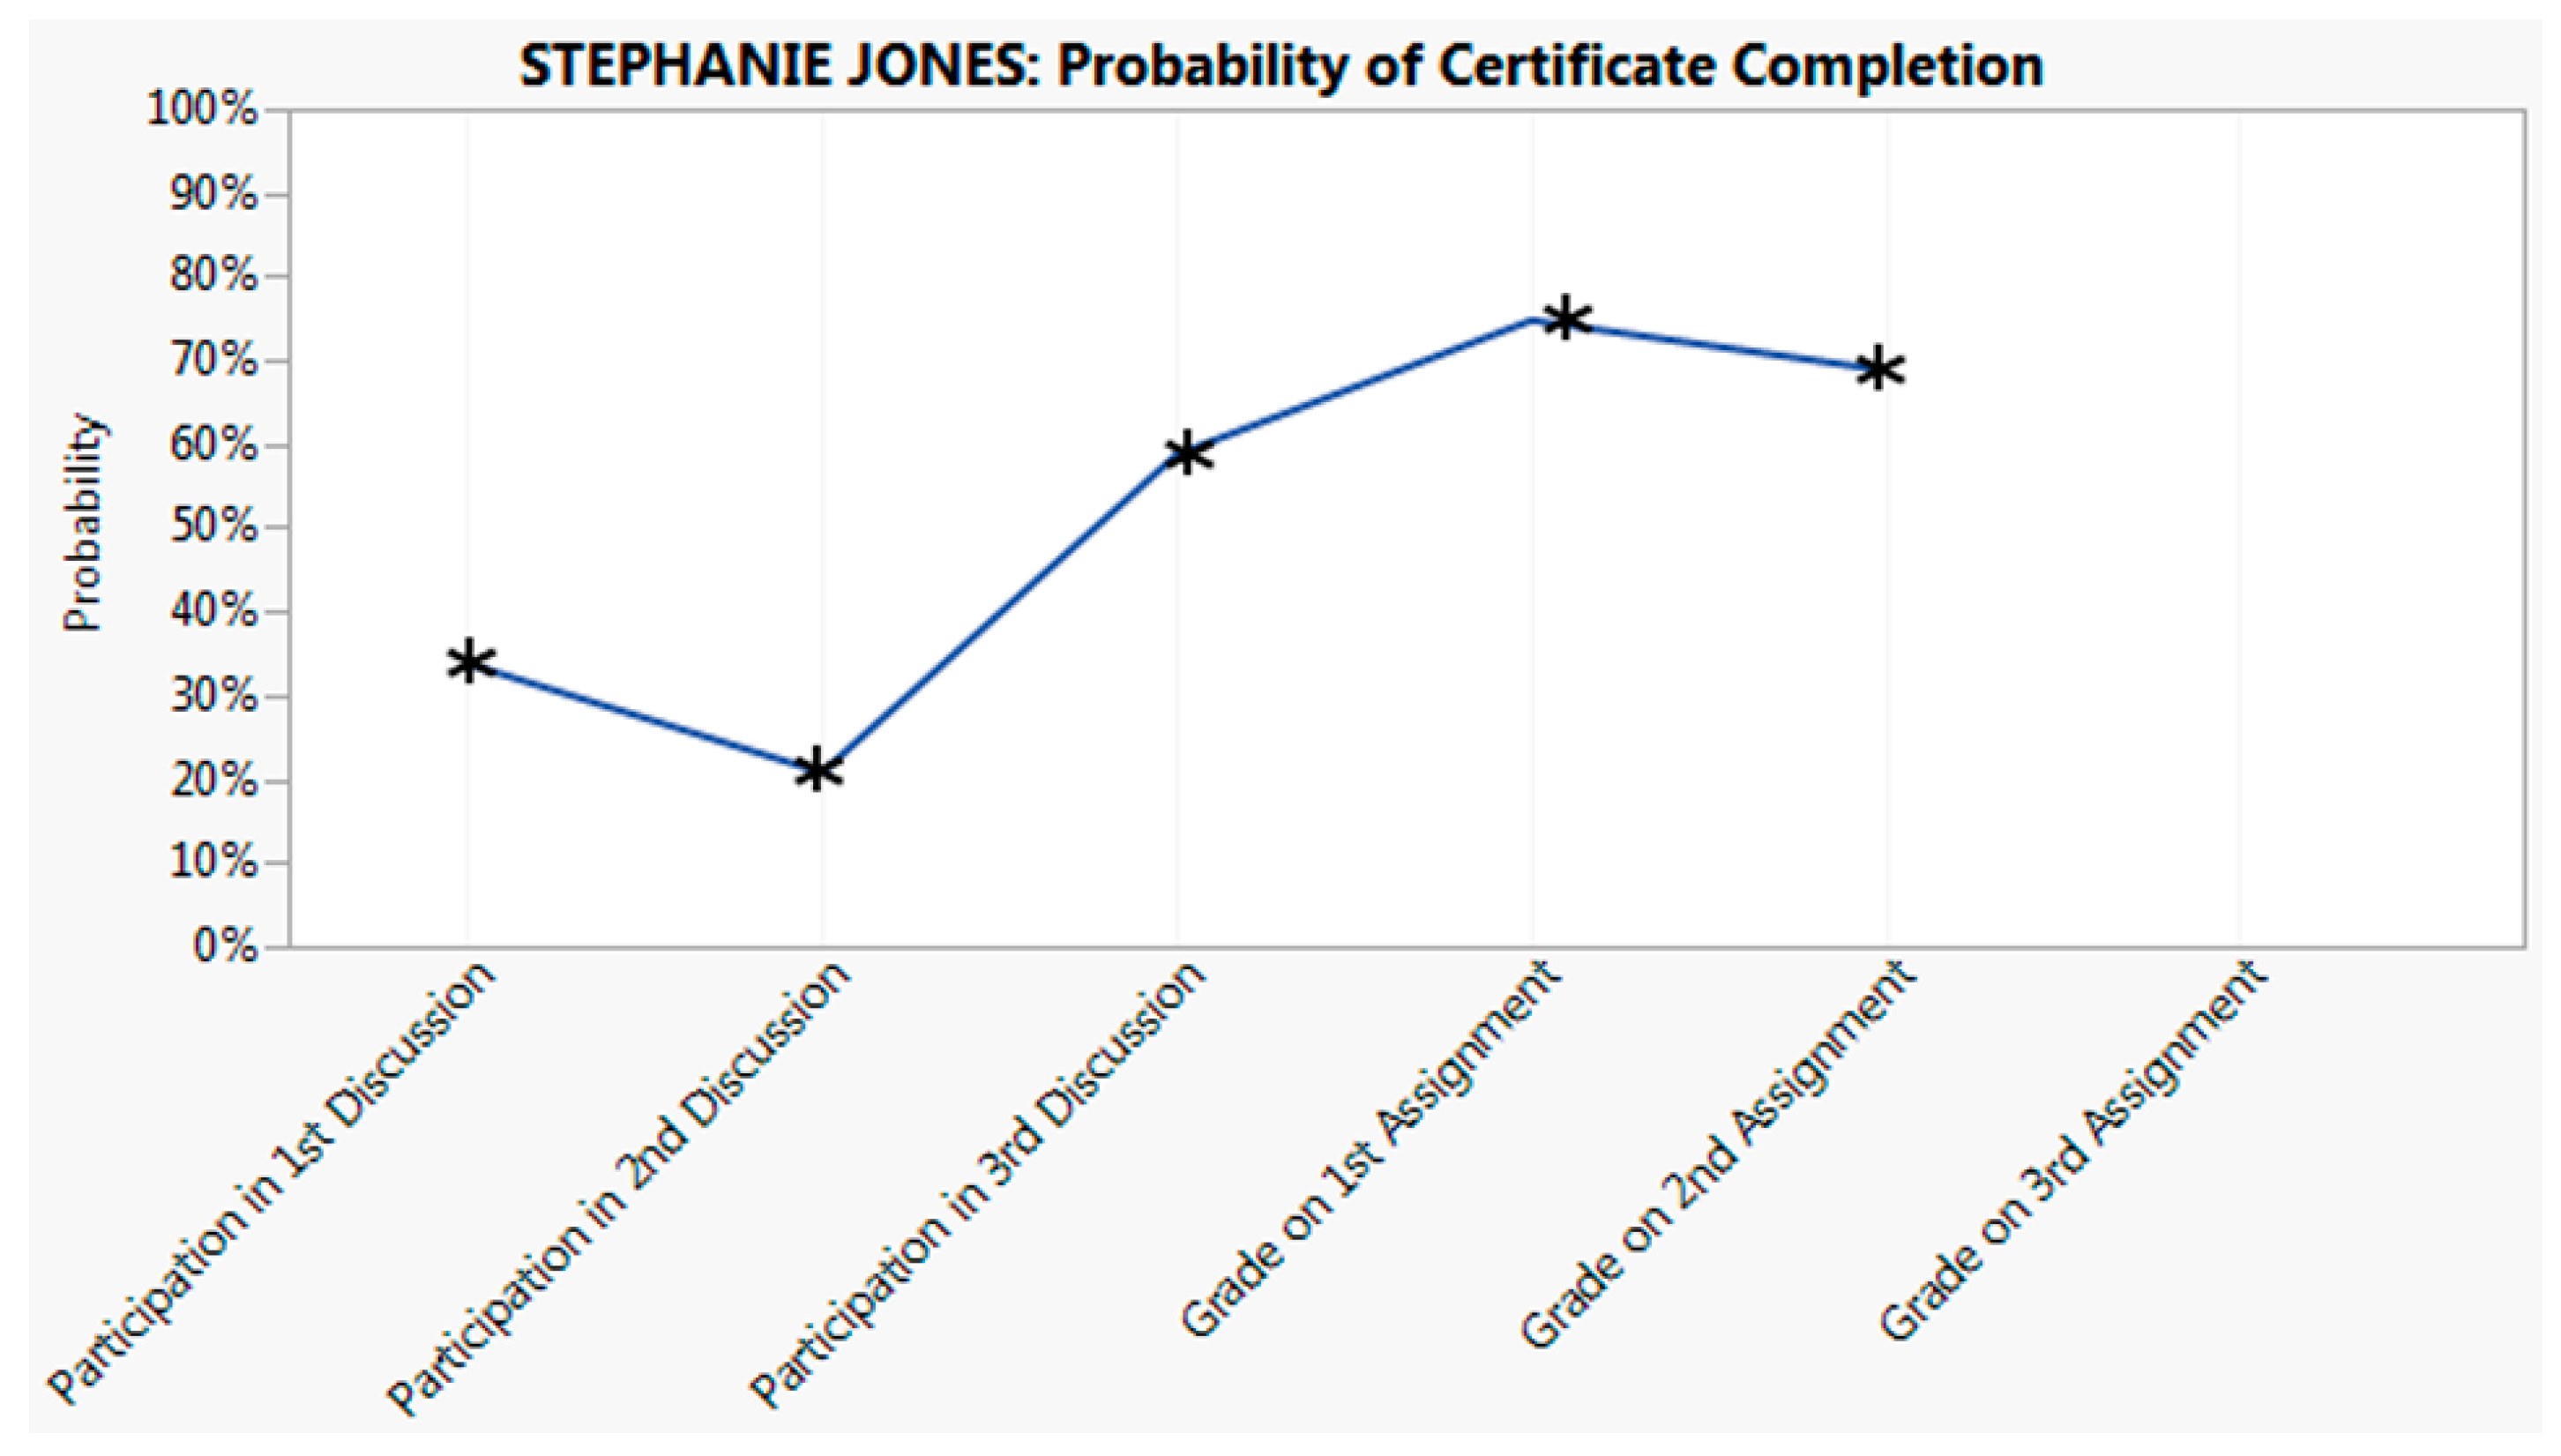
  • The proposed system can be designed to produce longitudinal information so that students can track their progress over time and, importantly, see for themselves how their behavior impacts outcomes.
  • Our methodology incorporates as much numerical information as possible about individual student characteristics.
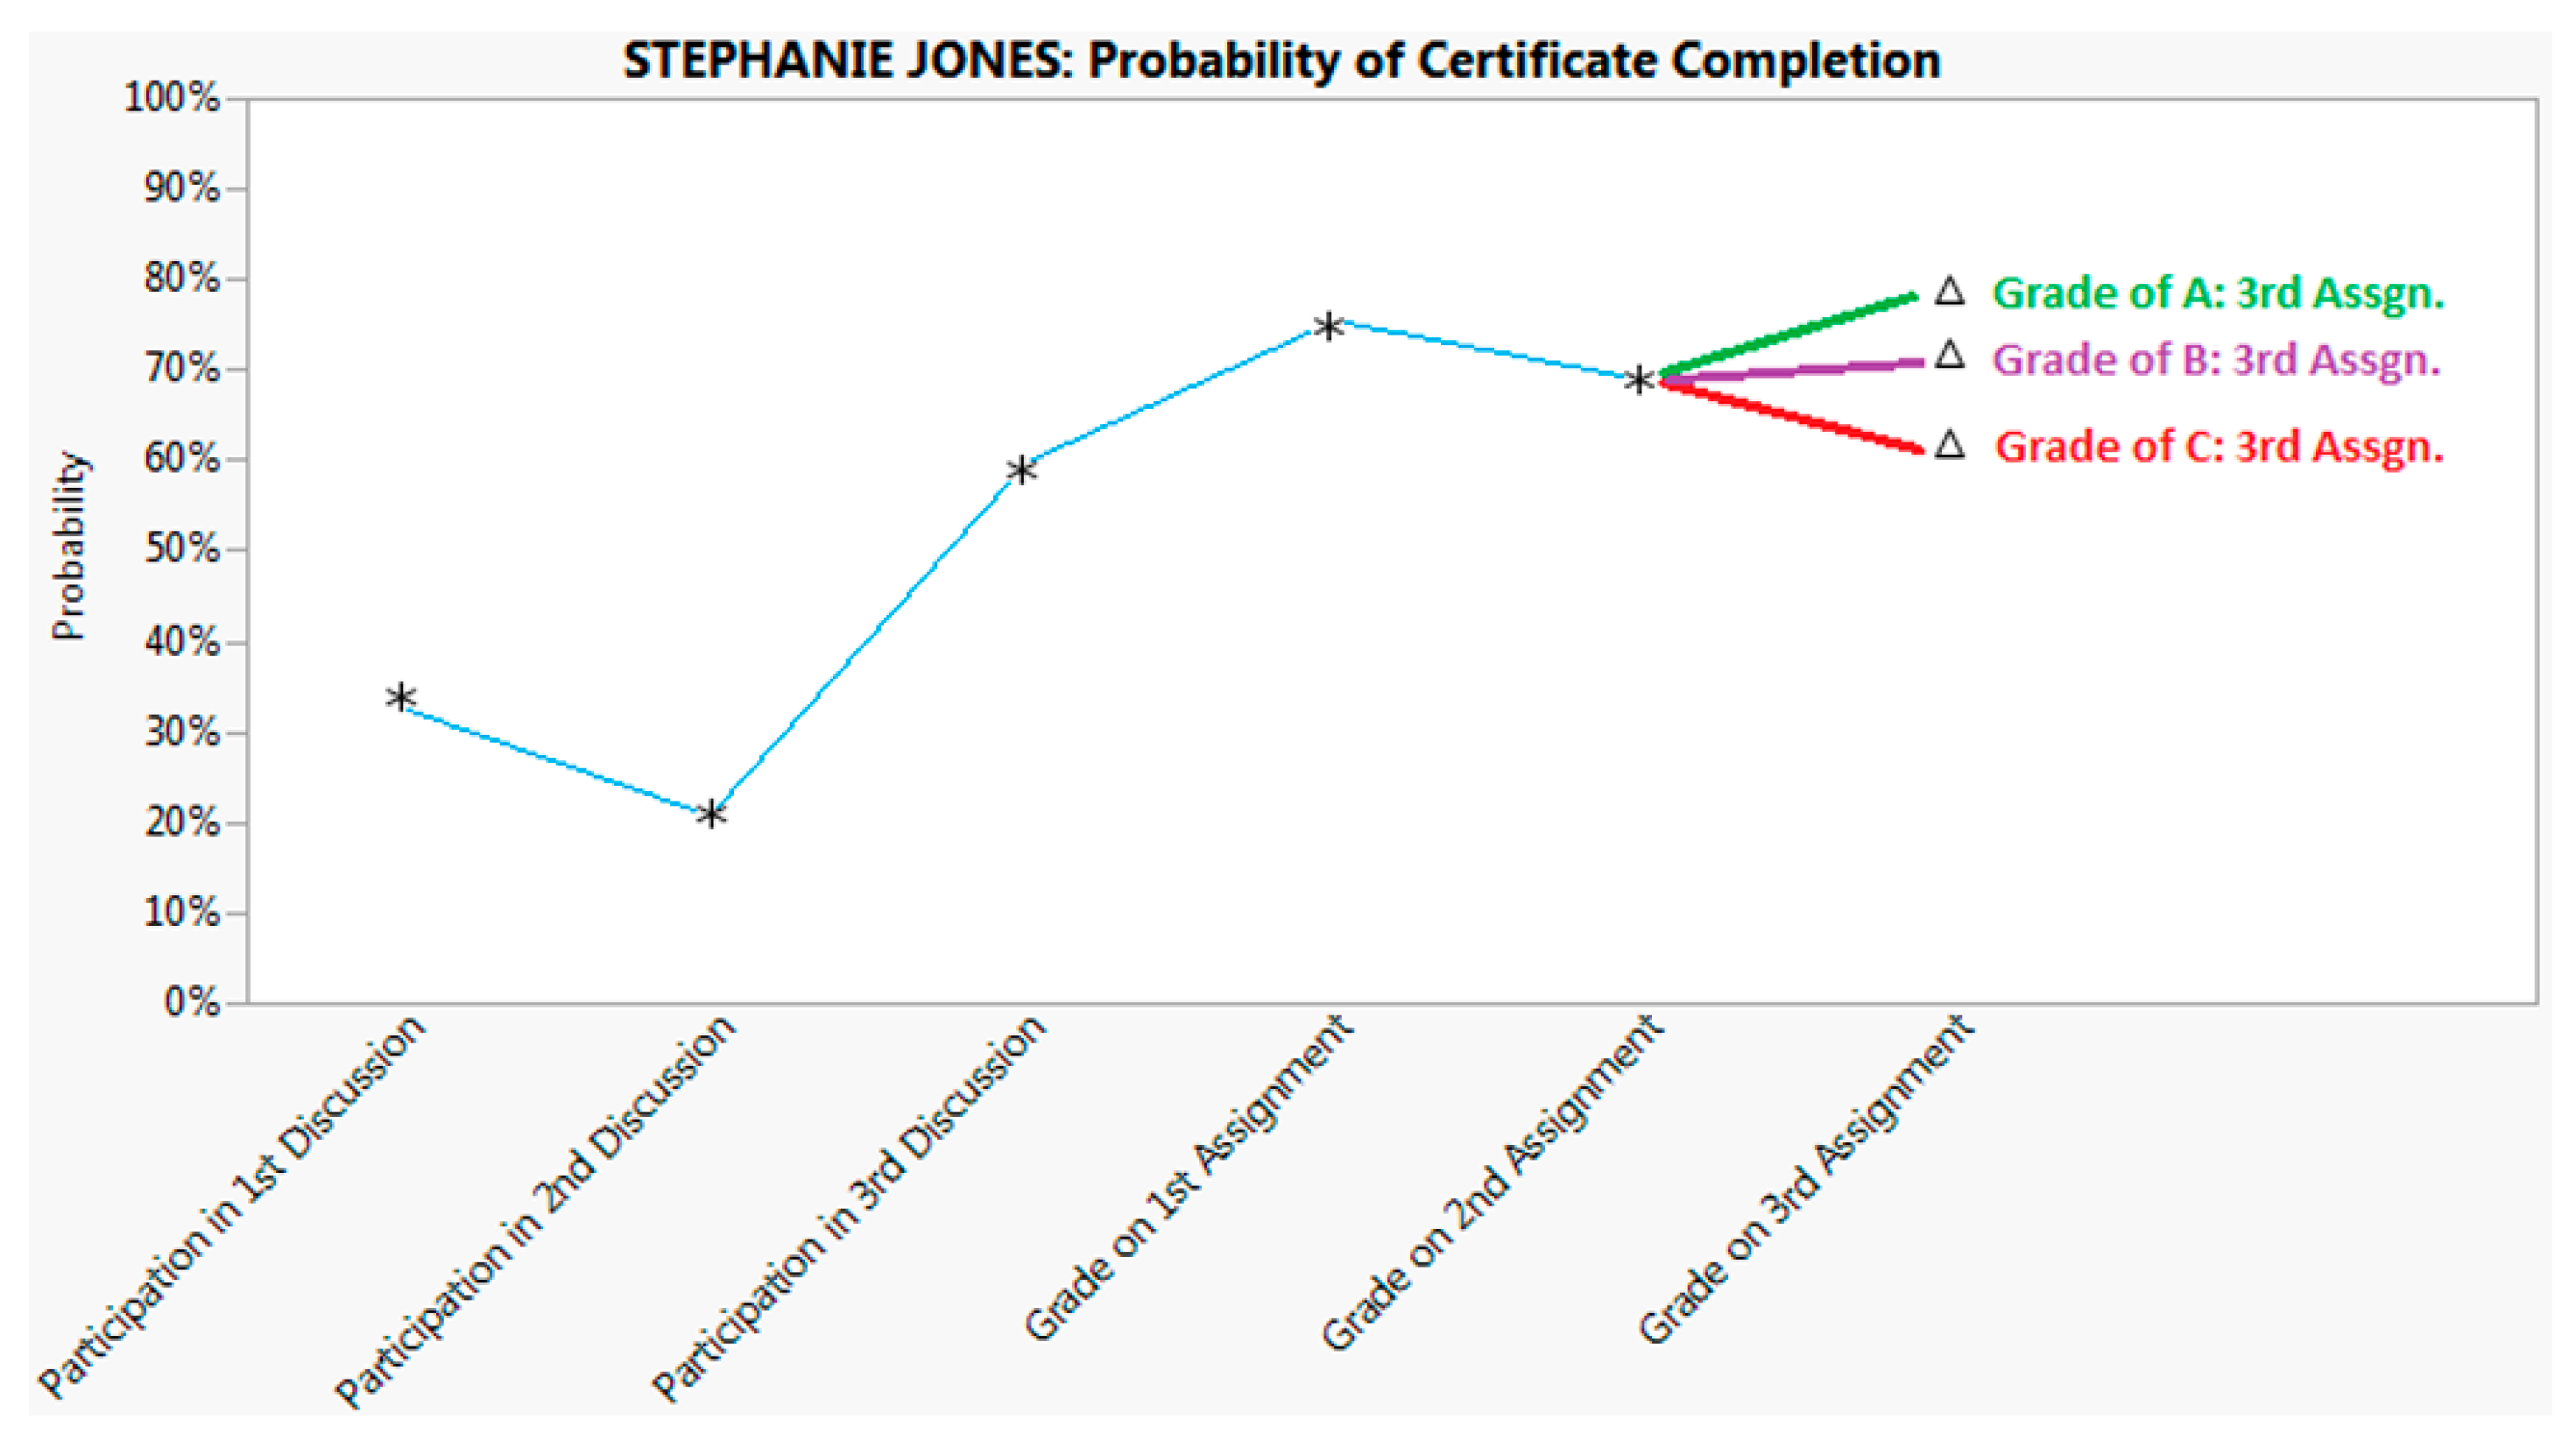
  • The envisioned system can be designed to be either reactive or proactive or both, allowing developers to design a system as complex as needed for the learning environment at hand.
Our description of that system unfolds in this way. The probabilistic nature of the proposed system is rooted in statistical predictive models; a brief introduction to predictive models is provided in the next section. Section 3 describes the development, implementation, and assessment phases of the eLearning system. Section 4 outlines resource implications. Unresolved issues, future research, and final thoughts may be found in the last two sections.

2. Predictive Models and Methods

Predictive models, the focus of this article, are useful when the goal of the data analysis is to accurately predict future occurrences. Predictive modeling projects use familiar statistical methods—regression, logistic regression, clustering, and the like—yet most academic work uses those methods for explanatory or descriptive, not predictive, purposes. The distinction is subtle yet important. Shmueli and her colleague [29,30] provide thoughtful overviews of the differences between descriptive, explanatory, and predictive statistical models. Unlike explanatory models, predictive models are mostly unconcerned with theory building, hypothesis testing, and confidence intervals. Instead, the focus is finding models that predict future behavior as accurately as possible. In that regard, predictive modelers might shamelessly exclude statistically significant explanatory variables, or include statistically insignificant ones, if doing so improves prediction accuracy. As another example, explanatory models often seek statistical aggregates (e.g., regression coefficients) while predictive models focus on the individual.
Because of differences in perspective, predictive modeling exercises often unfold quite differently from descriptive or explanatory work. For example:
  • Traditional statistical inference is a secondary focus of predictive models so that diagnostics and remedies that speak to the quality of inferential evidence (e.g., multicollinearity) are of secondary importance in prediction settings; inference tends to be front-and-center in most explanatory research.
  • Large numbers of observations are welcomed in predictive modeling settings, since they accommodate the use of cross-validation (holdout samples) for model selection. Large sample sizes, on the other hand, can detract from the interpretability of inferential outcomes from explanatory models since hypotheses are routinely rejected in large enough samples [31,32].
  • Explanatory research, which typically focuses on aggregates, handles outliers by minimizing their impact via exclusion or outlier-resistant methods. Outliers are of special interest in predictive models, since they are often the ones we want to find: the fraudulent credit card charge or the struggling student.
  • Overfitting is a known risk with predictive modeling. Models that are overfit produce good in-sample predictions but inadequate out-of-sample predictions; i.e., they perform worse than expected once we put them into practice. To mitigate overfitting, predictive modelers use methods such as cross-validation that are not often seen in explanatory work.
Analysts with experience with predictive models are familiar with these and other methods, models, and materials relevant to predictive analytics projects [33,34,35].

3. Applying Predictive Models to an eLearning Messaging System

The student messaging system envisioned here involves a two-step process: the development of the prediction mechanism and its implementation using the LMS’s dashboard.

3.1. The Development Phase

The development phase involves collecting historical data, deriving a prediction model, and procuring the prediction formula from the model as depicted in Figure 1.
Figure 1. The development phase.
Futureinternet 07 00170 g001

3.1.1. The Historical Database

Predictive models benefit from a rich historical database with numerous observations and variables. In many predictive modeling settings, there is one outcome (dependent) variable and multiple input (independent/predictor) variables. The historical database must include known values for the outcome variable. If, for example, the task is to predict future students’ final course grades, the historical database must include course grades of those who have completed the course. Figure 1 illustrates this by listing numerical values for the outcome variable, Y, in the historical database.
Decisions regarding input variables for the historical database must be made. Availability is a key consideration, but so, too, is whether the values of the predictor variables will be known at the time of the eventual prediction [35]. It’s possible, for example, that the grade earned in Course A (an input variable) is a good predictor of the grade earned in Course B (the outcome variable) because A provides background skills or knowledge for B. Unless A is an enforced prerequisite for B, the grade in A cannot be used to predict the grade in B for those students who have not yet taken A. Thus, input variables are typically excluded from a predictive model’s historical database when they cannot help to predict, even if there is strong theoretical justification for their inclusion. Among those variables expected to meet this criterion, potential input variables might come from interviews with students, instructors, or other experienced practitioners. Input variables might also be suggested by the academic literature. Although each input variable need not enjoy a deeply-reasoned rationale for inclusion in a predictive model, spurious correlation is more likely to be avoided if input variables have plausible behavioral, psychological, economic, pedagogical or other links to the outcome variable. The hypothetical historical database in Figure 1 might contain, for example, k = 43 fields for the input variables.

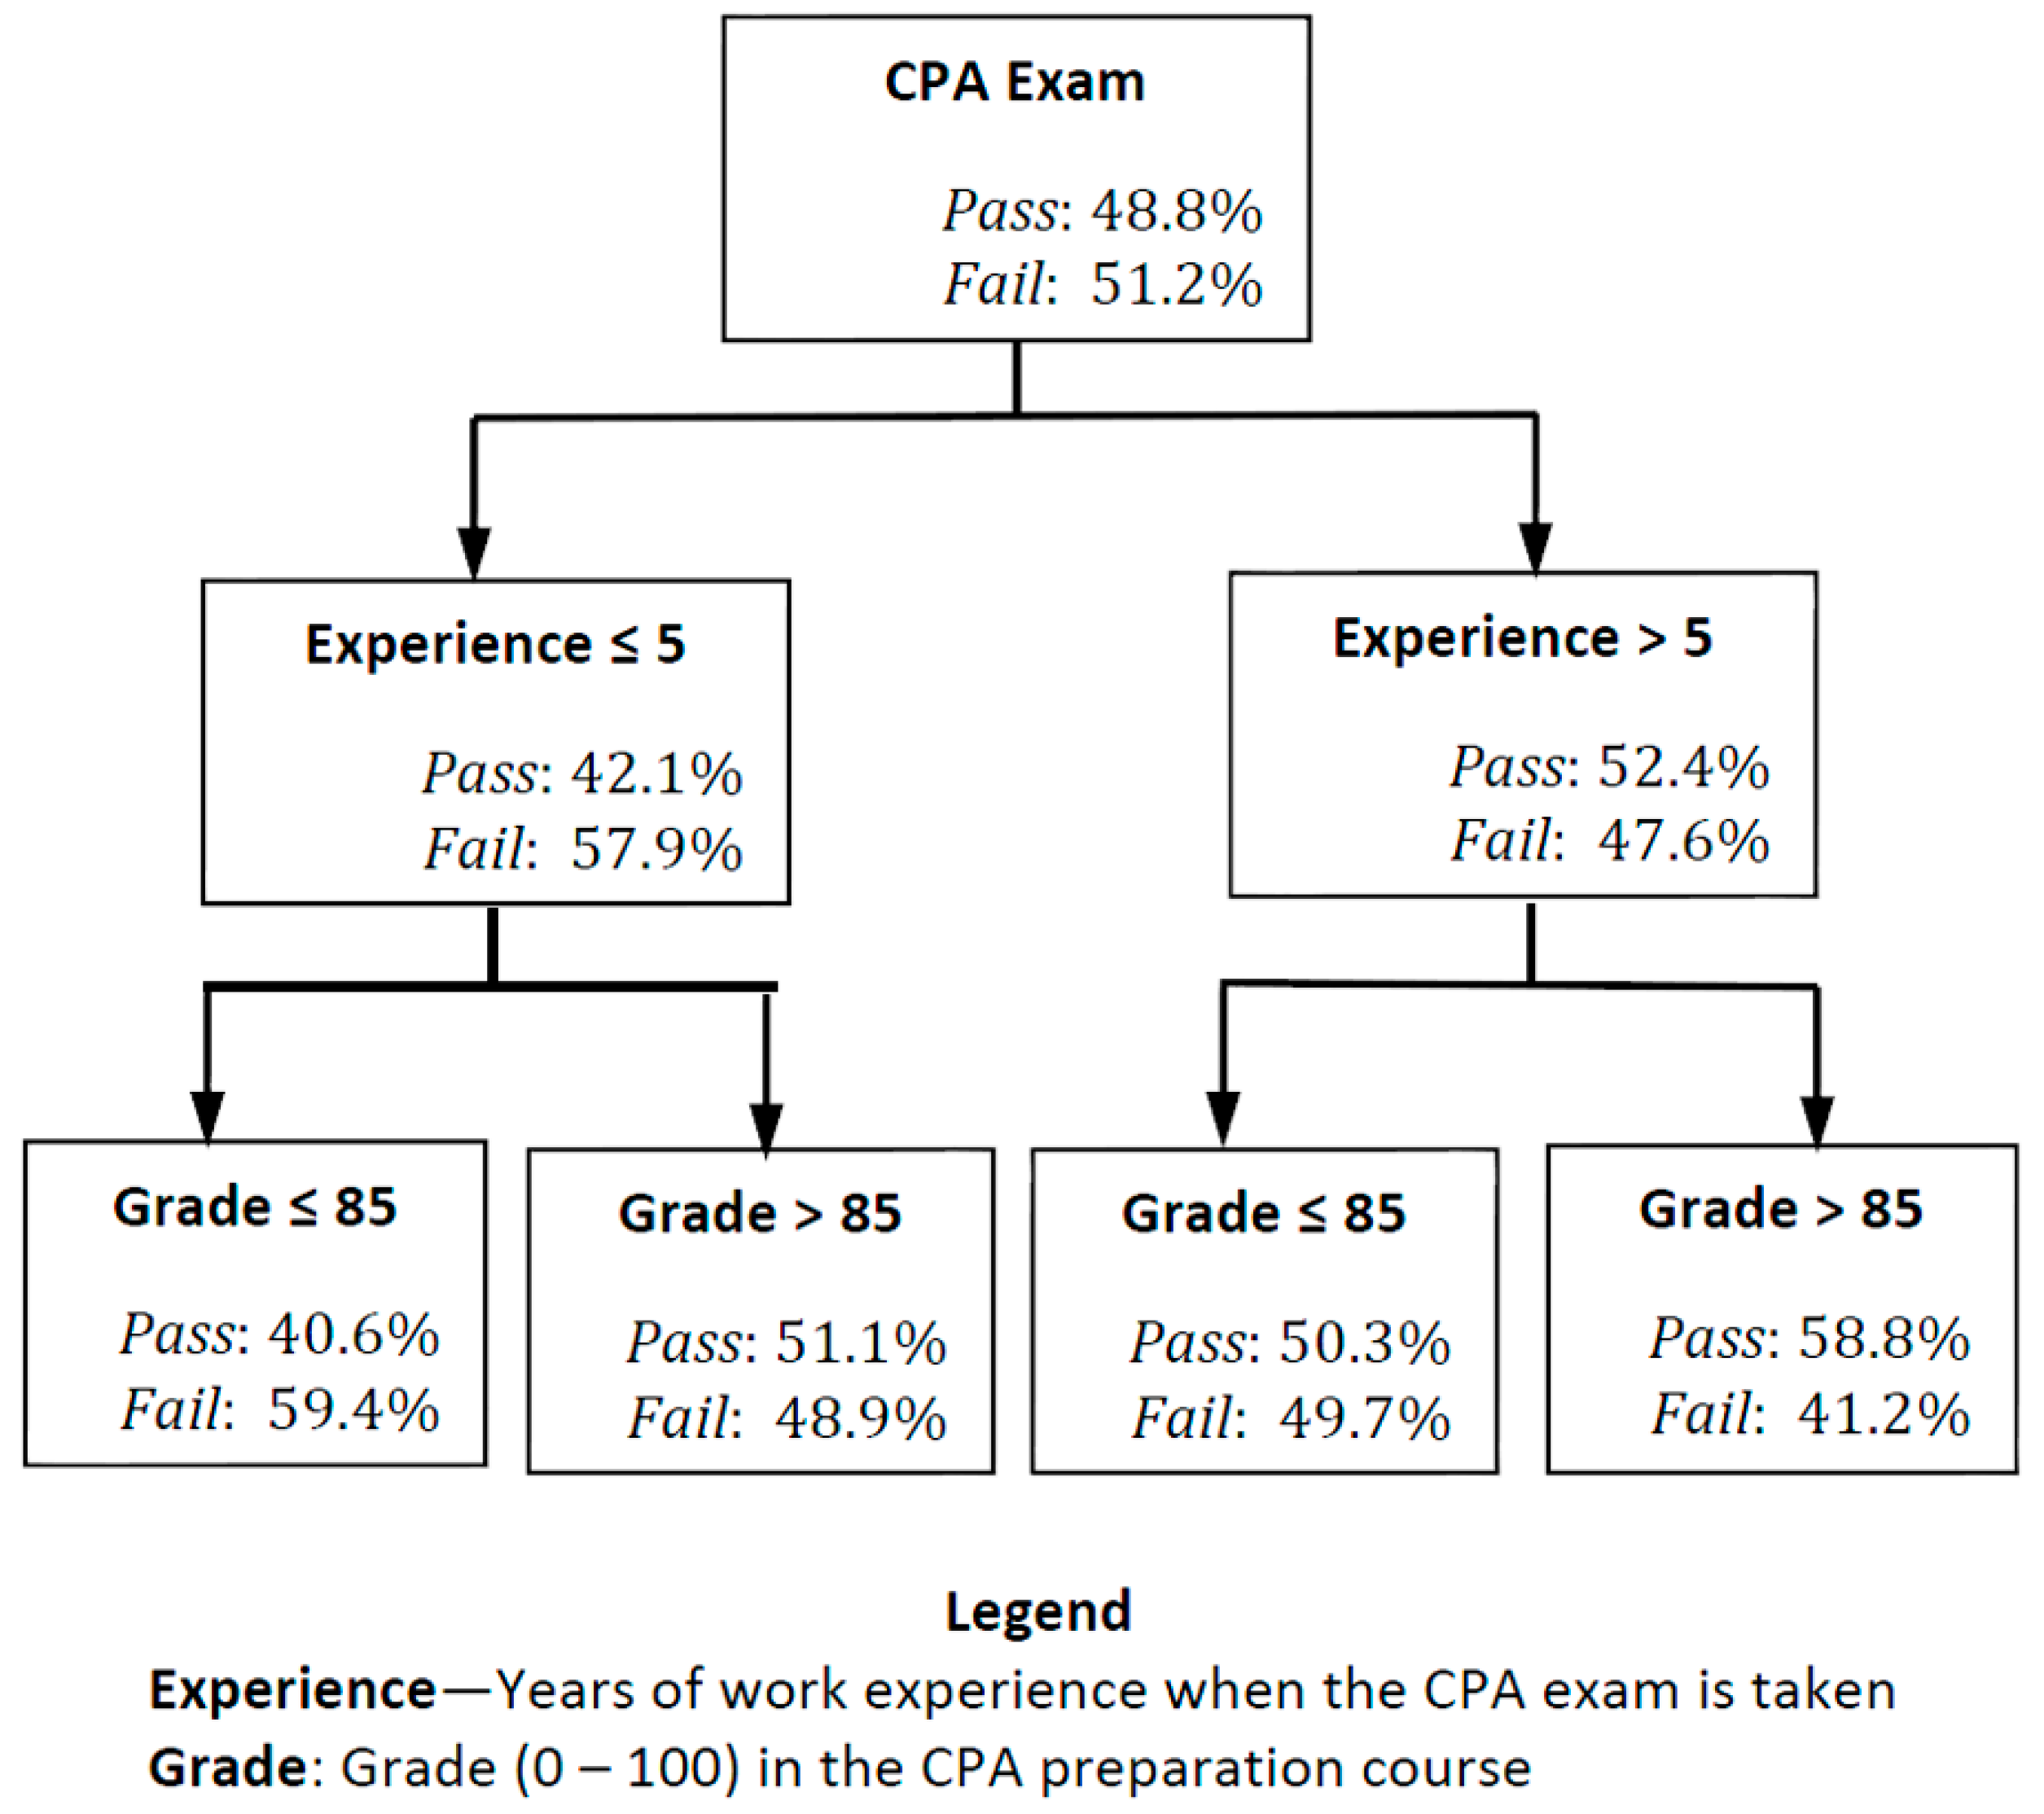
3.1.2. The Prediction Model

Data analysis begins with data preparation activities on the historical database. This includes things like addressing erroneous, missing, or miscoded values and fixing incompatible formats. Information technologists have many effective tools at their disposable for data cleansing. Even so, data preparation is widely recognized as the most time-consuming phase of a predictive modeling project. Linoff and Berry [34], for example, estimate that at least 80% of the total project time is often spent with data preparation; Walsh [36] recommends that 90% of project effort be set aside for data preparation.
Next comes the derivation of the model. Although there is no one path to model selection, typical steps include choice of methods (e.g., regression, regressions trees, or neural nets for numeric dependent variables or logistic regression/classification trees for categorical dependent variables), data transformations (e.g., logarithmic or z-score transformations, “flagging” variables), dimension reduction (e.g., principal components or combining variables algebraically), and variable selection. Model selection and testing is focused critically on out-of-sample prediction accuracy. Many fine texts in this area provide details for the interested reader [33,34,35,36].

3.1.3. The Prediction Formula or Algorithm

The prediction model produces a method for calculating predictions for each individual. Some prediction models use algebraic formulas for this purpose. Multiple linear regression, for example, links the input variables to the outcome variable via a linear equation such as the one shown in Figure 1: Y ^ = 614.8 + 22.8X2 − 0.09X15.
In other cases, the method for producing predictions is algorithmic. Consider the hypothetical case of an online course that prepares students for the CPA exam. Figure 2 shows a simplistic decision tree designed to predict the probability that a student will pass the CPA exam using two input variables: work experience and the final grade in the CPA preparatory course. The prediction algorithm in this case is:
  • If [Experience ≤ 5] and [Grade ≤ 85] then [Probability of Passing = 40.6%],
  • If [Experience ≤ 5] and [Grade > 85] then [Probability of Passing = 51.1%],
and so forth.
The prediction formula/algorithm is the output from the development phase of the project that then becomes the input for the next phase: the implementation stage.
Figure 2. Example of a decision tree.
Futureinternet 07 00170 g002

3.2. The Implementation Phase

The implementation phase of the system involves preparing a database of information about current students and using the dashboard to relay information to them. Figure 3 illustrates.
Figure 3. The implementation phase.
Futureinternet 07 00170 g003

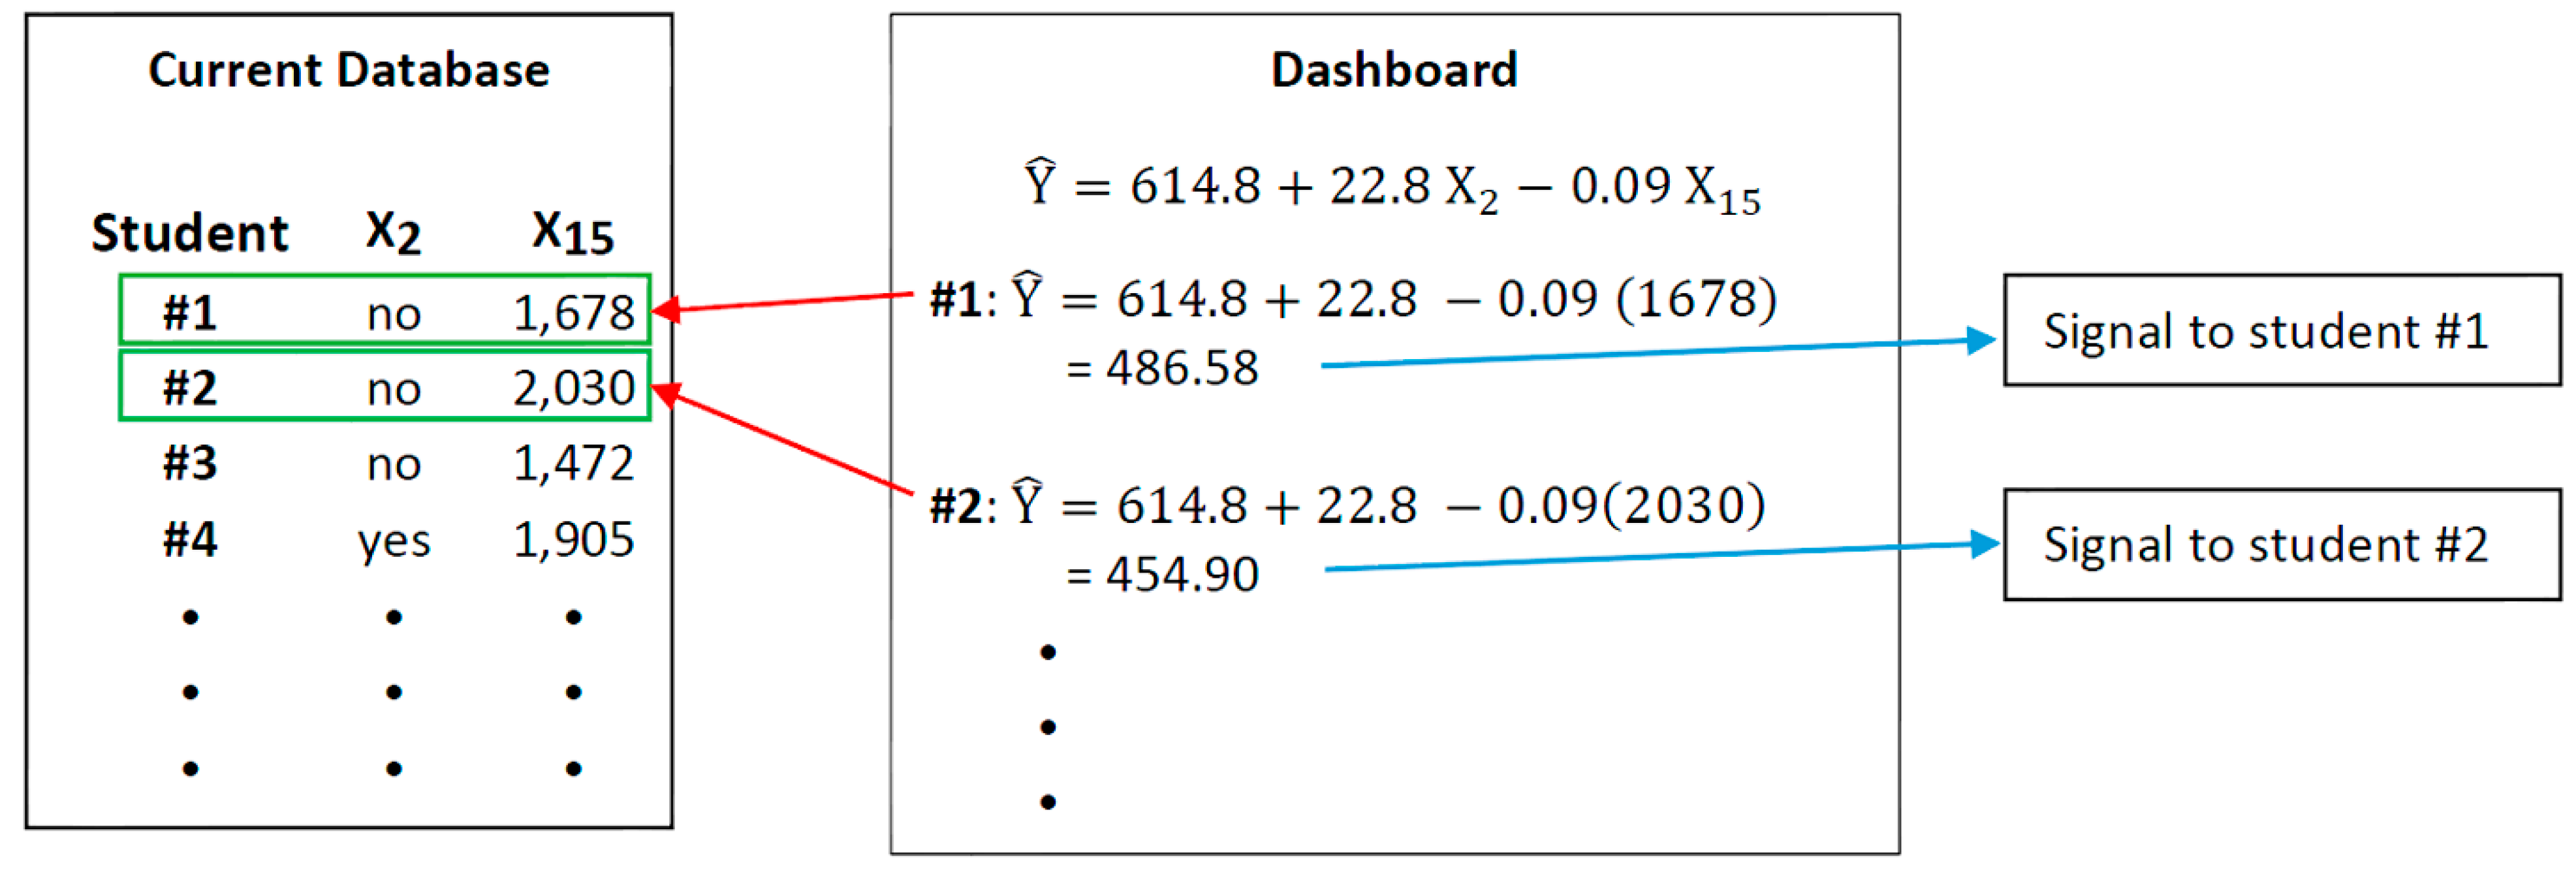
3.2.1. The Current Database

Each new course offering brings new students. The current database is populated with information about them. A current database differs from the historical database in several ways.
  • The current database does not contain a field for the dependent variable, since the purpose of the system is to estimate those unknown values for each current student; i.e., there is no column of numbers for the dependent variable in the current database in Figure 3.
  • The current database almost certainly contains fewer input variables than is found in the historical database because model derivation usually means variable elimination. The current database will include fields only for the variables used in the prediction formula or algorithm.
  • The current database contains different records—those characterizing the current students.
The current database need not be static. Information might be added to the current database as the course unfolds. For example, if a prediction formula includes information about performance on the second exam, that field can only be populated once students complete the exam.

3.2.2. The Dashboard

The prediction formula/algorithm from the prediction model could reside with the dashboard, which would interact with the current database, calculate predictions, and communicate them to the student. Figure 3 illustrates. The dashboard queries the current database to obtain values of the input variables for each student. It calculates predictions and then messages that information to each student. Alternatively, the predictions could be calculated and stored in the current database and the dashboard would be a conduit for relaying those predictions to students.
The type of information to be displayed necessarily influences the design of the dashboard. Figure 3, for example, illustrates a rudimentary situation in which one message is sent to each student. Ideally, multiple contacts will be made with each student throughout the term. Figure 4 illustrates a repeated-messaging system in which a student receives ongoing estimates of the probability of completing a certification course at six critical junctures throughout the course: in each of the first three discussions and in subsequent major assignments. A longitudinal display such as this might encourage students to understand more clearly how their efforts can impact final outcomes. The final probability is absent from Figure 4 because the student has not yet completed the final assignment; i.e., the dashboard display in Figure 4 is reactive. A more complex design would be both reactive and prospective. Figure 5, for example, plots changes in probabilities after each activity has been completed, but also estimates a range of outcomes on an upcoming assignment. Dashboard displays such as those in Figure 4 and Figure 5 could mean multiple prediction formulas, one for each of the different assignments in the course; i.e., dashboard complexity impacts project complexity.
The system as described here begins with the historical database and progresses to the eventual dashboard displays. In reality, the design of the system must work backwards; i.e., the information that is intended to be provided to students dictates the dashboard design, which impacts the variables needed in the current and historical databases.
Figure 4. An example of longitudinal, reactive messages.
Futureinternet 07 00170 g004
Figure 5. An example of reactive and proactive information.
Futureinternet 07 00170 g005

3.3. The Assessment Phase

Once implemented, we must strive to learn this: did the system work? Did it provide students with information that helped them succeed? For example,
  • Did students see the information? This relates to where the information is displayed in the LMS—on the home page, at the top of the grade book, within a pop-up window, via a link buried somewhere inside the course, or elsewhere.
  • Did students understand the information? If the messages are text-based, are they clearly worded? If graphical, is the presentation obvious to even untrained consumers?
  • Did students believe the information? Once students embrace the probabilistic nature of the information provided, they are then in the position to assess its credibility. Interested students might be referred to a description of the process by which the information is generated.
  • Did the students value the information? Did messages come too often or not often enough? Were students curious enough to return to longitudinal displays to track their progress?
To better understand these and other issues regarding the efficacy of the system, we should actively seek student feedback. That might include surveying course participants or creating threaded discussions targeted specifically to user reactions to the system. Communication between administrators, designers, and instructors of courses should also get us closer to understanding best practices. The work of Tanes, Arnold, King, and Remnet [37] might serve as a useful guide for program assessment.

4. Resource Implications

The eLearning messaging system envisioned here has fixed and variable costs. In the absence of significant population drift, the development phase illustrated in Figure 1 would be undertaken only once. Its costs include a database manager and an analyst familiar with predictive modeling, along with associated hardware and software. Another fixed cost is the design and development of the dashboard. (Of course, subsequent redesigns may be required and careful forethought would help minimize the need for redesign and redevelopment.) The variable costs include those needed to implement the signaling system for each new course offering: primarily, management of the current database (Figure 3).
The proposed system places value on accuracy of the information provided to students. That means, for example, that the numerical values displayed in Figure 4 or Figure 5 for one student may be quite different from those for another student even if both students have identical grades on the assignments. That’s because the prediction model incorporates more than just grades—it considers additional information about each student’s unique circumstances. The success of this microtargeting means balancing accuracy with costs. For any one situation, we cannot know how best to address those tradeoffs until we get more experience with building and implementing these kinds of systems. Even so, a start-simple approach seems advisable. Exactly what that means must depend on things like whether the course is for-credit, the course content, the degree to which non-completion is problematic, and available resources.
Those resources must be approved and committed by someone: usually an educational administrator or program director. Funding requests will more likely meet with success once administrators come to understand that the system has value to more than just students and instructors [38]. This system, for example, might be used to address things such as outcomes assessment (assurance of learning) often required by accrediting bodies. Equally important, the system provides documentation of steps taken to mitigate dropout rates or mediocre student performance. With this system, we might also get a sense of the characteristics of students likely to succeed in a course (or program, if instituted program-wide). Such information could help to determine which students should be accepted into programs and which might need remedial intervention. Put another way, the information produced by the messaging system might have widespread use to many constituents, all of whom could benefit in various ways.

5. Unresolved Issues and Future Research

Special challenges and opportunities arise as regards data collection. Many prevailing predictive modeling projects (e.g., customer relationship management and government profiling) acquire the needed data without the knowledge or consent of the targeted individual—perhaps from web-browsing, credit card, and social media activity, scanner data, facial recognition systems, or immigration registries. The eLearning system described here is quite different in that some level of student involvement with data collection is probably inevitable. Examples of student participation, ranked from least-intrusive to most-intrusive, follow.
  • No student involvement. Many universities have Institutional Review Boards or equivalents that will release legally-protected student information once it has been anonymized. That information might include things like age, ethnicity, prior academic performance, and financial status. That data source might be used for the historical database.
  • Minimal student involvement. Students might grant the release of legally-protected information. This would require, from students, nothing more than consent.
  • Moderate student involvement. Students might provide information about themselves that is not available from existing sources—e.g., whether the student is caring for aging parents or number of hours worked. This might require, from students, the completion of a survey.
  • Maximum student involvement. Students might actively seek out information about themselves that not even they know. For example, students might be asked to determine their personality type or learning styles using publicly-available online assessments such as the International Personality Item Pool (http://www.personal.psu.edu/~j5j/IPIP/) or the Felder-Soloman Index of Learning Styles (http://www.engr.ncsu.edu/learningstyles/ilsweb.html) [39,40,41]. In this scenario, students would complete the questionnaires online, receive the results, and report them to the instructor or database manager.
A recent study using predictive analytics in an educational setting found that even rudimentary demographic information about students was sufficient to produce a predictive model with high classification accuracy [25]. That work suggests that extensive student involvement in data collection might not be needed; we will learn more about the requisite level and amount of input information as work in this area unfolds.
In this messaging system there is an intricate interplay between data collection and accuracy—the degree to which messages are customized to each individual student. More student records and more information about each student mean richer databases and more accurate predictions; that, though, means student engagement. Student involvement might be encouraged via extra credit in for-credit courses. In some courses, having students learn about their personality types or learning styles might be a natural extension of the topical course coverage (perhaps in education, management, or psychology).
There is another possibility for data acquisition: requiring students to supply the needed information. Mandated disclosure of information might violate legal protections such as those covering federally-funded institutions of higher education. But what about MOOCs for which registration and participation in the course is voluntary? Might a condition of course registration include supplying personal information? What about training required as a condition of employment or advancement in a workplace setting? Like most new areas of the law, this unchartered legal territory is evolving. And, of course, participants might balk in the face of mandatory personal information or they may supply inaccurate information. Most likely, voluntary participation will generate higher-quality data and result in satisfied users. Assurances via privacy statements, and strict compliance with them, should also boost cooperation.
In spite of potential data collection barriers, it’s important to note that this application of predictive analytics is notably different from others in which subjects might not wish to be identified. It’s unlikely, for example, that terrorist suspects or people engaging in fraud will willingly provide data about themselves. Similarly, consumers who wish not to be bombarded with advertisement have little incentive to provide personal information. Here, though, the data collected from students will be used to help them succeed. A clear statement to this effect might go a long way toward encouraging students’ participation with data collection.
Although the system described here is rooted in statistical predictive models, there may also be a role for text mining. We imagine a situation in which text mining is used to evaluate a student’s remarks in a threaded discussion, for example. That information might then become one component of a more comprehensive assessment of student performance.
The messages generated by this system are intended to be probabilistic; they are estimates, not assurances, of outcomes. Students are familiar with the deterministic world of learning assessment; e.g., that a final weighted average between 89 and 92 will result in a course grade of A−. Here, students might be challenged by the more ambiguous nature of the probabilistic information provided. Consideration should be given to whether students could misinterpret estimates as guarantees. In designing the dashboard, the probabilistic nature of the information provided should be made clear via the wording, emphasis, or phrasing of a message or by including appropriate annotation to graphical displays.
Similarly, struggling students might use the information not as motivation to improve but as a reason to drop out. The hypothetical student depicted in Figure 4 has made positive progress throughout the term and has reacted as we might hope in response to the messaging system. Another student, though, might learn that efforts only result in declining estimates of success and become discouraged. For her, a proactive messaging system such as the one in Figure 5 might be critical to improving motivation. The dashboard might also be designed to alert instructors to those making little progress, thereby identifying students who might benefit from individual consultation.

6. Final Thoughts

How many times have we, as instructors, been asked of struggling or prospective students to project outcomes? “Will I be able to pass this course? My math skills are weak…” “I need to be absent from class for two weeks for employment training. How will that impact my performance on the upcoming exam?” And how often do our responses come up short because we understand the wide variation in individual performance? The best answer to questions like these is often “it depends…” As human computing machines, we are woefully ill-equipped to understand and quantify future outcomes in a complex, multivariate environment. We now have at our disposal a method to help answer those kinds of questions. A predictive modeling approach, with its focus on microtargeting individual students, should be a useful addition to our arsenal of tools to help students succeed.

Acknowledgments

The author thanks Heidi Boerstler for her valuable input.

Conflicts of Interest

The author declares no conflict of interest.

References

  1. Hardesty, L. Lessons learned from MITx’s prototype course. MIT News. 2012. Available online: http://newsoffice.mit.edu/2012/mitx-edx-first-course-recap-0716 (accessed on 10 February 2015).
  2. Liyanagunawardena, T.R.; Adams, A.A.; Williams, S.A. MOOCs: A systematic study of the published literature 2008–2012. Int. Rev. Res. Open Distance Learn. 2013, 14, 202–227. [Google Scholar]
  3. Yang, D.; Sinha, T.; Adamson, D.; Rose, C.P. Turn on, tune in, drop out: Anticipating student dropouts in massive open online courses. In Proceedings of the 2013 NIPS Data-Driven Education Workshop, Lake Tahoe, NV, USA, 9–10 December 2013; Available online: http://lytics.stanford.edu/datadriveneducation/papers/yangetal.pdf (accessed on 9 February 2015).
  4. Ho, A.D.; Reich, J.; Nesterko, S.; Seaton, D.T.; Mullaney, T.; Waldo, J.; Chaung, I. HarvardX and MITx: The First Year of Open Online Courses. HarvardX and MITx Working Paper No. 1. Available online: http://dx.doi.org/10.2139/ssrn.2381263 (accessed on 27 May 2015).
  5. Liyanagunawardena, T.R.; Parslow, P.; Williams, S.A. Dropout: MOOC participants’ perspective. In Proceedings of the European MOOC Stakeholder’s Summit 2014, Lausanne, Switzerland, 10–12 February 2014.
  6. Rosen, R.J. Overblown-Claims-of-Failure Watch: How not to gauge the success of online courses. Available online: http://www.theatlantic.com/technology/archive/2012/07/overblown-claims-of-failure-watch-how-not-to-gauge-the-success-of-online-courses/260159/ (accessed on 18 May 2015).
  7. Daniel, J. Making Sense of MOOCs: Musings in a Maze of Myth, Paradox and Possibility. J. Interact. Med. Educ. 2012, 3. [Google Scholar] [CrossRef]
  8. Levy, Y. Comparing dropouts and persistence in e-learning courses. Comput. Educ. 2007, 48, 185–204. [Google Scholar] [CrossRef]
  9. Brady, L. Fault lines in the terrain of distance education. Comput. Compos. 2001, 18, 347–358. [Google Scholar] [CrossRef]
  10. Carr, S. As distance education comes of age, the challenge is keeping the students. Available online: http://chronicle.com/article/As-Distance-Education-Comes-of/14334 (accessed on 30 January 2015).
  11. Parker, A. A study of variables that predict dropout from distance educations. Int. J. Educ. Technol. 1999, 2. Available online: http://education.illinois.edu/ijet/v1n2/parker/index.html (accessed on 28 January 2015). [Google Scholar]
  12. Jaggars, S.S.; Edgecombe, N.; Stacey, G.W. What We Know about Online Course Outcomes. Research Overview, Community College Research Center, Teachers College, Columbia University: New York, USA, April 2013. Available online: http://ccrc.tc.columbia.edu/publications/what-we-know-online-course-outcomes.html (accessed on 28 January 2015).
  13. Boettcher, J.V. Online Course Development: What Does It Cost? Campus Technol. 2004. Available online: http://campustechnology.com/Articles/2004/06/Online-Course-Development-What-Does-It-Cost.aspx?aid=39863&Page=1 (accessed on 29 January 2015). [Google Scholar]
  14. Jewett, F. A framework for the comparative analysis of the costs of classroom instruction. In Dollars, Distance, and Online Education: The New Economics of College Teaching and Learning; Finkelstein, M.J., Frances, C., Jewett, F.I., Scholz, B.W., Eds.; Oryx Press: Phoenix, AZ, USA, 2000; pp. 85–122. [Google Scholar]
  15. Young, J.R. Inside the Coursera contract: How an upstart company might profit from free courses. Chron. High. Educ. 2012. Available online: http://chronicle.com/article/How-an-Upstart-Company-Might/133065/?cid=at&utm_source=at&utm_medium=en (accessed on 1 February 2015). [Google Scholar]
  16. Campaign for the Future of Higher Education. The “Promises” of Online Education: Reducing Costs. CFHE Working Paper, Posted 16 October 2013. Available online: http://futureofhighered.org/wp-content/uploads/2013/10/Promises-of-Online-Higher-Ed-Reducing-Costs1.pdf (accessed on 1 February 2015).
  17. Kay, J.; Reimann, P.; Diebold, E.; Kummerfeld, B. MOOCs: So many learners, so much potential. IEEE Intell. Syst. 2013, 28, 70–77. [Google Scholar] [CrossRef]
  18. Subban, P. Differentiated instruction: A research basis. Int. Educ. J. 2006, 7, 935–947. [Google Scholar]
  19. Siefert, J.W. Data mining and homeland security: An overview. Congressional Research Service Report for Congress. Report #31798. 5 June 2007. Available online: https://epic.org/privacy/fusion/crs-dataminingrpt.pdf (accessed on 19 February 2015).
  20. Rygielski, C.; Wang, J.-C.; Yen, D.C. Data mining techniques for customer relationship management. Technol. Soc. 2002, 24, 483–502. [Google Scholar] [CrossRef]
  21. Nichols, J. Not Just the NSA: Politicians are Data Mining the American Electorate. Nation 2013. Available online: http://www.thenation.com/blog/174759/not-just-nsa-politicians-are-data-mining-american-electorate (accessed on 21 February 2015). [Google Scholar]
  22. Romero, C.; Ventura, S. Educational data mining: A review of the state of the art. IEEE Trans. Syst. Man Cybern. Part C: Appl. Rev. 2010, 40, 601–618. [Google Scholar] [CrossRef]
  23. Arnold, K. Signals: Applying academic analytics. Available online: http://www.educause.edu/ero/article/signals-applying-academic-analytics (accessed on 27 May 2015).
  24. Lieblein, E. Critical factors for successful delivery of online programs. Internet High. Educ. 2000, 3, 161–174. [Google Scholar] [CrossRef]
  25. Smith, M.A.; Kellogg, D.L. Required collaborative work in online courses: A predictive modeling approach. Decis. Sci. J. Innov. Educ. 2015, in press. [Google Scholar]
  26. Pappano, L. The Year of the MOOC. The New York Times. 2012. Available online: http://edinaschools.org/cms/lib07/MN01909547/Centricity/Domain/272/The%20Year%20of%20the%20MOOC%20NY%20Times.pdf (accessed on 4 February 2015).
  27. Bali, M. MOOC pedagogy: Gleaning good practice from existing MOOCs. MERLOT J. Online Learn. Teach. 2014, 10. Available online: http://jolt.merlot.org/vol10no1/bali_0314.pdf (accessed on 3 February 2015). [Google Scholar]
  28. Ertmer, P.A.; Richardson, J.C.; Belland, B.; Camin, D. Using peer feedback to enhance the quality of student online postings: An exploratory study. J. Comput.-Med. Commun. 2007, 12, 412–433. [Google Scholar] [CrossRef]
  29. Shmueli, G. To explain or to predict? Stat. Sci. 2010, 25, 289–310. [Google Scholar] [CrossRef]
  30. Shmueli, G.; Koppius, O.R. Predictive analytics in information systems research. MIS Q. 2011, 35, 553–572. [Google Scholar] [CrossRef]
  31. Sawyer, A.G.; Peter, J.P. The significance of statistical significance tests in marketing research. J. Mark. Res. 1983, 20, 122–133. [Google Scholar] [CrossRef]
  32. Lin, M.; Lucas, H.C.; Shmueli, G. Research commentary—Too big to fail: Large samples and the p-value problem. Inf. Syst. Res. 2013, 24, 906–917. [Google Scholar] [CrossRef]
  33. Hand, D.J.; Manilla, H.; Smyth, P. Principles of Data Mining; The MIT Press: Cambridge, MA, USA, 2001. [Google Scholar]
  34. Linoff, G.S.; Berry, M.J.A. Data Mining Techniques for Marketing, Sales, and Customer Relationship Management, 3rd ed.; Wiley: Indianapolis, IN, USA, 2011. [Google Scholar]
  35. Shmueli, G.; Patel, N.R.; Bruce, P.C. Data Mining for Business Intelligence: Concepts, Techniques, and Applications, 2nd ed.; Wiley: Hoboken, NJ, USA, 2010. [Google Scholar]
  36. Walsh, S. Applying Data Mining Techniques Using SAS Enterprise Miner; SAS Publishing: Cary, NC, USA, 2005. [Google Scholar]
  37. Tanes, Z.; Arnold, K.E.; King, A.S.; Remnet, M.A. Using Signals for appropriate feedback: Perceptions and practices. Comput. Educ. 2011, 57, 2414–2422. [Google Scholar] [CrossRef]
  38. Arnold, K.E.; Tanes, Z.; King, A.S. Administrative perspectives of data-mining software signals: Promoting student success and retention. J. Acad. Adm. High. Educ. 2010, 6, 29–39. [Google Scholar]
  39. Felder, R.M. Learning and teaching styles in engineering education. Eng. Educ. 1988, 78, 674–681. [Google Scholar]
  40. Gow, A.J.; Whiteman, M.C.; Pattie, A.; Deary, I.J. Goldberg’s “IPIP” big-five factor markers: Internal consistency and concurrent validation in Scotland. Personal. Individ. Differ. 2005, 39, 317–329. [Google Scholar] [CrossRef]
  41. Socha, A.; Cooper, C.A.; McCord, D.M. Confirmatory factor analysis of the M5–50: An implementation of the International Personality Item Pool Set. Psychol. Assess. 2010, 22, 43–49. [Google Scholar] [CrossRef] [PubMed]

