
Dynamis: Effective Context-Aware Web Service Selection Using Dynamic Attributes

Abstract
:1. Introduction
2. Background
2.1. Aggregation
2.2. Skyline
3. Motivation

| Telescope | Context/QoS attributes | Days | |||
|---|---|---|---|---|---|
| 1 | 2 | 3 | 4 | ||
| T1 | functional | Y | Y | Y | Y |
| availability (%) | 20 | 40 | 50 | 60 | |
| user preference/contrast | 8 | 9 | 8 | 5 | |
| time/dayLight | 8 | 9 | 5 | ||
| user preference/composition | 8 | 5 | |||
| latency (ms) | 6 | 2 | 3 | ||
| weather/visibility (%) | 70 | 90 | 90 | 80 | |
| location/viewing angle | 8 | 8 | 4 | 5 | |
| T2 | functional | Y | Y | Y | Y |
| availability | 85 | 93 | 65 | 89 | |
| user preference/contrast | 8 | 9 | 4 | 5 | |
| time/daylight | 8 | 9 | 5 | 5 | |
| composition | 8 | 9 | 9 | 5 | |
| latency | 9 | 8 | 9 | ||
| weather/visibility | 90 | 80 | 80 | 90 | |
| location/viewing angle | 8 | 6 | 8 | ||
| T3 | functional | Y | Y | Y | Y |
| availability | 30 | 60 | 30 | 60 | |
| user preference/contrast | 8 | 9 | 4 | 1 | |
| time/daylight | 8 | 9 | 1 | ||
| composition | 8 | 3 | |||
| latency | 5 | 7 | 4 | 1 | |
| weather/visibility | 70 | 70 | 50 | ||
| location/viewing angle | 8 | 9 | 9 | 9 | |
3.1. Manifestation of the Challenges
4. Related Work
5. Dynamis Service Selection
5.1. Dynamis: Histogram, ART, Top k and Skyline
| Algorithm 1 Dynamis aggregation. |
|
| Algorithm 2 Dynamis skyline. |
|
6. Evaluation
6.1. Evaluation Setup
6.1.1. Scoring and Ranking


| Rank | Ticker | Company |
|---|---|---|
| 1 | CF | CF Industries Holdings, Inc. |
| 2 | RRC | Range Resources Corp. |
| 3 | RHT | Red Hat, Inc. |
| 4 | TLAB | Tellabs, Inc. |
| 5 | NVDA | NVIDIA Corporation |
| 6 | GT | The Goodyear Tire & Rubber Company |
| 7 | JWN | Nordstrom, Inc. |
| 8 | SNDK | SanDisk Corporation |
| 9 | CTXS | Citrix Systems, Inc. |
| 10 | PFG | Principal Financial Group Inc. |


6.1.2. Skyline
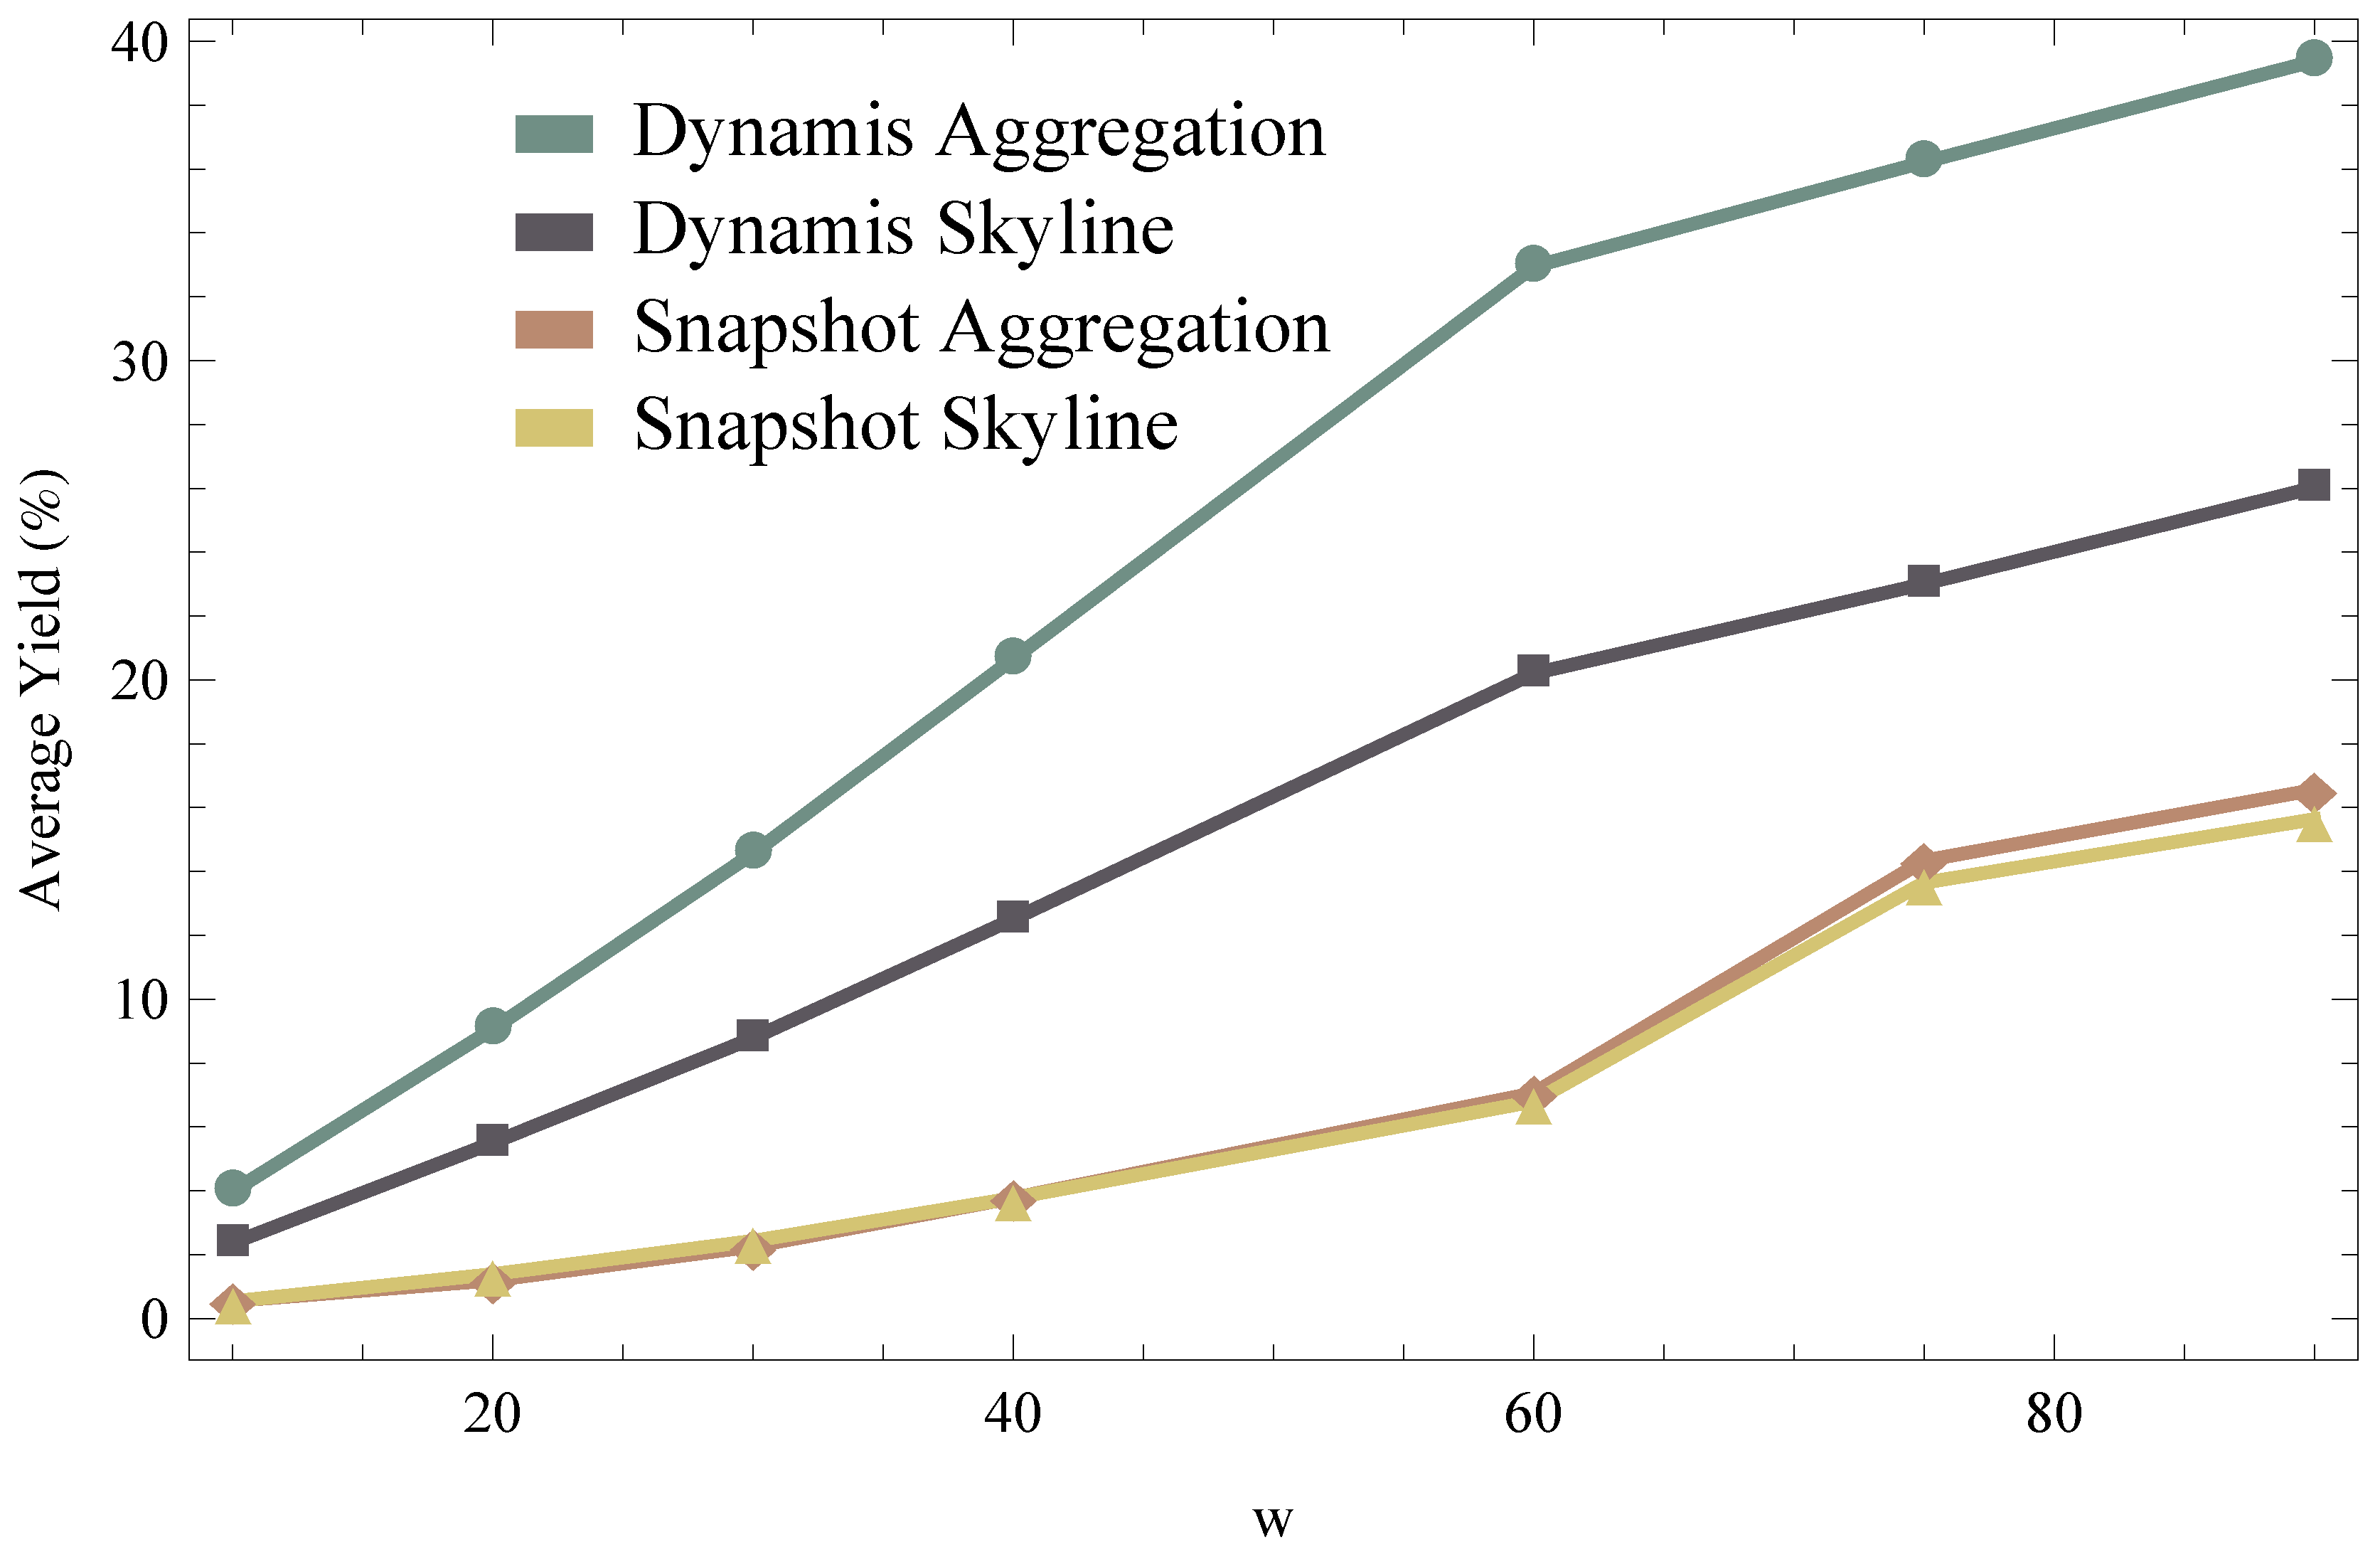
6.2. Results


- L-SAgg using
- L-SSkyline using
- L-DAgg using
- L-DSkyline using


6.3. Generalization of Results

7. Discussion
8. Conclusions
Acknowledgments
Author Contributions
Conflicts of Interest
References
- Fenza, G.; Furno, D.; Loia, V. Hybrid Approach for Context-Aware Service Discovery in Healthcare Domain. J. Comput. Syst. Sci. 2012, 78, 1232–1247. [Google Scholar] [CrossRef]
- Sousa, M.; Lopes, W.; Madeiro, F.; Alencar, M. Cognitive LF-Ant: A Novel Protocol for Healthcare Wireless Sensor Networks. Sensors 2012, 12, 10463–10486. [Google Scholar] [PubMed]
- Castells, P.; Fernandez, M.; Vallet, D. An Adaptation of the Vector-Space Model for Ontology-Based Information Retrieval. IEEE Trans. Knowl. Data Eng. (KDE) 2007, 19, 261–272. [Google Scholar] [CrossRef]
- Crasso, M.; Zunino, A.; Campo, M. Easy Web Service Discovery: A Query-by-Example Approach. Sci. Comput. Program. 2008, 71, 144–164. [Google Scholar] [CrossRef]
- Lee, D.L.; Chuang, H.; Seamons, K.E. Document Ranking and the Vector Space Model. IEEE Softw. 1997, 14, 67–75. [Google Scholar] [CrossRef]
- Verma, K.; Sivashanmugam, K.; Sheth, A.; Patil, A.; Oundhakar, S.; Miller, J. METEOR-S WSDI: A Scalable Infrastructure of Registries for Semantic Publication and Discovery of Web Services. J. Inf. Technol. Manag. Spec. Issue Univers. Glob. Integr. (IJITM) 2005, 6, 17–39. [Google Scholar] [CrossRef]
- Chen, I.; Yang, S.; Zhang, J. Ubiquitous Provision of Context Aware Web Services. In Proceedings of the 2006 IEEE International Conference on Services Computing (SCC ’06), Chicago, IL, USA, 18–22 September 2006; pp. 60–68.
- De Almeida, D.; de Souza Baptista, C.; da Silva, E.; Campelo, C.; de Figueiredo, H.; Lacerda, Y. A Context-Aware System Based on Service-Oriented Architecture. In Proceedings of the 20th International Conference on Advanced Information Networking and Applications, 2006 (AINA 2006), Vienna, Austria, 18–20 April 2006; Volume 1.
- Truong, H.L.; Dustdar, S. A Survey on Context-Aware Web Service Systems. Int. J. Ad Hoc Ubiquitous Comput. (IJAHUC) 2009, 5, 5–31. [Google Scholar] [CrossRef]
- Fagin, R.; Lotem, A.; Naor, M. Optimal Aggregation Algorithms for Middleware. In Proceedings of the 20th ACM Symposium on Principles of Database Systems (PODS); ACM: New York, NY, USA, 2001; pp. 102–113. [Google Scholar]
- Tian, X.; Zhang, D.; Tao, Y. On Skyline with Flexible Dominance Relation. In Proceedings of the 24th International Conference on Data Engineering (ICDE), Cancun, Mexico, 7–12 April 2008; pp. 1397–1399.
- Borzonyi, S.; Kossmann, D.; Stocker, K. The Skyline Operator. In Proceedings of the 17th International Conference on Data Engineering (ICDE), Heidelberg, Germany, 2–6 April 2001; Volume 3, pp. 421–430.
- Ilyas, I.F.; Beskales, G.; Soliman, M.A. A Survey of Top-k Query Processing Techniques in Relational Database Systems. ACM Comput. Surv. 2008, 40, 11. [Google Scholar] [CrossRef]
- Skoutas, D.; Sacharidis, D.; Simitsis, A.; Kantere, V.; Sellis, T. Top-k Dominant Web Services under Multi-Criteria Matching. In Proceedings of the 12th International Conference on Extending Database Technology (EDBT), Saint-Petersburg, Russia, 24–26 March 2009; pp. 898–909.
- Kritikos, K.; Pernici, B.; Plebani, P.; Cappiello, C.; Comuzzi, M.; Benbernou, S.; Brandic, I.; Kertész, A.; Parkin, M.; Carro, M. A Survey on Service Quality Description. ACM Comput. Surv. 2013, 46, 1:1–1:58. [Google Scholar] [CrossRef] [Green Version]
- Kritikos, K.; Plexousakis, D. Towards Optimal and Scalable Non-Functional Service Matchmaking Techniques. In Proceedings of the 2012 IEEE 19th International Conference on Web Services (ICWS), Honolulu, HI, USA, 24–29 June 2012; pp. 327–335.
- Kyriakos, K.; Dimitris, D. Requirements for QoS-based Web Service Description and Discovery. In IEEE Transactions on Services Computing (TSC); IEEE Computer Society: Los Alamitos, CA, USA, 2009; Volume 2, pp. 320–337. [Google Scholar]
- El Hadad, J.; Manouvrier, M.; Rukoz, M. TQoS: Transactional and QoS-Aware Selection Algorithm for Automatic Web Service Composition. Trans. Serv. Comput. (TSC) 2010, 3, 73–85. [Google Scholar] [CrossRef]
- Benouaret, K.; Benslimane, D.; Hadjali, A. Selecting Skyline Web Services from Uncertain QoS. In Proceedings of the 9th International Conference on Services Computing (SCC), Honolulu, HI, USA, 24–29 June 2012; pp. 523–530.
- Leitner, P.; Rosenberg, F.; Michlmayr, A.; Dustdar, S. Towards a Flexible Mediation Framework for Dynamic Service Invocations. In Proceedings of the 6th IEEE European Conference on Web Services (ECOWS), Dublin, Ireland, 12 November 2008; pp. 45–59.
- Michlmayr, A.; Rosenberg, F.; Leitner, P.; Dustdar, S. End-to-End Support for QoS-Aware Service Selection, Binding, and Mediation in VRESCo. IEEE Trans. Serv. Comput. (TSC) 2010, 3, 193–205. [Google Scholar] [CrossRef]
- Vu, L.H.; Aberer, K. Towards Probabilistic Estimation of Quality of Online Services. In Proceedings of the 2009 IEEE International Conference on Web Services (ICWS), Los Angeles, CA, USA, 6–10 July 2009; pp. 99–106.
- Doshi, P.; Paradesi, S.; Swaika, S. Integrating Behavioral Trust in Web Service Compositions. In Proceedings of the 2009 IEEE International Conference on Web Services (ICWS), Los Angeles, CA, USA, 6–10 July 2009; pp. 453–460.
- Pahlevan, A.; Müller, H.A.; Cheng, M. A Dynamic Framework for Quality Web Service Discovery. In Proceedings of the 4th International Workshop on a Research Agenda for Maintenance and Evolution of Service-Oriented Systems (MESOA); SEI Press: Pittsburgh, PA, USA, 2010. [Google Scholar]
- Pahlevan, A.; Müller, H.A. Static-Discovery Dynamic-Selection (SDDS) Approach to Web Service Discovery. In Proceedings of the 3rd International Workshop on a Research Agenda for Maintenance and Evolution of Service-Oriented Systems (MESOA), Edmonton, BC, Canada, 21 September 2009; pp. 769–772.
- Pahlevan, A.; Müller, H.A. Self-Adaptive Management of Web Service Discovery. In Proceedings of the Doctoral Symposium 8th IEEE European Conference on Web Services (ECOWS), Ayia Napa, Cyprus, 1–3 December 2010; pp. 21–24.
- Pahlevan, A.; Chester, S.; Thomo, A.; Müller, H.A. On Supporting Dynamic Web Service Selection with Histogramming. In Proceedings of the International Workshop on the Maintenance and Evolution of Service-Oriented and Cloud-based Systems (MESOCA), Williamsburg, VA, USA, 26–26 September 2011; pp. 1–8.
- Pahlevan, A. Dynamic Web Service Discovery. Ph.D. Thesis, Department of Computer Science, University of Victoria, Victoria, BC, Canada, January 2013. [Google Scholar]
- Huang, J.; Ding, D.; Wang, G.; Xin, J. Tuning the Cardinality of Skyline. In Advanced Web and Network Technologies and Applications; Ishikawa, Y., He, J., Eds.; Springer-Verlag: Berlin, Germany, 2008; pp. 220–231. [Google Scholar]
- Tsetsos, V.; Anagnostopoulos, C.; Hadjiefthymiades, S. On the Evaluation of Semantic Web Service Matchmaking Systems. In Proceedings of the 4th European Conference on Web Services (ECOWS), Zurich, Switzerland, 4–6 December 2006; pp. 255–264.
- Lee, D.; Kwon, J.; Yang, S.; Lee, S. Improvement of the Recall and the Precision for Semantic Web Services Search. In Proceedings of the 6th IEEE/ACIS International Conference on Computer and Information Science (ICIS), Melbourne, QLD, Australia, 11–13 July 2007; pp. 763–768.
- Hao, Y.; Zhang, Y. Web Services Discovery based on Schema Matching. In Proceedings of the 30th Australasian Computer Science Conference (ACSC); Australian Computer Society, Inc.: Sydney, Australia, 2007; Volume 62, pp. 107–113. [Google Scholar]
- Segev, A.; Toch, E. Context-based Matching and Ranking of Web Services for Composition. IEEE Trans. Serv. Comput. (TSC) 2009, 2, 210–222. [Google Scholar] [CrossRef]
- Wang, Y.; Stroulia, E. Flexible Interface Matching for Web-Service Discovery. In Proceedings of the 4th International Conference on Web Information Systems Engineering (WISE), Rome, Italy, 13 December 2003; pp. 147–156.
- Stroulia, E.; Wang, Y. Structural and Semantic Matching for Assessing Web-Service Similarity. Int. J. Coop. Inf. Syst. (IJCIS) 2005, 14, 407–437. [Google Scholar] [CrossRef]
- Saracevic, T. Effects of Inc.onsistent Relevance Judgments on Information Retrieval Test Results: A Historical Perspective. Libr. Trends 2008, 56, 763–783. [Google Scholar] [CrossRef]
- Küster, U.; König-Ries, B. Relevance Judgments for Web Services Retrieval—A Methodology and Test Collection for SWS Discovery Evaluation. In Proceedings of the 7th IEEE European Conference on Web Services (ECOWS), Eindhoven, The Netherlands, 9–11 November 2009; pp. 17–26.
- Küster, U.; König-Ries, B. Evaluating Semantic Web Service Matchmaking Effectiveness Based on Graded Relevance. In Proceedings of the 2nd International Workshop on Service Matchmaking and Resource Retrieval in the Semantic Web (SMR) at the 7th International Semantic Web Conference (ISWC), Congress Center, Karlsruhe, Germany, 26–30 October 2008.
- Tsetsos, V.; Anagnostopoulos, C.; Hadjiefthymiades, S. On the Evaluation of Semantic Web Service Matchmaking Systems. In Proceedings of the 4th European Conference on Web Services (ECOWS), Zurich, Switzerland, 4–6 December 2006; pp. 255–264.
- Järvelin, K.; Kekäläinen, J. Cumulated Gain-based Evaluation of IR Techniques. ACM Trans. Inf. Syst. (TOIS) 2002, 20, 422–446. [Google Scholar] [CrossRef]
© 2015 by the authors; licensee MDPI, Basel, Switzerland. This article is an open access article distributed under the terms and conditions of the Creative Commons Attribution license (http://creativecommons.org/licenses/by/4.0/).
Share and Cite
Pahlevan, A.; Duprat, J.-L.; Thomo, A.; Müller, H. Dynamis: Effective Context-Aware Web Service Selection Using Dynamic Attributes. Future Internet 2015, 7, 110-139. https://doi.org/10.3390/fi7020110
Pahlevan A, Duprat J-L, Thomo A, Müller H. Dynamis: Effective Context-Aware Web Service Selection Using Dynamic Attributes. Future Internet. 2015; 7(2):110-139. https://doi.org/10.3390/fi7020110
Chicago/Turabian StylePahlevan, Atousa, Jean-Luc Duprat, Alex Thomo, and Hausi Müller. 2015. "Dynamis: Effective Context-Aware Web Service Selection Using Dynamic Attributes" Future Internet 7, no. 2: 110-139. https://doi.org/10.3390/fi7020110